

Abstract
Pain relievers containing N-acetyl-para-aminophenol, also called APAP, acetaminophen or paracetamol, in combination with opioid narcotics are top-selling pharmaceuticals in the U.S. Individuals who abuse these drugs for as little as sixty days can develop tinnitus and progressive bilateral sensorineural hearing loss. Recently published studies indicate that APAP and its metabolic product N-acetyl-p-benzoquinoneimine (NAPQI) are the primary ototoxic agents in this type of pain relievers. However, the mechanisms underlying the deleterious effects of these drugs on auditory cells remain to be fully characterized. In this study, we report cellular, genomic, and proteomic experiments revealing that cytotoxicity by APAP and NAPQI involves two different pathways in Immortomouse™-derived HEI-OC1 cells, implicating ROS overproduction, alterations in ER morphology, redistribution of intra-cisternal chaperones, activation of the eIF2α-CHOP pathway, as well as changes in ER stress and protein folding response markers. Thus, both oxidative and ER stress are part of the cellular and molecular mechanisms that contribute to the cytotoxic effects of APAP and NAPQI in these cells. We suggest that these in vitro findings should be taken into consideration when designing pharmacological strategies aimed at preventing the toxic effects of these drugs on the auditory system.
Keywords: Acetaminophen, NAPQI, cytotoxicity, HEI-OC1 cells, oxidative stress, Endoplasmic Reticulum stress
1. Introduction
APAP is a pro-drug metabolized by the cytochrome P450 2E1 isozyme (CYP2E1) to an electrophilic metabolite called N-acetyl-p-benzoquinoneimine (NAPQI). APAP hepatotoxicity has been known and investigated for over 50 years, and experiments performed in the 1970s’ suggested it was actually associated with covalent binding of NAPQI to tissue macromolecules (Bromer et al., 2003) (and references therein). Studies on the metabolic processing of these molecules revealed that only a small fraction (5%–10%) of a therapeutic dose of APAP is converted by CYP2E1 into NAPQI in humans, whereas the other 90% is excreted as conjugates of glucuronide and sulfate (Zimmerman, 1998). In addition, inside the cells NAPQI is usually inactivated by glutathione, though a plethora of studies have suggested that acute overdose may overwhelm glutathione stores and result in oxidative toxic effects to the liver (Hersh et al., 2007). Other studies, however, have provided plausible evidence that APAP, but not NAPQI, can kill hepatocytes through oxidative stress (Harman et al., 1991). Moreover, recent results suggested that glutathione depletion itself would be insufficient to provoke hepatocyte apoptosis suggesting that an APAP-induced intraluminal redox imbalance within the endoplasmic reticulum as the actual pro-apoptotic event (Nagy et al., 2007; Nagy et al., 2009).
In contrast to liver injury, APAP ototoxicity has been only recently recognized, eliciting significant attention by both the scientific and popular press (Blakley et al., 2008; Curhan et al., 2010; Curhan et al., 2012; Friedman et al., 2000; Ho et al., 2007; Oh et al., 2000; Rigby et al., 2008; Yorgason et al., 2010). Clinical evidence indicates that pharmaceutical formulations containing APAP, such as the APAP/hydrocodone compound Vicodin™, can cause deafness but no liver injury in long-term abusers who ingest 50 grams or more of this drug daily, an amount significantly higher than the known hepatotoxic doses (Yorgason et al., 2010). Thus, it is likely that ototoxicity resulting from acute APAP overdoses was masked because individuals were dying from liver failure before developing hearing loss. In contrast, protection against APAP hepatotoxicity in long-term abusers, which could potentially be provided either by hydrocodone or an adaptive response of the liver to increased doses of APAP (Bromer et al., 2003), would avoid premature death by liver failure and give enough time for ototoxicity to develop. After the initial studies reporting hearing loss caused by the abuse of analgesics containing APAP and hydrocodone, most research on the mechanisms underlying ototoxicity has focused on hydrocodone and/or its metabolite hydromorphone. However, studies in our laboratory have provided convincing evidence that APAP, but not hydrocodone, is the primary ototoxic agent, though the mechanisms of its deleterious effects remains unknown (Yorgason et al., 2010).
In a previous study we demonstrated, using neonatal mouse cochlear cultures and cells derived from Immortomouse™ organ of Corti (HEI-OC1), that outer hair cells (OHCs) were the major target of APAP toxicity in the organ of Corti, and that HEI-OC1 cells responded to APAP just like actual OHCs (Yorgason et al., 2010). Thus, the current study has been designed to elucidate the mechanisms of APAP and NAPQI cytotoxicity in auditory cells, using the HEI-OC1 cell line as an in vitro model. Accordingly, we have performed experiments aimed at defining changes in gene expression and protein levels in HEI-OC1 cells elicited by exposure to APAP or NAPQI. The results of these studies unravel that the toxic effects of APAP and NAPQI in HEI-OC1 cells follow two different mechanism involving the induction of both oxidative and endoplasmic reticulum (ER) stress. In addition, we provide markers for this phenomenon, which can be used in the future to design strategies to monitor the occurrence and severity of this toxic response. Altogether, these studies extend our current understanding of the mechanisms responsible for the cytotoxic effects caused by the abuse of this commonly used analgesic and, although the use of HEI-OC1 cells instead of actual cochlear hair cells limits the extrapolation of our results to the organ of Corti, we believe that these findings should be taken into consideration when designing pharmacological strategies aimed at preventing the toxic effects of these drugs on the auditory system.
2. Materials and Methods
2.1. Dose-response studies
Immortomouse™-derived HEI-OC1 cells were grown in plastic cell culture dishes at permissive conditions, 33 °C, 5% CO2 in DMEM supplemented with 10% FBS, as previously described (Kalinec et al., 2003). HEI-OC1 cells were first trypsinized, counted and concentration adjusted to 5.0 × 10⁵ cells/mL using Cellometer Auto T4 (Nexelcom Bioscience, Lawrence, MA). Next, cells were transferred to 48-well flat bottom plates (250 μL each well), incubated again at 33°C for 4 h, and then some of them exposed to differing concentrations of APAP (0.3, 0.6, 1.5, 3.75, 7.5 mg/mL) and NAPQI (30, 60, 150, 375, 750 μg/mL) (Sigma-Aldrich, Saint Louis, MO) whereas others were not exposed to any drug (Control). Direct cell count was performed at different time points (0, 24, and 48 h) using Celigo, an adherent cell cytometer (Cyntellect Inc., San Diego, CA).
2.2. MTT Assay
HEI-OC1 cells growing at permissive conditions were collected and concentration adjusted to 5.0 × 10⁵ cells/mL using Cellometer Auto T4 as described before. Next, cells were transferred to 96-well flat bottom plates (100 μL each well), incubated at 33°C overnight, and then exposed to 10 μM S600125 (JNK inhibitor, Sigma-Aldrich), 25, 50, 100 or 300 μM AEBSF (4-(2-Aminoethyl) benzenesulfonyl fluoride, inhibitor of the ATF6-mediated pathway, Sigma-Aldrich), or no drugs (Control) for an additional 2 h period. After this second incubation, cells were exposed to 1.5 mg/mL APAP, or 150 μg/mL NAPQI, and incubated for either 24 h or 48 h at 33°C. At these time points, the TACS® MTT Cell Proliferation Assay (Trevigen, Gaithersburg, MD) was used following manufacturer’s protocol to investigate cell viability. Absorbance was measured with Spectra Max 5 Plate Reader with Soft Max Pro 5.2 Software (Molecular Devices LLC, Sunnyvale, CA) and average OD in Control cells was taken as 100% of viability.
2.3. ROS determinations
To detect endogenous reactive oxygen species (ROS) production, 1 × 10⁵ HEI-OC1 cells/mL, both without treatment (Control) and treated for 1 min, 5 min, 10 min, 15 min, 30 min, 1 h, 6 h, 12 h, 24 h, and 48 h with APAP and NAPQI and then washed, were incubated with 5 μM 2,7-dichlorodihydrofluorescein diacetate acetyl ester (DCFH-DA, Sigma-Aldrich) for 15 min at 37 °C in the dark. In the presence of intracellular ROS, nonfluorescent membrane-permeable DCFH-DA is first deacetylated by cellular esterases and rapidly oxidized to impermeable and highly fluorescent 2,7-dichlorodihydrofluorescein (DCF). ROS production was thus monitored by measuring DCF emission at 530 nm with excitation at 485 nm using the Spectra Max 5 Plate Reader with Soft Max Pro 5.2 Software.
2.4. Western Blotting
Cells were lysed at 4°C in a 50 mM Tris buffer solution (pH 7.4) containing 1% Nonidet P-40, 2 mM EDTA, 100 mM NaCl, 1 mM vanadate, 10 μl/ml 0.1 M PMSF, 2 μl/ml 10 mg/ml leupeptin, and 2 μl/ml 10 mg/ml aprotinin. Samples were mixed with loading buffer (2 g of SDS/0.002 g of bromophenol blue/1.54 g of DTT/8 ml of 1 M Tris (pH 6.8)/10 ml of glycerol), heated at 95°C for 5 min, analyzed by SDS/PAGE gels (30 μg of protein per lane), transferred to nitrocellulose membranes, and incubated with primary antibodies at 1:100 to 1:500 dilutions and HRP-linked secondary antibodies at 1:1,500 to 1:5,000 dilutions in PBS for 2 h. The reaction was detected by ECL (Amersham Pharmacia) using peroxidase-labeled secondary antibodies. Except when indicated, all drugs were from Sigma-Aldrich.
2.5. RT-PCR and microarray studies
HEI-OC1 cells were cultured at permissive conditions in plastic cell culture dishes as described previously. Some cells were treated with 1.5 mg/mL APAP or 150 μg/mL NAPQI and others were not exposed to any drug (Control). After treatment, cells were incubated for either 24 h or 48 h at 33°C. At these time points, RNA was isolated with TRIzol® Reagent (Invitrogen, Carlsbad, CA) and cleaned using RNeasy Mini Kit (Qiagen, Valencia, CA) following manufacturer’s protocols. After cleaning, all the RNA sample concentrations were equalized to 2.5μg/μL and were used to synthesize cDNA using RT2 First Strand Kit (C-03) (SABiosciences, Frederick, MD) following the manufacturer’s protocol. A quantitative real-time PCR was performed using the synthesized cDNA and a 7900HT Fast RT- PCR system (Applied Biosystems, Carlsbad, CA). RT2 SYBR® Green (SABiosciences) qPCR mastermix was used to run the samples by following the manufacturer’s instructions. Each experimental condition was tested with RT2 Profiler PCR Arrays (SABiosciences) to analyze expression of a panel of genes associated with specific biological pathways. The PCR arrays used were PAMM-012 Mouse Apoptosis, PAMM-014 Mouse Signal Transduction Finder, and PAMM-019 Mouse Stress Response to Cellular Damage (SABiosciences). Data was analyzed using Ingenuity Pathway Analysis (IPA™, Ingenuity Systems/Qiagen, Redwood City, CA).
2.6. iTRAQ
HEI-OC1 cells were cultured at permissive conditions in plastic cell culture dishes as described previously. Cells untreated (Control) and treated with APAP (1.5 mg/mL) or NAPQI (150 μg/mL), were incubated for either 24 h or 48 h at 33°C. At these time points, the cells were collected using 1x PBS and centrifuged for 5 min at 78.4 × g. The supernatant was removed and the pellet was sent for iTRAQ analysis to the Keck Biotechnology Resources Laboratory, Yale School of Medicine, New Haven, CT. The results were analyzed using IPA™.
2.7. Confocal microscopy of HEI-OC1 cells
HEI-OC1 cells were fixed in 4% paraformaldehyde for 1 h at room temperature, washed with PBS 3 times for 5 min each, incubated 10 min with 0.001% Triton X-100 in PBS, and then in blocking solution (10% fish gelatin, Norland Inc., Cranbury, NJ) for 30 min. All the primary antibodies were used at 1:100 to 1:500 dilution in PBS in overnight incubations at 4°C. Rhodamine phalloidin from Molecular Probes-Invitrogen (Eugene, OR, USA), and DAPI from Sigma were used to stain actin and cell nuclei, respectively, and Alexa 488 (anti-goat and anti-rabbit) and Alexa 546 (anti rabbit) from Molecular Probes–Invitrogen were used as secondary antibodies at 1:200 dilution. Samples were observed with a TCS-SP5 Broadband Spectra laser confocal microscope with a 63x (NA=1.2) objective (Leica Microsystems, Deerfield, IL, USA). Images were cropped, resized, and brightness and contrast over the whole image adjusted where necessary, using Photoshop (Adobe Software).
2.8. Transmission electron microscopy of HEI-OC1 cells
Cells were washed once with 100 mM sodium cacodylate buffer (Electron Microscopy Sciences, EMS, Hatfield PA), and then fixed in a solution of 2.5% glutaraldehyde in 100mM sodium cacodylate buffer (EMS; pH 7.2). Fixed cells were centrifuged for 5 min and the pellet immersed in fresh fixative (2.5% glutaraldehyde in 100 mM sodium cacodylate buffer). After 2 h, the fixative was removed and pellet was left in 100 mM sodium cacodylate buffer overnight. The following day the buffer was discarded and the pellet washed with double-distilled H2O (ddH2O). The pellet was then incubated at room temperature in a 1% solution of osmium tetroxide (EMS) for 35 min, washed with ddH2O and dehydrated using 5 different concentrations (30, 50, 70, 95, and 100%) of ethanol (Pharmco-AAPER, Brookfield, CT) in an ascending order. The dehydrated pellet was then immersed in propylene oxide (EMS) and later left in a mixture of epoxy resin (EMBed-812, EMS) and propylene oxide (1:1) overnight. The next day, the 1:1 mixture of epoxy resin and propylene oxide was replaced with a 3:1 mixture. After 6 h, the 3:1 mixture of epoxy resin and propylene oxide was exchanged with only epoxy resin, and the samples were left in a rotating incubator overnight. Afterward, fresh epoxy resin plus an accelerator (BDMA, EMS) were added to the tubes containing the cells, and they were incubated for 1 h at room temperature. Finally, the cells along with the mixture of epoxy resin and accelerator were poured into plastic embedding molds and incubated at 60°C overnight. When blocks containing the cells were hardened, 70 nm sections were obtained using an EM UC7 ultra-microtome (Leica Microsystems, Buffalo Grove, IL) with a diamond knife (Diatome Ultra 45°, Fort Washington, PA). Sections were picked up with grids (EMS) and stained with 3% uranyl acetate for 4 min (SPI Supplies, West Chester, PA) and lead citrate for 30 s (EMS). Samples were examined with a Tecnai G2 20 Twin transmission electron microscope (FEI, Hillsboro, OR) at 80kv.
2.9. ATF4 knockdown
shRNA Lentiviral Particles, shRNA-ATF4 (sc35112VV) and shRNA Negative Control (sc-108080) were obtained from Santa Cruz Biotechnology (Santa Cruz, CA). HEI-OC1 cells were cultured in 12-well plates for 24 h prior to viral infection. Next day, with the cells approximately 50% confluent, the media was removed from plate wells and replaced with 1 mL of complete medium with Polybrene® (sc-134220) at a final concentration of 5 μg/mL. Cells were infected by adding the shRNA Lentiviral Particles, shRNA-ATF4 and shRNA Negative Control to the culture and incubating for 24 h. Next, the culture medium was removed and replaced with 1 mL of complete medium (without Polybrene®) and the cells were again incubated overnight. Stable clones expressing the shRNAs were selected via Puromycin dihydrochloride (sc-108071) selection at 3μg/mL. Finally, cells were exposed to APAP and NAPQI for 24 h or 48 h, and then collected and processed for WB, PCR, MTT and confocal microscopy.
2.10. Statistical analysis
Statistical analysis of the data, including One-way and Two-way ANOVA, was performed using JMP 9 software (SAS Institute, Cary, NC) and p ≤0.05 as the criterion for statistical significance.
3. Results
3.1. Oxidative Stress Contributes to the cytotoxic effects of APAP, but not NAPQI, on HEI-OC1 cells
To examine the cytotoxic effects of APAP and NAPQI, we treated HEI-OC1 cells with six different doses of these drugs and investigated dose-dependence by software-performed continuous counting of number of cells in culture plates. All NAPQI doses used in our studies were set at 10% of those of APAP, since it is well established that no more than 5–10% of APAP is metabolized into NAPQI (Bromer et al., 2003; Mikus et al., 2005). As shown in Fig. 1A, both APAP and NAPQI significantly decreased the number of cells in all the experimental conditions investigated. Exposure to APAP resulted in more pronounced effects than those observed with NAPQI, revealing that the toxic effects of this drug on cells from auditory lineage occur, at least in part, independently of its metabolite. The toxicity curves guided subsequent studies, which, accordingly, were performed using 1.5 mg/mL APAP and 0.15 mg/mL NAPQI, doses that consistently reduced the number of HEI-OC1 cells. Using these doses, we obtained similar results using a second, independent method for measuring cell viability, namely the MTT assay. As shown in Fig. 1B, both APAP and NAPQI significantly decreased viability of HEI-OC1 cells at 24 and 48 h respect to Control condition, but while APAP’s toxic effect was stronger than NAPQI’s effect at 24 h, no differences were observed at 48 h.
Fig. 1. Effects of APAP and NAPQI on viability of HEI-OC1 cells in culture.

A – Whereas Control cells doubled every 48 hours, direct cell count using an adherent cell cytometer indicated that exposure to APAP or NAPQI significantly decreased their numbers at 24 as well as 48 h. Except for the highest dose, APAP showed more cytotoxicity than NAPQI. B – MTT studies (n=3) confirmed a significant decrease in viability of cells exposed to APAP and NAPQI at both time points. Although APAP effect was stronger than NAPQI’s at 24 h (APAP = 59.4±0.4%, NAPQI = 73.4±0.4%, P≤0.0001*), no differences were evident at 48 h. (APAP = 41.3±0.4%, NAPQI = 41.0±0.4%, P=N.S.).
It has been suggested that the toxic effects of aminoglycoside antibiotics on auditory cells would be mediated by overproduction of ROS that cannot be neutralized by the natural anti-oxidant mechanisms (Forge and Schacht, 2000). Moreover, some of the work involving aminoglycosides describe ROS increasing within minutes to hours of exposure of chick hair cells to gentamicin in vitro (Hirose et al., 1997). Thus, we investigated whether the cytotoxic effects of APAP and NAPQI could also be associated with oxidative stress at time points ranging from 1 min to 48 h. As shown in Fig. 2, APAP significantly decreased ROS levels at short exposure times and then increased them, reaching Control values at the 6 h time-point and up to 4-fold higher for longer treatments. ROS levels in NAPQI-treated cells, in contrast, were always lower than in Control cells. These results suggest that APAP cytotoxic effects, but not those from NAPQI, would be mediated by oxidative injury.
Fig. 2. Effects of APAP and NAPQI on ROS levels in HEI-OC1 cells in culture.

Exposure to APAP for periods longer than 6 h induced a significant increase in ROS production in HEI-OC1 cells, whereas ROS levels in NAPQI-treated cells were always lower than in Control cells (At 1 min (n=3): Control = 100.0±1.9%; APAP = 85.3±1.9%, P≤0.0001*; NAPQI = 72.1±1.9%, P≤0.0001*. At 5 min (n=3): Control = 100.0±1.8%; APAP = 77.1±1.8%, P≤0.0001*; NAPQI = 76.0±1.8%, P≤0.0001*. At 10 min (n=3): Control = 100.0±1.9%; APAP = 92.5±1.9%, P≤0.003*; NAPQI = 88.3±1.9%, P≤0.0001*. At 15 min (n=3): Control = 100.0±1.9%; APAP = 83.0±1.9%, P≤0.0001*; NAPQI = 42.1±1.9%, P≤0.0001*. At 30 min (n=3): Control = 100.0±1.9%; APAP = 84.6±1.9%, P≤0.0001*; NAPQI = 45.8±1.9%, P≤0.0001*. At 1 h (n=3): Control = 100.0±1.9%; APAP = 77.2±1.9%, P≤0.0001*; NAPQI = 24.9±1.9%, P≤0.0001*. At 6 h (n=3): Control = 100.0±2.8%; APAP = 105.4±2.8%, P≤NS; NAPQI = 61.9±2.8%, P≤0.0001*. At 12 h (n=3): Control = 100.0±2.8%; APAP = 127.0±2.8%, P≤0.0001*; NAPQI = 11.8±2.8%, P≤0.0001*. At 24 h (n=3): Control = 100.0±7.5%; APAP = 349.6±7.5%, P≤0.0001*; NAPQI = 65.0±7.5%, P≤0.0001*. At 48 h (n=3): Control = 100.0±7.5%; APAP = 423.3±7.5%, P≤0.0001*; NAPQI = 46.7±7.5%, P≤0.0001*).
3.2. Contribution of Endoplasmic Reticulum Stress to the Cytotoxic Effects of APAP and NAPQI on HEI-OC1 Cells
Subsequently, we tested whether HEI-OC1 cells treated with APAP or NAPQI would undergo endoplasmic reticulum stress (ERS). For this purpose, we initially performed confocal microscopy and Western blotting using antibodies against GRP78 (glucose regulated protein of mw 78, a.k.a. BiP) and CHOP (CCAAT/enhancer binding protein homologous transcription factor, also called GADD153), surrogate marker proteins for this phenomenon. GRP78 function as a major ER-enriched chaperone for facilitating protein folding, and can bind to misfolded proteins and unassembled complexes. Its expression is induced by ERS, but once the stress is removed GRP78 is post-transcriptionally modified into a biologically inactive form. CHOP, on the other hand, is induced during ERS to integrate and amplify the death pathway (Schonthal, 2009; Woehlbier et al.).
We investigated GRP78 and CHOP expression at 12, 24 and 48 h, since our previous experiments indicate extreme values of ROS at these time points. We found that Control (untreated) cells showed GRP78 immunolabeling mostly at the perinuclear region of the cell (Fig. 3A,D). Interestingly, we found that the general pattern of GRP78 labeling was more similar at 12 and 48 h (Fig. 3A–C and G–I) than at 24 h (Fig. 3D–F), with immunoreactivity moving beyond the perinuclear region to the periphery at 12 and 48 h. Distinct cytoplasmic clusters highly reminiscent of ER fragmentation and vacuolization characterized NAPQI immunoreactivity and, as in the other conditions, labeling was mostly perinuclear at 24 h and moved to the cell periphery at 12 and 48 h. (Fig. 3C,F,I). By WB analysis, we found that both APAP and NAPQI actually induced an increase in GRP78 expression, but APAP-induced peak occurred at 48 h whereas NAPQI-induced peak took place 24 h after exposure (Fig. 4A).
Fig. 3. The cytotoxic effects of APAP and NAPQI on HEI-OC1 cells involves ERS.

Confocal microscopy using antibodies against ERS markers GRP78 (green, A–I) and CHOP (green, J–R) at 12, 24 and 48 h. In all panels red color corresponds to rhodamine phalloidin and blue to DAPI. In Control and APAP-treated cells GRP78 immunolabeling at 12 and 24 h. was mostly perinuclear and homogeneous, although at 12 h reactivity was more extended in APAP-treated cells (B, arrowheads); in NAPQI-treated cells immunolabeling was coarse and cluster-like, with a perinuclear distribution at 24 h (F, arrows), but also present in cellular projections at 12 h (C, arrowheads). At 48 h it was still perinuclear in Control cells (G, arrows), but it was also detected in filopodia and other cellular projections in APAP- and NAPQI-treated cells (H–I, arrowheads). CHOP immunoreactivity was weaker than GRP78. At 12 h a diffuse labeling was observed in the perinuclear region of Control cells (J, arrow), whereas in APAP-treated cells the nucleus of some cells were clearly immunoreactive (K, arrowhead) but not others (K, arrow); a faint labeling was observed in the nucleus and cytoplasm of in NAPQI-treated cells (L, arrow and arrowhead). At 24 h immunolabeling was more evident in all the conditions, with well defined spots of immunoreactivity in the perinuclear region (arrows) and cell periphery (arrowheads) (panels M–O). At 48 h cells’ labeling was more similar to that at 12 h than at 24 h, with a faint cytoplasmic labeling in Control cells (P, arrow), nuclear reactivity in some APAP-treated cells (Q, arrow), and NAPQI-treated cells showing CHOP immunoreactivity both in the perinuclear region (arrow) and cell periphery (arrowhead) (panel R).
Fig. 4. The cytotoxic effects of APAP and NAPQI on HEI-OC1 cells involves ERS.

A – HEI-OC1 cells Control and treated with APAP, NAPQI and tunicamycin (positive Control) were examined for expression levels of GRP78 using Western blotting. Densitometric analysis of WB images indicated that both APAP and NAPQI actually induced an increase in GRP78 expression, but APAP-induced peak occurred at 48 h whereas NAPQI-induced peak took place 24 h after exposure (At 12 h (n=4): Control = 1.000±0.162; APAP = 1.025±0.141, P=N.S.; NAPQI = 1.075±0.243, PN.S.; tunicamycin = 1.505±0.148, P≤0.001*. At 24 h (n=4): Control = 1.000±0.234; APAP = 1.260±0.234, P=NS; NAPQI = 1.553±0.234, P≤0.057; tunicamycin = 2.657±0.234, P≤0.0001*. At 48 h (n=4): Control = 1.000±0.234; APAP = 2.123±0.234, P≤0.0019*; NAPQI = 1.073±0.234, P=N.S.; tunicamycin = 1.883±0.234, P≤0.0001*). B – CHOP expression levels in treated and un-treated HEI-OC1 cells were also investigated using Western blotting. Densitometric analysis showed that APAP and NAPQI increased CHOP expression more than four-fold at 12 h, but this expression decreased below Control levels at 24 and 48 h of treatment (At 12 h (n=4): Control = 1.000±0.304; APAP = 3.971±0.304, P=0.0001*; NAPQI = 4.770±0.304, P≤0.0001*; tunicamycin = 9.706±0.304, P≤0.0001*. At 24 h (n=4): Control = 1.000±0.195; APAP = 0.903±0.195, P=NS; NAPQI = 0.357±0.195, P≤0.017*; tunicamycin = 2.157±0.195, P≤0.0003*. At 48 h (n=4): Control = 1.000±0.195; APAP = 0.490±0.195, P≤0.042*; NAPQ = 0.147±0.195, P≤0.003*; tunicamycin = 0.487±0.195, P≤0.048*). C - TEM images showed normal ER images in Control cells (arrows), in APAP-treated cells ER vesiculization was evident (arrows). In NAPQI treated cells typical ER cisternae were hard to identify, replaced by near spherical vesicles (arrows).
CHOP expression was also affected by APAP and NAPQI. CHOP immunolabeling was not strong either in Control or treated HEI-OC1 cells, but this could be associated to the particular antibody used in our study (Fig. 3J–R). At 24 h CHOP reactivity was mostly perinuclear in Control cells, whereas it was found in all the cytoplasm in APAP or NAPQI-treated cells (Fig. 3G–I). At 12 and 48 h CHOP immunoreactivity was lower than at 24 h, weak in the cytoplasm of Control cells (Fig. 3J and P, arrows), present in the nucleus of only some APAP-treated cells (Fig. 3K and Q, arrowheads), and the nucleus and cytoplasm of NAPQI-treated cells (Fig. 3L and R, arrows and arrowheads). WB studies showed a significant increase in CHOP expression in cells treated with APAP, NAPQI and tunicamycin (positive Control) at 12 h (Fig. 4B). However, although real, this increase could be magnified by the very low expression in Control cells. APAP did not induce any effect in HEI-OC1 cells treated for 24 h, whereas a significant decrease respect to Control values was observed at 48 h. NAPQI, on the other hand, significantly decreased CHOP expression at 24 and 48 h. Curiously, CHOP expression in tunicamycin-treated cells also decreased to about 50% of Control values at 48 h (Fig. 4B). Finally, transmission electron microscopy images showed evident ER vacuolization coupled to a dramatic reduction in membrane-bound ribosomal particles in APAP and, particularly, NAPQI treated cells but not in Control cells (Fig. 4C).
These results demonstrate that both APAP and NAPQI induce the expression of ERS markers, but that only the latter appears to form the intracellular structures that characterize this phenomenon.
3.3. HEI-OC1 cells treated with APAP and NAPQI express Genomics and Proteomic Markers of both Oxidative and ER Stress
Next, we investigated changes in gene expression induced in HEI-OC1 cells by exposure to APAP and NAPQI for 24 and 48 h, the time-points showing qualitatively different responses in our previous experiments. For this purpose, we used pathway specific Q-PCR arrays which measure the levels of 308 different genes associated with cell death, oxidative stress, and key signaling pathways involved in cell growth, survival, and death. Using this approach, we find that 232 transcripts were significantly (more than 2-fold) up or down regulated by exposure to APAP and NAPQI (see Supplemental Table 1). By generating Venn diagrams, we defined that among these 232 genes, 32 transcripts were regulated by APAP alone, 163 by NAPQI alone, and 37 by both compounds. For example, by focusing on the ontological association of these genes, we observed that APAP up regulated caspases 2 and 3 whereas NAPQI did not change the expression of these genes but instead up regulated caspases 1, 4, 6, 7, 8, 9, 12 and 14. Similarly, expression of some glutathione-s-transferases like Gsto1, Gstp2 and Gstt1 was affected only by APAP, whereas others like Gsta1 and Gstm1 or glutathione reductase (Grs) were targeted only by NAPQI. These results provide insights on the intracellular molecules associated with the toxic effects of both APAP and NAPQI on HEI-OC1 cells.
We applied semantic-based algorithms (IPA™ software, Ingenuity Systems/Qiagen) to gain insight as how the genes that changed their expression levels in response to drug treatment were linked into single functional networks. This approach indicated that approximately 50% of the genes tested were related to ERS and protein degradation, a result congruent with our cell biological experiments that further support a role for these interrelated pathways in the response to APAP and NAPQI. In addition, more than 80% of genes whose expression was either increased or decreased more than 2-fold by APAP and NAPQI (199 out of 232) belong to five different functional gene networks, with some of them being ascribed to more than one group. These groups include genes associated with xenobiotic metabolism, oxidative radical metabolism, ER stress, protein ubiquitination, and cell death (Fig. 5). Notably, whereas it can be expected that genes whose expression is necessary for drug metabolism, oxidative stress and cell death are differentially regulated in response to toxic drug exposure, our finding that in HEI-OC1 cells approximately 50% of the genes tested were related to ERS and protein degradation led us to hypothesize that these highly interrelated pathways would play an important role in the response. However, we were aware that this result could potentially be biased by the particular selection of the set of gene arrays chosen for this study. In addition, we thought it was important to validate the gene expression results at the proteins level. Thus, to extend our results, we decided to perform experiments using quantitative proteomics techniques, which would address both the gene selection bias and provide gene-to-protein expression validations. For this purpose, we investigated the changes in protein levels induced by 24 and 48 h exposure to APAP and NAPQI with iTRAQ techniques. These experiments identified more than 900 proteins, with 234 proteins that were significantly up or down regulated by treatment with these drugs (Supplemental Table 2. iTRAQ studies performed at Keck Biotechnology Resources Laboratory at Yale University; complete results are available at their website). IPA™-assisted ontological analyses of this data revealed that approximately 50% of these proteins groups identified by our gene expression studies (Fig. 5). When combined, both the gene and protein expression datasets indicate that APAP- and NAPQI-induced death of HEI-OC1 cells would be mediated, at least in part, by ERS and the functionally related alterations in protein folding and degradation. These genes and their products, therefore, are bonafide surrogate markers that can be used in future cell biological experiments to monitor the toxic effects of these drugs.
Fig. 5. Genomic and proteomic studies of HEI-OC1 cells treated with APAP (top) or NAPQI (bottom) for 24 or 48 h.

Microarray studies detected 232 genes up or down regulated 2-fold or more by cells’ treatment with APAP or NAPQI; 199 out of these 232 were either associated with xenobiotic metabolism, oxidative radical metabolism, ER stress, protein ubiquitination, or cell death. iTRAQ studies indicated that 111 of the 234 proteins whose expression increased or decreased 2-fold or more were indeed associated with the same five groups identified in genomic studies. (See Supplemental Tables 1 and 2 for additional information)
3.4. The cytotoxic effect of APAP and NAPQI on HEI-OC1 cells is dependent of eIF2α and CHOP but independent of IRE1, ATF6, and ATF4-mediated signaling
We performed experiments to investigate whether the ERS signaling cascade mediated by PKR-like endoplasmic reticulum kinases (PERK) (Lin et al., 2009; Woehlbier et al., 2011) could be the actual culprit for APAP/NAPQI-induced cell death. When activated by ERS, PERK induces phosphorylation of eukaryotic initiation factor 2 alpha (eIF2α), which works together with eIF2β to initiate protein biosynthesis. PERK-induced phosphorylation of eIF2α inhibits its interaction with eIF2β, thereby reducing protein synthesis and rescuing ERS. Inhibition of eIF2α also impairs the function of other well-characterized inducers of ERS, such as activating transcription factor 4 (ATF4) and CHOP, which function downstream eIF2β by regulating transcriptional responses (Wiseman et al., 2011) (see Fig. 10). Guided by this knowledge, we searched for changes in eIF2α phosphorylation in response to APAP and NAPQI. We found that levels of phosphorylated eIF2α (p-eIF2α) increase in HEI-OC1 cells treated with APAP for 24 h, and decrease in those exposed to NAPQI at 24 and 48 h, suggesting a quick activating effect of APAP and a consistent inhibitory effect of NAPQI on eIF2α phosphorylation (Fig. 6). Therefore, these results support a role for p-eIF2α in mediating APAP and NAPQI cytotoxic effects, leading us to study the role of other ER regulators working in conjunction with p-eIF2α.
Fig. 10. Highly simplified diagram of the signaling pathways activated by ERS in mammalian cells.

There are three major pathways mediated by the ER-resident transmembrane proteins ATF6, IRE1 and PERK. ERS increases GRP78 expression in the ER, and induces activation of one or more of the signaling pathways. After activation, ATF6 translocates to the Golgi, where it is cleaved by the Sit-1 and Sit-2 proteins releasing a 50-kDa transcription factor that translocates to the nucleus and bind ER stress response elements (ERSE). Activation of IRE1 causes IRE1-mediated splicing of XBP1 mRNA. Translation of spliced XBP1 mRNA produces a transcription factor that up regulates target genes via the ERSE promoter. Once stimulated, PERK phosphorylates eIF2α inhibiting protein translation. p-eIF2α enhances translation of ATF4, which induces expression of CHOP. CHOP, in turn, down regulates the expression of the anti-apoptotic protein Bcl-2, initiating mitochondria mediated apoptosis (not shown). As described in Results, APAP and NAPQI stimulates PERK-mediated pathway, but while APAP activates oxidative stress responses and increases levels of p-eIF2α, NAPQI decreases ROS production and p-eIF2α levels. Neither APAP nor NAPQI stimulate ATF4-mediated signaling, suggesting that they induce apoptosis via a different pathway.
Fig. 6. APAP and NAPQI changed levels of eIF2α phosphorylation.

A – WB studies indicated that APAP maintains or increases eIF2α phosphorylation, whereas NAPQI nearly abolished it. B – Densitometric quantification of WB bands showed a significant APAP-induced increase in eIF2α phosphorylation at 24 h, and a significant NAPQI-induced decrease both at 24 and 48 h (At 24 h (n=4): Control = 1.000±0.197, APAP = 1.583±0.197, P≤0.029*, NAPQI = 0.323±0.197, P≤0.016*. At 48 h (n=4): Control = 1.000±0.197, APAP = 0.870±0.197, P=N.S., NAPQI = 0.06±0.197, P≤0.003*).
We genetically inactivated ATF4 using specific shRNA for this transcription factor (Fig. 7A) and treated cells with APAP and NAPQI. To our surprise, we found that ATF4 knockdown was not able to rescue the cytotoxic effects of APAP and NAPQI (Fig. 7B).
Fig. 7. ATF4 knockdown did not affect APAP or NAPQI cytotoxicity.
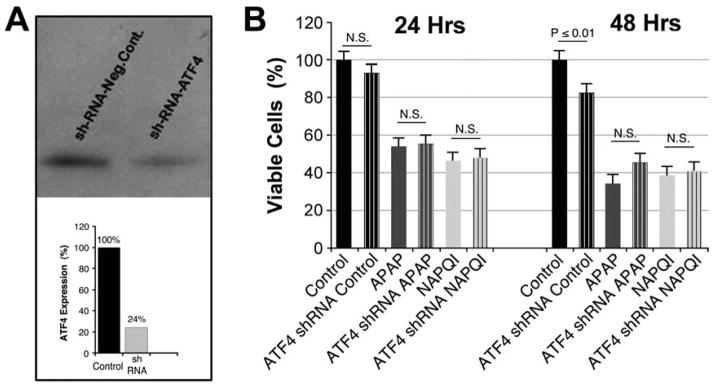
A – ATF4 shRNA transfected HEI-OC1 cells express ~20% of the ATF4 expressed either by Control or cells transfected with scrambled shRNA (negative Control). B – ATF4 shRNA did not increase viability of HEI-OC1 cells treated with APAP or NAPQI (At 24 h (n=3): Control = 100.0±4.9%; ATF4 shRNA Control = 93.4±4.9%, P=N.S. re Control; APAP = 53.7±4.9%; ATF4 shRNA APAP = 55.1±4.9%, P=N.S. re APAP; NAPQI = 44.0±4.9%; ATF4 shRNA NAPQI = 47.3±4.9%, P=N.S. re NAPQI. At 48 h (n=3): Control = 100.0±5.1%; ATF4 shRNA Control = 81.8±5.1%, P≤0.01* re Control; APAP = 33.4±5.1%; ATF4 shRNA APAP = 45.6±5.1%, P=N.S. re APAP; NAPQI = 38.3±5.1%; ATF4 shRNA NAPQI = 40.4±5.1%, P=N.S. re NAPQI).
In addition to PERK, ERS may result in the activation of two additional signaling cascades, one mediated by IRE1 (inositol-requiring enzyme 1) and the other by ATF6 (activating transcription factor 6) (Schonthal, 2009; Woehlbier et al.) (see Fig. 10). Activation of IRE1 results in the unconventional splicing of the mRNA of its downstream target, the X-box binding protein 1 (XBP1), with the spliced form of XBP1 working as a transcription factor that induces expression of ER chaperones to ameliorate ERS (Lin et al., 2009; Lin et al., 2007; Woehlbier et al., 2011). Thus, we monitored the splicing of XBP1 mRNA in HEI-OC1 cells by RT-PCR from cells treated with APAP and NAPQI. Vehicle- and tunicamycin-treated cells were used as negative and positive Control, respectively. We found that cells exposed to APAP and NAPQI, in contrast to those exposed to tunicamycin, showed no clear signals of XBP1 splicing, suggesting that IRE1-mediated signaling was not readily activated by these drugs (Fig. 8A). We also evaluated the integrity of signaling pathways activated by IRE1 independently of XBP1, such as c-Jun N-terminal kinases (JNK) signaling, which is amenable for inhibition by the small drug SP600125. JNK inhibition by SP600125, however, did not affect HEI-OC1 cells’ survival (Fig. 8B). Combined, these results support the notion that IRE1 is unlikely involved in the toxic response to APAP and NAPQI in HEI-OC1 cells.
Fig. 8. IRE1-mediated ERS pathway is not involved in APAP or NAPQI cytotoxicity.

A – HEI-OC1 cells exposed to APAP and NAPQI, in contrast to those exposed to tunicamycin, showed no clear signals of XBP1 splicing. B - JNK inhibition by SP600125 did not affect the viability of HEI-OC1 cells treated with APAP or NAPQI. (At 24 h (n=3): Control = 100.0±2.9%; S600125 = 103.2±2.9%, P=N.S. re Control; APAP = 42.3±2.9%; APAP+SP600125 = 37.7±2.9%, P=N.S. re APAP; NAPQI = 44.4±2.9%; NAPQI+SP600125 = 45.1±2.9%, P=N.S. re NAPQI. At 48 h (n=3): Control = 100.0±2.9%; S600125 = 102.5±2.9%, P=N.S. re Control; APAP = 32.0±2.9%, P≤0.0001* re Control; APAP+SP600125 = 27.3±2.9%, P=N.S. re APAP; NAPQI = 31.4±2.9%, P≤0.0001* re Control; NAPQI+SP600125 = 31.2±2.9%, P=N.S. re NAPQI).
Finally, we tested the participation of ATF6 in the analgesic-induced toxic response. ERS induces translocation of this protein from the ER membrane to the Golgi, where it is enzymatically processed into a transcriptional regulator that activates the expression of ER chaperones and Endoplasmic Reticulum Associated Degradation genes (ERAD-related genes) (Woehlbier et al., 2011). The processing of ATF6 can be specifically inhibited by AEBSF (4-(2-aminoethyl) benzenesulfonyl fluoride), which antagonizes the activation of ATF6 within the Golgi, precluding its inducing effect on ERS. Thus, we speculated that, if ATF6-mediated signaling cascades were involved in the cytotoxic effect of APAP or NAPQI, inhibition of ATF6 with AEBSF would increase viability of HEI-OC1 cells treated with these drugs. We tested AEBSF at three different doses, 5μM, 50 μM and 100μM, but viability of APAP or NAPQI treated cells was not increased by any of them (Fig. 9). In agreement with these results, WB experiments indicated that CHOP expression was not changed either (at 24 h (n=4): Control = 1.000±0.224; APAP = 1.624±0.224, P=N.S. re Control; APAP+AEBSF (50μM) = 1.260±0.593, P=N.S. re APAP; NAPQI = 0.951±0.224, P=N.S. re Control; NAPQI+AEBSF (50μM) = 0.902±0.593, P=N.S. re NAPQI. At 48 h (n=4): Control = 1.000±0.224; APAP = 1.021±0.242, P=N.S. re Control; APAP+AEBSF (50μM) = 0.741±0.593, P=N.S. re APAP; NAPQI = 0.796±0.242, P=N.S. re Control; NAPQI+AEBSF (50μM) = 0.741±0.593, P=N.S. re NAPQI).
Fig. 9. ATF6-mediated ERS pathway is not involved in APAP or NAPQI cytotoxicity.

Treatment of HEI-OC1 cells with AEBSF, inhibitor of the ATF6-mediated pathway, did not prevent APAP or NAPQI cytotoxicity. (At 24 h (n=3): Control = 100.0±3.0%; APAP = 51.4±3.0%, P≤0.0001* re Control; APAP+AEBSF (5μM) = 31.4±3.0%, P≤0.0032* re APAP; APAP+AEBSF (50μM) = 39.5±3.0%, P≤0.0001* re APAP; APAP+AEBSF (100μM) = 43.0±3.0%, P≤0.0265* re APAP; NAPQI = 67.3±3.0%, P≤0.0001* re Control; NAPQI+AEBSF (5μM) = 61.7±3.0%, P=N.S. re NAPQI; NAPQI+AEBSF (50μM) = 44.8±3.0%, P≤0.0001* re NAPQI; NAPQI+AEBSF (100μM) = 57.0±3.0%, P≤0.0089* re NAPQI. At 48 h (n=3): Control = 100.0±3.0%; APAP = 29.2±3.0%, P≤0.0001* re Control; APAP+AEBSF (5μM) = 29.2±3.0%, P=N.S. re APAP; APAP+AEBSF (50μM) = 26.7±3.0%, P=N.S. re APAP; APAP+AEBSF (100μM) = 26.9±3.0%, P=N.S. re APAP; NAPQI = 48.8±3.0%, P≤0.0001* re Control; NAPQI+AEBSF (5μM) = 48.3±3.0%, P=N.S. re NAPQI; NAPQI+AEBSF (50μM) = 50.4±3.0%, P=N.S. re NAPQI; NAPQI+AEBSF (100μM) = 45.6±3.0%, P=N.S. re NAPQI).
4. Discussion
Analgesic preparations containing APAP and opioids, such as hydrocodone, have recently elicited significant attention because, if abused, they can rapidly induce profound sensorineural hearing loss (Blakley et al., 2008; Curhan et al., 2010; Curhan et al., 2012; Friedman et al., 2000; Ho et al., 2007; Oh et al., 2000; Rigby et al., 2008; Yorgason et al., 2010). The cellular and molecular mechanisms underlying the ototoxic effects of this drug combination are currently unknown. In an attempt to fill the gap in this important field of research, we have previously reported studies that clarified the pathobiological effects of APAP and hydrocodone on cochlear hair cells, providing evidence that APAP, and not hydrocodone, was the actual culprit of the ototoxic effects of the compound (Yorgason et al., 2010). We also identified OHCs as the major target of APAP toxicity in the mouse organ of Corti, and provided evidence that HEI-OC1 cells, although not actual hair cells, are a good model to investigate the cellular and molecular mechanisms underlying APAP ototoxicity (Yorgason et al., 2010). Thus, in the current study, our goal has been to further increase the current understanding of the process of analgesic-induced ototoxicity by identifying mechanisms by which APAP affects the viability of cultured HEI-OC1 cells. Our results indicate that both APAP and its metabolite NAPQI are toxic for HEI-OC1 cells, but different cellular mechanisms contribute to mediate their cytotoxicity.
4.1. APAP, but not NAPQI, causes HEI-OC1 cells death by inducing oxidative stress
Our investigation focused on evaluating the toxic effects associated with APAP and its metabolite, NAPQI, separately. We designed our studies starting from dose-response curves that describe the concentrations of both APAP and NAPQI that cause noticeable ototoxic effects in HEI-OC1 cells, so that future studies can be guided by these experiments. We used a concentration of 1.5 mg/mL (~10 mM) APAP, which is less than APAP EC50 in human hepatocyte cultures (28.2 mM), but more than APAP EC50 in mouse hepatocyte cultures (3.8 mM), as determined by cell viability studies following 24 h treatment (Jemnitz et al., 2008). Since approximately 10% APAP is metabolized into NAPQI, a concentration of 150 μg/mL (~1 mM) NAPQI was used in our experiments with this compound. Using these doses, we demonstrated that treatment with APAP for short periods actually decrease ROS levels in HEI- OC1 cells, but exposure for more than 6 h induces a significant increase in oxidative stress; NAPQI, in contrast, decreases ROS levels in HEI-OC1 cells at all the time-points investigated (Fig. 2). The observed anti-oxidant effect of APAP at short periods of exposure was at odds with the abundant literature about its effects on hepatocytes, but consistent with reports that APAP acts as an anti-inflammatory and anti-oxidant compound in neurons both in vitro and in vivo. For example, APAP protects hippocampal neurons and PC12 cultures from oxidative stress by lowering cytoplasmic levels of peroxides and reducing of lipid peroxidation (Bisaglia et al., 2002), and cerebral cortical cultured neurons and brain endothelial cells exposed to the superoxide-generating compound menadione (Tripathy et al., 2009a; Tripathy et al., 2009b). In rats, APAP induces apoptosis of cortical neurons (Posadas et al., 2010), but significantly attenuates superoxide production by the neurotoxin quinolinic acid, a metabolite implicated in the pathogenesis of neurodegenerative diseases (Maharaj et al., 2006). In a C. elegans model of Parkinson’s disease APAP also protects dopaminergic neurons from oxidative damage evoked by exposure to 6-hydroxy dopamine or excessive levels of dopamine (Locke et al., 2008). Therefore, we can speculate that HEI-OC1 cells probably respond to APAP just as neurons, which seems reasonable given their neuro-epithelial origin. The decrease in ROS levels induced by NAPQI, in contrast, is consistent with the results of Harman et al. (Harman et al., 1991) in cultured hepatocytes. These authors presented solid evidence that killing of hepatocytes by APAP was dependent on a cellular source of ferric iron, potentiated by 1,3-bis (2-chloroethyl)-l-nitrosourea (BCNU, an inhibitor of glutathione reductase), and very sensitive to antioxidants. By contrast, NAPQI hepatotoxicity was not prevented by chelation of ferric iron, was unaffected by BCNU, and was insensitive to antioxidants (Harman et al., 1991). Moreover, the killing of cultured hepatocytes by NAPQI was preceded by a collapse of the mitochondrial membrane potential and a depletion of ATP, suggesting that mitochondrial de-energization by a mechanism unrelated to oxidative stress was likely the mechanism of hepatocytes killing by NAPQI (Harman et al., 1991). Thus, the results by Harman et al and our own results suggest that, though important, oxidative stress would not completely explain the hepato- and oto-toxic effects of both drugs, a finding that led us to search for additional mechanisms underlying this process in HEI-OC1 cells.
4.2. ER stress is a shared mechanism underlying the toxic effects of APAP and NAPQI on HEI-OC1 cells
Information on APAP neurotoxicity is scarce and, to our knowledge, no toxic effects have been described in the human nervous system. In agreement with our results, reported studies suggest that APAP concentrations up to 100 mM or doses up to 100 mg/Kg prevent ROS production and cytotoxicity in neurons, but higher concentrations, far from protecting cells from ROS toxicity, might actually contribute to ROS production (Posadas et al., 2010). Also in agreement with our results indicating that APAP and NAPQI effects would be mediated by different cellular mechanisms, NAPQI, but not APAP itself, would activate mouse and human transient receptor potential ankyrin-1 (TRPA1) channel, reducing voltage-gated calcium and sodium currents in primary sensory neurons and releasing pro-inflammatory neuropeptides from sensory nerve terminals (Nassini et al., 2010).
The mechanisms of APAP and NAPQI liver toxicity, in contrast, have been extensively studied (see, for example, (Jaeschke et al., 2012; Jaeschke et al., 2011; Moyer et al., 2011). However, there is no complete consensus about the multiple steps and signaling pathways involved in the process. It is generally believed that APAP hepatotoxicity is initiated by formation of its reactive metabolite, NAPQI, which depletes glutathione and binds to cellular proteins, especially in mitochondria. The resulting mitochondrial oxidant stress and peroxynitrite formation, in part through amplification by c-Jun-N-terminal kinase activation, leads to mitochondrial DNA damage and opening of the mitochondrial permeability transition pore. Endonucleases from the mitochondrial inter-membrane space and lysosomes would be responsible for nuclear DNA fragmentation. The mitochondrial dysfunction and nuclear DNA damage ultimately cause oncotic cell death with release of molecular byproducts that trigger a sterile inflammatory response (Jaeschke et al., 2012; Jaeschke et al., 2011). Therefore, some authors believe that NAPQI, not APAP, is responsible of liver toxicity. Interestingly, studies in hepatoma cell lines, which possess very low levels of CYP450 enzymes and therefore cannot efficiently metabolize APAP into NAPQI, indicate that APAP exposure induces caspase-dependent apoptosis, in contrast to cell death of metabolically competent hepatocytes that occurs by oncotic necrosis as indicated by cell and organelle swelling, massive cell contents release, and karyorrhexis and karyolysis (Bajt et al., 2004; Gujral et al., 2002; McGill et al., 2011). Thus, APAP and NAPQI cytotoxicity would be associated with different pathways: one leading to cell apoptosis and the other to necrosis, and the balance between these two mechanisms would be cell type-dependent.
Although the cellular effects of APAP itself are still under discussion, there are no doubts about NAPQI cytotoxicity. Thus, NAPQI cytotoxicity has been investigated with genomic, proteomic and transcriptomic approaches. In a recent work, 176 different lymphoblastic cell lines from healthy human subjects were used in a genomic-wide study (Moyer et al., 2011). A group of single nucleotide polymorphisms (SNPs) in linkage disequilibrium on chromosome 3 was highly associated with NAPQI toxicity. This group of SNPs mapped to a “gene desert” area, but chromatin immunoprecipitation assays demonstrated binding of several transcription factor proteins including heat shock factor 1 (HSF1) and HSF2. The mechanism responsible for this association, however, was unclear, and the study provided no decisive information about the actual mechanism of NAPQI cytotoxicity (Moyer et al., 2011).
In the present study we demonstrate that, in HEI-OC1 cells, both APAP and NAPQI are cytotoxic, but their toxic effects are mediated by different mechanisms. To elucidate the molecular mechanisms underlying APAP and NAPQI cytotoxicity in HEI-OC1 cells, we complemented our cellular biology experiments with gene expression levels and proteomic profiling. Our initial design involved the use of pathway specific arrays to study the expression of genes involved in toxicity in a focused manner. This method was subsequently complemented using proteomics (iTRAQ), which provides both an unbiased validation of genomic studies as well as complementing the information about gene expression levels with information about protein production. These experiments produced information leading to the conclusion that both compounds regulate gene and protein networks that participate in the cell response to xenobiotic metabolism, oxidative radical metabolism, ER stress, protein ubiquitination, and cell death. Consequently, guided by these results and those of OMIC experiments with APAP performed by other researchers in liver cells, we designed cellular biological experiments to define whether ER stress was indeed part, together with oxidative stress, of the cellular mechanisms associated with the toxic effects of APAP and NAPQI. We examined in detail the impact of these compounds on the structure and function of the ER using well-characterized markers of ER stress, and our observations revealed that APAP and NAPQI changed the levels of intra-cisternal chaperones in a similar way to what it has been previously reported as surrogate of ER stress, ultimately causing the fragmentation of this organelle. Further experiments supported the involvement of the PERK-mediated pathway, but not the IRE1- and ATF6-mediated pathways, in the APAP/NAPQI-induced ER stress (Fig. 10). Interestingly, APAP and NAPQI showed different effects on eIF2α phosphorylation, and consequently on protein synthesis, and their effects were not associated with ATF4 activation. Thus, these studies reveal that ER stress might be a key pathophysiological mechanism responsible for the toxic effects of APAP and NAPQI on auditory cells and outlines molecules and pathways that, if inactivated, could prevent these deleterious effects.
4.3. Conclusions
In summary, we have used HEI-OC1 cells as an in vitro model for studying the potential ototoxic effects of APAP, a commonly used analgesic drug that causes hearing loss. More importantly, our results suggest that APAP and its metabolite NAPQI could be achieving their ototoxic effects by triggering both oxidative stress and endoplasmic reticulum stress. Since several approaches are being currently developed to modulate both of these two deleterious cellular responses, we are optimistic that our results will guide future studies aimed at designing and testing potential therapeutic intervention aimed at preventing hearing loss caused by these compounds.
Supplementary Material
Highlights.
APAP and NAPQI are toxic for HEI-OC1 auditory cells
APAP cytotoxicity, but not NAPQI‘s, would be associated with oxidative stress
APAP and NAPQI would induce endoplasmic reticulum stress
Only the PERK pathway would mediate APAP and NAPQI cytotoxicity.
eIF2α and CHOP, but not ATF4, would be involved in APAP and NAPQI cytotoxicity
Acknowledgments
This work was supported by NIH Grants R01-DC010146 and R01-DC010397, and personal funds from William M. Luxford.
Abbreviations
- HEI-OC1
House Ear Institute-Organ of Corti 1
- APAP
N-acetyl-para-aminophenol
- NAPQI
N-acetyl-p-benzoquinoneimine
- ROS
Reactive Oxygen Species
- OHC
Outer Hair Cell
- ERS
Endoplasmic Reticulum Stress
Footnotes
The authors declare no existing or potential conflict of interest.
Its content is solely the responsibility of the authors and does not necessarily represent the official view of the National Institutes of Health.
Publisher's Disclaimer: This is a PDF file of an unedited manuscript that has been accepted for publication. As a service to our customers we are providing this early version of the manuscript. The manuscript will undergo copyediting, typesetting, and review of the resulting proof before it is published in its final citable form. Please note that during the production process errors may be discovered which could affect the content, and all legal disclaimers that apply to the journal pertain.
References
- Bajt ML, Knight TR, Lemasters JJ, Jaeschke H. Acetaminophen-induced oxidant stress and cell injury in cultured mouse hepatocytes: protection by N-acetyl cysteine. Toxicol Sci. 2004;80:343–9. doi: 10.1093/toxsci/kfh151. [DOI] [PubMed] [Google Scholar]
- Bisaglia M, Venezia V, Piccioli P, Stanzione S, Porcile C, Russo C, Mancini F, Milanese C, Schettini G. Acetaminophen protects hippocampal neurons and PC12 cultures from amyloid beta-peptides induced oxidative stress and reduces NF- kappaB activation. Neurochem Int. 2002;41:43–54. doi: 10.1016/s0197-0186(01)00136-x. [DOI] [PubMed] [Google Scholar]
- Blakley BW, Schilling H. Deafness associated with acetaminophen and codeine abuse. J Otolaryngol Head Neck Surg. 2008;37:507–9. [PubMed] [Google Scholar]
- Bromer MQ, Black M. Acetaminophen hepatotoxicity. Clin Liver Dis. 2003;7:351–67. doi: 10.1016/s1089-3261(03)00025-4. [DOI] [PubMed] [Google Scholar]
- Curhan SG, Eavey R, Shargorodsky J, Curhan GC. Analgesic use and the risk of hearing loss in men. Am J Med. 2010;123:231–7. doi: 10.1016/j.amjmed.2009.08.006. [DOI] [PMC free article] [PubMed] [Google Scholar]
- Curhan SG, Shargorodsky J, Eavey R, Curhan GC. Analgesic use and the risk of hearing loss in women. Am J Epidemiol. 2012;176:544–54. doi: 10.1093/aje/kws146. [DOI] [PMC free article] [PubMed] [Google Scholar]
- Friedman RA, House JW, Luxford WM, Gherini S, Mills D. Profound hearing loss associated with hydrocodone/acetaminophen abuse. Am J Otol. 2000;21:188–191. doi: 10.1016/s0196-0709(00)80007-1. [DOI] [PubMed] [Google Scholar]
- Gujral JS, Knight TR, Farhood A, Bajt ML, Jaeschke H. Mode of cell death after acetaminophen overdose in mice: apoptosis or oncotic necrosis? Toxicol Sci. 2002;67:322–8. doi: 10.1093/toxsci/67.2.322. [DOI] [PubMed] [Google Scholar]
- Harman AW, Kyle ME, Serroni A, Farber JL. The killing of cultured hepatocytes by N-acetyl-p-benzoquinone imine (NAPQI) as a model of the cytotoxicity of acetaminophen. Biochem Pharmacol. 1991;41:1111–7. doi: 10.1016/0006-2952(91)90648-o. [DOI] [PubMed] [Google Scholar]
- Hersh EV, Pinto A, Moore PA. Adverse drug interactions involving common prescription and over-the-counter analgesic agents. Clin Ther. 2007;29(Suppl):2477–97. doi: 10.1016/j.clinthera.2007.12.003. [DOI] [PubMed] [Google Scholar]
- Hirose K, Hockenbery DM, Rubel EW. Reactive oxygen species in chick hair cells after gentamicin exposure in vitro. Hear Res. 1997;104:1–14. doi: 10.1016/s0378-5955(96)00169-4. [DOI] [PubMed] [Google Scholar]
- Ho T, Vrabec JT, Burton AW. Hydrocodone use and sensorineural hearing loss. Pain Physician. 2007;10:467–472. [PubMed] [Google Scholar]
- Jaeschke H, McGill MR, Ramachandran A. Oxidant stress, mitochondria, and cell death mechanisms in drug-induced liver injury: lessons learned from acetaminophen hepatotoxicity. Drug Metab Rev. 2012;44:88–106. doi: 10.3109/03602532.2011.602688. [DOI] [PMC free article] [PubMed] [Google Scholar]
- Jaeschke H, McGill MR, Williams CD, Ramachandran A. Current issues with acetaminophen hepatotoxicity--a clinically relevant model to test the efficacy of natural products. Life Sci. 2011;88:737–45. doi: 10.1016/j.lfs.2011.01.025. [DOI] [PMC free article] [PubMed] [Google Scholar]
- Jemnitz K, Veres Z, Monostory K, Kobori L, Vereczkey L. Interspecies differences in acetaminophen sensitivity of human, rat, and mouse primary hepatocytes. Toxicol In Vitro. 2008;22:961–7. doi: 10.1016/j.tiv.2008.02.001. [DOI] [PubMed] [Google Scholar]
- Kalinec GM, Webster P, Lim DJ, Kalinec F. A cochlear cell line as an in vitro system for drug ototoxicity screening. Audiol Neurootol. 2003;8:177–189. doi: 10.1159/000071059. [DOI] [PubMed] [Google Scholar]
- Lin JH, Li H, Zhang Y, Ron D, Walter P. Divergent effects of PERK and IRE1 signaling on cell viability. PLoS ONE. 2009;4:e4170. doi: 10.1371/journal.pone.0004170. [DOI] [PMC free article] [PubMed] [Google Scholar]
- Lin JH, Li H, Yasumura D, Cohen HR, Zhang C, Panning B, Shokat KM, Lavail MM, Walter P. IRE1 signaling affects cell fate during the unfolded protein response. Science. 2007;318:944–9. doi: 10.1126/science.1146361. [DOI] [PMC free article] [PubMed] [Google Scholar]
- Locke CJ, Fox SA, Caldwell GA, Caldwell KA. Acetaminophen attenuates dopamine neuron degeneration in animal models of Parkinson’s disease. Neurosci Lett. 2008;439:129–33. doi: 10.1016/j.neulet.2008.05.003. [DOI] [PubMed] [Google Scholar]
- Maharaj H, Maharaj DS, Daya S. Acetylsalicylic acid and acetaminophen protect against oxidative neurotoxicity. Metab Brain Dis. 2006;21:189–99. doi: 10.1007/s11011-006-9012-7. [DOI] [PubMed] [Google Scholar]
- McGill MR, Yan HM, Ramachandran A, Murray GJ, Rollins DE, Jaeschke H. HepaRG cells: a human model to study mechanisms of acetaminophen hepatotoxicity. Hepatology. 2011;53:974–82. doi: 10.1002/hep.24132. [DOI] [PMC free article] [PubMed] [Google Scholar]
- Mikus G, Weiss J. Influence of CYP2D6 on Opioid Kinetics, Metabolism and Response. Curr Pharmacogenomics. 2005;3:43–52. [Google Scholar]
- Moyer AM, Fridley BL, Jenkins GD, Batzler AJ, Pelleymounter LL, Kalari KR, Ji Y, Chai Y, Nordgren KK, Weinshilboum RM. Acetaminophen-NAPQI hepatotoxicity: a cell line model system genome-wide association study. Toxicol Sci. 2011;120:33–41. doi: 10.1093/toxsci/kfq375. [DOI] [PMC free article] [PubMed] [Google Scholar]
- Nagy G, Kardon T, Wunderlich L, Szarka A, Kiss A, Schaff Z, Banhegyi G, Mandl J. Acetaminophen induces ER dependent signaling in mouse liver. Arch Biochem Biophys. 2007;459:273–9. doi: 10.1016/j.abb.2006.11.021. [DOI] [PubMed] [Google Scholar]
- Nagy G, Szarka A, Lotz G, Doczi J, Wunderlich L, Kiss A, Jemnitz K, Veres Z, Banhegyi G, Schaff Z, Sumegi B, Mandl J. BGP-15 inhibits caspase-independent programmed cell death in acetaminophen-induced liver injury. Toxicol Appl Pharmacol. 2009;243:96–103. doi: 10.1016/j.taap.2009.11.017. [DOI] [PubMed] [Google Scholar]
- Nassini R, Materazzi S, Andre E, Sartiani L, Aldini G, Trevisani M, Carnini C, Massi D, Pedretti P, Carini M, Cerbai E, Preti D, Villetti G, Civelli M, Trevisan G, Azzari C, Stokesberry S, Sadofsky L, McGarvey L, Patacchini R, Geppetti P. Acetaminophen, via its reactive metabolite N-acetyl-p-benzo-quinoneimine and transient receptor potential ankyrin-1 stimulation, causes neurogenic inflammation in the airways and other tissues in rodents. FASEB J. 2010;24:4904–16. doi: 10.1096/fj.10-162438. [DOI] [PubMed] [Google Scholar]
- Oh AK, Ishiyama A, Baloh RW. Deafness associated with abuse of hydrocodone/acetaminophen. Neurology. 2000;54:2345. doi: 10.1212/wnl.54.12.2345. [DOI] [PubMed] [Google Scholar]
- Posadas I, Santos P, Blanco A, Munoz-Fernandez M, Cena V. Acetaminophen induces apoptosis in rat cortical neurons. PLoS One. 2010;5:e15360. doi: 10.1371/journal.pone.0015360. [DOI] [PMC free article] [PubMed] [Google Scholar]
- Rigby MH, Parnes LS. Profound hearing loss associated with oxycodone-acetaminophen abuse. J Otolaryngol Head Neck Surg. 2008;37:E161–2. [PubMed] [Google Scholar]
- Schonthal AH. Endoplasmic reticulum stress and autophagy as targets for cancer therapy. Cancer Lett. 2009;275:163–9. doi: 10.1016/j.canlet.2008.07.005. [DOI] [PubMed] [Google Scholar]
- Tripathy D, Grammas P. Acetaminophen inhibits neuronal inflammation and protects neurons from oxidative stress. Journal of neuroinflammation. 2009a;6:10. doi: 10.1186/1742-2094-6-10. [DOI] [PMC free article] [PubMed] [Google Scholar]
- Tripathy D, Grammas P. Acetaminophen protects brain endothelial cells against oxidative stress. Microvasc Res. 2009b;77:289–96. doi: 10.1016/j.mvr.2009.02.002. [DOI] [PMC free article] [PubMed] [Google Scholar]
- Wiseman RL, Kelly JW. Cell biology. Phosphatase inhibition delays translational recovery. Science. 2011;332:44–5. doi: 10.1126/science.1204505. [DOI] [PubMed] [Google Scholar]
- Woehlbier U, Hetz C. Modulating stress responses by the UPRosome: a matter of life and death. Trends Biochem Sci. 2011;36:329–37. doi: 10.1016/j.tibs.2011.03.001. [DOI] [PubMed] [Google Scholar]
- Yorgason JG, Kalinec GM, Luxford WM, Warren FM, Kalinec F. Acetaminophen ototoxicity after acetaminophen/hydrocodone abuse: evidence from two parallel in vitro mouse models. Otolaryngol Head Neck Surg. 2010;142:814–819. doi: 10.1016/j.otohns.2010.01.010. [DOI] [PubMed] [Google Scholar]
- Zimmerman HJ. Acetaminophen Hepatotoxicity. Clin Liver Dis. 1998;2:523–541. [Google Scholar]
Associated Data
This section collects any data citations, data availability statements, or supplementary materials included in this article.