

Abstract
Background
Research into adverse events (AEs) has highlighted the need to improve patient safety. AEs are unintended injuries or complications resulting in death, disability or prolonged hospital stay that arise from health care management. We estimated the incidence of AEs among patients in Canadian acute care hospitals.
Methods
We randomly selected 1 teaching, 1 large community and 2 small community hospitals in each of 5 provinces (British Columbia, Alberta, Ontario, Quebec and Nova Scotia) and reviewed a random sample of charts for nonpsychiatric, nonobstetric adult patients in each hospital for the fiscal year 2000. Trained reviewers screened all eligible charts, and physicians reviewed the positively screened charts to identify AEs and determine their preventability.
Results
At least 1 screening criterion was identified in 1527 (40.8%) of 3745 charts. The physician reviewers identified AEs in 255 of the charts. After adjustment for the sampling strategy, the AE rate was 7.5 per 100 hospital admissions (95% confidence interval [CI] 5.7– 9.3). Among the patients with AEs, events judged to be preventable occurred in 36.9% (95% CI 32.0%–41.8%) and death in 20.8% (95% CI 7.8%–33.8%). Physician reviewers estimated that 1521 additional hospital days were associated with AEs. Although men and women experienced equal rates of AEs, patients who had AEs were significantly older than those who did not (mean age [and standard deviation] 64.9 [16.7] v. 62.0 [18.4] years; p = 0.016).
Interpretation
The overall incidence rate of AEs of 7.5% in our study suggests that, of the almost 2.5 million annual hospital admissions in Canada similar to the type studied, about 185 000 are associated with an AE and close to 70 000 of these are potentially preventable.
Patient safety is receiving growing attention in Canada. Numerous legal cases and media stories have highlighted the consequences of unintended adverse events (AEs). In 2002 the Canadian government budgeted $50 million over 5 years for the creation of the Canadian Patient Safety Institute, and many health care organizations have initiated efforts to improve patient safety.
One important indicator of patient safety is the rate of AEs among hospital patients. AEs are unintended injuries or complications that are caused by health care management, rather than by the patient's underlying disease, and that lead to death, disability at the time of discharge or prolonged hospital stays.1,2 Some AEs are the unavoidable consequences of health care, such as an unanticipated allergic reaction to an antibiotic. However, 37%–51% of AEs have been judged in retrospect to have been potentially preventable.1,2,3,4,5,6
In various countries, hospital chart reviews have revealed that 2.9%–16.6% of patients in acute care hospitals experienced 1 or more AEs.1,2,3,4,5,6,7,8,9The results of these studies have offered important data on a critical aspect of hospital performance and provided impetus for the development of patient safety initiatives.
There are few Canadian data on AEs in hospital patients.10,11,12 We report on the first Canadian study to provide a national estimate of the incidence of AEs across a range of hospitals using methods comparable to those used in recent studies from other countries. Our study was designed to describe the frequency and type of AEs in patients admitted to Canadian acute care hospitals and to compare the rate of these AEs across types of hospitals and between medical and surgical care. Additional detailed analyses on the specific nature of the AEs as well as comparisons to other methods for detecting AEs will be reported elsewhere.
Methods
The methods used in this study are based on a protocol developed by the Harvard Medical Practice Study, which examined the incidence of AEs in New York state hospitals in 1984.1,3 This protocol, with modifications, was used in subsequent studies in Australia, the United Kingdom, New Zealand, the United States (in Colorado and Utah) and Denmark.2,4,5,6,7,8,9
Study sample
Four hospitals in each of 5 provinces (British Columbia, Alberta, Ontario, Quebec and Nova Scotia) were randomly selected to participate in the study from a list of eligible acute care hospitals in each province. Eligible hospitals were facilities within about 250 km of the provincial research centre (range selected because of budgetary considerations) that had at least 1500 inpatient hospital admissions in 2002 and an emergency department open 24 hours per day. No specialty hospitals (e.g., pediatric, psychiatric, obstetric or rehabilitative) were included. One teaching hospital (i.e., a hospital with full-time core residency training programs in medicine and surgery), 1 large community hospital (100 or more beds) and 2 small community hospitals (fewer than 100 beds) were randomly selected in each province. Of the 20 hospitals invited to participate, 1 declined and was replaced with the next randomly selected hospital of the same type for the province. Selected hospitals gave permission to access their patient charts. The goal was to review 230 charts in each teaching and large community hospital and 142 charts in each small community hospital, for a total sample of 3720 hospital admissions; this sample has the power to detect a real difference in AE rates of at least 3% between these types of hospitals, assuming an incidence of 9% (range 6.9%–11.1%, α= 0.05, β= 0.1). Sampling statistics were based on the UK study results6 and discussions with investigators there. Oversampling was carried out, with the expectation that 10% of charts would be unusable.
A random sample of hospital admissions (patient charts) for the fiscal year 2000 was selected by the Canadian Institute for Health Information (CIHI) for all participating hospitals except those in Quebec, where discharge data are not collected by CIHI. The sampling frame included all admissions for patients over 18 years old who had a minimum stay in hospital of 24 hours (or died within 24 hours after admission). Hospital admissions with a most responsible diagnosis related to obstetrics or psychiatry were excluded. In Quebec, we selected a sample from the list of hospital admissions at each participating hospital using a database of patient diagnoses and a sampling frame similar to that used for the CIHI data.
Definitions
We defined an AE as an unintended injury or complication that results in disability at the time of discharge, death or prolonged hospital stay and that is caused by health care management rather than by the patient's underlying disease process.2,4,5,7 We defined disability as temporary impairment of function lasting up to a year, permanent impairment of function or death. Health care management includes the actions of individual hospital staff as well as the broader systems and care processes and includes both acts of omission (failure to diagnose or treat) and acts of commission (incorrect diagnosis or treatment, or poor performance).
Data collection
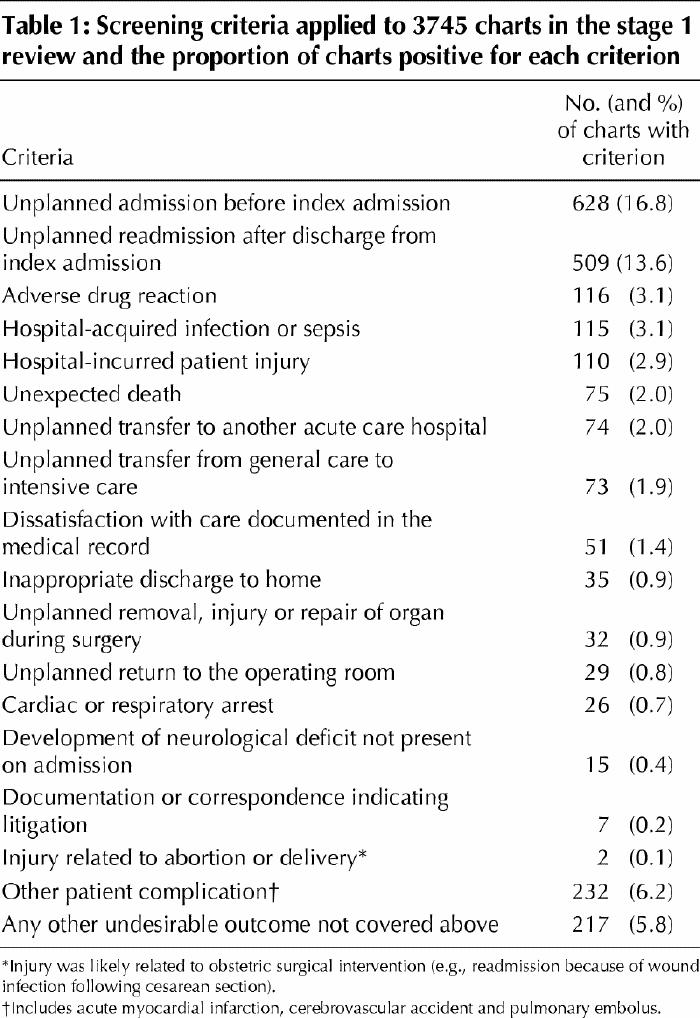
Data collection involved a 2-stage review of hospital charts according to previously described methods.2,6 To improve efficiency and data quality, the review forms were converted from paper-based instruments to electronic templates and installed on laptop computers. Information on the selection of stage 1 and stage 2 reviewers, their remuneration and the average time for chart audit is available in Appendix 1 (www.cmaj.ca/cgi/content/full/170/11/1678/DC1). In the first stage, nurses or health records professionals assessed each selected hospital chart for the presence of 1 or more of 18 screening criteria known to be sensitive to the occurrence of an AE (Table 1). Stage 1 reviewers also recorded the presence or absence of comorbid conditions.
Table 1
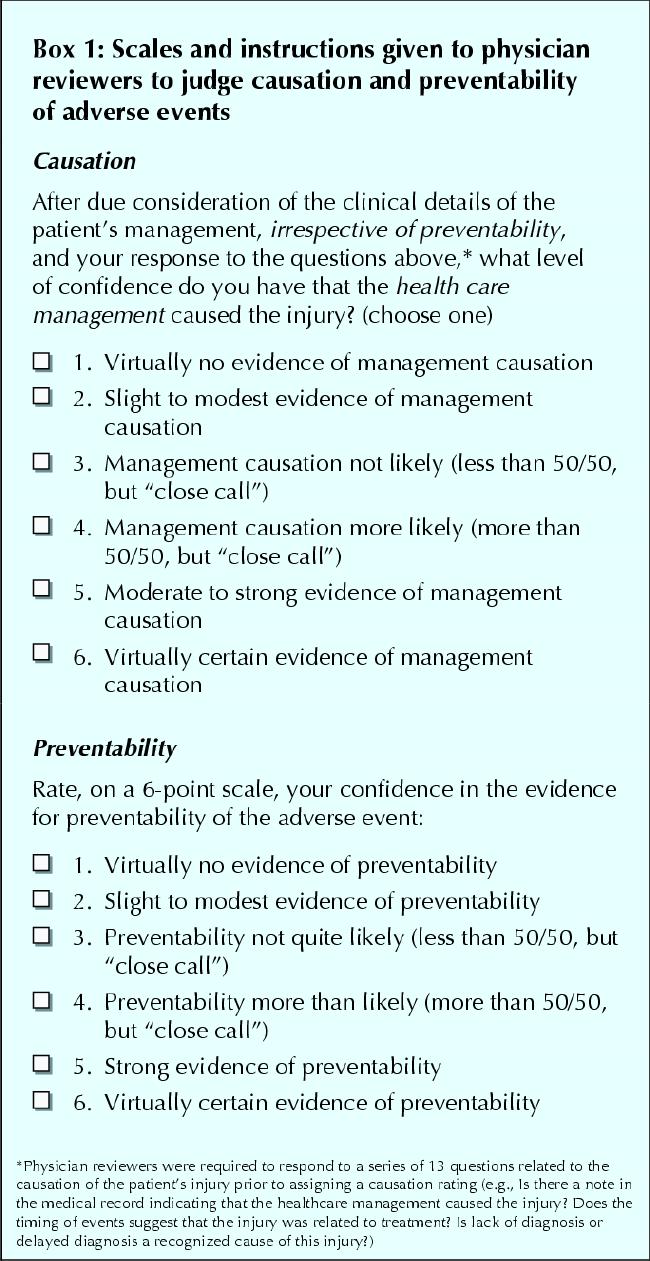
In stage 2, physicians reviewed charts that were positive for at least 1 screening criterion. They first identified the presence of any unintended injuries or complications. All injuries were classified according to any association with death, disability at discharge, prolongation of hospital stay, subsequent hospital admissions, interventions without sequelae or outpatient visits. Finally, the physician reviewers, using a 6-point scale (Box 1), determined the extent to which health care management, rather than the patient's disease process, was responsible for the injury. An injury or complication was identified as an AE if it was associated with death, disability at discharge or prolonged hospital stay and received a causation rating of at least 4 (i.e., rated as having more than a 50% likelihood of being caused by health care management). Using professional judgement, physician reviewers estimated the number of additional hospital days directly attributable to AEs. Physician reviewers were also asked to judge the preventability of each AE using a 6-point scale (Box 1). They were encouraged to seek advice from the physician leader or specialist colleagues whenever they needed additional knowledge to assess whether an AE had occurred and to assess its preventability.
Box 1.
Several efforts were made to improve on the moderate reliability associated with previously reported chart reviews.13 We developed a computerized data collection form to ensure complete data entry. Data were transferred regularly by phone to a computer at the coordinating centre to minimize data loss and transcription error. Provincial physician and nurse leaders underwent training and used a standard set of hospital charts and a training manual. Reviewer performance was evaluated on a national basis with the use of measures of interrater reliability before data collection was started. Reliability data were reported back to each province. At both stages of the review process, interrater reliability was also assessed on a random sample of 10% of the charts. The kappa statistic for the measurement of agreement on the 10% sample for the first stage of the review process (by nurses or health records professionals) was substantial, 0.70 (95% confidence interval [CI] 0.63– 0.76).14 Kappa scores for the measurement of agreement for the second stage of the review (by physicians) were moderate for each of several steps: determination of whether an injury had occurred, 0.47 (95% CI 0.35– 0.58); determination of whether the injury was caused by health care management, 0.45 (95% CI 0.33– 0.57); and determination of whether the event was preventable, 0.69 (95% CI 0.55–0.83).14 These kappa values were equivalent to, and in some cases better than, those recorded in studies using similar methodology.2,4,7
The timing of the AE in relation to the index hospital admission is an important methodological issue. We counted AEs that occurred during the index hospital admission and that were detected during either the index or subsequent hospital admissions over the following 12-month period. We also counted AEs that were related to hospital admissions within the 12 months preceding the index admission but that were not detected until the index admission. Only hospital admissions occurring in participating hospitals were evaluated.
National weighted point estimates and CIs for AEs were calculated using a 2-stage stratified sampling technique. First, we weighted results for the total number of charts per hospital. Next, we weighted observations for the total number of hospitals per type in each province. The calculation of the weighted proportions was determined by the sampling strategy and accounts for the 3 hospital types and the 2 stages of chart selection. The sampling weight was the inverse of the probability of being included in the sample owing to the sampling design. It was calculated as N/n, where N = the number of elements in the population and n = the number of elements in the sample. In a 2-stage design, it was calculated as f1 х f2, which means that the inverse of the sampling fraction for the first stage is multiplied by the inverse of the sampling fraction for the second stage. All CIs were calculated at the 95% level. The χ2 test for trend was used to compare AE rates among hospital types.
As noted earlier, stage 1 reviewers also collected information on the presence of 60 different comorbid conditions, disabilities or social factors as well as age and sex. Only 14 records were missing these data. We used backward stepwise logistic regression to calculate the risk of an AE across hospital peer groups on the basis of 8 of these factors, plus age and sex, that were significant in the final model (p < 0.10) (see Appendix 2 [available at www.cmaj.ca/cgi/content/full/170/11/1678/DC2]). This model was used to calculate expected AE rates and 95% CIs for each hospital peer group.
Demographic data, including length of stay, were provided by CIHI (by MED-ECHO in Quebec) for all of the patients in our sample. These sources and Manitoba Health also provided the numbers of hospital admissions in fiscal year 2000 for hospitals similar to those in our sample.
Ethics approval was received from the University of Toronto, the University of Alberta, the University of British Columbia, the University of Calgary, the Université de Montréal and Dalhousie University. In addition, approval from local institutional review boards was obtained from all participating hospitals requiring such review.
Results
Of the 4164 hospital admissions sampled from the participating hospitals, 3745 patient charts (89.9%) were eligible for a full screening by the stage 1 reviewers (Fig. 1). Of these, 1527 (40.8%) were assessed as positive for 1 or more screening criteria (Table 1) and were sent for detailed review by the physician reviewers.
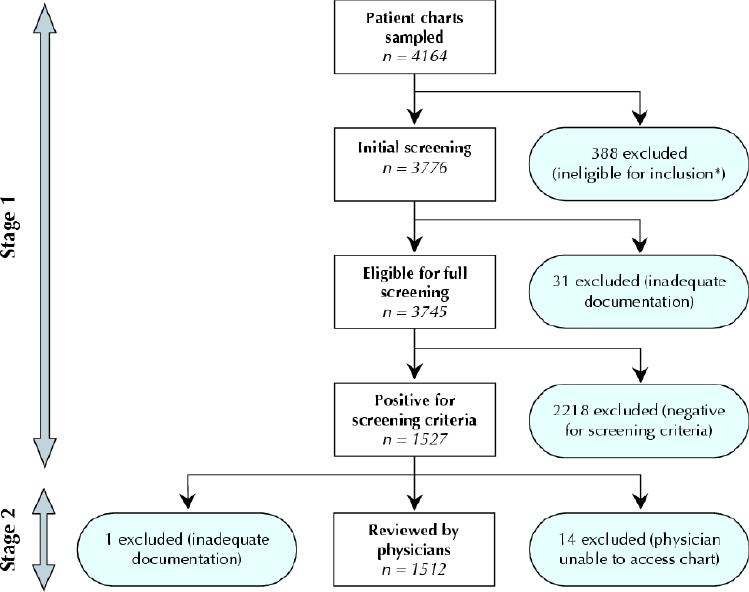
Fig. 1: Review process for the Canadian Adverse Events (AEs) Study. *Reasons for ineligibility were hospital stay less than 24 hours (n = 261), obstetrics patient (n = 56), patient transferred from other hospital (n = 48), cardiac arrest on arrival and subsequent death (n = 3), admission for rehabilitation or respite care (n = 2), psychiatric patient (n = 2), eligibility could not be determined (n = 16).
In stage 2, the physician reviewers identified a total of 1133 injuries or complications in 858 charts. In 401 (46.7%) of these charts the injuries resulted in death, disability at the time of discharge or prolonged hospital stay. In 255 of the charts one or more of the AEs were rated 4 or higher on the 6-point causation scale (Box 1). The total number of AEs in these charts was 289, and 27 (10.6%) of the charts indicated more than 1 AE. After weighting for the sample frame, the overall AE rate was 7.5% (95% CI 5.7%–9.3%).
The proportion of AEs by the timing of occurrence and detection relative to the index hospital admission is displayed in Fig. 2.
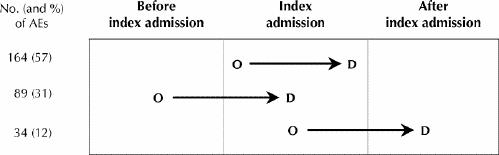
Fig. 2: Timing and occurrence of AEs relative to index hospital admission. Two of the 289 AEs were excluded because of incomplete timing data. O = occurrence, D = detection of AE.
There was a trend for AEs to occur more frequently in the teaching hospitals than in the large community or small hospitals (Table 2). The trend was significant for AEs across the 3 hospital types (p < 0.001) but not for preventable AEs (p = 0.8). When we adjusted for comorbidities, age and sex, the adjusted rate for teaching hospitals was significantly higher than the adjusted rate for the nonteaching hospitals (Table 2).
Table 2
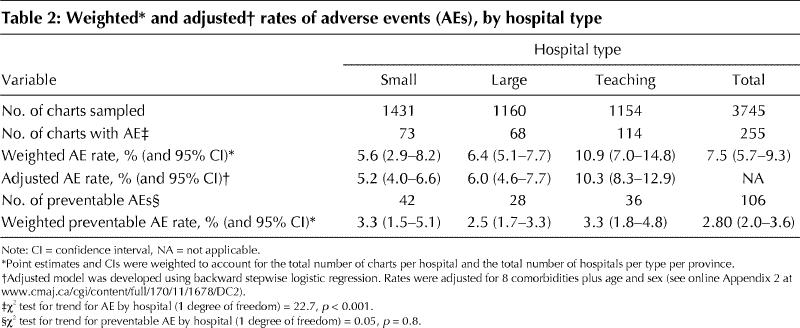
Of the 255 patients who experienced AEs, 106 (41.6%) were judged to have 1 or more AEs with a high preventability rating (4 or more on the 6-point preventability scale [Box 1]). In 39 (15.3%) of the 255 patients, preventability was judged to be “virtually certain.” A brief description of the clinical details of AEs occurring in the 255 patients, grouped according to the maximum preventability score, is provided in Appendix 3 (www.cmaj.ca/cgi/content/full/170/11/1678/DC3). When these results were adjusted for the sampling strategy, we calculated that highly preventable AEs occurred in 36.9% (95% CI 32.0%– 41.8%) of the patients with AEs. Similarly, death was estimated to have occurred in 20.8% (95% CI 7.8%– 33.8%) of those with AEs, and 9% of these AEs were judged to have been highly preventable. The weighted rate of preventable AEs was similar across all 3 hospital types, ranging from 2.5% in the large community hospitals to 3.3% in the small and teaching hospitals.
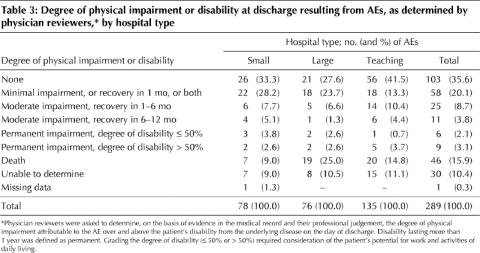
Most (64.4%) of the AEs resulted in no physical impairment or disability, or in minimal to moderate impairment with recovery within 6 months. However, 15 (5.2%) of the AEs resulted in permanent disability, and 46 (15.9%), occurring in 40 patients, resulted in death (Table 3). When these results were adjusted for the sampling strategy, we estimated that death would be associated with an AE in 1.6% of patients with similar hospitalizations in Canada. The rate of preventable AEs across all hospitals was 2.8% (95% CI 2.0%– 3.6%), and the rate of deaths from preventable AEs was 0.66% (95% CI 0.37%– 0.95%).
Table 3
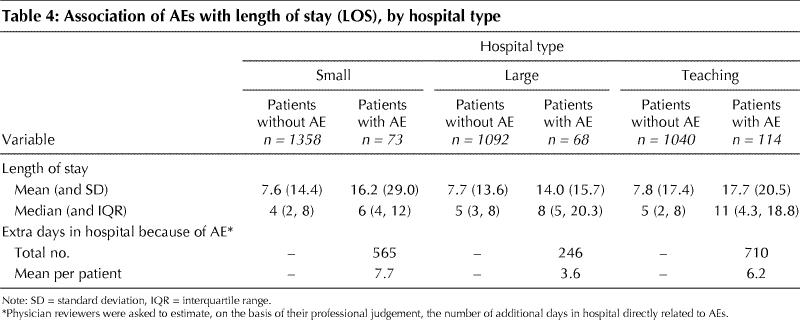
We found that patients who experienced AEs had longer stays in hospital than did those without AEs (Table 4). The physician reviewers, using their professional judgement, estimated that the 255 patients with AEs required an additional 1521 days in hospital directly related to their AEs.
Table 4
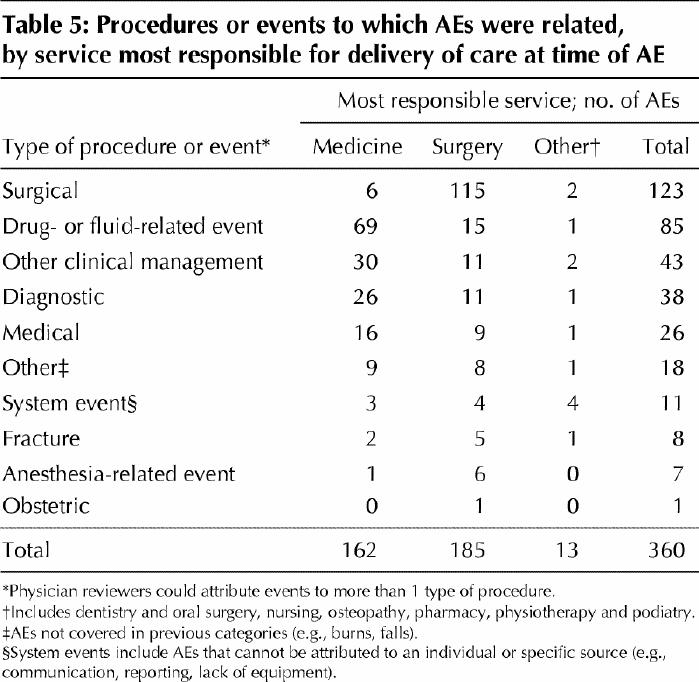
For 51.4% of the AEs, the service most responsible for the delivery of care was surgery, for 45.0% it was medicine and for 3.6% it was another service (e.g., dentistry, physical therapy, podiatry). The most common types of AEs were related to surgical procedures, and the next most common were associated with drug- or fluid-related events (Table 5). In the medicine service, AEs resulting from errors of omission (the failure to carry out necessary diagnosis or treatment) were more common than those resulting from errors of commission (57.1% v. 42.9%). In the surgery service, the frequency of these errors was assessed as being roughly equal (50.8% v. 49.2%).
Table 5
The mean age (and standard deviation) of patients was significantly higher among those experiencing an AE than among those who did not have an AE (64.9 [16.7] v. 62.0 [18.4] years; p = 0.016). There was no difference between female and male patients in their risk of AE.
Interpretation
Our study showed that an estimated 7.5% of patients admitted to acute care hospitals in Canada in the fiscal year 2000 experienced 1 or more AEs. We found that 36.9% of these patients were judged to have highly preventable AEs. Most of the patients who experienced an AE recovered without permanent disability; their AEs contributed to longer stays in hospital or temporary disability. However, a small but significant proportion of patients died or experienced a permanent disability as a result of their AEs. By extrapolation, our results suggest that, in 2000, between 141 250 and 232 250 of 2.5 million similar admissions to acute care hospitals in Canada were associated with an AE and that 9250 to 23 750 deaths from AEs could have been prevented.
The trend toward higher numbers of patients with AEs in teaching hospitals than in small or large community hospitals persisted after adjustment for comorbidities and age. Several factors may have accounted for this trend. First, the risk adjustment model does not fully account for true differences in the acuity of patient populations. Second, teaching hospitals may receive patients at different points in their care (e.g., complex conditions requiring treatment not available in small or large community hospitals) that place them at an increased risk of an AE regardless of their comorbidities. Third, the complexity of care in teaching hospitals means that patients may receive care from several different providers, which may increase the risk of AEs related to miscommunication and coordination of care. Fourth, the scope, depth and focus of documentation in patients' records may differ across hospital types. Finally, the quality of care in teaching hospitals may be lower. However, the fact that the rate of preventable AEs did not differ significantly across the 3 types of hospitals suggests that this last option is not the case.
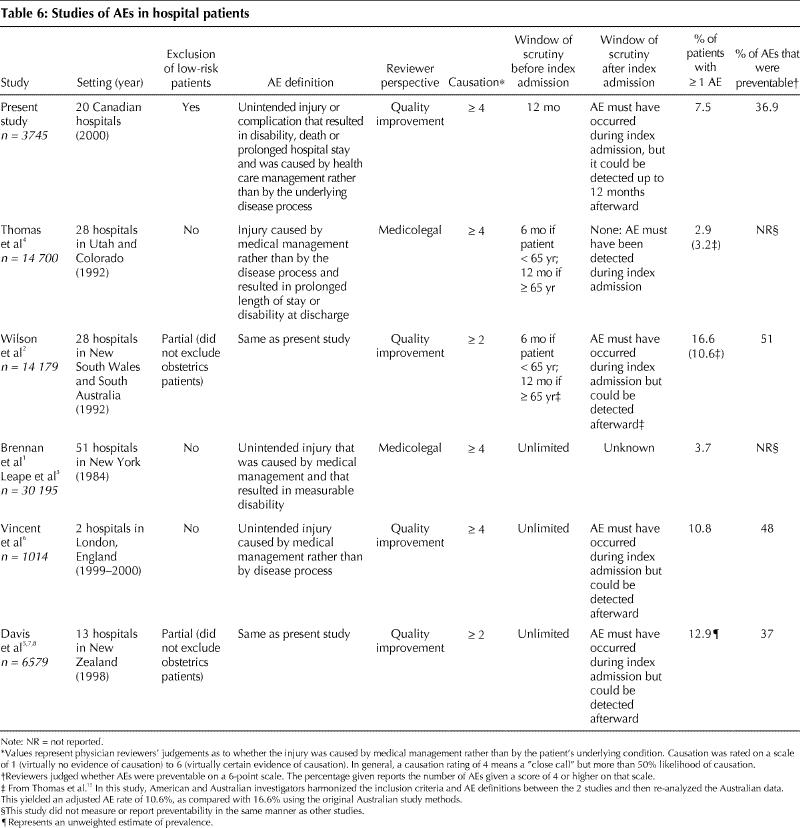
The AE rate of 7.5% in our study is lower than the rates reported in several other large studies of AEs outside of the United States (Table 6). In the recent New Zealand study7 the AE rate was 12.9% among patients admitted to hospital. In the Quality in Australian Health Care Study,2 the AE rate was 16.6%; however, the study included AEs that could be linked to any previous hospital admission as well as those that occurred in the index hospital admission but were discovered in any subsequent hospital admission. Two large US studies1,3,4 found an incidence of 3.7% and 2.9% respectively. However, the study in Utah and Colorado4 counted only AEs that occurred and were discovered during the index hospital admission. When the results from the Australian study were recalculated using the methods from the Utah/Colorado study, the Australian rate was found to be 10.6% and the Utah/Colorado rate 3.2%.15 The emphasis in the US studies on finding negligence and the emphasis in other studies on preventability and quality improvement may also have contributed to the lower US rates. Interestingly, the UK study, based in 2 teaching hospitals,6 identified an AE rate that was nearly identical to the unadjusted rate identified in the 5 teaching hospitals in our study (10.8% and 10.9% respectively). The number of AEs associated with death or permanent disability in our study was similar to the numbers in the UK, New Zealand and Australian studies.
Table 6
Our study had several limitations beyond those associated with retrospective chart reviews. Budget constraints limited the study to 20 hospitals in 5 provinces, and thus generalizability to other provinces is unknown. Furthermore, we did not study AE rates in very small or remote hospitals or in hospitals in northern Canada. We included only adult patients in acute care general hospitals and excluded those with a most responsible diagnosis in obstetrics or psychiatry. Patients who receive their care in other settings may have different experiences. The kappa values for reviewer performance were equivalent to, and in some cases better than, those recorded in studies using similar methodology; the kappa values indicated only moderate agreement among physicians in assessing injury, preventability and the contribution of health care management to AEs. The additional length of stay attributed to the AEs was based on the physician reviewers' professional opinions and interpretation of the patient charts and not on the use of a scale, as was done for their judgement of causation and preventability.
Our study provides a starting point for understanding the incidence of AEs and the burden of injury resulting from AEs in Canadian acute care hospitals. However, additional work is needed to explore the types of AEs and their contributing factors. Given the distribution of AEs in this study, efforts to improve medication safety and surgery are likely to play an important role in improving patient safety in Canadian hospitals. Additional research is also needed into the incidence and types of AEs beyond the acute care hospital setting. Health care organizations have historically focused on identifying and disciplining clinicians who were closest to incidents. However, experts suggest that the greatest gains in improving patient safety will come from modifying the work environment of health care professionals, creating better defences for averting AEs and mitigating their effects.16,17,18 Efforts to make patient care safer will require leadership to encourage the reporting of AEs, continued monitoring of the incidence of these events, the judicious application of new technologies and improved communication and coordination among caregivers.
β See related article page 1688
Supplementary Material
Acknowledgments
The following people were responsible for physician, nurse and health record professional training, hospital recruitment, obtaining local ethics approval and overall coordination of their provincial study component. We extend our sincere gratitude to them for their leadership and particularly their partnership in this research study: Brenda Brownell and Dr. Ron Gregor (Nova Scotia); Dr. Richard Clermont and Daphney St-Germain (Québec); Fatima Chatur and Dr. Peter Hamilton (Alberta); and Karen Cardiff, Dr. Iain Mackie and Dr. Mark Fitzgerald (British Columbia). We extend our sincere thanks to the following individuals for their dedication to the study and assistance in collecting the data upon which this study is based: Brenda Brownell, Kelly Goudey and Celeste Latter (Nova Scotia); Evelyne Jean, Cécile Lavoie, Julie Robindaine and Daphney St-Germain (Québec); Wilhelmine Jones and Elaine Thiel (Ontario); Fatima Chatur and Carolyn Nilsson (Alberta); and Karen Cardiff, Cheryl Marr and Eva Somogyi (British Columbia). Drs. Tom Casey, John Fraser, Ron Gregor and Allan Shlossberg (Nova Scotia); Drs. Edouard Bastien, Richard Clermont and André Rioux (Québec); Drs. Peter Kopplin and David MacPherson (Ontario); Drs. Leslie Cunning, Peter Hamilton and Narmin Kassam (Alberta); Drs. Robert Crossland, Iain Mackie, Jacob Meyerhoff and Robert Wakefield (British Columbia). We also gratefully acknowledge the support and assistance provided by the 20 hospital corporations participating in the study and their health record departments for providing access to the hospital charts reviewed for the study. We also thank Ruth Croxford and Carey Levinton for their assistance with statistical modelling.
Footnotes
This article has been peer reviewed.
Contributors: All investigators contributed to the design and execution of the study. Ross Baker and Peter Norton conceived of and designed the study and provided ongoing monitoring. Ross Baker interpreted the data and drafted the article. Peter Norton, Adalsteinn Brown, William Ghali and Luz Palacios-Derflingher analyzed and contributed to the interpretation of the data. Virginia Flintoft was the study manager primarily responsible for the day-to-day operations of the national study. She contributed to the design of the study instrument, the project manual, software development and manuscript revision. Régis Blais, Jafna Cox, Ed Etchells, William Ghali, Sumit Majumdar, Maeve O'Beirne, Robert Reid, Sam Sheps and Robyn Tamblyn were responsible for the acquisition of provincial data. All of the authors revised the draft critically for important intellectual content and approved the final version.
This project was funded by a grant from the Canadian Institute for Health Information and the Canadian Institutes for Health Research (CIHR). Ross Baker, Peter Norton, Régis Blais, Adalsteinn Brown, Philip Hébert, Maeve O'Beirne and Sam Sheps received no funds from private sources before, during or after the conduct of this study. Jafna Cox receives salary support from a CIHR/Regional Partnership Program Investigator Award and a Clinical Research Scholarship from the Faculty of Medicine, Dalhousie University. Ed Etchells is supported by the Sunnybrook and Women's College Health Sciences Centre Innovations Fund. William Ghali is supported by a Government of Canada Research Chair in Health Services Research and by a Health Scholar Award from the Alberta Heritage Foundation for Medical Research. Sumit Majumdar is a Population Health Investigator supported by the Alberta Heritage Foundation for Medical Research and a New Investigator supported by the CIHR. Robert Reid was supported by the Michael Smith Foundation for Health Research and by Group Health Cooperative. Robyn Tamblyn is a CIHR-funded scientist.
Competing interests: Most of the authors (Baker, Norton, Flintoft, Blais, Etchells, Ghali, Hébert, Majumdar, O'Beirne, Sheps, Tamblyn) received support from the Canadian Institute for Health Information and the Canadian Institutes of Health Research for travel and accommodation at study-related stakeholder meetings.
Correspondence to: G. Ross Baker, Department of Health Policy, Management and Evaluation, University of Toronto, McMurrich Building, Rm. 2031, 12 Queen's Park Cres. W, Toronto ON M5S 1A8; fax 416 978-7350; ross.baker@utoronto.ca
References
- 1.Brennan TA, Leape LL, Laird NM, Hebert L, Localio AR, Lawthers AG, et al. Incidence of adverse events and negligence in hospitalized patients. Results of the Harvard Medical Practice Study I. N Engl J Med 1991;324(6):370-7. [DOI] [PubMed]
- 2.Wilson RM, Runciman WB, Gibberd RW, Harrison BT, Newby L, Hamilton JD. The Quality in Australian Health Care Study. Med J Aust 1995; 163 (9): 458-76. [DOI] [PubMed]
- 3.Leape LL, Brennan TA, Laird N, Lawthers AG, Localio AR, Barnes BA, et al. The nature of adverse events in hospitalized patients. Results of the Harvard Medical Practice Study II. N Engl J Med 1991;324(6):377-84. [DOI] [PubMed]
- 4.Thomas EJ, Studdert DM, Burstin HR, Orav EJ, Zeena T, Williams EJ, et al. Incidence and types of adverse events and negligent care in Utah and Colorado. Med Care 2000;38(3):261-71. [DOI] [PubMed]
- 5.Davis P, Lay-Yee R, Briant R, Schug S, Scott A, Johnson S, et al. Adverse events in New Zealand public hospitals: principal findings from a national survey. Wellington: NZ Ministry of Health; 2001. Occasional Paper no 3. Available: www.moh.govt.nz/publications/adverseevents (accessed 2004 Apr 28).
- 6.Vincent C, Neale G, Woloshynowych M. Adverse events in British hospitals: preliminary retrospective record review [published erratum in BMJ 2001;322: 1395]. BMJ 2001;322(7285):517-9. [DOI] [PMC free article] [PubMed]
- 7.Davis P, Lay-Yee R, Briant R, Ali W, Scott A, Schug S. Adverse events in New Zealand public hospitals I: occurrence and impact. N Z Med J 2002; 115 (1167): U271. [PubMed]
- 8.Davis P, Lay-Yee R, Briant R, Ali W, Scott A, Schug S. Adverse events in New Zealand public hospitals II: preventability and clinical context. N Z Med J 2003; 116(1183):U624. [PubMed]
- 9.Schioler T, Lipczak H, Pedersen BL, Mogensen TS, Bech KB, Stockmarr A, et al; Danish Adverse Event Study. [Incidence of adverse events in hospitals. A retrospective study of medical records]. Ugeskr Laeger 2001;163(39):5370-8. [PubMed]
- 10.Hunter D, Bains N. Rates of adverse events among hospital admissions and day surgeries in Ontario from 1992 to 1997. CMAJ 1999;160(1):1585-6. [PMC free article] [PubMed]
- 11.Forster AJ, Clark HD, Menard A, Dupuis N, Chernish R, Chandok N, et al. Adverse events among medical patients after discharge from hospital. CMAJ 2004; 170(3):345-9. [PMC free article] [PubMed]
- 12.Wanzel KR, Jamieson CG, Bohnen JM. Complications on a general surgery service: incidence and reporting. Can J Surg 2000;43(2):113-7. [PMC free article] [PubMed]
- 13.Localio AR, Weaver SL, Landis JR, Lawthers AG, Brenhan TA, Hebert L, et al. Identifying adverse events caused by medical care: degree of physician agreement in a retrospective chart review. Ann Intern Med 1996;125(6):457-64. [DOI] [PubMed]
- 14.Landis JR, Koch GG. The measurement of observer agreement for categorical data. Biometrics 1977;33(1):159-74. [PubMed]
- 15.Thomas EJ, Studdert DM, Runciman WB, Webb RK, Sexton EJ, Wilson RM, et al. A comparison of iatrogenic injury studies in Australia and the USA. I: Context, methods, casemix, population, patient and hospital characteristics. Int J Qual Health Care 2000;12(5):371-8. [DOI] [PubMed]
- 16.Reason J. Human error: models and management. BMJ 2000;320(7237):768-70. [DOI] [PMC free article] [PubMed]
- 17.Weick KE, Sutcliffe KM. Managing the unexpected: assuring high performance in an age of complexity. San Francisco (CA): Jossey-Bass; 2001.
- 18.Leape LL. A systems analysis approach to medical error. J Eval Clin Pract 1997; 3 (3):213-22. [DOI] [PubMed]
Associated Data
This section collects any data citations, data availability statements, or supplementary materials included in this article.