

Abstract
To investigate the effects of a critical enzyme, cerebroside sulfotransferase (CST), involving sulfatide biosynthesis on lipid (particularly sphingolipid) homeostasis, herein, we determined the lipidomes of brain cortex and spinal cord from CST null and heterozygous (CST−/− and CST+/−, respectively) mice in comparison to their wild type littermates by multi-dimensional mass spectrometry-based shotgun lipidomics. As anticipated, we demonstrated the absence of sulfatide in the tissues from CST−/− mice and found that significant reduction of sulfatide mass levels was also present, but in an age-dependent manner, in CST+/− mice. Unexpectedly, we revealed that the profiles of sulfatide species in CST+/− mice were significantly different from that of littermate controls with an increase in the composition of species containing saturated and hydroxylated fatty acyl chains. Contrary to the changes of sulfatide levels, shotgun lipidomics analysis did not detect significant changes of the mass levels of other lipid classes examined. Taken together, shotgun lipidomics analysis demonstrated anticipated sulfatide mass deficiency in CST defect mouse brain and revealed novel brain lipidome homeostasis in these mice. These results might provide new insights into the role of CST in myelin function.
Keywords: Alzheimer’s disease, cerebroside sulfotransferase, neurolipidome, shotgun lipidomics, sphingolipidomics, sulfatide
Introduction
Sulfatide is a class of sulfated galactocerebrosides. Sulfatide plays many critical roles in biological processes, including regulation of cell growth, protein trafficking, signal transduction, cell adhesion, neuronal plasticity, and cell morphogenesis [1, 2]. Sulfatide are almost exclusively synthesized by oligodendrocytes in the central nervous system (CNS) and are present predominantly in the myelin sheath surrounding axons [3].
Altered mass levels of sulfatide in human brain are involved in the pathogenesis of various human diseases. Accumulation of sulfatide due to a sulfatidase (Scheme 1) deficiency, is responsible for metachromatic leukodystrophy, in which there are encephalopathy, long tract signs, and degeneration of CNS myelin [4, 5]. Other researchers and we revealed that sulfatide is severely deficient at all stages of Alzheimer’s disease examined [6, 7]. Our mechanistic studies revealed that apolipoprotein E is associated with sulfatide trafficking, metabolism, and homeostasis in an isoform-dependent manner [8, 9].
Scheme 1.
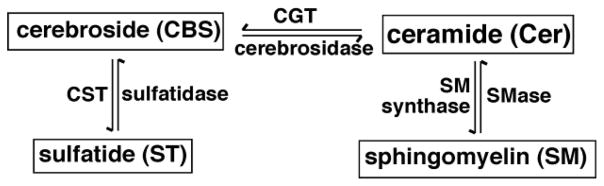
A schematic network of the sphingolipids which might be affected with CST gene disruption.
Sulfatide deficient mouse model has been generated through disrupting the gene that encodes ceramide sulfotransferase (CST), the key enzyme that catalyzes the conversion of cerebroside to sulfatide (Scheme 1) [10]. These mice with age showed axonal swellings, thinner myelin sheaths, deteriorated nodal structure, myelin vacuolar degeneration, as well as significantly reduced axon caliber and circularity [10, 11]. These observations strongly indicate that sulfatide is not critical for CNS development but is essential for proper CNS maintenance [11]. Intriguingly, it has been found that the disruption of this gene less affects the peripheral nervous system in comparison to the CNS [12].
However, many issues related to lipid homeostasis in the CST defect animal model remain elusive. These include what is the mass level of sulfatide in CST heterozygous (CST+/−) mice, whether the homeostasis of other lipid classes is affected by this disruption, how the mass levels of sulfatide as well as other lipids are changed with age (if present), among others. In the current study, we aimed to investigate the effects of CST gene disruption on brain lipid homeostasis by multi-dimensional mass spectrometry-based shotgun lipidomics (MDMS-SL) [13–15]. We were able to determine the lipidomes of brain cortex and spinal cord from CST−/− and CST+/− mice in comparison to their wild type (WT) littermate controls at different ages. As anticipated, we demonstrated that sulfatide in both spinal cord and cortex of CST−/− mice was absent. We also found that substantial reduction of sulfatide mass levels was present after 2 weeks of age. Unexpectedly, we revealed the presence of significantly different profiles of sulfatide species in CST+/− mice in comparison to that of WT littermate controls. Specifically, the composition of sulfatide species containing either saturated or hydroxylated fatty acyl chains was higher in CST+/− mice than that of WT littermates. Contrary to the changes of sulfatide levels and composition, shotgun lipidomics analysis did not detect significant changes of the other lipid classes examined. These results might provide new insights into the role of CST gene and its resultant sulfatide in myelin function and provide foundation for using the animal model to further study the molecular mechanism underlying sulfatide deficiency in the CNS.
Materials and Methods
Materials
All synthetic phospholipids, N-lauroryl sphingomyelin (N12:0 SM), and N-heptadecanoyl ceramide (N17:0 Cer) were purchased from Avanti Polar Lipids, Inc. (Alabaster, AL). Semisynthetic N-palmitoyl sulfatide (N16:0 sulfatide) and N-pentadecanoyl cerebroside (N15:0 CBS) were obtained from Matreya, Inc. (Pleasant Gap, PA). It should be pointed out that, herein, the prefix “N” denotes the amide linkage in sphingolipid molecular species. All of the solvents were obtained from Burdick and Jackson (Honeywell International Inc., Muskegon, MI). All other chemical reagents were at least analytical grade or the best grade available and obtained from Fisher Scientific (Pittsburgh, PA), Sigma-Aldrich Chemical Company (St. Louis, MO), or as indicated.
CST Mice Genotyping
CST deficient and WT mice were produced from heterozygote x heterozygote breeders and offspring were genotyped by polymerase chain reaction (PCR) as previously described [10] with modification. We did not see any unexpected ratio of offspring with different genotypes. Briefly, mice tails, ear punches, and/or other organ tissues were collected and genomic DNA was extracted using DNeasy Blood & Tissue Kit (Qiagen). Mice were genotyped by PCR using GoTaq Green Master Mix (Promega), two sets of primers (CST-WT-1, CAACAGGGCCACAGTAAGGT; CST-WT-2, CAGGTCCCCTGATACTGGAA; CST-KO-1, TCGCCTTCTTGACGAGTTCT; and CST-KO-2, CCCAGATCGAAGAAGAGCAG), and 20 ng of each individual’s genomic DNA. One set of primers (CST-WT-1 and CST-WT-2) was designed to amplify a ~750 bp region of the CST gene and a second set of primers (CST-KO-1 and CST-KO-2) was designed to amplify a ~370 bp region of the cassette disrupting the CST gene. PCR products were separated by electrophoresis with a 2% agarose gel with ethidium bromide and were visualized in a ChemiDoc MP System (BioRad).
Animal Studies and Tissue Collection
WT and CST deficient mice on a C57BL/6J background were utilized in this study. At the indicated age, animals were euthanized by asphyxiation with CO2. Brain regions and spinal cords were immediately dissected and frozen on dry ice before analysis. The tissue wafers were pulverized into a fine powder with a stainless-steel mortar and pestle. The protocols for animal experiments were conducted in accordance with the “Guide for the Care and Use of Laboratory Animals” (8th edition, National Research Council of the National Academies, 2011) and were approved by the Animal Studies Committee of Sanford-Burnham Medical Research Institute.
Preparation of Lipid Extracts from Brain Samples
A powder sample (approximately 25 mg) from each dissected brain tissue or spinal cord was weighed and further homogenized in 0.3 ml of ice-cold diluted (0.1x) phosphate-buffered saline with a Potter-Elvehjem tissue grinder. Protein assays on each individual homogenate were performed. Lipids were extracted by a modified Bligh and Dyer as described previously [16, 17] in the presence of internal standards which were in a pre-mixed solution for global lipid analysis and included N12:0 SM (2.73 nmol/mg protein), N17:0 Cer (1.05 nmol/mg protein), N16:0 sulfatide (3.08 nmol/mg protein), and N15:0 CBS (8 nmol/mg protein) for brain cortical samples. The amount of internal standards used for spinal cord samples were 1.5 times of those added to cortex. Other necessary internal standards for quantitation of individual molecular species of other lipid classes were also added to each brain tissue sample based on protein concentration prior to lipid extraction. Thus, the lipid content could be normalized to the protein content and quantified directly. These internal standards were selected because they represent ≪ 1% of endogenous cellular lipid molecular species present as demonstrated by electrospray ionization mass spectrometry (ESI-MS) lipid analysis without addition of these internal standards. A part of each lipid extract was treated with lithium methoxide for sphingolipid analysis as previously described [18] in certain cases. Each treated solution was finally reconstituted with a volume of 400 μl/mg of tissue protein in 1:1 chloroform/methanol. All lipid solutions were finally flushed with nitrogen, capped, and stored at −20 °C for ESI-MS (typically analyzed within one week).
Mass Spectrometric Analysis of Lipids
A triple-quadrupole mass spectrometer (Thermo Scientific TSQ Quantum Ultra Plus, San Jose, CA) equipped with a Nanomate device (Advion Bioscience Ltd., Ithaca, NY) and Xcalibur system software was utilized in the study as previously described [14, 19]. The diluted lipid extract was directly infused into the ESI source through the Nanomate device [19]. Typically, a 1-min period of signal averaging in the profile mode was employed for each MS spectrum. For tandem mass spectrometry, a collision gas pressure was set at 1.0 mTorr, but the collision energy varied with the classes of lipids as described previously [13, 14]. Typically, a 2 to 5-min period of signal averaging in the profile mode was employed for each tandem MS mass spectrum. All mass spectra and tandem MS mass spectra were automatically acquired by a customized sequence subroutine operated under Xcalibur software. Sulfatide was analyzed by matrix-assisted laser desorption/ionization time-of-flight mass spectrometry (MALDI-TOF/MS) as previously described [20]. Data processing including ion peak selection, baseline correction, data transfer, peak intensity comparison, 13C de-isotoping, and quantitation were conducted using a custom programmed Microsoft Excel macros as described previously [14] after considering the principles of lipidomics [21].
Miscellaneous
Protein concentration was determined with a bicinchroninic acid protein assay kit (Pierce, Rockford, IL, USA) using bovine serum albumin as a standard. Quantitative data were normalized to protein content and were presented as the means ± SD. Differences between mean values were determined by an unpaired Student’s t tests. *p < 0.05 was considered significant.
Results
Sulfatide was Absent or Deficient in CST−/− or CST+/− Mouse Brain, Respectively
All animals were genotyped by PCR. A representative gel used for genotyping was shown in Fig. 1, demonstrating only the smallest size amplicon (~370 band) in CST null mice, only the biggest size amplicon (~750 bp) in WT control littermates, and both bands present in heterozygous mice.
Figure 1.
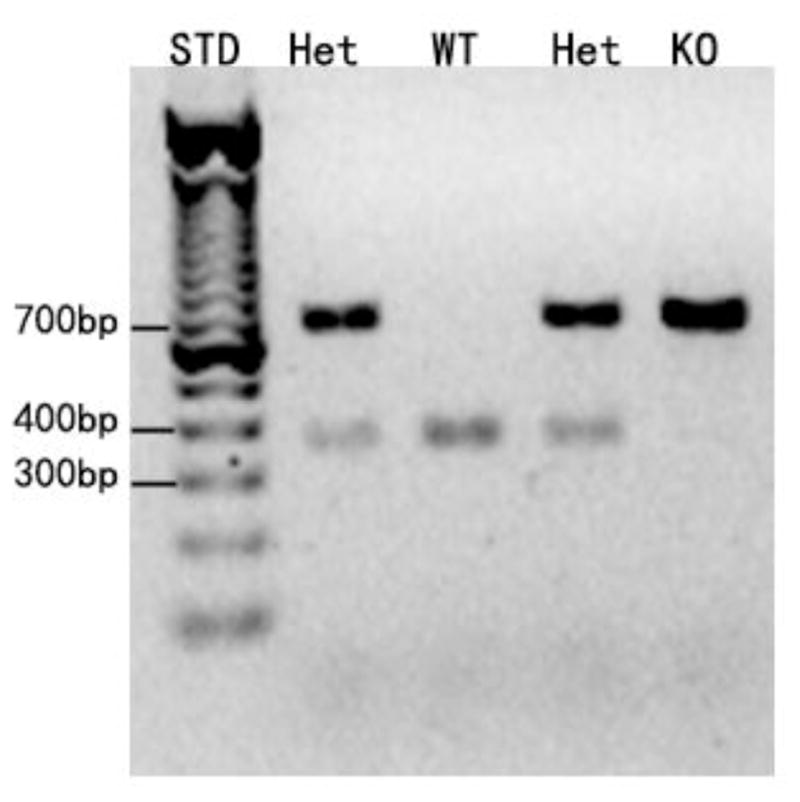
Representative demonstration of genotyping. Genomic DNA was isolated from ear snips and amplified by PCR using specific primers. The PCR products were separated by agarose gel electrophoresis and visualized by ethidium bromide. STD, WT, Het, and KO stand for standard, wild type, heterozygous, and knockout, respectively.
As anticipated, MALDI-TOF/MS analysis of lipid extracts from spinal cord of WT, CST+/− or CST−/− mice at the 48 days of age demonstrated the absence or significant reduction of sulfatide in CST−/− or CST+/− mice, respectively, in comparison to their WT littermate control (Fig. 2). Similar observations were also obtained from the MALDI-TOF/MS analysis of lipid extracts from brain cortices of WT, CST+/− or CST−/− mice (Fig. 3) although the total mass levels of sulfatide in brain cortices of WT mice were much lower than those of spinal cord (see below).
Figure 2.

Negative-ion MALDI-TOF/MS analysis of lipid solutions of spinal cord from CST null, CST heterozygous, and their wild type littermates. Spinal cord lipid extracts of the wild type littermate controls (Panel A), CST heterozygous (Panel B), and CST null (Panel C) mice at 48 days of age were prepared by a modified Bligh and Dyer procedure. MALDI mass spectrometric analysis of the lipid extracts was performed with 9-aminoacridine as matrix as described under “Materials and Methods”. Mass spectra are displayed after normalization to the internal standard (IS) peaks (i.e., the peaks corresponding to IS are equally intense in each spectrum) for direct comparisons. PS and PI stand for phosphatidylserine and phosphatidylinositol, respectively.
Figure 3.

Negative-ion MALDI-TOF/MS analysis of lipid solutions of brain cortices from CST null, CST heterozygous, and their wild type littermates. Brain cortex lipid extracts of the wild type littermate controls (Panel A), CST heterozygous (Panel B), and CST null (Panel C) mice at 48 days of age were prepared by a modified Bligh and Dyer procedure. MALDI mass spectrometric analysis of the lipid extracts was performed with 9-aminoacridine as matrix as described under “Materials and Methods”. Mass spectra are displayed after normalization to the internal standard (IS) peaks (i.e., the peaks corresponding to IS are equally intense in each spectrum) for direct comparisons. PS and PI stand for phosphatidylserine and phosphatidylinositol, respectively.
Intriguingly, MALDI-TOF/MS analysis of lipid extracts from both spinal cord and cortex demonstrated a significant difference of molecular species profile between heterozygous and WT mice. For example, the peak intensity ratios of the ions at m/z 888.7 and 890.7, corresponding N24:1 and N24:0 sulfatide, respectively, were significantly different between CST+/− and WT mice (Figs. 2 and 3). Specifically, the ratios were 1.23 ± 0.17 and 1.46 ± 0.05 (p < 0.01) in CST+/− and WT mouse spinal cord, respectively, and the ratios were 1.15 ± 0.07 and 1.43 ± 0.03 (p < 0.001) in CST+/− and WT mouse brain cortices, respectively. Similar results were also obtained from other pairs of corresponding species containing unsaturated vs. saturated fatty acyl chains. This observation revealed that the composition of sulfatide species containing saturated acyl chains was increased. For example, the total percentage of sulfatide species containing saturated acyl chains in brain cortex was increased from (34.90 ± 1.13)% in WT mice to (40.07 ± 0.96)% in CST+/− mice (p = 0.00046). These results implicated that the reduced mass levels of sulfatide in CST+/− mice were compensated through increases in the content of sulfatide species containing saturated fatty acyl chains.
Moreover, MALDI-TOF/MS analysis of lipid extracts from spinal cord also demonstrated a significant increase in composition of sulfatide molecular species containing hydroxy moiety at the α-position of fatty acyl chains in CST+/− mice ((31.33 ± 0.74)%) relative to that in WT controls ((27.38 ± 2.04)%) (p = 0.02). A similar tendency was also found in brain cortex, but the difference was relatively smaller than in spinal cord.
Deficiency in Sulfatide Content in CST+/− Mouse Brain Varied with Age
In the study, we also determined the effects of CST gene disruption on the sulfatide levels with age since myelination is essentially developed after birth [22, 23]. Inconsistent with myelination at the brain development stage, we found sulfatide content in spinal cord was very low at the 8 days of age, accounting for less than 10% of the content relative to those of matured animals in WT controls (Fig. 4A). Sulfatide content rapidly increased with age after birth and reached a plateau around the 48 days of age which was maintained by both CST+/− and WT mice through 110 days of age.
Figure 4.

Temporal changes in the contents of total sulfatides in lipid extracts of spinal cord and cortices from CST null, CST heterozygous, and their wild type littermates. Lipid extracts of both spinal cord (Panel A) and brain cortices (Panel B) from CST null, CST heterozygous, and their wild type littermates at different ages were prepared using a modified Bligh and Dyer method. The content of individual sulfatide molecular species after identification was determined in comparison to the selected internal standard after 13C de-isotoping as described under “Materials and Methods”. The data points represent means ± SD from separate preparations of at least four different animals. *p < 0.05 and **p < 0.01 compared to WT controls.
In comparison to those of WT mouse spinal cord, the sulfatide mass levels present in CST+/− mouse spinal cord were essentially identical at the very young age (i.e., 8 days). The difference became significant between the groups at day 16 and this difference was maintained with ages examined (Fig. 4A). Moreover, we also found that the compensated composition of sulfatide species containing either saturated or hydroxylated fatty acyl chains was increased as sulfatide content decreased with age.
As anticipated, lower content of sulfatide in brain cortices in comparison to that in spinal cord was obtained at all ages examined. In addition, the increased sulfatide mass levels in brain cortex occurred much later relative to that in spinal cord. We found that a drastic increase in sulfatide levels occurred after day 24 in cortex instead of prior to day 16 in spinal cord (Fig. 4B). The sulfatide mass levels in brain cortex of CST+/− mice became very different from those of their littermate controls after day 48 (Fig. 4B). Similar to the observations in spinal cord, the composition of sulfatide species containing either saturated or hydroxylated fatty acyl chains increased to compensate the reduction of sulfatide mass in cortices of CST+/− mice relative to that of WT controls as aforementioned.
The Effects of CST Gene Disruption on the Mass Levels of Other Examined Sphingolipids
To examine the effects of CST gene disruption on the mass levels of other sphingolipid classes, we selectively analyzed the sphingolipid classes which might be closely associated with sulfatide metabolism and homeostasis (Scheme 1) in both spinal cord and brain cortex by using MDMS-SL. Essentially, we found that the mass levels and composition of all examined sphingolipid classes within experimental errors were not affected with the CST gene disruption.
Cerebroside is the substrate of sulfatide biosynthesis catalyzed by the CST activity. MDMS-SL analysis of cerebroside (CBS) in spinal cord of WT controls demonstrated that the mass levels of CBS basically reached plateau at day 24 (Fig. 5A). We found that the mass levels of CBS were not significantly different among the WT, CST+/−, and CST−/− mouse groups at the ages examined (Fig. 5A), indicating that the effects of CST gene disruption on CBS homeostasis were minimal. Similarly, the mass levels of SM and Cer in CST deficient mice were also identical to those of WT littermates within experimental errors, except the Cer content in spinal cord of CST−/− mice was constantly lower than those of WT and CST+/− mice with an unknown reason (Fig. 5B and 5C).
Figure 5.

Temporal changes in the contents of sphingolipid classes in lipid extracts of spinal cord from CST null, CST heterozygous, and their wild type littermates. Lipid extracts of spinal cords from CST null (KO), CST heterozygous (Het.), and their wild type littermate (WT) mice at different ages were prepared using a modified Bligh and Dyer method. The content of individual molecular species of cerebroside (Panel A), sphingomyelin (Panel B), and ceramide (Panel C) after identification was determined in comparison to the selected internal standard after 13C de-isotoping by using MDMS-SL as described under “Materials and Methods”. The total mass levels of individual lipid class represent the sum of the content of individual species of the class. The data points represent means ± SD from separate preparations of at least four different animals. **p < 0.01 compared to WT controls
MDMS-SL was also employed to analyze sphingolipid species present in cortices of WT, CST+/−, and CST−/− mice at different ages. As anticipated, the mass content and composition of those sphingolipid species in cortices were very different from the corresponding ones present in spinal cord. However, similar to those determined from spinal cord of WT, CST+/−, and CST−/− mice, the effects of CST gene disruption on the homeostasis of all examined sphingolipid classes were minimal (Data not shown).
The Effects of CST Gene Disruption on the Mass Levels of Selected Phospholipid Classes
In the study, we also examined the effects of CST gene disruption on the mass content and composition of phospholipid classes and subclasses (choline glycerophospholipid (PC), ethanolamine glycerophospholipid, phosphatidylglycerol, phosphatidylinositol, phosphatidylserine, phosphatidic acid, and lysoPC) present in both spinal cord and brain cortex by using MDMS-SL. As anticipated, the effects of CST gene disruption on the homeostasis of all examined phospholipid classes were minimal. Figure 6 displayed the mass levels of a few representative phospholipid classes at different ages (see below for further discussion).
Figure 6.

Temporal changes in the mass levels of representative phospholipid classes in lipid extracts of spinal cord from CST null, CST heterozygous, and their wild type littermates. Lipid extracts of spinal cord from CST null (KO), CST heterozygous (Het.), and their wild type littermate (WT) mice at different ages were prepared using a modified Bligh and Dyer method. The content of individual molecular species of choline glycerophospholipid (Panel A), ethanolamine glycerophospholipid (Panel B), phosphatidylinositol (Panel C), and phosphatidylserine (Panel D) after identification was determined in comparison to the selected internal standard after 13C de-isotoping by using MDMS-SL as described under “Materials and Methods”. The total mass levels of individual lipid class represent the sum of the content of individual species of the class. The data points represent means ± SD from separate preparations of at least four different animals.
Discussion
In the current study, we aimed to determine the effects of CST gene disruption on brain lipid homeostasis by employing MDMS-SL and MALDI-TOF/MS. We demonstrated the absence of sulfatide content in both brain cortex and spinal cord of CST null mice at all examined ages. We also demonstrated that significant deficiency in sulfatide content was present in spinal cord of CST+/− mice relative to that of WT littermates after day 8, whereas significant sulfatide deficiency in brain cortex of CST+/− mice was not observed until day 48. These results indicate that the synthesis of sulfatide in CST+/− mice meets the mass levels of sulfatide required for myelination at the newborn stage when the demand for sulfatide mass is small. However, deficiency in sulfatide occurs when the balance between synthesis and utilization for myelination is unstable. These results are consistent with myelination during brain development.
It was intriguing to reveal the altered sulfatide profile (i.e., composition) in CST+/− mice relative to WT littermates from the lipidomics analysis. Specifically, the composition of sulfatide species containing either saturated or hydroxylated fatty acyl chains was increased in comparison to that of WT control. This observation suggests that an increase in the percentage of these species could compensate for the deficiency in sulfatide mass for normal myelin function as previously demonstrated with CST+/− mice [10, 11, 24]. As well known, the increased saturation component of cellular membrane could result in the rigidity of the membrane. Therefore, the increased saturation likely reduces the myelin membrane fluidity. The increased component of hydroxylated fatty acyl chains likely enhances the interaction between membrane and myelin proteins, thereby leading to the tightness of myelin sheath.
The increased mass levels of CBS, SM and Cer with age during the first three weeks after birth were consistent with brain development and myelination. We found that the mass levels of the majority of sphingolipid classes achieved a plateau near or after the 48 days of age (in comparison to the data we acquired from those at day 110 (data not shown)). It was a little surprising that the mass levels of both CBS and Cer as key substrates for sulfatide biosynthesis were not affected after CST gene disruption, indicating that the homeostasis of sphingolipids is well maintained through regulation of different biosynthesis/degradation pathways.
The Cer data were intriguing in two aspects. First, we detected a constant lower mass level of Cer at day 48 or older in CST null mice related to that of either CST+/− or WT mice (Fig. 5C). These reduced mass levels in CST null mice were contradictive to the CST gene disruption. The reason why Cer mass levels were lower remains elusive. Second, in the first three weeks after birth, Cer mass levels were unusually high. The high levels of Cer likely reflect the high demand of sphingolipid biosynthesis due to myelination and brain development in this period. Alternatively, the high mass levels of Cer could also reflect the high incident of neuron apoptosis related to neuronal circuit rewiring at the late stage of weaning [25]. The reduced Cer mass levels at 48 days support both possibilities considering the reduced biosynthesis of sphingolipids and neuronal death after transitioning to an adult. Further investigation is required for clarification of these possibilities which is beyond the scope of this study.
A few points were worth noting from the analysis of phospholipid classes. First, the mass levels of PC class were essentially identical for all animal groups at all examined ages (Fig. 6A). This is possibly due to that PC species were largely present in the plasma membranes of cell bodies, the mass levels of which were less affected with the increased myelination. Second, the mass levels of phosphatidylinositol species in all three groups tend to become lower with age (Fig. 6C) due to an unknown reason. Third, the mass levels of the majority of the examined phospholipid classes in all three groups (e.g., ethanolamine glycerophospholipid and phosphatidylserine (Fig. 6B and 6D)) were increased with age at the early time and reached a plateau after day 24 as examined. This is consistent with the myelination and brain development. Finally, we observed that the mass levels of phosphatidic acid were exponentially increased with age in all examined mouse groups (Data not shown). This increase likely reflects the active biosynthesis of lipids due to myelination as we demonstrated herein since phosphatidic acid is an important intermediate for lipid synthesis.
In summary, we examined the lipid homeostasis after disruption of CST gene in the CNS by using MDMS-SL and MALDI-TOF/MS. Lipidomics analysis not only confirmed the absence of sulfatide in CST null mice, but also revealed the presence of significantly-changed sulfatide profiles in CST heterozygote. Contrary to sulfatide deficiency, the mass levels of all other examined lipid classes (except the Cer content at certain points) were not affected with the disruption of CST gene. Accordingly, this study not only provides evidence for the effects of CST gene disruption on brain lipid homeostasis, but also validates an animal model for investigators to study the role of sulfatide in the CNS, which might be very useful for AD research considering the substantial depletion of sulfatide in all stages of AD [6, 7, 26].
Acknowledgments
This work was supported by National Institute on Aging Grant R01 AG31675 and intramural institutional research funds. Special thanks are expressed to Dr. Juan Pablo Palavicini for his contribution to genotyping, Ms. Jacina Redden and Nicole Harris for their skillful technical support in the analysis of lipids and/or animal care, and Ms. Imee Tiu for her editorial assistance.
Abbreviations
- AD
Alzheimer’s disease
- CBS
cerebroside
- Cer
ceramide
- CNS
central nervous system
- CST
cerebroside sulfotransferase
- ESI
electrospray ionization
- Het
heterozygous
- KO
knockout
- m:n
acyl chain containing m carbons and n double bonds
- MALDI-TOF/MS
matrix-assisted laser desorption/ionization time-of-flight mass spectrometry
- MDMS-SL
multi-dimensional mass spectrometry-based shotgun lipidomics
- PC
choline glycerophospholipid
- PCR
polymerase chain reaction
- SD
statistical deviation
- SM
sphingomyelin
- WT
wild type
References
- 1.Eckhardt M. The role and metabolism of sulfatide in the nervous system. Mol Neurobiol. 2008;37:93–103. doi: 10.1007/s12035-008-8022-3. [DOI] [PubMed] [Google Scholar]
- 2.Takahashi T, Suzuki T. Role of sulfatide in normal and pathological cells and tissues. J Lipid Res. 2012;53:1437–1450. doi: 10.1194/jlr.R026682. [DOI] [PMC free article] [PubMed] [Google Scholar]
- 3.Vos JP, Lopes-Cardozo M, Gadella BM. Metabolic and functional aspects of sulfogalactolipids. Biochim Biophys Acta. 1994;1211:125–149. doi: 10.1016/0005-2760(94)90262-3. [DOI] [PubMed] [Google Scholar]
- 4.Kolodny EH, Fluharty AL, editors. Metachromatic leukodystrophy and multiple sulfatase deficiency: sulfatide lipidosis. McGraw-Hill; New York: 1995. [Google Scholar]
- 5.Eckhardt M, Hedayati KK, Pitsch J, Lullmann-Rauch R, Beck H, Fewou SN, Gieselmann V. Sulfatide storage in neurons causes hyperexcitability and axonal degeneration in a mouse model of metachromatic leukodystrophy. J Neurosci. 2007;27:9009–9021. doi: 10.1523/JNEUROSCI.2329-07.2007. [DOI] [PMC free article] [PubMed] [Google Scholar]
- 6.Svennerholm L, Gottfries CG. Membrane lipids, selectively diminished in Alzheimer brains, suggest synapse loss as a primary event in early-onset form (type I) and demyelination in late-onset form (type II) J Neurochem. 1994;62:1039–1047. doi: 10.1046/j.1471-4159.1994.62031039.x. [DOI] [PubMed] [Google Scholar]
- 7.Han X, Holtzman DM, McKeel DW, Jr, Kelley J, Morris JC. Substantial sulfatide deficiency and ceramide elevation in very early Alzheimer’s disease: potential role in disease pathogenesis. J Neurochem. 2002;82:809–818. doi: 10.1046/j.1471-4159.2002.00997.x. [DOI] [PubMed] [Google Scholar]
- 8.Han X, Cheng H, Fryer JD, Fagan AM, Holtzman DM. Novel role for apolipoprotein E in the central nervous system: Modulation of sulfatide content. J Biol Chem. 2003;278:8043–8051. doi: 10.1074/jbc.M212340200. [DOI] [PubMed] [Google Scholar]
- 9.Han X. Potential mechanisms contributing to sulfatide depletion at the earliest clinically recognizable stages of Alzheimer’s disease: a tale of shotgun lipidomics. J Neurochem. 2007;103(s1):171–179. doi: 10.1111/j.1471-4159.2007.04708.x. [DOI] [PMC free article] [PubMed] [Google Scholar]
- 10.Honke K, Hirahara Y, Dupree J, Suzuki K, Popko B, Fukushima K, Fukushima J, Nagasawa T, Yoshida N, Wada Y, Taniguchi N. Paranodal junction formation and spermatogenesis require sulfoglycolipids. Proc Natl Acad Sci USA. 2002;99:4227–4232. doi: 10.1073/pnas.032068299. [DOI] [PMC free article] [PubMed] [Google Scholar]
- 11.Marcus J, Honigbaum S, Shroff S, Honke K, Rosenbluth J, Dupree JL. Sulfatide is essential for the maintenance of CNS myelin and axon structure. Glia. 2006;53:372–381. doi: 10.1002/glia.20292. [DOI] [PubMed] [Google Scholar]
- 12.Suzuki A, Hoshi T, Ishibashi T, Hayashi A, Yamaguchi Y, Baba H. Paranodal axoglial junction is required for the maintenance of the Nav1.6-type sodium channel in the node of Ranvier in the optic nerves but not in peripheral nerve fibers in the sulfatide-deficient mice. Glia. 2004;46:274–283. doi: 10.1002/glia.20008. [DOI] [PubMed] [Google Scholar]
- 13.Han X, Gross RW. Shotgun lipidomics: Electrospray ionization mass spectrometric analysis and quantitation of the cellular lipidomes directly from crude extracts of biological samples. Mass Spectrom Rev. 2005;24:367–412. doi: 10.1002/mas.20023. [DOI] [PubMed] [Google Scholar]
- 14.Yang K, Cheng H, Gross RW, Han X. Automated lipid identification and quantification by multi-dimensional mass spectrometry-based shotgun lipidomics. Anal Chem. 2009;81:4356–4368. doi: 10.1021/ac900241u. [DOI] [PMC free article] [PubMed] [Google Scholar]
- 15.Han X, Yang K, Gross RW. Multi-dimensional mass spectrometry-based shotgun lipidomics and novel strategies for lipidomic analyses. Mass Spectrom Rev. 2012;31:134–178. doi: 10.1002/mas.20342. [DOI] [PMC free article] [PubMed] [Google Scholar]
- 16.Cheng H, Guan S, Han X. Abundance of triacylglycerols in ganglia and their depletion in diabetic mice: Implications for the role of altered triacylglycerols in diabetic neuropathy. J Neurochem. 2006;97:1288–1300. doi: 10.1111/j.1471-4159.2006.03794.x. [DOI] [PMC free article] [PubMed] [Google Scholar]
- 17.Cheng H, Jiang X, Han X. Alterations in lipid homeostasis of mouse dorsal root ganglia induced by apolipoprotein E deficiency: A shotgun lipidomics study. J Neurochem. 2007;101:57–76. doi: 10.1111/j.1471-4159.2006.04342.x. [DOI] [PMC free article] [PubMed] [Google Scholar]
- 18.Jiang X, Cheng H, Yang K, Gross RW, Han X. Alkaline methanolysis of lipid extracts extends shotgun lipidomics analyses to the low abundance regime of cellular sphingolipids. Anal Biochem. 2007;371:135–145. doi: 10.1016/j.ab.2007.08.019. [DOI] [PMC free article] [PubMed] [Google Scholar]
- 19.Han X, Yang K, Gross RW. Microfluidics-based electrospray ionization enhances intrasource separation of lipid classes and extends identification of individual molecular species through multi-dimensional mass spectrometry: Development of an automated high throughput platform for shotgun lipidomics. Rapid Commun Mass Spectrom. 2008;22:2115–2124. doi: 10.1002/rcm.3595. [DOI] [PMC free article] [PubMed] [Google Scholar]
- 20.Cheng H, Sun G, Yang K, Gross RW, Han X. Selective desorption/ionization of sulfatides by MALDI-MS facilitated using 9-aminoacridine as matrix. J Lipid Res. 2010;51:1599–1609. doi: 10.1194/jlr.D004077. [DOI] [PMC free article] [PubMed] [Google Scholar]
- 21.Yang K, Han X. Accurate Quantification of Lipid Species by Electrospray Ionization Mass Spectrometry — Meets a Key Challenge in Lipidomics. Metabolites. 2011;1:21–40. doi: 10.3390/metabo1010021. [DOI] [PMC free article] [PubMed] [Google Scholar]
- 22.Poduslo SE, Jang Y. Myelin development in infant brain. Neurochem Res. 1984;9:1615–1626. doi: 10.1007/BF00964595. [DOI] [PubMed] [Google Scholar]
- 23.Deoni SC, Mercure E, Blasi A, Gasston D, Thomson A, Johnson M, Williams SC, Murphy DG. Mapping infant brain myelination with magnetic resonance imaging. J Neurosci. 2011;31:784–791. doi: 10.1523/JNEUROSCI.2106-10.2011. [DOI] [PMC free article] [PubMed] [Google Scholar]
- 24.Ishibashi T, Dupree JL, Ikenaka K, Hirahara Y, Honke K, Peles E, Popko B, Suzuki K, Nishino H, Baba H. A myelin galactolipid, sulfatide, is essential for maintenance of ion channels on myelinated axon but not essential for initial cluster formation. J Neurosci. 2002;22:6507–6514. doi: 10.1523/JNEUROSCI.22-15-06507.2002. [DOI] [PMC free article] [PubMed] [Google Scholar]
- 25.Cheng H, Mancuso DJ, Jiang X, Guan S, Yang J, Yang K, Sun G, Gross RW, Han X. Shotgun lipidomics reveals the temporally dependent, highly diversified cardiolipin profile in the mammalian brain: temporally coordinated postnatal diversification of cardiolipin molecular species with neuronal remodeling. Biochemistry. 2008;47:5869–5880. doi: 10.1021/bi7023282. [DOI] [PMC free article] [PubMed] [Google Scholar]
- 26.Cheng H, Wang M, Li J-L, Cairns NJ, Han X. Specific changes of sulfatide levels in individuals with pre-clinical Alzheimer’s disease: an early event in disease pathogenesis. J Neurochem. 2013;126 doi: 10.1111/jnc.12368. [DOI] [PMC free article] [PubMed] [Google Scholar]