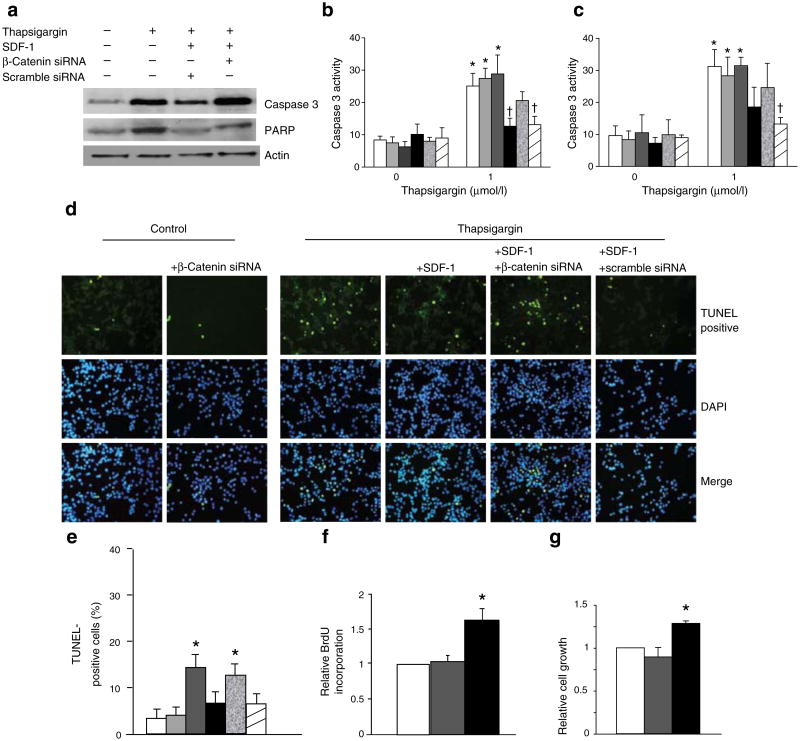
Fig. 5.
Inhibition of apoptosis by SDF-1 in INS-1 and MIN-6 cells is reversed by knock-down of beta-catenin. a Western blot analysis of extracts from MIN6 cells that were mock-treated, thapsigargin-treated (1μmol/l) and/or siRNA-transfected (0.25 mg/ml) by using anti-sera against cleaved caspase-3 and cleaved PARP, and actin antibody as a loading control. b Caspase-3 activity (fluorescence [mg protein]−1 × 10⁻⁵) of INS-1 or (c) MIN6 cells treated as above (a). Cell treatments from left to right: white bars, control; light grey, beta-catenin siRNA; dark grey, scramble siRNA; black, SDF-1; mottled, SDF-1 and beta-catenin siRNA; striped, SDF-1 and scramble siRNA. Results are presented as mean±SD for n=3 independent experiments. All values are relative to the first (leftmost) bar. *p<0.05 compared with untreated control values (leftmost bar); †p<0.05 compared with 1 mmol/l thapsigargin treated control values. d Representative images of TUNEL staining of INS-1 cells of n=3 independent experiments. e Quantification of apoptotic cells expressed as per cent apoptotic cells relative to total cells counted. f The proliferation rates of INS-1 cells after SDF-1 (grey bars) or exendin-4 (black bars), presented as relative BrdU and (g) MTT incorporation values compared with control-treated cells. *p<0.05 when compared with control values (leftmost bar)

