

Abstract
Retroviral transformation has been associated with pro-proliferative oncogenic signaling in human cells. The current study demonstrates that transduction of human breast carcinoma cells (MDA-MB231) with LXSN and QCXIP retroviral vectors causes significant increases in growth rate, clonogenic fraction, and aldehyde dehydrogenase-1 positive cells (ALDH1+), which is associated with increased steady-state levels of cancer stem cell populations. Furthermore, this retroviral-induced enhancement of cancer cell growth in vitro was also accompanied by a significant increase in xenograft tumor growth rate in vivo. The retroviral induced increases in cancer cell growth rate were partially inhibited by treatment with 100 U/ml polyethylene glycol-conjugated-(PEG)-superoxide dismutase and/or PEG-catalase. These results show that retroviral infection of MDA-MB231 human breast cancer cells is capable of enhancing cell proliferation and cancer stem cell populations as well as suggesting that modulation of reactive oxygen species-induced pro-survival signaling pathways may be involved in these effects.
Keywords: Stem cells, Viral carcinogenesis, Mammary cancer, Oxidative stress, Antioxidant enzymes, Aldehyde dehydrogenase positive
Graphical abstract
Highlights
Retroviral infection causes persistent ROS production in breast cancer cells.
Retroviral infected cells display increased clonogenic fraction and tumorigenic potential.
The ALDH1+ mammary cancer stem cell population is increased in infected cells.
The above effects of retroviral infection can be inhibited with antioxidant enzymes.
Introduction
The transforming qualities of retroviruses have been appreciated for over a century [1]. Although the specific nature of mechanisms involved in retroviral infection was not appreciated until 1970 with the identification of reverse transcriptase, they had already been implicated in the initiation and promotion of many cancers in animals [1,2]. Their role in human cancers has only begun to be appreciated in more recent years. Indeed, although the mechanism(s) are not always clear, the origin of 15–20% of human cancers may be linked to cellular transformation by a virus [1]. Human T-cell leukemia virus type I (HTLV-1) was the first human transforming retrovirus discovered [3]. Some of the molecular mechanisms governing cellular transformation by retroviruses have been elucidated, including insertional mutagenesis, introduction of viral oncogenes into the host DNA, and chronic inflammation associated with oxidative stress [4–6]. Nevertheless there are many examples where the mechanism(s) governing retrovirus-associated cellular transformation remain a mystery.
Although there is an association between retroviral infection and cancer, retroviral infection itself does not typically result in the formation of cancer within an individual. Nevertheless, viral infections have been associated with increased fluxes of reactive oxygen species (ROS) such as superoxide (O2•−) and hydrogen peroxide (H2O2) in infected cells [7,8]. Furthermore it has been hypothesized with significant supporting data that increased steady-state levels of ROS in cells contributes to initiation, promotion, and progression of cancers [9–12]. Recent work has identified increases in ROS in response to experimental viral vector infection in vitro [13,14]. Zhang et al. [13] found that infection of murine liver cells in vivo, with a replication defective adenovirus caused increased oxidative stress and caused increased AP-1 binding to DNA, and a reduction in the GSH/GSSH ratio indicative of thiol oxidation. AP-1 is considered a redox regulated stress-responsive transcription factor [15] and this previous report went on to show that adenoviral-based overexpression of manganese superoxide dismutase (MnSOD) diminished viral-induced AP-1 activation and restored the GSH/GSSH ratio to physiological levels, implicating superoxide (O2•−) and H2O2 as causative agents in viral effects on signal transduction. In a separate study, Piccoli et al. [14] identified a defect in mitochondrial electron transport chain complex I that caused excess ROS buildup in human mesenchymal stem cells after transformation with several empty retroviral vector backbones. The levels of intracellular perturbations in the redox environment in these two studies were sub-lethal and the mechanisms linking viral infection to increased ROS generation were not specifically investigated.
ROS mediate various physiological and pathophysiological cellular responses depending on the cell type affected and the level of intracellular redox perturbation that is imposed [10,16–20]. Low levels of ROS serve as important signaling molecules utilized in processes such as growth factor response, and protein modifications including phosphorylation and sumoylation [16]. Higher levels of ROS are used for immune signaling and apoptosis [21].
The work presented in the current studies describes significant pro-growth responses induced by infection of human mammary adenocarcinoma cells with two different retroviral vectors, LXSN and QCXIP. The pro-growth phenotypic changes are accompanied by significant increases in steady-state levels of pro-oxidants as determined by increases in CDCFH2 oxidation, accelerated cell growth rate, and an increase in the number of cancer cells expressing ALDH+ activity that indicates an increase in cancer stem cell populations. The retroviral induced increases in cancer cell growth rate were partially inhibited by treatment with polyethylene glycol-conjugated-(PEG)-superoxide dismutase and/or PEG-catalase. The current work provides the first evidence of a causal link, in the absence of an exogenous viral onco-protein, between retroviral infection and excess generation of pro-oxidants leading to a pro-survival, pro-growth phenotype in human breast cancer cells.
Materials and methods
Cell culture
The MDA-MB231 metastatic human breast cancer cell line was obtained from the ATCC [22]. MDA-MB231 and the retrovirally transformed derivatives of this cell line (MDA-MB231-LXSN and MDA-MB231-QCXIP), were grown in 10 cm tissue culture dishes at 37 °C, 5% CO2, in RPMI 1640 (Gibco, Life Technologies) supplemented with 10% fetal bovine serum (FBS) (Atlanta Biologicals), 100 U/ml penicillin and 100 µg/ml streptomycin (pen-strep, Gibco, Life Technologies). GP293 (Clontech) cells were grown at 37 °C, 5% CO2, in Dulbecco Modified Eagle Medium, High-Glucose (Gibco, Life Technologies) supplemented with 10% FBS, 100 U/ml penicillin and 100 µg/ml streptomycin.
Generation of retroviral vectors
The retroviral expression vectors utilized in this study were the LXSN-neomycin resistance gene (NeoR) expression vector [23] and the pOCXIP-puromycin resistance gene (Pur) expression vector (Clontech). The LXSN-NeoR vector was a generous gift from Dr. Aloysius Klingelhutz (Department of Microbiology, University of Iowa).
Retroviral transduction
The LXSN-NeoR vector and pQCXIP-Puro retroviral vectors were transfected alongside a VSVg expression vector into GP293 cells using the calcium-phosphate method [24]. Twelve micrograms of both the retroviral vector and the VSVg expression vector were used in the transfection procedure. The media was changed at 4 and 24 hours post-transfection and cells were then allowed to produce viral particles for an additional 24 hours. The viral supernatant was collected, filtered and applied to 10 cm dishes containing 1×10⁶ MDA-MB231 cells overnight with 16 µg/ml of Polybrene to enhance viral transduction. Antibiotic selection was begun 48 hours after infection. LXSN-NeoR transformants were selected with 800 µg/ml Geneticin (Gibco, Invitrogen) for 14 days. pQCXIP transformants were selected in 2 µg/ml of Puromycin (Sigma) for 7 days.
Clonogenic assay
Two hundred fifty cells were plated on 60 mm tissue culture dishes. Cells were allowed to grow at 37 °C for 14 days in RPMI, 10% FBS, 1% pen-strep. On day 14, cells were rinsed with PBS, fixed with ice cold 100% methanol, and stained with crystal violet for 10 min (0.5% crystal violet in 25% methanol). The plates were then rinsed with water, imaged using a Typhoon FLA 7000 (General Electric) and the number of colonies were counted using ImageJ software (National Institutes of Health, Bethesda). In experiments where the individual cells were counted along with colonies, the plates were rinsed with PBS and stained immediately without fixation in 0.5% crystal violet in the absence of methanol. The plates were rinsed gently with water and imaged using a Typhoon FLA 7000 for quantification using ImageJ software. After imaging, cells were trypsinized and counted using a Z1 Coulter Particle Counter (Beckman Coulter). Each plate was counted twice and the average of the counts was used to determine the overall cell number. Results are presented as the number of cells divided by the number of colonies for each plate.
Growth rate analysis
Cells were plated at 2500 cells/cm2 in RPMI 1640 (10% FBS, pen-strep) at 0 hours. Every 24 hours after seeding, cells were trypsinized and counted on a Z1 Coulter Particle Counter. Each well was counted twice and the average of the two counts was plotted over time.
Estimation of cancer stem cells using Aldefluor assay
Cells were grown and treated as described above. After trypsinizing, cells were washed in DPBS and counted. 1×10⁶ cells were re-suspended in 1 ml of ALDEFLUOR assay buffer and assayed following kit directions (Stem Cell Technologies). Briefly, 5 µl Aldehyde dehydrogenase substrate (BODIPY-aminoacetaldehyde) was added to each tube. Immediately after addition, 500 µl was transferred to a tube containing 5 µl dimethylaminobenzaldehyde (DEAB), an inhibitor of ALDH. Cells were incubated for 40 min at 37 °C and then washed in kit buffer containing an efflux inhibitor. Hoechst 33342 was added for viability and samples kept on ice for analysis by using a Becton, Dickinson LSR II with 355, 488 and 633 nm lasers (Becton, Dickinson and Company). The percentage ALDH positive cells of approximately 100,000 cells counted was determined by using the sorting gate established with Hoechst for viability and DEAB for the negative control.
Fluorescence probe labeling for alterations in pro-oxidants
Cells were washed with PBS and resuspended in 1 ml of PBS with glucose (pH 7.4). 10 µg/ml of the oxidation sensitive 5-(and-6)-carboxy-2′,7′-dichlorodihydrofluorescein diacetate (CDCFH2; C-400 Molecular Probes Inc.) or oxidative insensitive 5-(and-6)-carboxy-2′,7′-dichlorofluorescein diacetate (CDCF; C-369 Molecular Probes), were then added to the appropriate treatment conditions. DMSO (dye vehicle) treated unstained cells were used to correct for auto-fluorescence, whereas 10 micromoles Antimycin A was used as a positive control for increasing probe oxidation. Cells were then incubated with the probe for 15 min (CDCFH2) before analysis with LSR-VIOLET flow cytometry. Excitation/emission wavelengths for CDCFH2 were 488 nm/530 nm. Roughly 10,000 counts were gated per sample, and the mean of three samples was calculated for each treatment. The negative control (background fluorescence) was subtracted from each of the sample averages and then each sample was normalized to the control (uninfected) sample, to yield the mean fluorescent intensity (MFI) for each sample.
PEG-catalase and PEG-SOD treatment
Cells were treated with 100 U/ml of PEG-catalase and/or PEG-SOD at the time of plating for the growth rate analysis.
In vitro tumor growth
The nude mice protocol was reviewed and approved by the Animal Care and Use Committee of the University of Iowa. Exponentially growing MDA-MB231, MDA-MB231-LXSN, and MDA-MB231-QCXIP cells were gently trypsinized (TrypLE, Life Technologies) and resuspended in sterile PBS at 2×10⁷/ml. The cells were mixed at a ratio of 1:1 with Matrigel. Female (8–10 weeks) athymic nu/nu mice (Harlan, Sprague) were subcutaneously injected with 100 µl (1×10⁶) of MDA-MB231 (left flank) and MDA-MB231-LXSN or MDA-MB231-QCXIP (right flank). After visible tumors were identified, they were measured every 72–96 hours or weekly with a caliper. Measurements were over 5 weeks, or until the tumor became too large whereupon the mouse was euthanized. Tumor volume was determined by the equation: π(L×W2) /6 as previously described [15].
Results
Retroviral transfection enhances breast cancer cell growth and alters cell morphology
Through retroviral infection and antibiotic selection of the MDA-MB231 breast cancer cell line, we generated populations with either the LXSN (MDA-MB231-LXSN) or the pQCXIP (MDA-MB231-QCXIP) retroviral vector stably integrated into the genome which was confirmed by antibiotic selection. We examined the clonogenic capacity of the transformed cell lines. We found an almost 2-fold increase in the clonogenic survival fraction of both the MDA-MB231-LXSN and MDA-MB231-QCXIP lines when compared to the parental cell line (Figs. 1A, D, G and 2A). We also saw evidence of reduced contact inhibition within the colonies analyzed. The colonies examined were both larger and denser than those seen in MDA-MB231 (Fig. 1B, E and H). The retroviral transformed cell lines appeared to be growing both out to the periphery of the colonies and on top of one another, whereas the MDA-MB231 colonies appeared to expand out peripherally (Fig. 1E and H). To quantify this phenotype we counted the number of cells per colony. As expected, the MDA-MB231-LXSN and MDA-MB231-QCXIP cell lines had three and five times the number of cells per colony, respectively (Fig. 2B). As shown in Fig. 2C, MDA-MB231-LXSN and MDA-MB231-QCXIP both also demonstrated significantly reduced doubling times when compared to MDA-MB231, reinforcing the conclusion that the retroviral transformed cells were expressing a pro-growth/pro-survival phenotype, relative to the control non-virally infected cells.
Fig. 1.

Retroviral infection alters the colony appearance and morphology of MDA-MB-231 human mammary adenocarcinoma cells. (A), (D), and (G)—representative images of clonogenic assay plates from untransformed MDA-MB231 cells (A), retrovirally transformed cells MDA-MB231-LXSN (D), and MDA-MB231-QCXIP (G). Cells were seeded at the density of 250 cells/60 mm dish and allowed to form colonies for 14 days where cells were fixed and stained. (B), (E), and (H) higher magnification images of a single colony highlighting the piling up of cells in the colonies of the MDA-MB231-LXSN (E) and MDA-MB231-QXCIP (H) versus the single layer of cells characteristic of the MDA-MB231 colonies (B). (C), (F), and (I)—close-up images showing the distinct morphological differences between the parent MDA-MB231 (C) cells and the transformed lines MDA-MB231-LXSN (F) and MDA-MB231-QCXIP (I).
Fig. 2.

Retroviral infection alters the clonogenic capacity, growth rate, and ALDH1 stem cell markers of MDA-MB231 cells. (A) Clonogenic survival fraction of the cell lines analyzed. After 14 days of seeding at a density of 250cells/60 mm dish, cells were fixed, stained, and surviving colonies were then counted. (B) Graph displaying the number of cells per colony of the untransformed cells (MDA-MB231) versus the retrovirally transformed lines (MDA-MB231-LXSN and MDA-MB231-QCXIP). (C) Cell doubling time (in hours) of cell lines. All transformed cell lines maintained a shorter doubling time than the parental cell lines. (D) Bar graph charting the increases in % population of transformed cells displaying ALDEFLUOR activity. 1×10⁶ cells were re-suspended in ALDEFLUOR assay buffer as recommended by the manufacturer. Samples were analyzed by flow cytometer. The number of ALDH positive cells of 100,000 live cells was determined by using the sorting gate established using DEAB the ALDH1 inhibitor containing samples. A minimum of 10,000 cells was analyzed from each cell population. P values were calculated using two-sided Student’s t test.
Retroviral transformation induces phenotypic changes
In addition to an increase in clonogenic survival and growth rate, the morphology of the MDA-MB231-LXSN and MDA-MB231-QCXIP cell lines was different from that of the parental MDA-MB231. We observed alterations in both the size and the appearance of the cell bodies as compared to their parental line. MDA-MB231 cells had an elongated phenotype (Fig. 1C) while Both MDA-MB231-LXSN and MDA-MB231-QCXIP had larger cell bodies and a more epithelial appearance than their parental cell line (Fig. 1F and I). In addition to these changes in morphological appearance, the virally transformed cells appeared to lose some contact inhibition characteristics (Fig. 1BC, EF, HI). When grown to confluence MDA-MB231 cells would not grow as dense in the center of the colony (Fig. 1BC). However MDA-MB231-LXSN and MDA-MB231-QCXIP continued to divide upon reaching confluence and as a result formed multiple layers of cells within a single colony (Fig. 1EF and HI).
Retroviral transformed breast cancer cells contain an in increased sub-population of cells with enhanced ALDH activity
To examine the possibility that retroviral transformation had stimulated growth of an early progenitor cancer stem cell population, we examined the parental and transformed populations for the percentage of aldehyde dehydrogenase 1 positive cells (ALDH1+) using an ALDH activity assay. The ALDH family of enzymes oxidizes intracellular aldehydes to carboxylic acids in early progenitor cancer stem cells [25]. A higher percentage of ALDH1+ cells in breast cancer cell populations is a predictor of poor clinical outcome and in animal models ALDH1+ cancer cells form large tumors faster with fewer cells injected, indicating an aggressive pro-growth/survival phenotype [26,27]. Using the ALDEFLUOR assay to quantify the percentage of cells expressing ALDH1 activity we found that retrovirally infected MDA-MB231 populations, showed a dramatic increase in the number of ALDH1+ cells (Fig. 2D). These results suggest that the retrovirally transformed cell populations contained a higher percentage of early progenitor cancer stem cells, relative to the parental cell population that could contribute to an aggressive growth phenotype.
Retrovirally transformed cells show higher steady-state levels of CDCFH2 oxidation
To determine if changes in the intracellular redox environment of the retrovirally transformed cells could contribute to the pro-growth phenotype, the oxidation of CDCFH2 was measured and compared to the fluorescence seen when the same cells were labeled with the oxidation insensitive analog (CDCF). As can be seen in Fig. 3 (left side), a 2.5 fold increase in the mean fluorescence intensity of both the MDA-MB231-LXSN and MDA-MB-231-QCXIP populations was noted when the cells were labeled with the oxidation sensitive CDCFH2, compared to non-infected MDA-MB231. This is in contrast to the lack a change in fluorescence in the same cell lines labeled with the oxidation-insensitive analog CDCF (Fig. 3, right side) showing that changes in fluorescence were attributable to changes in the dye oxidation and not changes in uptake, ester cleavage, or efflux of the probe. These results demonstrate a shift to a more pro-oxidant intracellular redox environment in the virally infected cells, relative to controls, that could be contributing to the more aggressive pro-growth phenotype.
Fig. 3.
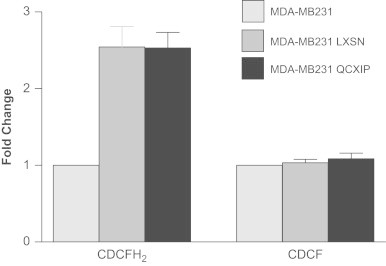
Retroviral infection increases the oxidation of CDCFH2 in MDA-MB231 cells indicating a shift in the intracellular redox environment. Left side: transformed cells (MDA-MB231-LXSN and MDA-MB231-QCXIP) significantly increased CDCFH2 oxidation, relative to MDA-MB231. Right side: when the cells were labeled with the oxidation insensitive probe, CDCF, no difference was seen in the florescence of the probe between cell lines indicating that the changes in florescent seen in panel A were caused by changes in probe oxidation.
PEG-catalase and PEG-SOD inhibited the growth of the transformed cells
To further probe the involvement of changes in the intracellular redox environment mediated by superoxide (O2•−) and hydrogen peroxide (H2O2) in the observed retroviral-induced phenotypic changes, we treated cells with 100 U/ml of PEG-CAT that is known to scavenge H2O2 and/or PEG-SOD that is known to scavenge O2•−. As shown in Fig. 4, left panel, when treated with both PEG-CAT and/or PEG-SOD, MDA-MB231-LXSN cells exhibited an increased cell doubling time, close to that of MDA-MB231 uninfected cells. In addition the experiments with the MDA-MB231-QCXIP showed that neither of PEG-conjugated enzymes alone produced a significant effect on cell growth in the retroviral infected cells but when used in combination, a significant increase in the doubling time was observed (Fig. 4, right panel). These data support the hypothesis that changes in the intracellular redox environment of retroviral infected cells mediated by O2•− and H2O2 significantly contribute to the pro-growth pro-survival phenotype seen following infection.
Fig. 4.
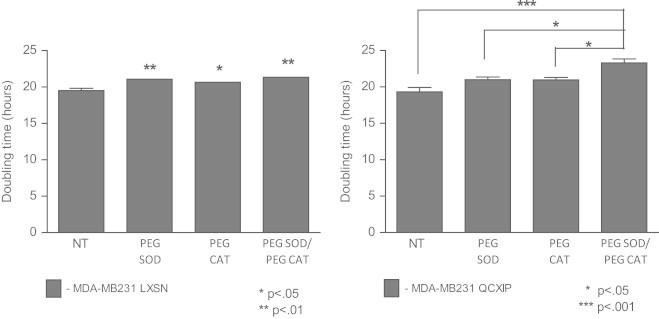
Cell proliferation was inhibited by treatment with PEG-catalase/PEG-SOD. Left side: doubling time of treated versus untreated MDA-MB231 LXSN. Cells were treated with 100 U/ml of PEG-catalase and/or PEG-SOD and growth rate was determined by counting cells every 24 hours for a period of 14 days to calculate a doubling time. Right side: population doubling time of MDA-MB231 QCXIP cells when treated with PEG-catalase, PEG-SOD, or both.
Retrovirally transformed MDA-MB231-LXSN and MDA-MB231-QCXIP cells are more tumorigenic in vivo
To determine if the accelerated growth and increase in ALDH+ cells observed in vitro translated into more aggressive growth in an in vivo model, we injected equal numbers of MDA-MB231, MDA-MB231-LXSN, and MDA-MB231-QCXIP into athymic nu/nu mice and monitored tumor growth. To control for differences among animals, each mouse was injected with uninfected and virally infected cell lines on opposing flanks. Measurable tumors were observed after one-two weeks. Fig. 5A illustrates the substantial differences in tumor size induced by MDA-MB231-LXSN after 5 weeks of growth on the right flank versus the smaller MDA-MB231 tumors on the left flank. The differences in tumor volume in five animals per group are quantified in Fig. 5B. At day 29, the average of the MDA-MB231-LXSN tumor volume was over ten-fold that of the MDA-MB231 tumors (824±368 mm3 and 71±9 mm3, respectively). Similar increases in in vivo growth were also observed with the MDA-MB231-QCXIP cell line, when compared to the parental MDA-MB231 (Fig. 5C) although the rate of tumor growth was less than the rate observed in MDA-MB231-LXSN. Fig. 5B and C show that retroviral transformation resulted in significantly increased tumor growth in vivo when compared to the parental MDA-MB231. This data supports the conclusion that the significant differences in pro-growth and pro-survival effects of the retroviral infection in vitro also translated into significant increases in tumor growth in vivo.
Fig. 5.

Retroviral transfection of MDA-MB231 enhances xenograft tumor growth rate in nude mice. (A) One million cells were subcutaneously injected into the left (MDA-MB231) and right (MDA-MB231-LXSN) flanks of 6–8 weeks old athymic nu/nu mice. (B) Tumor growth was monitored and measured with a caliper for 5 weeks after injection. N = 5 mice. (C) In a separate experiment, one million cells of MDA-MB231 and MDA-MB231-QCXIP were subcutaneously injected into the left and right flank, respectively of 6–8 weeks old athymic nu/nu mice. Tumor growth was monitored and measured with a caliper for a period of 10 weeks. N = 4 mice.
Discussion
Retroviral vectors have become extremely useful tools for gene transfer in molecular biology, both in vitro and in vivo [23,28]. With the proper conditions, their integration efficiency can approach 100%. However, these tools are not without their own set of limitations. Retroviral vector infection has been shown to cause cancerous cellular transformation. In two independent trials, retroviral vector-based gene therapy caused leukemia in a significant subpopulation of children treated for SCID-IX [29,30]. This unfortunate consequence of the treatment was linked to a common area of integration surrounding the proto-oncogene, lom2, causing activation and cellular transformation of T-cells [29]. Activation of the proto-oncogene no doubt contributed to the cellular transformation in the SCID-IX cases, however cancer is a multi-step process that cannot be defined by a single cellular disruption [31]. While viruses have been identified in 15–20% of human cancers, other factors contribute to differential susceptibility of individuals to cancer initiation or progression by retroviral infection.
Retroviruses can contribute to cancer initiation or progression through insertional mutagenesis, as described above, affecting the expression of a gene, often one critical to cell-cycle regulation [29]. Another potential contributing factor includes the expression of a viral oncogene, carried within the viral genome, one that often disrupts the activity of the host cell cycle. In our case, retroviral infection led to the progression of already malignant cells by increasing their growth rate and tumorigenicity. While we have yet to elucidate the exact mechanism responsible, several factors allow us to speculate on the mechanisms involved.
The first potential mechanism, insertional mutagenesis, we believe to be an unlikely explanation for our experimental results. We observed an identical phenotype using two independent retroviral vectors, each with different viral backbones. Each class of retrovirus, and their respective retroviral vectors, has their own distinct trend in integration site selection [29]. LXSN is a MoMLV based retroviral vector, MoMLV viruses incorporate in 5′ transcription units and CpG islands [24,32]. pQCXIP is derived from MSV which directs integration towards areas of compacted chromatin. However, it should be noted that these trends can be affected not only by the host DNA sequence, but also by the viral integrase (IN). Lewinski et al. [33] recently showed that the viral integrase may have a larger role in directing the integration site than originally proposed. The authors were able to alter the integration pattern of HIV closer to that of an MLV by supplying an MLV-based integrase. In our experiments, both retroviral backbones utilized the same integrase, a MoMLV based IN from the GP293 packaging line, opening up the potential for similar integration sites.
Retroviruses only succeed at stable integration and pro-viral propagation in dividing cell populations due to their inability to cross the intact nuclear envelope. Thus we may have selected cells with a greater reproductive future via retroviral integration and selection. This idea is supported by the fact that MDA-MB231 cells infected with the FIV lentivirus, which can cross the nuclear envelope and infect both dividing and non-dividing cells, did not cause the phenotype generated by the non-lenti retroviral vectors (Supplemental Fig. 1). We find this scenario unlikely however, due to the fact that the MDA-MB231 cells were in a period of exponential growth at the time of infection. Because of this, the vast majority of the cells were in some stage of division during the window of infection and therefore susceptible to retroviral infection, arguing against the idea that we selected for some subset of the population.
An additional possibility for a mechanism underlying the pro-growth phenotype elicited by retroviral infection was the disruption of intracellular redox homeostasis as detected by significant changes in CDCFH2 oxidation that were noted in both retroviral transformed cell lines. However, the CDCFH2 assay is not specific for any pro-oxidant species and can detect changes in redox active metal ions, peroxidase enzymes, reactive nitrogen species, and reactive oxygen species. To determine if changes in steady-state levels of O2•− and H2O2 might be contributing to any of the biological effects seen with retroviral infection, cells were treated with PEG-SOD and PEG-CAT which caused reduced in vitro cell growth as determined by significantly longer cell doubling times. Since these enzymes are specific for scavenging O2•− and H2O2, these results provide evidence supporting the hypothesis that the pro-growth pro-survival phenotype seen following retroviral infection is at least partially mediated by increased steady-state levels of pro-oxidants derived from O2•− and H2O2. However the exact source of this apparent metabolic perturbation in intracellular redox reactions in our retroviral infection system is currently not known.
Several previous reports have demonstrated increases in steady-state levels of intracellular ROS in response to viral infection; however the precise mechanisms have not been defined. One possibility for viral induced redox perturbations was suggested by Piccoli et al. [14]. They suggested that the overexpression of the antibiotic selection genes, Neo-R and PAC for LXSN and pQCXIP respectively are responsible for a decrease in mitochondrial electron transport chain Complex I functionality, and the subsequent increase in ROS [14]. Each retroviral vector used in the current study expresses a single exogenous gene, used in the antibiotic selection process. LXSN expresses NeoR, an aminoglycoside phosphotransferase that confers resistance to the aminoglycoside Geneticin [34]. pQCXIP expresses PAC, an acetyltransferase that allows transcription in the presence of Puromycin [35]. These two selection proteins add unique moieties to their individual targets, making it unlikely to cause the same phenotype within a cell line. While NeoR is part of a family that has been shown to have protein kinase activities, its expression has never been linked to any effects on cell growth or malignancies [36,37]. We did address this possibility by performing stable transfections of MDA-MB-231 cells with both pcDNA3.1-Neo and LXSN using Lipofectamine, bypassing the retroviral infection process, and no significant effects on growth, clonogenicity (Supplemental Fig. 1) or redox homeostasis were noted.
Finally, we noted an increased level of ALDH1 expression, as evidenced by an increase in ALDEFLUOR activity, in the transformed cell lines. ALDH1 expression is considered a putative stem cell marker. Recent interest has surrounded the identification of potential cancer stem cells (CSC), as a subpopulation of cells within a tumor that are capable of not only propagation, but self-renewal as well. In 2007, Ginestier et al. proposed that ALDH1 can be used to identify mammary CSCS and can be used as a predictor of poor clinical outcome [26]. Indeed, several studies examining the expression of ALDH1 have shown this marker to be linked to poor prognosis and reduced long-term survival in breast cancer patients [38]. However, other studies have failed to find a link between ALDH1 and survival [39]. Recently, Charafe-Jauffret et al. was able to link increased ALDEFLUOR activity in human breast cancer biopsies to both better xenotransplantation potential and increased metastasis [40]. They were able to show that populations selected for ALDEFLUOR activity showed not only an increased xenograft success rate in mice, but increased growth rates within the animal as well. They were also able to link ALDEFLUOR activity to an increase in gene expression consistent with a stem cell signature. In accordance with these recent findings, both of our transformed MDA-MB231 populations showed dramatic increases in ALDEFLUOR activity coupled with an increased growth rate in mouse xenografts. The rate of growth did not correlate exactly with the degree of ALDEFLUOR activity, however a larger sample size may be able to associate these two outcomes more closely.
Both normal and cancer cells are vulnerable to retroviral infection and potential transformation. As stated before, 15–20% of cancers can be linked to a viral infection, though often the direct mechanism of transformation is unclear. In our case, there appears to be something unique about the MDA-MB231 cell line that makes it particularly vulnerable to retroviral transformation into a more aggressive phenotype. Several other mammary cell lines, both normal (MCF-10A) and cancerous (MCF-7 5C and BT549), did not show the dramatic phenotypic transformation properties when infected with our retroviral constructs (Supplemental Fig. 2). It should be noted that a slight increase in clonogenic fraction was seen in MCF-7 5C after retroviral infection, but none of the other phenotypes seen in MDA-MB231 were observed. Our results did not appear to be linked to the absence of estrogen receptors (ER) in MDA-MB231 cells, as other ER negative cell lines (MCF10A and BT549) did not show the same results. Future directions should include the identification of what distinctive factor(s) make this particular cell line susceptible to retroviral transformation into an even more aggressive form of breast cancer.
Conclusion
This report provides further evidence that retroviral infection promotes pro-growth survival phenotypes in human cells during cellular transformation by causing perturbations in redox homeostasis that can be partially reversed by treatment with scavengers of O2•− and H2O2.
Acknowledgments
This work was supported by the United States National Institutes of Health grants R01 CA115438, R01 CA182804, R01 CA133114, T32 CA078586, and P30 CA086862.
Appendix A. Supplementary material
Supplementary data
Supplementary data
References
- 1.Kalland K.H., Ke X.S., Øyan A.M. Tumour virology—history, status and future challenges. APMIS: Acta Pathologica, Microbiologica, et Immunologica Scandinavica. 2009;117(5–6):382–399. doi: 10.1111/j.1600-0463.2009.02452.x. 19400863 [DOI] [PubMed] [Google Scholar]
- 2.Ross S.R. MMTV infectious cycle and the contribution of virus-encoded proteins to transformation of mammary tissue. Journal of Mammary Gland Biology and Neoplasia. 2008;13(3):299–307. doi: 10.1007/s10911-008-9090-8. 18661104 [DOI] [PMC free article] [PubMed] [Google Scholar]
- 3.Gallo R.C. The discovery of the first human retrovirus: HTLV-1 and HTLV-2. Retrovirology. 2005;2:17. doi: 10.1186/1742-4690-2-17. 15743526 [DOI] [PMC free article] [PubMed] [Google Scholar]
- 4.Maeda N., Fan H., Yoshikai Y. Oncogenesis by retroviruses: old and new paradigms. Reviews in Medical Virology. 2008;18(6):387–405. doi: 10.1002/rmv.592. 18729235 [DOI] [PubMed] [Google Scholar]
- 5.Peloponese J.M., Yeung M.L., Jeang K.T. Modulation of nuclear factor-kappaB by human T cell leukemia virus type 1 Tax protein: implications for oncogenesis and inflammation. Immunologic Research. 2006;34(1):1–12. 16720895 [PubMed] [Google Scholar]
- 6.Vogt P.K. Retroviral oncogenes: a historical primer. Nature Reviews: Cancer. 2012;12(9):639–648. doi: 10.1038/nrc3320. 22898541 [DOI] [PMC free article] [PubMed] [Google Scholar]
- 7.Pace G.W., Leaf C.D. The role of oxidative stress in HIV disease. Free Radical Biology & Medicine. 1995;19(4):523–528. doi: 10.1016/0891-5849(95)00047-2. 7590404 [DOI] [PubMed] [Google Scholar]
- 8.Nakamura H., Masutani H., Yodoi J. Redox imbalance and its control in HIV infection. Antioxidants & Redox Signaling. 2002;4(3):455–464. doi: 10.1089/15230860260196245. 12215212 [DOI] [PubMed] [Google Scholar]
- 9.Oberley L.W., Buettner G.R. Role of superoxide dismutase in cancer: a review. Cancer Research. 1979;39(4):1141–1149. 217531 [PubMed] [Google Scholar]
- 10.Fruehauf J.P., Meyskens F.L., Jr. Reactive oxygen species: a breath of life or death? Clinical Cancer Research: An Official Journal of the American Association for Cancer Research. 2007;13(3):789–794. doi: 10.1158/1078-0432.CCR-06-2082. 17289868 [DOI] [PubMed] [Google Scholar]
- 11.Dhar S.K., St Clair D.K. Manganese superoxide dismutase regulation and cancer. Free Radical Biology & Medicine. 2012;52(11–12):2209–2222. doi: 10.1016/j.freeradbiomed.2012.03.009. 22561706 [DOI] [PubMed] [Google Scholar]
- 12.Oberley L.W., Oberley T.D. Role of antioxidant enzymes in cell immortalization and transformation. Molecular and Cellular Biochemistry. 1988;84(2):147–153. doi: 10.1007/BF00421049. 3068520 [DOI] [PubMed] [Google Scholar]
- 13.Zhang H.J., Drake V.J., Xu L., Hu J., Domann F.E., Oberley L.W., Kregel K.C. Redox regulation of adenovirus-induced AP-1 activation by overexpression of manganese-containing superoxide dismutase. Journal of Virology. 2002;76(1):355–363. doi: 10.1128/JVI.76.1.355-363.2002. 11739700 [DOI] [PMC free article] [PubMed] [Google Scholar]
- 14.Piccoli C., Scrima R., Ripoli M., Di Ianni M., Del Papa B., D’Aprile A., Quarato G., Martelli M.P., Servillo G., Ligas C. Transformation by retroviral vectors of bone marrow-derived mesenchymal cells induces mitochondria-dependent cAMP-sensitive reactive oxygen species production. Stem Cells (Dayton, Ohio) 2008;26(11):2843–2854. doi: 10.1634/stemcells.2007-0885. 18787213 [DOI] [PubMed] [Google Scholar]
- 15.Karin M., Liu Z.g, Zandi E. AP-1 function and regulation. Current Opinion in Cell Biology. 1997;9(2):240–246. doi: 10.1016/s0955-0674(97)80068-3. 9069263 [DOI] [PubMed] [Google Scholar]
- 16.Oláhová M., Taylor S.R., Khazaipoul S., Wang J., Morgan B.A., Matsumoto K., Blackwell T.K., Veal E.A. A redox-sensitive peroxiredoxin that is important for longevity has tissue- and stress-specific roles in stress resistance. Proceedings of the National Academy of Sciences of the United States of America. 2008;105(50):19839–19844. doi: 10.1073/pnas.0805507105. 19064914 [DOI] [PMC free article] [PubMed] [Google Scholar]
- 17.Buettner G.R. Superoxide dismutase in redox biology: the roles of superoxide and hydrogen peroxide. Anti-Cancer Agents in Medicinal Chemistry. 2011;11(4):341–346. doi: 10.2174/187152011795677544. 21453242 [DOI] [PMC free article] [PubMed] [Google Scholar]
- 18.Hitchler M.J., Domann F.E. Redox regulation of the epigenetic landscape in cancer: a role for metabolic reprogramming in remodeling the epigenome. Free Radical Biology & Medicine. 2012;53(11):2178–2187. doi: 10.1016/j.freeradbiomed.2012.09.028. 23022407 [DOI] [PMC free article] [PubMed] [Google Scholar]
- 19.Sarsour E.H., Kumar M.G., Chaudhuri L., Kalen A.L., Goswami P.C. Redox control of the cell cycle in health and disease. Antioxidants & Redox Signaling. 2009;11(12):2985–3011. doi: 10.1089/ars.2009.2513. 19505186 [DOI] [PMC free article] [PubMed] [Google Scholar]
- 20.Spitz D.R., Sim J.E., Ridnour L.A., Galoforo S.S., Lee Y.J. Glucose deprivation-induced oxidative stress in human tumor cells. A fundamental defect in metabolism? Annals of the New York Academy of Sciences. 2000;899:349–362. doi: 10.1111/j.1749-6632.2000.tb06199.x. 10863552 [DOI] [PubMed] [Google Scholar]
- 21.Spooner R., Yilmaz O. The role of reactive-oxygen-species in microbial persistence and inflammation. International Journal of Molecular Sciences. 2011;12(1):334–352. doi: 10.3390/ijms12010334. 21339989 [DOI] [PMC free article] [PubMed] [Google Scholar]
- 22.Brinkley B.R., Beall P.T., Wible L.J., Mace M.L., Turner D.S., Cailleau R.M. Variations in cell form and cytoskeleton in human breast carcinoma cells in vitro. Cancer Research. 1980;40(9):3118–3129. 7000337 [PubMed] [Google Scholar]
- 23.Miller A.D., Rosman G.J. Improved retroviral vectors for gene transfer and expression. BioTechniques. 1989;7(9):980–982. [PMC free article] [PubMed] [Google Scholar]
- 24.Jordan M., Wurm F. Transfection of adherent and suspended cells by calcium phosphate. Methods (San Diego, California) 2004;33(2):136–143. doi: 10.1016/j.ymeth.2003.11.011. 15121168 [DOI] [PubMed] [Google Scholar]
- 25.Balicki D. Moving forward in human mammary stem cell biology and breast cancer prognostication using ALDH1. Cell Stem Cell. 2007;1(5):485–487. doi: 10.1016/j.stem.2007.10.015. 18938743 [DOI] [PubMed] [Google Scholar]
- 26.Ginestier C., Hur M.H., Charafe-Jauffret E., Monville F., Dutcher J., Brown M., Jacquemier J., Viens P., Kleer C.G., Liu S. ALDH1 is a marker of normal and malignant human mammary stem cells and a predictor of poor clinical outcome. Cell Stem Cell. 2007;1(5):555–567. doi: 10.1016/j.stem.2007.08.014. 18371393 [DOI] [PMC free article] [PubMed] [Google Scholar]
- 27.Croker A.K., Goodale D., Chu J., Postenka C., Hedley B.D., Hess D.A., Allan A.L. High aldehyde dehydrogenase and expression of cancer stem cell markers selects for breast cancer cells with enhanced malignant and metastatic ability. Journal of Cellular and Molecular Medicine. 2009;13(8B):2236–2252. doi: 10.1111/j.1582-4934.2008.00455.x. 18681906 [DOI] [PMC free article] [PubMed] [Google Scholar]
- 28.Baum C., Düllmann J., Li Z., Fehse B., Meyer J., Williams D.A., von Kalle C. Side effects of retroviral gene transfer into hematopoietic stem cells. Blood. 2003;101(6):2099–2114. doi: 10.1182/blood-2002-07-2314. [DOI] [PubMed] [Google Scholar]
- 29.Hacein-Bey-Abina S., Von Kalle C., Schmidt M., McCormack M.P., Wulffraat N., Leboulch P., Lim A., Osborne C.S., Pawliuk R., Morillon E. LMO2-associated clonal T cell proliferation in two patients after gene therapy for SCID-X1. Science (New York, NY) 2003;302(5644):415–419. doi: 10.1126/science.1088547. 14564000 [DOI] [PubMed] [Google Scholar]
- 30.Check E. Cancer fears cast doubts on future of gene therapy. Nature. 2003;421(6924):678. doi: 10.1038/421678b. 12610583 [DOI] [PubMed] [Google Scholar]
- 31.Amarante M.K., Watanabe M.A. The possible involvement of virus in breast cancer. Journal of Cancer Research and Clinical Oncology. 2009;135(3):329–337. doi: 10.1007/s00432-008-0511-2. 19009309 [DOI] [PMC free article] [PubMed] [Google Scholar]
- 32.Bushman F., Lewinski M., Ciuffi A., Barr S., Leipzig J., Hannenhalli S., Hoffmann C. Genome-wide analysis of retroviral DNA integration. Nature Reviews: Microbiology. 2005;3(11):848–858. doi: 10.1038/nrmicro1263. 16175173 [DOI] [PubMed] [Google Scholar]
- 33.Lewinski M.K., Yamashita M., Emerman M., Ciuffi A., Marshall H., Crawford G., Collins F., Shinn P., Leipzig J., Hannenhalli S. Retroviral DNA integration: viral and cellular determinants of target-site selection. PLoS Pathogens. 2006;2(6):e60. doi: 10.1371/journal.ppat.0020060. 16789841 [DOI] [PMC free article] [PubMed] [Google Scholar]
- 34.Southern P.J., Berg P. Transformation of mammalian cells to antibiotic resistance with a bacterial gene under control of the SV40 early region promoter. Journal of Molecular and Applied Genetics. 1982;1(4):327–341. 6286831 [PubMed] [Google Scholar]
- 35.Vara J., Malpartida F., Hopwood D.A., Jiménez A. Cloning and expression of a puromycin N-acetyl transferase gene from Streptomyces alboniger in Streptomyces lividans and Escherichia coli. Gene. 1985;33(2):197–206. doi: 10.1016/0378-1119(85)90094-0. 3888783 [DOI] [PubMed] [Google Scholar]
- 36.Daigle D.M., McKay G.A., Thompson P.R., Wright G.D. Aminoglycoside antibiotic phosphotransferases are also serine protein kinase. Chemistry & Biology. 1999;6(1):11–18. doi: 10.1016/S1074-5521(99)80016-7. [DOI] [PubMed] [Google Scholar]
- 37.Daigle D.M., McKay G.A., Wright G.D. Inhibition of aminoglycoside antibiotic resistance enzymes by protein kinase inhibitors. Journal of Biological Chemistry. 1997;272(40):24755–24758. doi: 10.1074/jbc.272.40.24755. 9312069 [DOI] [PubMed] [Google Scholar]
- 38.Neumeister V., Rimm D. Is ALDH1 a good method for definition of breast cancer stem cells? Breast Cancer Research and Treatment. 2010;123(1):109–111. doi: 10.1007/s10549-009-0656-y. 19946740 [DOI] [PubMed] [Google Scholar]
- 39.Resetkova E., Reis-Filho J.S., Jain R.K., Mehta R., Thorat M.A., Nakshatri H., Badve S. Prognostic impact of ALDH1 in breast cancer: a story of stem cells and tumor microenvironment. Breast Cancer Research and Treatment. 2010;123(1):97–108. doi: 10.1007/s10549-009-0619-3. 19911270 [DOI] [PubMed] [Google Scholar]
- 40.Charafe-Jauffret E., Ginestier C., Bertucci F., Cabaud O., Wicinski J., Finetti P., Josselin E., Adelaide J., Nguyen T.T., Monville F. ALDH1-positive cancer stem cells predict engraftment of primary breast tumors and are governed by a common stem cell program. Cancer Research. 2013;73(24):7290–7300. doi: 10.1158/0008-5472.CAN-12-4704. 24142344 [DOI] [PubMed] [Google Scholar]
Associated Data
This section collects any data citations, data availability statements, or supplementary materials included in this article.
Supplementary Materials
Supplementary data
Supplementary data