

Abstract
Aspartame, an artificial sweetener, is very widely used in many foods and beverages. But there are controversies about its metabolite which is marked for its toxicity. Hence it is believed to be unsafe for human use. Previous studies have reported on methanol exposure with involvements of free radicals on excitotoxicity of neuronal apoptosis. Hence, this present study is proposed to investigate whether or not chronic aspartame (FDA approved Daily Acceptable Intake (ADI),40 mg/kg bwt) administration could release methanol, and whether or not it can induce changes in brain oxidative stress status and gene and protein expression of anti-apoptotic Bcl-2 and pro-apoptotic Bax and caspase-3 in the rat brain region. To mimic the human methanol metabolism, Methotrexate (MTX)-treated Wistar strain male albino rats were used and after the oral administration of aspartame, the effects were studied along with controls and MTX-treated controls. Aspartame exposure resulted with a significant increase in the enzymatic activity in protein carbonyl, lipid peroxidation levels, superoxide dismutase, glutathione-S-transferase, glutathione peroxidase and catalase activity in (aspartame MTX)-treated animals and with a significant decrease in reduced glutathione, glutathione reductase and protein thiol, pointing out the generation of free radicals. The gene and protein expression of pro apoptotic marker Bax showed a marked increase whereas the anti-apoptotic marker Bcl-2 decreased markedly indicating the aspartame is harmful at cellular level. It is clear that long term aspartame exposure could alter the brain antioxidant status, and can induce apoptotic changes in brain.
Keywords: Free radical, Oxidative stress, Antioxidant, Apoptosis, Aspartame, Mitochondria
Highlights
-
•
Aspartame administration alters the functional activity in the brain by elevating the antioxidant levels.
-
•
Chronic aspartame consumption altered the neuronal function and neurodegeneration in brain.
-
•
Observed changes may be due to the methanol or its metabolite.
-
•
Long-term FDA approved daily acceptable intake (40 mg/kg bwt) aspartame administration distorted the brain function and generated apoptosis in brain regions.
Introduction
Aspartame (l-aspartyl-l-phenylalanine methyl ester) is a low calorie artificial sweetener consumed by 200 million people worldwide. In 1965 aspartame was discovered by James Schlatter and was approved for use by the FDA in the 1970s. This sweetener is added to many soft beverages, cakes etc., and its usage is increasing in health conscious societies as used in the weight reduction regime [1]. Upon ingestion approximately 50% of the aspartame molecule is phenylalanine, 40% is aspartic acid and 10% is methanol [2]. Based on the literature study Kruse [3] suggested that among the metabolites, methanol is a toxicant that causes systemic toxicity. Parthasarathy et al. [4], reported that methanol is primarily metabolized to formaldehyde and then to formate, accompanied by the formation of superoxide anion and hydrogen peroxide. There are a few reports on aspartame consumption on various neurological effects that include headache, insomnia and seizures [5], alterations in regional concentrations of catecholamine [6] which is accompanied with behavioral disturbances [7]. The accumulation of formate rather than methanol is itself considered to cause methanol toxicity [8]. In addition to that, inhibition of cytochrome oxidase by formate also leads to the generation of superoxide, peroxyl and hydroxyl radicals [9]. Methanol intoxication is associated with mitochondrial damage and increased microsomal proliferation, resulting in increased production of oxygen radicals [10–11]. Oxidative stress is defined as an imbalance between the elevated level of reactive oxygen species (ROS) and/or impaired function of the antioxidant defense system. Aspartame can affect the brain and their by the behavior [12]. Free radical overproduction directly causes death of immature cultured cortical neurons [13] and directly induces DNA damage [14].
Of all the organs in the body, the CNS takes more than its share of oxidative abuse. This is associated with the abundance of redox active transition metal ions, and the relative death of antioxidant defense system [15]. Chandra et al. [16], reported that reactive oxygen species (ROS) can trigger apoptosis. Besides the high oxygen consumption and the presence of high levels of polyunsaturated fatty acids (PUFA), the brain can be the target for free radicals [17] makes them even more venerable to oxidative stress. There is accumulating evidence of a direct involvement of the cellular redox status in the activation and the functioning of the apoptosis machinery [18]. Scaiano et al. [19], has reported that free radicals were responsible for induction of cellular damage that leads to chromosomal aberrations. Apoptosis, a form of programmed cell death, plays an important role in embryogenesis and in the normal development and maintenance of many adult tissues [20–21]. Apoptosis is tightly regulated by the expression or activation of several genes and proteins [22]. The initiation and execution of apoptosis depend on activation of the receptor and/or mitochondrial-dependent death pathways [23–25]. The Bax (Bcl-2 associated X protein) gene was the first identified pro-apoptotic member of the Bcl-2 protein family (B-cell lymphoma-2) [26]. In the nervous system, Bcl-2 protects against various stimuli that induce apoptotic neuronal death [27–28]. The mitochondrial Bcl2 gene family of proteins has been demonstrated to be important for regulating apoptosis induced by a variety of stimuli [26,29]. Caspases (cysteine-aspartic proteases or cysteine-dependent aspartate-directed proteases) are a family of cysteine proteases that play an essential role in apoptosis (programmed cell death). Caspase-3 activation may play a key role in triggering apoptosis in neuronal cells which has also been suggested by Stefanis et al. [30].
Due to the high liver folate content, rodents do not develop metabolic acidosis during methanol poisoning as formate is metabolized quickly. Only folate deficient rodents are required to accumulate formate in order to develop acidosis and to study methanol poisoning [31–32]. Hence, in this study, to mimic the human situation, a folate deficiency status was induced by administering Methotrexate (MTX) and folate deficient diet. Many concerns have been raised about the side effects of aspartame consumption and its safety. Our earlier study report (for 75 mg/day aspartame) showed a marked increase in blood methanol level, whether the chronic oral administration of aspartame (40 mg/kg bwt) can also accumulate methanol after metabolism, and further to investigate the antioxidant status in brain and there by any alteration in the apoptotic genes forms the basis of this study.
Materials and methods
Animals
Wistar strain male albino rats (200–220 g) were maintained under standard laboratory conditions with water and food. For the folate deficient group folate deficient diet was provided for 45 days prior to the experiment and MTX was administered for a week before the experiment. The animals were handled according to the principles of laboratory care framed by the committee for the purpose of Control and Supervision of Experiments on Animals (CPCSEA), Government of India. Prior to the experimentation proper approval was obtained from the Institutional Animal Ethical Committee (no: 01/032/2010/Aug-11).
Chemicals
Aspartame and Methotrexate were purchased from Sigma chemical company, St. Louis, MO, USA. Bovine serum albumin, Malondialdehyde from Sisco Research Laboratory, Bombay, India. Taq-polymerase, DNTPs from (Genet Bio) China, RT enzyme kit from Thermo scientific, USA and other molecular grade chemicals from Merck, Bangalore, India. Antibody was purchased from Pierce, USA. All other chemicals were of analytical grade obtained from Sisco research Laboratory, Bombay, India.
Experimental design
Aspartame dose
The European Food Safety Authority confirmed its Daily acceptable intake (ADI) for aspartame 40 mg/kg bwt/day. In order to confine within the human permitted exposure limit this dose was selected. Aspartame mixed in sterile saline was administered orally (40 mg/kg body weight) and this dosage based on the FDA approved ADI limit [33].
Groups
The rats were randomly divided into three groups, namely, saline control, folate deficient (MTX-treated) control, and MTX-treated (folate deficient) with aspartame administered groups. Each group consisted of six animals. Methotrexate (MTX) in sterile saline was administered (0.2 mg/kg/day) subcutaneously for 7 days to folate-deficient groups [34]. After 7 days administration with MTX, folate deficiency was confirmed by estimating the urinary excretion of formiminoglutamic acid (FIGLU) [35]. From the eighth day, the MTX-treated (folate deficient) (third) group were administered orally with aspartame for 90 days, whereas the saline control and (folate deficient) MTX treated control groups received equivalent volumes of saline as an oral dose and all animals were handled similarly.
Sample collections
The animals were sacrificed using higher dose of long acting pentothal sodium (100 mg/kg bwt). The blood samples and isolation of brain was performed between 8 and 10 a.m. to avoid circadian rhythm induced changes. The brain was immediately removed and washed with ice-cold phosphate buffered saline (PBS). Further dissection was made on ice-cold glass plate. The discrete regions of brain (cerebral cortex, cerebellum, midbrain, pons medulla, hippocampus and hypothalamus) were dissected according the method given by Glowinski and Iverson [36]. The homogenate (10% w/v) of the individual regions were prepared in a Teflon-glass tissue homogenizer, using ice-cold PBS (100 mm, pH 7.4) buffer and centrifuged separately in refrigerated centrifuge at 3000 rpm for 15 min. The supernatant was used for analyzing the parameters in this study.
Parameters
Free radical scavenging enzymes
Interference of free radicals in auto oxidation of pyrogallol is used as a convenient assay for superoxide dismutase (SOD) (EC.1.15.1.1) and expressed as units/min/mg protein [37]. For catalase (EC.1.11.1.6) assay, standard hydrogen peroxide (0.2 M) was used as substrate and the catalase activity was terminated at intervals of 0, 15, 30, and 60 s by addition of potassium dichromate–acetic acid reagent and is expressed as units/min/mg protein [38]. Glutathione peroxidase (EC.1.11.1.9) (GPx) activity was assayed by its ability to utilize the standard glutathione in the presence of specific amount of hydrogen peroxide (1 mM) and is expressed as units/min/mg protein [39]. Glutathione-S-transferase (GST) was estimated by the method of William et al. [40]. The activity of GST in tissues is expressed as µmoles of 1-chloro-2,4-dinitrobenzene (CDNB) utilized/min/mg of protein.
Reduced glutathione (GSH) and glutathione reductase (GR)
Reduced glutathione (GSH) was measured by its reaction with 5.5-dithiobis 2 nitro-benzoic acid (DTNB), to form a compound that absorbs at 412 nm [41]. The level of GSH is expressed as µg of GSH/mg of protein. The activity of glutathione reductase was estimated by the method of Charles and Robert [42]. The activity of GR in tissues is expressed as nanomoles of NADPH oxidized/min/mg protein.
Lipid peroxidation
Lipid peroxidation was measured by estimating malondialdehyde (MDA), an intermediary product of lipid peroxidation, using thiobarbituric acid and is expressed as nanomoles of malondialdehyde (an intermediary product of lipid peroxidation)/mg protein [43].
Protein estimation
Discrete regions of brain tissues were homogenized in phosphate buffered saline (PBS) pH 7.4, and debris removed by centrifugation at 12,000g for 10 min. The supernatants were recovered and the protein concentration was determined, according to the method of Lowry et al. [44], using bovine serum albumin as a standard.
Protein carbonyls and thiol
Protein carbonyl contents in homogenates prepared from cerebral cortex, cerebellum, mid brain, pons medulla, hippocampus and hypothalamus were analyzed by 2,4-dinitrophenylhydrazine (DNPH) method as described by Levine et al. [45]. Protein bound (ie. in the membrane plus the soluble fraction) sulfhydryl concentration was determined by the method of Sedlack and Lindsay [46] by subtracting the nonprotein sulfhydryl content from the total sulfhydryl content. Tissues were homogenized in 0.02?M EDTA solution and analyzed for protein and sulfhydryl concentration.
Plasma methanol level using HPLC
100 mL plasma was deproteinized with equal volume of acetonitrile and centrifuged for 7 min at 4 °C [47]. The supernatant (20 mL) was analyzed for blood methanol and formate using an HPLC refractive index detector system (Diagram-5) (Shimadzu RID, Japan) (equipped with Rezex ROA-organic acid column 300 × 7.5 mm2 I.D., Phenomenex) with the security guard cartridge (AJO 4490 Phenomenex). Column oven was used to maintain the temperature at 60 °C. The mobile phase was 0.026 N sulfuric acid [48]. By using methanol as an external standard, the recovery of methanol (HPLC grade) from blood was found to be 92–96%. Linearity for methanol was found to be 5–500 mg/100 mL. The detector sensitivity for methanol was found to be 5 mg/100 mL and reproducibility was >93%.
Isolation of total RNA and reverse transcription-polymerized chain reaction (RT-PCR)
Total RNA was isolated from cells using Trizol reagent following the method of Chomczynski and Sacchi [49]. The total RNA obtained was free from protein and DNA contamination. The reverse transcription step was performed by using the RT enzyme kit. Each 20 µL reaction mixture contained 5 µL Oligo(dT) (10 µM), 1 µL dNTP(10 µM), 4 µL First Strand buffer (5×), 1 µL DTT (0.1 M), 0.2 µL super Script III reverse transcriptase(200 U/µL) varied quantity of RNA template (dependent on RNA concentration) and RNase free water to make up the volume. Thermal cycling conditions for first strand reaction consisted of 25 °C for 5 min, 50 °C for 45 min, 70 °C for 15 min and finally maintained at 4 °C for 5 min. PCR amplification was performed using Taq DNA Polymerase. Each 20 µL of sample contained 10 µL Master mix (2 µM), 1 µL forward primer, 1 µL reverse primer for both gene of interest and internal control consecutively, 2 µL RT sample, and 4 µL sterile water. The mixture was kept at thermocycler and amplified for 35 cycles. Each thermocycling consisted of 94 °C for 30 s, varied annealing temperature for each gene of interest for 30 s, 72 °C for 30 s ß-actingene was co-amplified with apoptotic genes Bcl2, Bax and caspase 3 gene using the same procedures. The sense and antisense primer for the study is tabulated in Table 1. Ten cubic millimeters of each PCR product was analyzed by gel electrophoresis on 2% agarose gel.
Table 1.
The sense and antisense primer sequences of the gene of interest for PCR amplification.
| Target gene | Primer sequence (5'? 3') | Amplicon size (bp) | Anneal. temp/ cycles |
|---|---|---|---|
| Bax | Sense: GACACCTGAGCTGACCTTGG Antisense: GAGGAAGTCCAGTGTCCAGC |
310 | 58 °C/35 |
| Bcl2 | Sense: GGGATGCCTTTGTGGAACTA Antisense: CTCACTTGTGGCCCAGGTAT |
138 | 56 °C/35 |
| Caspase 3 | Sense: AGTTGGACCCACCTTGTGAG Antisense: AGTCTGCAGCTCCTCCACAT |
298 | 55 °C/35 |
| ß-actin | Sense: TCATGCCATCCTGCGTCTGGACCT Antisense:CGGACTCATCGTACTCCTGCTTG |
598 | 55 °C/ 35 |
Agarose gel electrophoresis is an effective method for the identification of purified DNA molecules [50]. Amplified product was analyzed by agarose gel electrophoresis with ethidium bromide staining. Then the gel containing cDNA was visualized with the help of fluorescent imager (Bio-Rad, USA). The Band intensity was quantified by Quantity One Software. The band intensification for each enzyme mRNA was normalized with that of the internal control ß-actin using Quantity One Software.
Immunoblotting
Tissue lysate was prepared with radio immunoassay buffer (RIPA) (Sigma) and protease inhibitor. Equal amounts of protein (60 µg) were electrophoresed on 10% SDS-PAGE. Following electrophoresis, separated proteins on SDS-PAGE gels were transferred on PVDF membrane (Millipore, USA). To block the nonspecific binding, the membranes were incubated blocking buffer with 5% skimmed milk for 2 h. Membranes were probed with primary antibodies active caspase 3, Bax, and Bcl2 protein (Biovision). Blots were incubated with horseradish peroxidase-conjugated secondary antibodies (1:10,000) (Merck). The bands were developed using ECL kit (Millipore, USA) in Chemi Doc image scanner from Bio-Rad. The band intensity was quantified by Quantity One software (Bio-Rad, USA). The membranes were stripped and reprobed for ß-actin (Sigma) (1:5000) as an internal control.
Histopathology
Animals were deeply anesthetized with ketamine hydrochloride. Rats were then perfused transcardially with phosphate-buffered saline, followed by buffered 10% formalin. The brain, was removed, and preserved in formalin until processed for histology. Then tissue was kept in the running water to remove formalin pigments, and dehydrated with ascending grades of alcohol. After impregnation with paraffin wax, the paraffin blocks were made. They were processed and sections were cut with 10 µm in thickness using Spencer Lens, rotatory microtome (no. 820, NY, USA) and then stained with hematoxylin and eosin as follows for brain.
Immunohistochemical analysis
Immunohistochemical analysis was carried out using the DAB universal staining kit (Merck Genie, Bengaluru, India). The sections were deparaffinized in xylene and dehydrated in ethanol. After washing with PBS, slides were incubated with 3% H2O2 in at room temperature for 15 min to quench endogenous peroxidase activity. After antigen retrieval (15 min of autoclaving in 10 mM citrate buffer, pH 6.0), the slides were incubated with blocking solution (10% normal goat serum) for 5 min at room temperature. Then, the sections were incubated overnight with primary antibody. Subsequently, the sections were incubated with HRP secondary link antibody for 30 min at room temperature, washed with PBS. Then, the sections were treated with DAB chromogen for 15 min. Finally, the sections were washed with deionized water, counterstained with hematoxylin and mounted. Photographs were taken using Nikon microscope.
Statistical analysis
All the data from various groups were analyzed for the individual parameter by ANOVA. When there is a significant ‘F’ test ratio the data were further analyzed with Tukey’s multiple comparison by fixing the significance at P < 0.05. For understanding the aspartame effect, the MTX treated groups act as strict controls.
Result
Enzymatic and non-enzymatic activities of free radical scavenging enzymes
Superoxide dismutase (SOD)
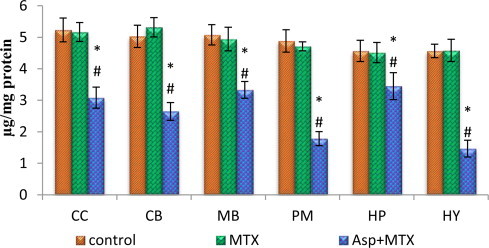
The data from various groups are presented as bar diagram with mean ± SD (Fig. 1). Activity of SOD increased significantly in aspartame treated MTX animals in the regions cerebral cortex (F = 8.7, df = 2), cerebellum (F = 8.9, df = 2), midbrain (F = 25, df = 2), pons-medulla (F = 21, df = 2), hippocampus (F = 119, df = 2) and hypothalamus (F = 11, df = 2) when compared to control and MTX treated control. However, the control did not deviate from the MTX treated control animals.
Fig. 1.
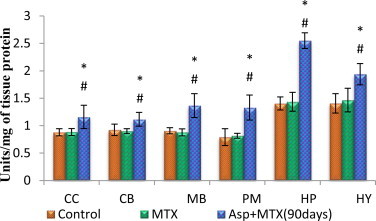
Effect of aspartame (40 mg/kg bwt) on superoxide dismutase (SOD) activity (units/mg of tissue protein) in rat brain discrete regions. CC = cerebral cortex; CB = cerebellum, MB = midbrain; PM = ponsmedulla; HP = hippocampus; HY = hypothalamus. Comparison and analysis were done by the one-way analysis of variance (ANOVA) (n = 6), control group was compared with MTX control group and aspartame MTX group, MTX control group was compared with Aspartame MTX group. Control, MTX control – Methotrexate treated group; Asp + MTX – Aspartame + Methotrexate treated group.The data from various groups for the individual parameters are presented as bar diagram with mean ± SD. significance fixed at P < 0.05, aspartame treated group when compared to control significance is marked as * and MTX treated groups significance is marked as #.
Catalase
The data from various groups are presented as bar diagram with mean ± SD (Fig. 2). The activity of catalase was increased markedly in all the regions of brain (cerebral cortex (F = 27, df = 2), cerebellum(F = 34, df = 2), midbrain (F = 53, df = 2), pons-medulla (F = 14, df = 2), hippocampus (F = 25, df = 2) and hypothalamus (F = 50, df = 2)) in aspartame treated MTX animals with respect to control and MTX treated control. However, the control did not deviate from the MTX treated control animals.
Fig. 2.
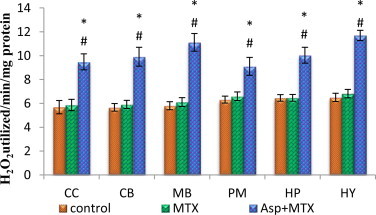
Effect of aspartame (40 mg/kg bwt) on catalase (CAT) activity (H2O2 utilized /min/mg protein) in rat brain discrete regions.
Glutathione peroxidase
The data from various groups are presented as bar diagram with mean ± SD (Fig. 3). The activity of glutathione peroxidase was markedly increased in the brain discrete regions (cerebral cortex (F = 153, df = 2), cerebellum (F = 151, df = 2), midbrain (F = 43, df = 2), pons-medulla (F = 152, df = 2), hippocampus (F = 150, df = 2) and hypothalamus (F = 237, df = 2)) of aspartame treated MTX animals when compared to control and MTX treated controls. However, the control did not deviate from the MTX treated control animals.
Fig. 3.
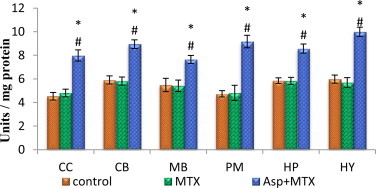
Effect of aspartame (40 mg/kg bwt) on glutathione peroxidase (GPx) concentration (units/mg of protein) in rat brain discrete regions.
Reduced glutathione
The data from various groups are presented as bar diagram with mean ± SD (Fig. 4). The activity of reduced glutathione was decreased in the entire brain regions studied such as cerebral cortex (F = 62, df = 2), cerebellum (F = 39, df = 2), midbrain (F = 40, df = 2), pons-medulla (F = 38, df = 2), hippocampus (F = 33, df = 2) and hypothalamus (F = 50, df = 2) in aspartame treated MTX animals when compared to control and MTX treated control. The control and the MTX treated controls did not differ from each other.
Fig. 4.
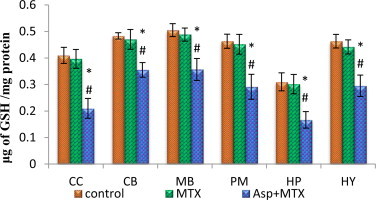
Effect of aspartame (40 mg/kg bwt) on reduced glutathione (GSH) concentration (µg of GSH/mg of protein) in rat brain discrete regions.
Glutathione reductase
The data from various groups are presented as bar diagram with mean ± SD (Fig. 5). The activity of glutathione reductase was decreased in all the brain discrete regions (cerebral cortex (F = 4.11, df = 2), cerebellum (F = 6.67, df = 2), midbrain (F = 8.42, df = 2), pons-medulla (F = 19, df = 2), hippocampus (F = 172, df = 2) and hypothalamus (F = 20, df = 2)) of aspartame MTX treated animals when compared to control and MTX treated controls.
Fig. 5.
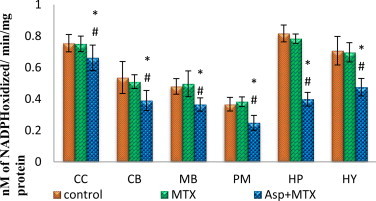
Effect of aspartame (40 mg/kg bwt) on glutathione reductase (GR) concentration (nM of NADPH oxidized/min/mg protein) in rat brain discrete regions.
Glutathione-S-transferase
The data from various groups are presented as bar diagram with mean ± SD (Fig. 6). Glutathione S transferase in the aspartame treated MTX animals was markedly increased from the control and MTX treated control in the following regions cerebral cortex (F = 71, df = 2), cerebellum (F = 33, df = 2), midbrain (F = 87, df = 2), pons-medulla (F = 19, df = 2), hippocampus (F = 32, df = 2) and hypothalamus (F = 72, df = 2). The control as well as MTX treated animals show similar results.
Fig. 6.
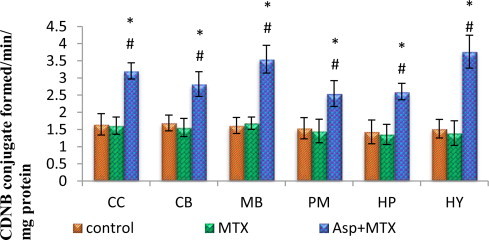
Effect of aspartame (40 mg/kg bwt) on glutathione-S-transferase (GST) (CDNB conjugate formed/min/mg protein) in rat brain discrete regions.
Lipid peroxidation
The data from various groups are presented as bar diagram with mean ± SD (Fig. 7). The level of lipid peroxidation was increased markedly in all the regions of brain of aspartame treated MTX animals compared to control and MTX treated control in the following regions, cerebral cortex (F = 73, df = 2), cerebellum (F = 313, df = 2), midbrain (F = 206, df = 2), pons-medulla (F = 362, df = 2), hippocampus (F = 135, df = 2) and hypothalamus(F = 811, df = 2). The control as well as MTX treated controls showed similar lipid peroxidation level.
Fig. 7.
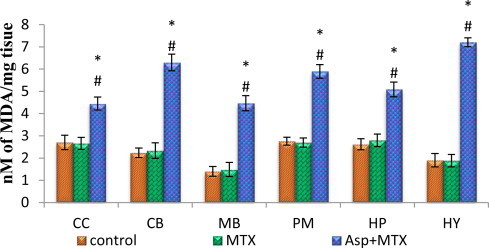
Effect of aspartame (40 mg/kg bwt) on lipid peroxidation (LPO) (nmoles of MDA/mg tissue) in rat brain discrete regions.
Protein carbonyl and thiol
The data from various groups are presented as bar diagram with mean ± SD (Figs. 8 and 9). The level of protein carbonyl was found to be increased in all the regions of brain in aspartame treated MTX animals when compared with control as well as MTX treated control in the following regions cerebral cortex (F = 143, df = 2), cerebellum (F = 23, df = 2), midbrain (F = 24, df = 2), pons-medulla (F = 14, df = 2), hippocampus (F = 64, df = 2) and hypothalamus (F = 132, df = 2). The sulfhydryl (thiol) content of membrane proteins was decreased markedly in the aspartame treated MTX animals when compared to control and MTX treated control in the following regions, cerebral cortex (F = 78, df = 2), cerebellum (F = 129, df = 2), midbrain (F = 53, df = 2), pons-medulla (F = 275, df = 2), hippocampus (F = 17, df = 2) and hypothalamus (F = 239, df = 2). The control as well as MTX treated animals show similar results.
Fig. 8.
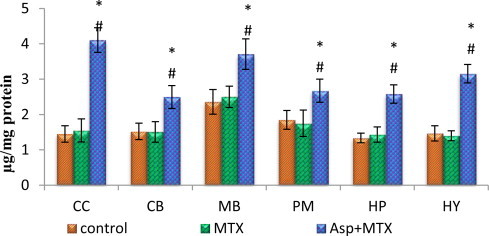
Effect of aspartame (40 mg/kg bwt) on protein carbonyl (µg/mg protein) in rat brain discrete regions.
Fig. 9.
Effect of aspartame (40 mg/kg bwt) on protein thiol (µg/mg protein) in rat brain discrete regions.
Plasma methanol level
The data from various groups are presented as bar diagram with mean ± SD (Fig. 10). The methanol level in the MTX treated control animals did not differ from the saline controls. However, the aspartame treated MTX animals showed a marked increase (F = 140, df = 2) in the plasma methanol level from control and MTX treated control animals. The control as well as MTX treated animals showed no variation.
Fig. 10.
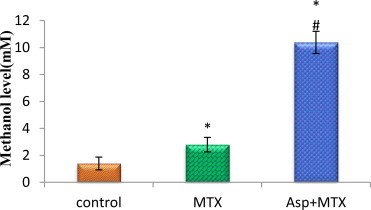
Effect of aspartame (40 mg/kg bwt) on blood methanol level (mM) in rat.
Expression of apoptotic factors
Bax gene expression
The results are given in Fig. 11. Effect of long term aspartame on Bax, Bcl2 and caspase 3 mRNA expression in brain regions of Wistar albino rats. Using ß-actin as an internal control the Bax gene expression was studied. The Bax gene expression in the MTX control animals did not significantly differ from the controls. However, the aspartame treated MTX animals showed a marked increase in the Bax gene expression in the brain discrete regions namely cerebral cortex (F = 57.62, df = 2), cerebellum (F = 48.83, df = 2), hippocampus (F = 97.80, df = 2) and hypothalamus (F = 27.74, df = 2) from control and MTX control animals.
Fig. 11.
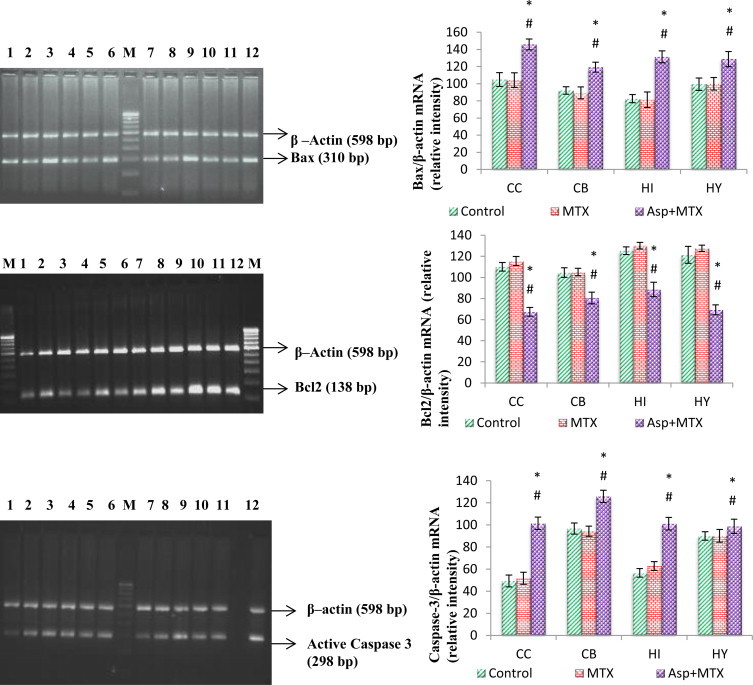
Effect of long term aspartame on Bax, Bcl2 and active caspase 3 apoptotic expression in brain regions of Wistar albino rats.
Bcl2 gene expression
The results are given in Fig. 11. Using ß-actin as an internal control the Bcl2 expression is studied. The Bcl2 gene and expression in the MTX control animals did not significantly differ from the controls. However, the aspartame treated MTX animals showed a marked decrease in the Bcl2 gene expression in the brain discrete regions namely cerebral cortex (F = 243.29, df = 2), cerebellum (F = 58.96, df = 2), hippocampus (F = 114.14, df = 2) and hypothalamus (F = 222.61, df = 2) from control and MTX control animals.
Activated caspase 3
The results are given in Fig. 11. The activated caspase 3 was studied by using ß-actin as an internal control. The activated caspase 3 in the MTX control animals did not significantly differ from the controls. However, the aspartame treated MTX animals showed a marked increase in the activated caspase 3 in the brain discrete regions namely cerebral cortex (F = 174.98, df = 2), cerebellum (F = 71.51, df = 2), hippocampus (F = 167.36, df = 2) and hypothalamus (F = 5.08, df = 2) from control and MTX control animals.
Protein expression
The results are given in Fig. 12. Effect of long term aspartame induced changes on Bcl2, Bax protein expression and activated caspase 3 in brain regions of Wistar albino rats. Using ß-actin as an internal control the Bax protein expressions and activated caspase 3 were studied. The Bax protein expressions and activated caspase 3 in the MTX control animals did not significantly differ from the controls. However, the aspartame treated MTX animals showed a marked increase in the Bax protein expression and activated caspase 3 in the brain discrete regions namely cerebral cortex (F = 23.59, df = 2), cerebellum (F = 5.78, df = 2), and hippocampus (F = 6.14, df = 2) from control and MTX control animals.
Fig. 12.
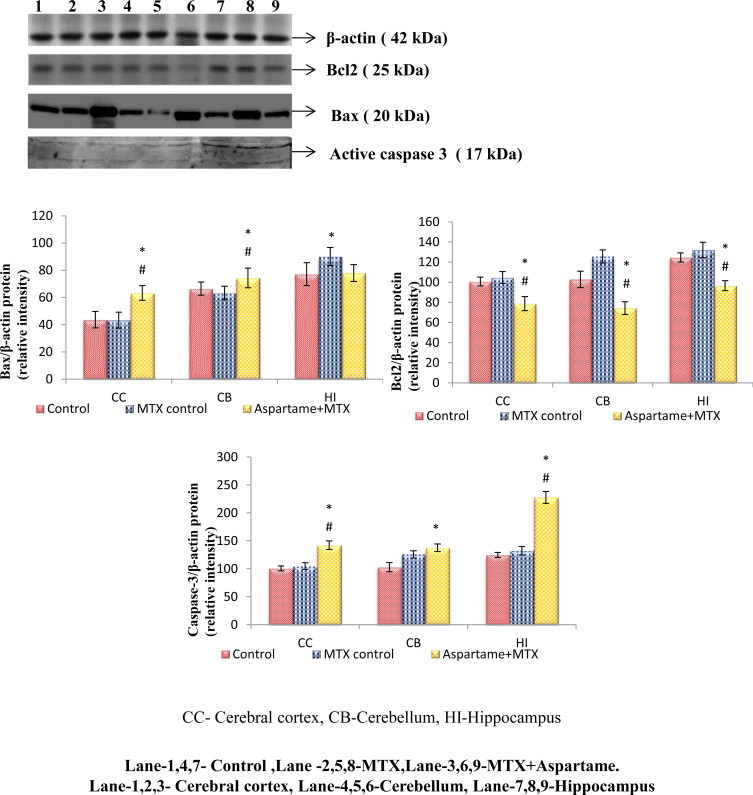
Effect of long term aspartame on Bcl2, Bax, and active caspase 3 protein expression in brain regions of Wistar albino rats.
The Bcl2 protein expression in the MTX control animals did not significantly differ from the controls. However, the aspartame treated MTX animals showed a marked decrease in the Bcl2 protein expression in the brain discrete regions namely cerebral cortex (F = 34.07, df = 2), cerebellum (F = 81.03, df = 2), and hippocampus (F = 60.35, df = 2) from control and MTX control animals.
Histopathology of brain
Hematoxylin and Eosin (H&E) staining was performed on brain hippocampal region. The results are given in (Fig. 13) Effect of long term aspartame (40 mg/kg bwt) on brain in Wistar albino rats, the histomicrograph of brain stained by H&E. Upon gross examination, the normal neuronal morphology of pyramidal cell layers of Cornu Ammonis 1, 2 and 3 and denate gyrus in the hippocampus of control and MTX control were observed. Aspartame + MTX treated animal’s shows the neuronal shrinkage of hippocampal layer due to degeneration of pyramidal cells, as visualized by H&E, when compared to control and MTX controls. At higher magnification, H&E staining revealed the abnormal neuronal morphology of pyramidal cell layers of Cornu Ammonis 1, 2 and 3 and denate gyrus in the hippocampus of aspartame treated MTX animals. In contrast, the aspartame treated MTX animals showed the morphology of pyramidal cell layers appeared disorganized, less intensely stained. Furthermore, the number of densely stained cell bodies in the pyramidal cell layers was decreased in aspartame treated MTX animals and the morphology was first observed, suggesting the major afferent and efferent projections were undergoing widespread degeneration when compared to the control animals and MTX treated control animals.
Fig. 13.
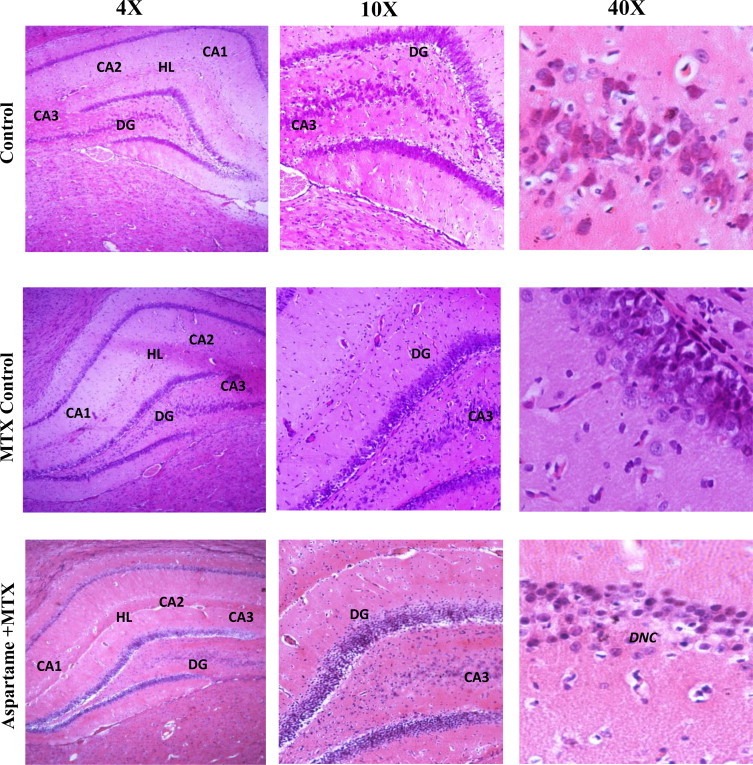
Effect of long term aspartame (40 mg/kg bwt) on brain in Wistar albino rats, the histomicrograph of brain stained by hematoxylin and eosin.
Immunohistochemistry
The results are given in Fig. 14 Effect of long term aspartame on activated Caspase 3 and Bax protein expression in brain of Wistar albino rats by immunohistochemistry. The photomicrograph shows a significant amount of neurons with immune reaction for activated Caspase 3 and Bax protein as brown colored neuronal cells that are considered as positive cells in the brain. Aspartame treated animals brain region showed a marked increase in the activated caspase 3 and Bax positive cells when compared to the control and MTX control. The overall results indicate that aspartame could effectively bring changes at cellular level.
Fig. 14.
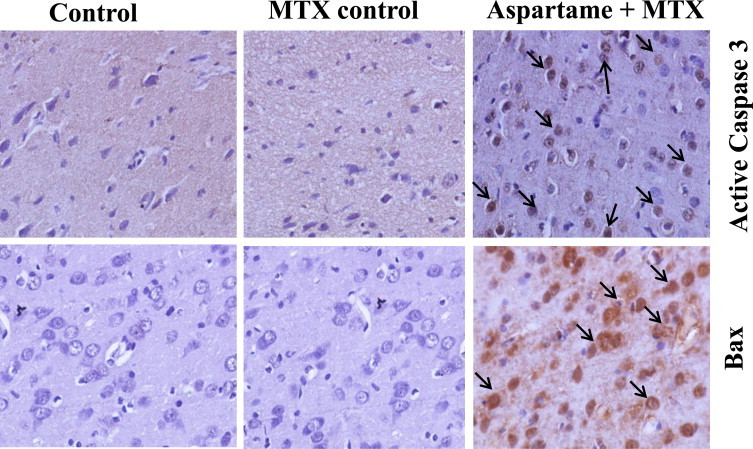
Effect of long term aspartame on active caspase 3 and Bax protein expression in brain of Wistar albino rats by immunohistochemistry.
Discussion
The present study confirms that daily oral administration of 40 mg/kg of aspartame for 90 days led to alterations in the antioxidant status by inducing free radicals in the brain. Ashok and Sheeladevi [51] reported chronic exposure to aspartame (75 mg/kg bwt) induced detectable methanol level in blood. In this study, the blood methanol was elevated markedly after aspartame ingestion (40 mg/kg bwt) which is the Daily acceptable intake permitted level. Ishak et al. [52], reported that the derivatives of such metabolism are sometimes more toxic than the initial substance which is true in the case of aspartame as methanol is released after metabolism. According to Jeganathan and Namasivayam [53] methanol is toxic to brain as the increased blood methanol level can lead to severe shifts in brain monoamine levels. It is well known that the nervous system is highly susceptible for methanol intoxication. Due to the high liver folate content, rodents do not develop metabolic acidosis during methanol poisoning as formate is metabolized quickly. Only folate deficient rodents are required to accumulate formate in order to develop acidosis and to study methanol poisoning [31–32]. Hence, in this study, to mimic the human situation, a folate deficiency status was induced to study the methanol toxicity upon aspartame administration
Free radical generation by methanol the toxic metabolite
The free radical increase in the present study may be due to the methanol that has been released during aspartame metabolism, as the pathway leading to formate by catalase system is discontinued by MTX administration.
Maria et al. [54], provided the conclusive evidence about the generation of methanol-derived free radical metabolites. Goodman and Tephly [55] reported that methanol is metabolized via three enzyme systems, namely the alcohol dehydrogenase system, the catalase per oxidative pathway and the microsomal oxidizing systems. Among these microsomal oxidizing system is reported to be responsible for free radical generation. In this study as folate deficient animals are used to mimic the human metabolism of methanol the catalase per oxidative pathway is much declined.
The cells are generally protected with an extensive antioxidant defense system. In this study the aspartame-treated MTX animals increased lipid peroxidation with alteration in the enzymatic and non-enzymatic scavenging system warrant the generation of free radicals. The increase in free radicals could not be ignored as cells can be injured or killed when the ROS generation overwhelms the cellular antioxidant capacity [56]. The increase in the lipid peroxidation could not be neglected as it is an auto catalytic mechanism leading to oxidative destruction of cellular membranes [57]. Lipid peroxidation is initiated by the abstraction of a hydrogen atom from the side chain of polyunsaturated fatty acids in the membrane [58]. The presence of lipid per oxides in a membrane disrupts its function by altering fluidity and allowing ions such as Ca2+ to leak across the membrane and major contributor to the loss of cell function [59].
Free radical scavenging systems
Antioxidants and free radical scavenging systems exist in the cells to protect it against the damaging effects of free radicals [60]. The present study showed that, the oral administration of aspartame could lead to a significant elevation in SOD, CAT, and GPx compared to control group. In spite of the increase in SOD activity the elevation of lipid peroxidation specify the increased production of free radicals. Increased SOD activity could naturally accumulate the super oxides, H2O2 and justify the increase in CAT and GPx for their increased activity after aspartame ingestion. Enhanced superoxide dismutase activity catalyzes the conversion of superoxide anions to H2O2 which in turn could stimulate the second line of defense which includes glutathione peroxidase and catalase [61]. The increased SOD levels were only partially effective in combating the oxidative damage [62].
In free radicals production, the thiol glutathione (glycyl–glutamic acid–cysteine) is the most important cellular free radical scavenging system in the brain [63]. Gebicki and Gebicki [64] reported that free radicals induce the formation of the protein peroxides. Glutathione reductase plays an important role in cellular antioxidant protection by catalyzing the reduction of GSSG to GSH [65]. The reduced glutathione reductase activity observed may be one of the reason for the decrease in GSH level observed in the aspartame treated animals. There was a decrease in reduced GSH level observed in the MTX- aspartame treated group, since methanol metabolism depends upon reduced GSH. GSH is a cofactor needed for methanol detoxification [66]. Protein carbonyl content is actually the most general indicator and far the most commonly used marker of protein oxidation [67]. In this study, there was an increase in the LPO, protein carbonyl levels and a marked reduction in the protein thiol groups. According to Patsoukis et al. [68], and Nikolaos et al. [69], the decreased protein thiol in brain is due to the oxidative damage and well supporting the present findings. Abhilash et al. [70], also reported a similar significant decrease in GSH concentration and glutathione activity in rats brain following aspartame consumption (the dosage used by him was 500 and 100 mg/kg). It is essential to point out that even with the FDA approved dosage of (40 mg/kg) similar alteration in the scavenging system was observed.
Free radical and markers of apoptosis
There is accumulating evidence of a direct involvement of the cellular redox status in the activation and the functioning of the apoptosis machinery [18]. It is well known that neuronal death occurs according to an apoptotic program [71]. There is an increase pro-apoptotic Bax and caspases-3 expression with a marked decrease in the Bcl-2 expression in aspartame with MTX treated group compared to controls. Bcl-2 is a key regulator of apoptosis, promotes cell survival either by inhibiting factors that activate caspases [72] or regulating apoptosis by antagonizing the formation of heterodimers with other Bcl-2 family members. Bcl-2 family proteins can indirectly regulate the activity of caspases in related apoptotic pathways [73]. Bax, a pro-apoptotic member, on the other hand, binds to the anti-apoptotic Bcl-2 protein and thus acts by antagonizing the function of Bcl-2 to revoke apoptosis. The salient activation of apoptotic markers such as Bax and caspases-3 and decreasing the regulator Bcl-2 by aspartame could not be overlooked because induction of Bax is also reported to promote cytochrome c release from the mitochondria that eventually leads to apoptosis [74]. According to Mbazima et al. [75], a simultaneous down-regulation of Bcl-2 protein and an up-regulation of Bax in neuronal cells and altering their ratio are in favor of apoptotic cell death.
Caspases are closely associated with apoptosis. The caspase-cascade system plays vital role in the induction, transduction and amplification of intracellular apoptotic signals. Caspase-3, a key factor in apoptosis A depletion of intracellular GSH has been reported to occur with the onset of apoptosis [76–77]. Hence the GSH depletion after aspartame administration observed in this study may be an additional factor for the apoptotic changes observed. In this study there was increased activated caspase 3 as well as its protein expression with a decrease in reduced GSH and Bcl-2 in aspartame treated animals when compared to control and MTX treated control.
The relation between free radicals and disease can be explained by the concept of ‘oxidative stress’ elaborated by Sies [78]. Free radicals can also attack DNA strand to induce breaks and base modifications that can lead to point mutation [79]. Scaiano et al. [19] reported that free radicals were responsible for induction of cellular damage that leads to chromosomal aberrations. AlSuhzibani [80], reported that aspartame induces a significant increase of chromosome aberration frequencies in mice compared to control providing a supporting scientific evidence that aspartame is toxic. The involvement of free radicals with tumor suppressor genes and proto-oncogenes suggests their role in the development of different human cancers [81,82]. The report of Soffritti et al. [83] highlighted that aspartame can induce cancer. Our previous study also well documented at 75 mg/kg bwt of aspartame treatment corroborated the free radical generation and behavioral changes [84,85]. Hence, probably the free radicals accumulated due to altered free radical scavenging enzymatic and non-enzymatic system for the alteration observed in the cellular pro and anti-apoptotic markers in discrete brain regions. The impact of aspartame induced changes in brain is well represented in the histology of hippocampal region. The aspartame treated animals showed a neuronal shrinkage of hippocampal layer due to degeneration of pyramidal cells in this study. The abnormal neuronal morphology of pyramidal cell layers of Cornu Ammonis was also associated with the disorganized pyramidal cell layers. The present study substantiates that down regulation of Bcl2 and up regulation of Bax with activation of caspase 3 lead to the apoptotic damage of neuronal cells in the brain regions, thus lending support to our present findings.
It may be concluded that aspartame exposure causes increased production of free radicals and increased oxidative damage to proteins in brain taken for the study. Increased free radicals and consequent increase in the protein oxidative damages might be playing a significant role in the apoptotic neuronal death leading to the development of neuronal toxicity in long-term aspartame exposure.
Conclusion
This study provides a scientific evidence to conclude that aspartame is toxic to the body system and particularly in brain it increases the free radicals and triggers the apoptosis. Aspartame consumption in a long-term basis may affect the brain. It may be due to its metabolite methanol aspartame may act as a chemical stressor as indicated by the corticosteroid level. Still more studies are required to understand more about aspartame. With the accumulating data from scientific research must reach the public as aspartame is freely available in pharmacy/super market and consumed largely by diabetic as well as young people who want to reduce weight.
Conflict of interest
The authors declare that they have no conflicts of interest concerning this article.
Acknowledgment
The author is grateful to the suggestion offered by Dr. N.J. Parthasarathy and co-authors. The author is grateful to the help given by the Molecular Laboratory, Department of Genetics and Endocrinology. The financial assistance provided by the Indian Council of Medical Research (ICMR) File. No. 3/1/2/29/Nut./2012/Dated 29-09-2013 for Senior Research Fellow is gratefully acknowledged. I acknowledge University of Madras for providing the infrastructure to conduct the research.
References
- 1.Shapiro R.B. Statement for the labor and human resources committee, US Senate. Government Printing Office; Washington, DC: 1988. [Google Scholar]
- 2.Newsome R.L., 1986.Sweeteners: nutritive and non-nutritive. In: The Scientific Status Summaries of the Institute of Food Technologies Expert Panel on Food Safety and Nutrition. Institutive of Food Technologies, Chicago.
- 3.Kruse J.A. Methanol poisoning. Intensive Care Medicine. 1992;18:391–397. doi: 10.1007/BF01694340. 1469176 [DOI] [PubMed] [Google Scholar]
- 4.Parthasarathy J.N., Ramasundaram S.K., Sundaramahalingam M., Rathinasamy S.D. Methanol-induced oxidative stress in rat lymphoid organs. Journal of Occupational Health. 2006;48:20–27. doi: 10.1539/joh.48.20. 16484759 [DOI] [PubMed] [Google Scholar]
- 5.Johns D.R. Migraine provoked by aspartame. New England Jornal do Medico. 1986;315:456. [PubMed] [Google Scholar]
- 6.Coulombe R.A., Sharma R.P. Neuro biochemical alterations induced by the artificial sweetener aspartame (NutraSweet) Toxicology and Applied Pharmacology. 1986;83:79–85. doi: 10.1016/0041-008x(86)90324-8. 2420032 [DOI] [PubMed] [Google Scholar]
- 7.Humphries P., Pretorius E., Naude H. Direct and indirect cellular effects of aspartame on the brain. European Journal of Clinical Nutrition. 2008;62(4):451–462. doi: 10.1038/sj.ejcn.1602866. 17684524 [DOI] [PubMed] [Google Scholar]
- 8.Stegink L.D., Filer L.J., Bell E.F., Ziegler E.E., Tephly T.R. Effect of repeated ingestion of aspartame-sweetened beverage on plasma amino acid, blood methanol, and blood formate concentrations. Metabolism. 1989;34(4):357–363. doi: 10.1016/0026-0495(89)90125-x. [DOI] [PubMed] [Google Scholar]
- 9.Keyhani J., Keyhani E. EPR study of the effect of formate on cytochrome c oxidase. Biochemical and Biophysical Research Communications. 1980;92:327–333. doi: 10.1016/0006-291x(80)91556-9. 6243938 [DOI] [PubMed] [Google Scholar]
- 10.Liesivuori J., Savolainen H. Methanol and formic acid toxicity: biochemical mechanisms. Pharmacology andToxicology. 1991;69:157–163. doi: 10.1111/j.1600-0773.1991.tb01290.x. 1665561 [DOI] [PubMed] [Google Scholar]
- 11.Castro G.D., Costantini M.H., Delgado de Layno A.M., Castro A. Rat liver microsomal and nuclear activation of methanol to hydroxymethyl free radicals. Toxicology Letters. 2002;129(3):227–236. doi: 10.1016/s0378-4274(02)00021-8. 11888706 [DOI] [PubMed] [Google Scholar]
- 12.Sies H. Oxidative stress: Oxidants and antioxidants. Experimental Physiology. 1997;82:291–295. doi: 10.1113/expphysiol.1997.sp004024. 9129943 [DOI] [PubMed] [Google Scholar]
- 13.Ratan R.R., Murphy T.H., Baraban J.M. Oxidative stress induces apoptosis in embryonic cortical neurons. Journal of Neurochemistry. 1994;62:376–379. doi: 10.1046/j.1471-4159.1994.62010376.x. 7903353 [DOI] [PubMed] [Google Scholar]
- 14.Spencer J.P., Jenner A., Aruoma O.I., Evans P.J., Kaur H., Dexter D.T., Lees A.J., Maraden D.C., Halliwell B. Intense oxidative DNA damage promoted by L-dopa and its metabolites. Implications for neurodegenerative disease. FEBS Letters. 1994;352:246–250. doi: 10.1016/0014-5793(94)01056-0. 7957867 [DOI] [PubMed] [Google Scholar]
- 15.Samuel S., Ramanathan K., Tamilselvan J., Panneersevam C. Protein oxidative damage in arsenic induced rat brain: influence of DL-alpha-lipoic acid. Toxicology Letters. 2005;155:27–34. doi: 10.1016/j.toxlet.2004.08.001. 15585356 [DOI] [PubMed] [Google Scholar]
- 16.Chandra J. Free Radical Biology and Medicine. 2000;29:32. doi: 10.1016/s0891-5849(00)00302-6. [DOI] [PubMed] [Google Scholar]
- 17.Floyd R.A., Carney J.M. Free radical damage to protein and DNA: mechanisms involved and relevant observations on brain undergoing oxidative stress. Annals of Neurology. 1992;32:S22–S27. doi: 10.1002/ana.410320706. 1510377 [DOI] [PubMed] [Google Scholar]
- 18.Oikawa D., Kimata Y., Kohno K. Self-association and BiP dissociation are not sufficient for activation of the ER stress sensor Ire1. Journal of Cell Science. 2007;120:1681–1688. doi: 10.1242/jcs.002808. 17452628 [DOI] [PubMed] [Google Scholar]
- 19.Scaiano J.C., Cozens F.L., Mohtat N. Influence of combined AC-DC magnetic fields on free radicals in organized and biological systems. Development of a model and application of the radical pair mechanism to radicals in micelles. Photochemistry and Photobiology. 1995;62:818–829. doi: 10.1111/j.1751-1097.1995.tb09142.x. 8570719 [DOI] [PubMed] [Google Scholar]
- 20.Saunders J.W. Death in embryonic systems. Science. 1966;154:604–612. doi: 10.1126/science.154.3749.604. 5332319 [DOI] [PubMed] [Google Scholar]
- 21.Kerr J.F.R., Wyllie A.H., Currie A.R. Apoptosis:a basic biological phenomenon with wide-ranging implications in tissue kinetics. British Journal of Cancer. 1972;26:239–257. doi: 10.1038/bjc.1972.33. 4561027 [DOI] [PMC free article] [PubMed] [Google Scholar]
- 22.Steller H. Mechanisms and genes of cellular suicide. Science. 1995;267:1445–1449. doi: 10.1126/science.7878463. 7878463 [DOI] [PubMed] [Google Scholar]
- 23.Ashkenazi A., Dixit V.M. Death receptors: signaling and modulation. Science. 1998;281:1305–1308. doi: 10.1126/science.281.5381.1305. 9721089 [DOI] [PubMed] [Google Scholar]
- 24.Cohen G.M. Caspases: the executioners of apoptosis. Biochemical Journal. 1997;326:1–16. doi: 10.1042/bj3260001. 9337844 [DOI] [PMC free article] [PubMed] [Google Scholar]
- 25.Greenhalgh D.G. The role of apoptosis inwound healing. International Journal of Biochemistry and Cell Biology. 1998;30:1019–1030. doi: 10.1016/s1357-2725(98)00058-2. 9785465 [DOI] [PubMed] [Google Scholar]
- 26.Oltvai Z.N., Milliman C.L., Korsmeyer S.J. Bcl-2 heterodimerizes in vivo with a conserved homolog, Bax, that accelerates programmed cell death. Cell. 1993;74:609–619. doi: 10.1016/0092-8674(93)90509-o. 8358790 [DOI] [PubMed] [Google Scholar]
- 27.Allsopp T.E., Wyatt S., Paterson H.F., Davies A.M. The proto-oncogene bcl-2 can selectively rescue neurotrophic factor-dependent neurons from apoptosis. Cell. 1993;73:295–307. doi: 10.1016/0092-8674(93)90230-n. 8477446 [DOI] [PubMed] [Google Scholar]
- 28.Batistatou A., Merry D.E., Korsmeyer S.J., Greene L.A. Bcl-2 affects survival but not neuronal differentiation of PC12 cells. Journal of Neuroscience: The Official Journal of the Society for Neuroscience. 1993;13:4422–4428. doi: 10.1523/JNEUROSCI.13-10-04422.1993. 7692014 [DOI] [PMC free article] [PubMed] [Google Scholar]
- 29.Korsmeyer S.J., Shutter J.R., Veis D.J., Merry D.E., Oltvai Z.N. Bcl- 2/Bax:a rheostat that regulates an anti-oxidant pathway and cell death. Seminars in Cancer Biology. 1993;4:327–332. 8142617 [PubMed] [Google Scholar]
- 30.Stefanis L., Park D.S., Friedman W.J., Greene L.A. Caspase-dependent and independent death of camptothecin- treated embryonic cortical neurons. Journal of Neuroscience: The Official Journal of the Society for Neuroscience. 1999;19:6235–6247. doi: 10.1523/JNEUROSCI.19-15-06235.1999. 10414953 [DOI] [PMC free article] [PubMed] [Google Scholar]
- 31.Lee E.W., Garner C.D., Terzo T.S. Animal model for the study of methanol toxicity: comparison of folate-reduced rat responses with published monkey data. Journal of Toxicology and Environmental Health. 1994;41:71–82. doi: 10.1080/15287399409531827. 8277527 [DOI] [PubMed] [Google Scholar]
- 32.Eells J.T., Henry M.M., Lewandowski M.F., Seme M.T., Murray T.G. Development and characterization of a rodent model of methanol-induced retinal and optic nerve toxicity. Neurotoxicology. 2000;21:321–330. 10894122 [PubMed] [Google Scholar]
- 33.Monte W.C. Aspartame: methanol and the public health. Journal of Applied Nutrition. 1984;36(1):42–53. [Google Scholar]
- 34.Gonzalez-Quevedo A., Obregon F., Urbina M., Rousso T., Lima L. Effect of chronic methanol administration on amino acids and monoamines in retina, optic nerve, and brain of the rat. Toxicology and Applied Pharmacology. 2002;185:77–84. doi: 10.1006/taap.2002.9477. 12490131 [DOI] [PubMed] [Google Scholar]
- 35.Tabor H., Wyngarden A method for determination of formiminoglutamic acid in urine. Journal of Clinical Investigation. 1962;37:824–828. doi: 10.1172/JCI103670. [DOI] [PMC free article] [PubMed] [Google Scholar]
- 36.Glowinski J., Iverson L.L. Regional studies of catecholamines in the rat brain. Journal of Neurochemistry. 1996;13:655–669. doi: 10.1111/j.1471-4159.1966.tb09873.x. [DOI] [PubMed] [Google Scholar]
- 37.Marklund S., Marklund G. Involvement of the superoxide anion radical in the autoxidation of pyrogallol and a convenient assay for superoxide dismutase. European Journal of Biochemistry/FEBS. 1974;47:469–474. doi: 10.1111/j.1432-1033.1974.tb03714.x. 4215654 [DOI] [PubMed] [Google Scholar]
- 38.Sinha A.K. Colorimetric assay of catalase. Analytical Biochemistry. 1972;47:389–394. doi: 10.1016/0003-2697(72)90132-7. 4556490 [DOI] [PubMed] [Google Scholar]
- 39.Rotruck J.T. Selenium: biochemical role as a component of glutathione peroxidase. Science. 1973;179:588–590. doi: 10.1126/science.179.4073.588. 4686466 [DOI] [PubMed] [Google Scholar]
- 40.William H.H., Michael J.P., William B.J. Glutathione S-transferases. Journal of Biological Chemistry. 1974;249(22):7130–7139. [PubMed] [Google Scholar]
- 41.Moron M.S., Depierre J.W., Mannervik B. Levels of glutathione, glutathione reductase and glutathione S-transferase activities in rat lung and liver. Biochimica et Biophysica Acta. 1979;582:67–78. doi: 10.1016/0304-4165(79)90289-7. 760819 [DOI] [PubMed] [Google Scholar]
- 42.Charles E.M., Robert G.L. Hepatic glutathione reductase. Purification and general kinetic properties. Journal of Biological Chemistry. 1962;237(5):1589–1595. [PubMed] [Google Scholar]
- 43.Ohkawa H., Ohishi M., Yagi K. Assay for lipid peroxidase in animal tissues by thiobarbituric acid reaction. Analytical Biochemistry. 1970;95:351–358. doi: 10.1016/0003-2697(79)90738-3. [DOI] [PubMed] [Google Scholar]
- 44.Oliver H., Lowry N.J., Rosebrough A., Lewis F., Rose J.R. Protein measurement with the Folin phenol reagent. Journal of Biological Chemistry. 1951;193:265–275. 14907713 [PubMed] [Google Scholar]
- 45.Levine R.L., Garland D., Oliver C.N., Amici A., Climent I., Lenz A.G., Ahn B., Shaltiel S., Stadtman E.R. Determination of carbonyl content in oxidatively modified proteins. Methods in Enzymology. 1990;186:464–478. doi: 10.1016/0076-6879(90)86141-h. 1978225 [DOI] [PubMed] [Google Scholar]
- 46.Sedlack J., Lindsay R.H. Estimation of total, protein-bound and non-protein sulfhydryl groups in the tissue with Ellman's reagent. Analytical Biochemistry. 1968;25:192–205. doi: 10.1016/0003-2697(68)90092-4. 4973948 [DOI] [PubMed] [Google Scholar]
- 47.Dorman D.C., Moss O.R., Farris G.M., Janszen D., Bond J.A., Medinsky M.A. Pharmacokinetics of inhaled [14C]methanol and methanol-derived [14C]formate in normal and folate-deficient cynomolgus monkeys. Toxicology and Applied Pharmacology. 1994;128:229–238. doi: 10.1006/taap.1994.1202. 7940538 [DOI] [PubMed] [Google Scholar]
- 48.Pecina R., Bonn G., Burtscher E., Bobber O. High performance liquid chromatographic elution behavior of alcohols, aldehydes, ketones, organic acids and carbohydrates on a strong catino-exchange stationary phase. Journal of Chromatography. 1984;287:245–258. [Google Scholar]
- 49.Chomczynski P., Sacchi N. Single-step RNA isolation from cultured cells or tissues. In: Ausubel F.M., Brent R., Kingston R.E., Moore D.D., Seidman J.G., Smith J.A., Struhl K., editors. Current Protocols in Molecular Biology. Greene and Wiley Interscience; New York: 1990. pp. 4.2.4–4.2.8. [Google Scholar]
- 50.Sambrook J., Fritsch E.F., Maniatis T. Molecular Cloning: A Laboratory Manual. II edn. Cold Spring Harbor Laboratory Press; Cold Spring Harbor, New York: 2001. [Google Scholar]
- 51.Ashok I., Sheeladevi R. Effect of chronic exposure to aspartame on oxidative stress in brain discrete regions of albino rats. Journal of Biosciences. 2012;37(4):1–10. doi: 10.1007/s12038-012-9236-0. [DOI] [PubMed] [Google Scholar]
- 52.Ishak K.G., Zimmerman H.J., Ray M.B. Alcoholic liver disease: pathologic, pathogenetic and clinical aspects. Alcoholism, Clinical and Experimental Research. 1991;15(1):45–66. doi: 10.1111/j.1530-0277.1991.tb00518.x. 2059245 [DOI] [PubMed] [Google Scholar]
- 53.Jeganathan P.S., Namasivayam A. Methanol induced biogenic amine changes in discrete areas of rat brain: role of simultaneous ethanol administration. Indian Journal of Physiology and Pharmacology. 1998;32:1–10. 2459060 [PubMed] [Google Scholar]
- 54.Maria B., Kadiiska R.P.M. Acute methanol intoxication generates free radicals in rats: an ear spin trapping investigation. Free Radical Biology and Medicine. 2000;28(7):1106–1114. doi: 10.1016/s0891-5849(00)00203-3. [DOI] [PubMed] [Google Scholar]
- 55.Goodman J., Tephly T.R. The role of hepatic microbody and soluble oxidases in the peroxidation of methanol in the rat and monkey. Molecular Pharmacology. 1968;4:492–501. 4386887 [PubMed] [Google Scholar]
- 56.Oberly L.W., Oberly T.D. Free radicals, cancer and aging. In: Johnson J.E. Jr, Miquel J., editors. Free Radicals, Aging and Degenerative Diseases. Alan R Liss, Inc.; New York: 1986. pp. 325–371. [Google Scholar]
- 57.Cheeseman K.H., Slater T.F. An introduction to free radical biochemistry. British Medical Bulletin. 1993;49(3):481–493. doi: 10.1093/oxfordjournals.bmb.a072625. 8221017 [DOI] [PubMed] [Google Scholar]
- 58.Bergendi L., Benes L., Durackova Z., Ferencik M. Chemistry, physiology and pathology of free radicals. Life Sciences. 1999;65:1865–1874. doi: 10.1016/s0024-3205(99)00439-7. 10576429 [DOI] [PubMed] [Google Scholar]
- 59.Halliwell B. Reactive oxygen species and the central nervous system. Journal of Neurochemistry. 1992;59:1609–1623. doi: 10.1111/j.1471-4159.1992.tb10990.x. 1402908 [DOI] [PubMed] [Google Scholar]
- 60.Kaplowitz N., Fernandez-Checa J.C., Kannan R., Garcia-Ruiz C., Ookhtens M., Yi J.R. GSH transporters: molecular characterization and role in GSH homeostasis. Biological Chemistry Hoppe-Seyler. 1996;377(5):267–273. doi: 10.1515/bchm3.1996.377.5.267. 8828817 [DOI] [PubMed] [Google Scholar]
- 61.Fridovich I. Superoxide radical and superoxide dismutases. Annual Review of Biochemistry. 1995;64:97–112. doi: 10.1146/annurev.bi.64.070195.000525. 7574505 [DOI] [PubMed] [Google Scholar]
- 62.Vidyasagar J., Karunakar N., Reddy M.S., Rajnarayana K., Surender T., Krishna D.R. Oxidative stress and antioxidant status in acute organophosphorous insecticide poisoning. Indian Journal of Pharmacology. 2004;36:76–79. [Google Scholar]
- 63.Berk M., Dean O., Bush A.I. Oxidative stress in psychiatric disorders: evidence base and therapeutic implications. International Journal of Neuropsychopharmacology/Official Scientific Journal of the Collegium Internationale Neuropsychopharmacologicum. 2008;11:851–876. doi: 10.1017/S1461145707008401. 18205981 [DOI] [PubMed] [Google Scholar]
- 64.Gebicki S., Gebicki J.M. Formation of peroxides in amino acids and proteins exposed to oxygen free radicals. Biochemical Journal. 1993;289:743–749. doi: 10.1042/bj2890743. 8435071 [DOI] [PMC free article] [PubMed] [Google Scholar]
- 65.Cazenave J., Bistoni M.A., Pesce S.F., Alberto D.W. Differential detoxification and antioxidant response in diverse organs of Corydoras paleatus experimentally exposed to microcystin-RR. Aquatic Toxicology. 2006;76(1):1–12. doi: 10.1016/j.aquatox.2005.08.011. 16263184 [DOI] [PubMed] [Google Scholar]
- 66.Pankow D., Jagielki S. Effect of methanol or modifications of the hepatic glutathione concentration on the metabolism of dichloromethane to carbon monoxide in rats. Human and Experimental Toxicology. 1993;12:227–231. doi: 10.1177/096032719301200305. 8100433 [DOI] [PubMed] [Google Scholar]
- 67.Beal M.F., Hyman B.T., Koroshetz W. Do defects in mitochondrial energy metabolism underlie the pathology of neurodegenerative diseases? Trends in Neurosciences. 1993;16(4):125–131. doi: 10.1016/0166-2236(93)90117-5. 7682343 [DOI] [PubMed] [Google Scholar]
- 68.Patsoukis N., Zervoudakis G., Panagopoulos N.T., Georgiou C.D., Angelatou F., Matsokis N.A. Thiol redox state (TRS) and oxidative stress in the mouse hippocampus after pentylene tetrazol-induced epileptic seizure. Neuroscience Letters. 2004;357:83–86. doi: 10.1016/j.neulet.2003.10.080. 15036580 [DOI] [PubMed] [Google Scholar]
- 69.Nikolaos P., George Z., Nikolaos T.P., Christos D.G., Fevronia A., Nikolaos A.M. Thiol redox state (TRS) and oxidative stress in the mouse hippocampus after pentylenetetrazol-induced epileptic seizure. Neuroscience Letters. 2004;357:83–86. doi: 10.1016/j.neulet.2003.10.080. 15036580 [DOI] [PubMed] [Google Scholar]
- 70.Abhilash M., Paul M.V., Varghese M.V., Nair R.H. Effect of long term intake of aspartame on antioxidant defense status in liver. Food and Chemical Toxicology: An International Journal Published for the British Industrial Biological Research Association. 2011;49:1203–1207. doi: 10.1016/j.fct.2011.02.019. 21376768 [DOI] [PubMed] [Google Scholar]
- 71.Tamagno E., Parola M., Guglielmotto M., Santoro G., Bardini P., Marra L., Tabaton M., Danni O. Multiple signaling events in amyloid beta-induced, oxidative stress-dependent neuronal apoptosis. Free Radical Biology and Medicine. 2003;1:45–58. doi: 10.1016/s0891-5849(03)00244-2. 12826255 [DOI] [PubMed] [Google Scholar]
- 72.Ling Y.H., Liebes L.N., Buckley M., Elliott P.J., Adams J., Jiang J.D., Muggia F.M., Perez-Soler R. PS-341, a novel proteasome inhibitor, induces Bcl-2 phosphorylation and cleavage in association with G2-M phase arrest and apoptosis. Molecular Cancer Therapeutics. 2002;1:841–849. 12492117 [PubMed] [Google Scholar]
- 73.Fan T.J., Xia L., Han Y.R. Mitochondrion and apoptosis. Sheng Wu Hua Xue Yu Sheng Wu Wu Li Xue Bao Acta Biochimica et Biophysica Sinica. 2001;33:7–12. 12053181 [PubMed] [Google Scholar]
- 74.Thomas A., Giesler T., White E. p53 mediates Bcl-2 phosphorylation and apoptosis via activation of the Cdc42/JNK1 pathway. Oncogene. 2000;19:5259–5269. doi: 10.1038/sj.onc.1203895. 11077443 [DOI] [PubMed] [Google Scholar]
- 75.Mbazima V.G., Matlou P.M., Faghri F.D., Jasper G.R., Leseilane J.M. Alteration of Bax-to-Bcl-2 ratio modulates the anticancer activity of methanolic extract of Commelina benghalensis (Commelinaceae) in Jurkat T cells. African Journal of Biotechnology. 2008;7(20):3569–3576. [Google Scholar]
- 76.Oda T., Sadakata N., Komatsu N., Muramatsu T. Specific efflux of glutathione from the basolateral membrane domain in polarized MDCK cells during ricin-induced apoptosis. Journal of Biochemistry. 1999;126:715–721. doi: 10.1093/oxfordjournals.jbchem.a022508. 10502680 [DOI] [PubMed] [Google Scholar]
- 77.Xu K., Thornalley P.J. Involvement of glutathione metabolism in the cytotoxicity of the phenethyl isothiocyanate and its cysteine conjugate to human leukaemia cells in vitro. Biochemical Pharmacology. 2001;61:165–177. doi: 10.1016/s0006-2952(00)00526-8. 11163331 [DOI] [PubMed] [Google Scholar]
- 78.Sies H. Biochemistry of oxidative stress. Angewandte Chemie International Edition. 1986;25:1058–1071. [Google Scholar]
- 79.Sies H. Strategies of antioxidant defense. European Journal of Biochemistry/FEBS. 1993;215:213–219. doi: 10.1111/j.1432-1033.1993.tb18025.x. 7688300 [DOI] [PubMed] [Google Scholar]
- 80.AlSuhaibani E.S. In vivo cytogenetic studies on aspartame. Comparative and Functional Genomics. 2010 doi: 10.1155/2010/605921. [DOI] [PMC free article] [PubMed] [Google Scholar]
- 81.Halliwell B., Aruoma O.I. DNA and Free Radicals. Boca Raton Press; 1993. [Google Scholar]
- 82.Sies H. Biochemistry of oxidative stress. Angewandte Chemie International Edition. 1986;25:1058–1071. [Google Scholar]
- 83.Soffritti M., Belpoggi F., Tibaldi E., Esposti D.D., Lauriola M. Life-span exposure to low doses of aspartame beginning during prenatal life increases cancer effects in rats. Environmental Health Perspectives. 2007;115(9):1293–1297. doi: 10.1289/ehp.10271. 17805418 [DOI] [PMC free article] [PubMed] [Google Scholar]
- 84.Ashok I., Sheeladevi R., Dapkupar W. Effect of long-term aspartame (artificial sweetener) on anxiety, locomotor activity and emotionality behavior in Wistar albino rats. Biomedicine and Preventive Nutrition. 2014;4:39–43. [Google Scholar]
- 85.Ashok I., Sheeladevi R., Wankhar D. Long term effect of aspartame (artificial sweetener) on membrane homeostatic imbalance and histopathology in the rat brain. Free Radicals and Antioxidants. 2013;3:S42–S49. [Google Scholar]