Abstract
The present study aimed to assess the effect of polymorphisms in the tumor necrosis factor α (TNF-α) promoter (A/A, A/G and G/G) and exons (T/T, T/C and C/C) on immune function and reproductive performance in dairy cows. The occurrence of the first postpartum ovulation within 3 weeks in the cows with the TNF-α promoter A/G and G/G genotypes was higher than in the A/A group. Among the different TNF-α exon genotypes, the occurrence of early first postpartum ovulation was higher in the T/C and C/C genotype groups than in the T/T group. Single nucleotide polymorphisms (SNPs) in the TNF-α gene did not affect the rate of artificial insemination (AI) or duration from parturition to next conception (days open). The apoptosis rate of polymorphonuclear leukocytes (PMNs) did not differ among the TNF-α promoter genotypes, but the PMN transmigration rate was significantly higher for the A/A and A/G genotypes than for the G/G genotype. Interleukin 8 (IL-8) mRNA expression in PMNs and peripheral blood mononuclear cells (PBMCs) before culture was significantly higher for the A/A genotype compared with the G/G genotype. There were no significant differences between the genotypes in the mRNA expression of TNF-α, IL-6, IL-1β, and toll-like receptor 4 (TLR4) in PMNs and PBMCs before and 4 h after culture. IL-8 and IL-1β production by PBMCs cultured for 4 h was significantly higher for the animals with the A/A genotype than for those with the G/G genotype. On the other hand, no significant difference was observed in IL-8 and IL-1β production by PMNs among different TNF-α genotypes. Taken together, these results suggest that SNP in the TNF-α gene affects immune function and reproductive performance in dairy cows.
Keywords: Cattle, Immune function, Polymorphism, Reproductive performance, Tumor necrosis factor α (TNF-α)
In recent years, milk production in cows has been dramatically increasing due to improvements in management, nutrition and genetic selection [1, 2]. However, high-milk-yielding cows after parturition have an energy deficiency and low immune function and develop mastitis and endometritis due to bacterial infection. Additionally, despite the same management and environment, reproductive performance and disease susceptibility vary among individual cows, suggesting the involvement of genetic factors.
Recently, genomic studies in livestock animals have aimed to identify candidate genes that could increase milk production in cows. Among genetic mutations, single nucleotide polymorphisms (SNPs) are known to affect several physiological mechanisms. In humans, SNPs of the tumor necrosis factor (TNF) gene are associated with susceptibility to hidradenitis suppurativa, a chronic inflammatory skin disorder [3]. In addition, SNPs within the TNF-α promoter region are involved in the regulation of TNF-α mRNA expression in immune cells treated with lipopolysaccharide (LPS) [4]. Moreover, Wang et al. (2007) indicated that SNPs in the toll-like receptor 4 (TLR4) gene correlated with resistance to mastitis in cattle [5].
Of the many factors associated with the immune system, TNF-α is a candidate factor linking reproductive performance and immunity in dairy cattle. TNF-α produced by white blood cells regulates immune responses such as apoptosis of tumor cells and clearance of pathogens. Intrafollicular injection of TNF-α antiserum has been shown to block ovulation in ewes [6], suggesting that TNF-α is an essential factor for immune and reproductive functions. Therefore, the purpose of the present study was to investigate the effects of SNPs in the TNF-α gene on immune function and reproductive performance in dairy cows.
Materials and Methods
All experiments were conducted at the Field Science Center at Obihiro University and at a commercial dairy farm. All experimental procedures complied with the Guidelines for the Care and Use of Agricultural Animals of Obihiro University.
Experimental design
Two hundred and thirty-seven Holstein cows from the Obihiro University farm and 78 Holstein cows from a commercial dairy herd were analyzed between 2000 and 2013. Blood samples were obtained once or twice a week between parturition and 3 weeks postpartum using sterile 10 ml tubes containing 200 µl stabilizer solution (0.3 M EDTA, 1% acetylsalicylic acid, pH 7.4) for progesterone analysis and heparinized 5 ml tubes (VP-H050 K, Terumo, Tokyo, Japan) for the SNP analysis. Blood tubes were centrifuged at 2,000 × g for 20 min at 4 C, and the plasma samples were kept at –30 C until analysis. Data on the number of artificial inseminations (AIs) and duration from parturition to next conception (days open) for these 122 cows were collected at the Obihiro University farm.
Progesterone determination
Plasma progesterone concentration was determined by a direct enzyme immunoassay (EIA) [7]. Progesterone was extracted using diethyl ether as described previously [7] with a recovery rate of 88%. The intra- and inter-assay coefficients of variation were 6.2 and 9.3%, respectively. The standard curve ranged from 0.05 to 50 ng/ml, and the ED50 of the assay was 2.4 ng/ml.
Definition of ovulation and anovulation
When the plasma progesterone concentration first exceeded 1 ng/ml, luteal activity was assumed to have been initiated [8, 9]. Cows that resumed luteal activity by 3 weeks postpartum were defined as ovulatory, whereas those that did not were defined as anovulatory.
Determination of gene polymorphisms
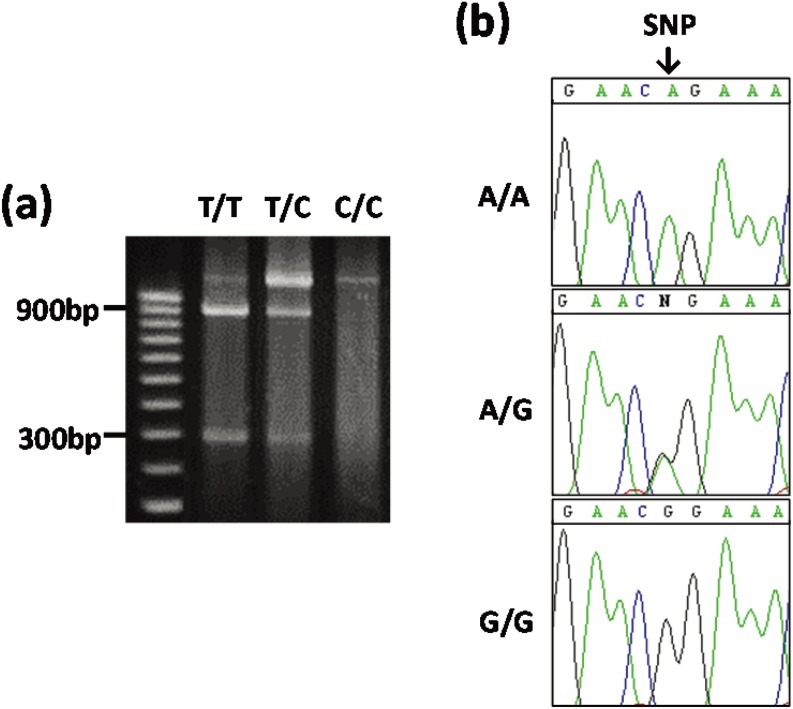
Genomic DNA was extracted from whole blood (including white blood cells) using a Wizard Genomic DNA Purification kit (Promega, Madison, WI, USA). Genotyping of cows for TNF-α polymorphisms was performed by polymerase chain reaction (PCR), as described previously [10]. The primers for detection of SNPs in the TNF-α exon were 5′−GGGTGACTTGCTCTAACACTCATC−3′ (forward) and 5′−AGGCCTCACTTCCCTACATCCCTA−3′ (reverse) [10]. PCR-amplified DNA was digested with 2 U Afa I (Takara Bio, Shiga, Japan) at 37 C for 16 h. Restriction fragments were separated by electrophoresis in 2% agarose (Wako Pure Chemical Industries, Osaka, Japan) in 1 × TAE buffer (Promega) containing 0.5 µg/ml ethidium bromide and visualized under UV light (Fig. 1 (a)). Analysis of TNF-α promoter SNPs was performed using the primers reported by Kahl et al. (2009) [11], 5′−CCTGCTGTGCTGGAGTTGGTG−3′ (forward) and 5′−CTCATTCAACCAGCGGAAAAC−3′ (reverse). PCR amplicons were sequenced in both the 5′ and 3′ directions using an Applied Biosystems 3730xl DNA Analyzer (Applied Biosystems, Foster City CA, USA), and SNPs were identified by visual analysis of electropherograms (Fig. 1 (b)).
Fig. 1.
Restriction fragments of the TNF-α exon genotype using the Afa I restriction enzyme (a) and sequences of TNF-α promoter genotypes (b). (a): T/T, 928 bp + 305 bp; T/C, 1,233 bp + 928 bp + 305 bp; C/C, 1,233 bp. (b): The arrow indicates the position of the SNP in the TNF-α promoter (position at 3,663 bp).
Isolation of PMNs and PBMCs
PMNs and PBMCs were isolated from whole blood collected via jugular venipuncture of pregnant cows on days 170 to 230 postpartum (period) at 0700 h. We checked the physical conditions of the cows by auscultation and measurement of body temperature. Abnormal white blood cell counts were revealed by using a fully automatic blood cell counter (Nihon Kohden, Tokyo, Japan). Whole blood was mixed with an equal volume of PBS, and the suspension was layered onto Lymphoprep (Axis-Shield, Oslo, Norway) and centrifuged at 1,000 × g for 30 min at 10 C as described previously [12, 13]. The plasma was removed, and a buffy coat was recovered as a source of PBMCs, while a lower layer was used for isolation of PMNs. To remove red blood cells, hypotonic distilled water was added to PMNs and PBMCs. Isotonicity was restored by the addition of 2 × PBS and centrifugation at 500 × g for 10 min at 10 C. This lysing procedure was repeated twice on the cell pellet (300 × g for 10 min at 10 C, 150 × g for 10 min at 10 C). Isolated PMNs and PBMCs were resuspended in RPMI 1640 (Invitrogen, Tokyo, Japan) containing 0.1% FCS, 2.2 g/l NaHCO3, 50 mg/l gentamicin and 2.5 mg/l amphotericin B (both from Sigma, Tokyo, Japan). For RNA extraction, PMNs and PBMCs were mixed with TRIzol reagent (Invitrogen) (1 × 10⁷ cells/ml), placed into a 1.5-ml microcentrifuge tube and stored at –80 C until RNA extraction.
PMNs apoptosis assay
PMNs (1 × 10⁶ cells/well) were cultured in 24-well plates (Nunc, Thermo Fisher Scientific, Waltham, MA, USA) with or without LPS (0.001, 0.01, 0.1 and 1 µg/ml, Sigma) for 20 h at 37 C in 5% CO2 and 95% air. Each LPS concentration was tested in duplicate. PMNs were collected and centrifuged at 300 × g for 10 min at 4 C. Supernatants were removed, and these cells were stained with Annexin V-FITC (Miltenyi Biotec, Tokyo, Japan) for detection of apoptotic cells according to the manufacturer’s method. Flow cytometry (Beckman Coulter, Brea, CA, USA) was used to quantitate apoptotic cells [14].
PMN migration assay
PMN chemotaxis was evaluated using 10-well microchemotaxis chambers (Neuro Probe, Gaithersburg, MD, USA). Test solutions in the bottom chamber were separated from PMNs in the upper chamber by an 8-μm pore filter (Neuro Probe). The bottom chamber contained 300 µl of medium alone or with recombinant bovine IL-8 (5 ng/ml) (Kingfisher Biotech, St Paul, MN, USA). PMNs, 2 × 10⁶ cells/ml, were added to the upper chamber in 250 µl of medium. Each concentration was tested in duplicate. After 3 h of incubation at 37 C, the cells migrated to the bottom, and the remaining cells in the upper chamber were counted using flow cytometry.
PMN and PBMC culture
PMNs and PBMCs were cultured at 5 × 10⁶ cells/well in 24-well plates (Thermo Fisher Scientific) without or with LPS (0.01, 0.1 and 1 µg/ml) for 4 h at 37 C in 5% CO2 and 95% air. Each concentration was tested in duplicate. After incubation, plates were centrifuged at 300 × g for 10 min at 4 C, and the supernatants were collected and stored at –30 C until analysis. PMNs and PBMCs were mixed with TRIzol reagent (500 µl/well), placed in a 1.5-ml microcentrifuge tube and stored at –80 C until RNA extraction.
RNA extraction and cDNA production
Total RNA was extracted from cultured PMNs and PBMCs by adding 0.2 ml of chloroform to the TRlzol-containing tubes, vortexing them vigorously for 15 sec, and incubating them at room temperature for 3 min. Samples were centrifuged at 18,300 × g for 15 min at 4 C. The upper aqueous phase was transferred into a 1.5-ml tube, and 500 µl isopropyl alcohol (Wako) was added and homogenized by inverting the tube. After incubation at room temperature for 10 min, the samples were centrifuged at 18,300 × g for 10 min at 4 C. The supernatant was carefully recovered, and 900 µl 80% ethanol (Wako) was added, followed by centrifugation at 11,700 × g for 5 min at 4 C. After removing the supernatant, the RNA pellet was air-dried for 30 min, and sterilized water was then added. The extracted total RNA was stored at –80 C until use for cDNA synthesis. cDNA was generated by reverse transcription (RT) using a PrimeScript RT reagent kit with gDNA Eraser (Perfect Real Time; Takara Bio) according to the manufacturer’s method. The synthesized cDNA was stored at –30 C.
Quantitative PCR
The mRNA expression levels of TNF-α, IL-8, IL-6, IL-1β, TLR4 and β-actin were quantified by real-time PCR using an iCycler iQ (Bio-Rad Laboratories, Tokyo, Japan) and a commercial kit (QuantiTectTM SYBR Green PCR; QIAGEN, Hilden, Germany). The primers for real-time PCR were designed based on the respective bovine sequences by using the Primer-3 software. The primers were 5′ TGGAGGGAGAAGGGATTCTT 3′ (forward) and 5′ CCAGGAACTCGCTGAAACTC 3′ (reverse) for TNF-α, 5′–ATGACTTCCAAGCTGGCTGTTG–3′ (forward) and 5′–TTTCATGGATCTTGCTTCTCAGC–3′ (reverse) for IL-8, 5′–ATGACTTCTGCTTTCCCTACCC–3′ (forward) and 5′–GCTGCTTTCACACTCATCATTC–3′ (reverse) for IL-6, 5′–ATGAAGAGCTGCATCCAACA–3′ (forward) and 5′–ATGGAAGACATGTGCGTAGG–3′ (reverse) for IL-1β, 5′–CTTGCGTACAGGTTGTTCCTAA–3′ (forward) and 5′–CTGGGAAGCTGGAGAAGTTATG–3′ (reverse) for TLR4 and 5′–CCAAGGCCAACCGTGAGAAGAT–3′ (forward) and 5′–CCACGTTCCGTGAGGATCTTCA–3′ (reverse) for β-actin. The amplification program consisted of a 15-min denaturation at 95 C followed by 40 cycles of amplification (94 C for 15 sec, 56–60 C for 30 sec and 72 C for 20 sec). To quantify the expression of the target genes, a series of standards was generated by amplifying a fragment of DNA that contained the target sequence for real-time PCR (100–250 bp). The values were normalized to β-actin as an internal standard.
Quantification of TNF-α, IL-8 and IL-1β
TNF-α expression in undiluted supernatants was determined by using a bovine TNF-α VetSet ELISA Development Kit (Kingfisher Biotech) according to the manufacturer’s method. The absorbance was measured at 450 nm using a Multiscan MS-UV spectrophotometer (Thermo Bio Analysis Japan, Japan). The standard curve ranged from 0.08 to 5 ng/ml. The intra- and inter-assay coefficients of variation were 3.75 and 1.85%, respectively. IL-1β was determined in undiluted supernatants by using a bovine IL-1β ELISA Reagent Kit (Thermo Fisher Scientific) and 96-well plates (Nunc, Roskilde, Denmark) according to the manufacture’s method, and the absorbance was measured at 450 nm. The standard curve ranged from 31.3 to 2,000 pg/ml, and the intra- and inter-assay coefficients of variation were 5.33 and 7.16%, respectively. IL-8 was determined by an enzyme immunoassay (EIA) by using the biotin-streptavidin-peroxidase method as described by Mutayoba et al. [15]. Anti-rabbit IL-8 antiserum exhibited less than 0.01% cross-reactivity with rabbit IL-4, IL-6 (both from Kingfisher Biotech) and interferon γ (kindly donated by Dr S Inumaru, NIAH, Ibaraki, Japan). In brief, 50 µl of standards and supernatant samples (in duplicate) were incubated with 100 µl IL-8 antiserum (final concentration 1:100,000 in PBS) at 4 C for 18–24 h in 96-well ELISA plates (Nunc) coated with goat anti-rabbit IgG (Seikagaku, Tokyo, Japan). After the reagents were removed, the biotinylated IL-8 was added to 100 µl EIA buffer. The plates were incubated for 2 h and washed, and 20 ng of streptavidin-peroxidase in 100 µl EIA buffer was then added. After 15 min of incubation at 4 C, the wells were washed 4 times with 300 µl of 0.05% Tween 80, and 150 µl substrate buffer containing 0.05% 3,3′,5,5′-tetramethylbenzidine (Wako) was added to each well. The plates were further incubated at 36 C for 40 min in the dark. The reaction was stopped by the addition of 50 µl of 2 M H2SO4 to each well. The absorbance was measured at 450 nm using a plate reader (Bio-Rad, Hercules, CA, USA). The standard curve ranged from 0.391 to 100 ng/ml, and the intra- and inter-assay coefficients of variation were 7.8 and 12.2%, respectively.
Statistical analysis
The numbers of ovulatory and anovulatory cows were analyzed by chi-square test. Data on artificial insemination (AI), days open, PMN apoptosis rate, PMN migration, mRNA expression, and concentration of various cytokines were analyzed by ANOVA followed by the Tukey-Kramer test as a multiple comparison test. Differences were considered significant at P < 0.05.
Results
Genotype distribution in two herds
The SNP frequencies in the TNF-α gene were distributed as follows: A/A (n = 36), A/G (n = 108), and G/G (n = 80) for the promoter and T/T (n = 23), T/C (n = 99) and C/C (n = 105) for the exon.
Association of the TNF- α SNPs with reproductive performance
The association of SNPs in the TNF-α promoter and exon with the time of the first postpartum ovulation is shown in Table 1. The occurrence of the first postpartum ovulation within 3 weeks in the animals with A/G (57.1%) and G/G (59.5%) SNPs in the TNF-α promoter was more frequent than in those with an A/A SNP (9.8%). Among the animals with TNF-α exon polymorphisms, the occurrence of first postpartum ovulation was higher for the T/C (42.4%) and C/C genotypes (54.3%) cows than for those with the T/T (12.5%) genotype. SNPs in the TNF-α promoter and exon did not affect the number of artificial inseminations (AIs) and days open (Table 2). Since polymorphisms in the TNF-α promoter showed statistically greater correlation with early first postpartum ovulation than the exon polymorphisms, we focused on the effects of the TNF-α promoter SNPs on the function and cytokine production of immune cells in dairy cows.
Table 1. Association of TNF-α gene polymorphism with resumption of ovulation in postpartum cows .
| Genotype | Ovulatory | Anovulatory | Ovulatory ratio (%) | P-value | |
| TNF-α promoter (n=206) | A/A | 4 | 37 | 9.8 | P<0.001 |
| A/G | 52 | 39 | 57.1 | ||
| G/G | 44 | 30 | 59.5 | ||
| TNF-α exon (n=195) | T/T | 2 | 14 | 12.5 | P=0.003 |
| T/C | 36 | 49 | 42.4 | ||
| C/C | 51 | 43 | 54.3 | ||
Table 2. Association of TNF-α gene polymorphism with the number of artificial inseminations (AIs) and days open.
| Genotype | No. of AIs*1 | P-value | Days open | P-value | |
| TNF-α promoter | A/A | 2.1 ± 0.2 (n=50) | P=0.6382 | 140.2 ± 10.4 (n=52) | P=0.5907 |
| A/G | 2.1 ± 0.1 (n=114) | 134.0 ± 6.3 (n=114) | |||
| G/G | 2.0 ± 0.1 (n=81) | 127.8 ± 7.5 (n=81) | |||
| TNF-α exon | T/T | 2.2 ± 0.2 (n=39) | P=0.5520 | 135.5 ± 12.4 (n=39) | P=0.5824 |
| T/C | 2.2 ± 0.1 (n=95) | 137.9 ± 7.1 (n=95) | |||
| C/C | 2.0 ± 0.1 (n=102) | 127.9 ± 6.5 (n=102) | |||
Means ± SEM. *1 No. of AIs is shown as the number of artificial inseminations until confirmation of conception.
Association of TNF-α promoter polymorphisms with immune cell function
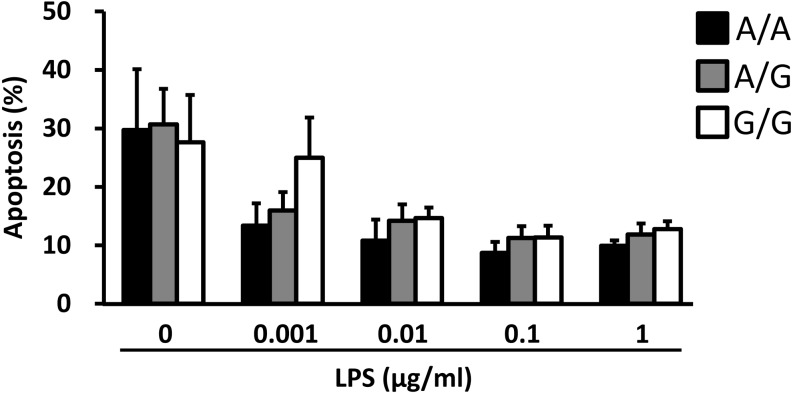
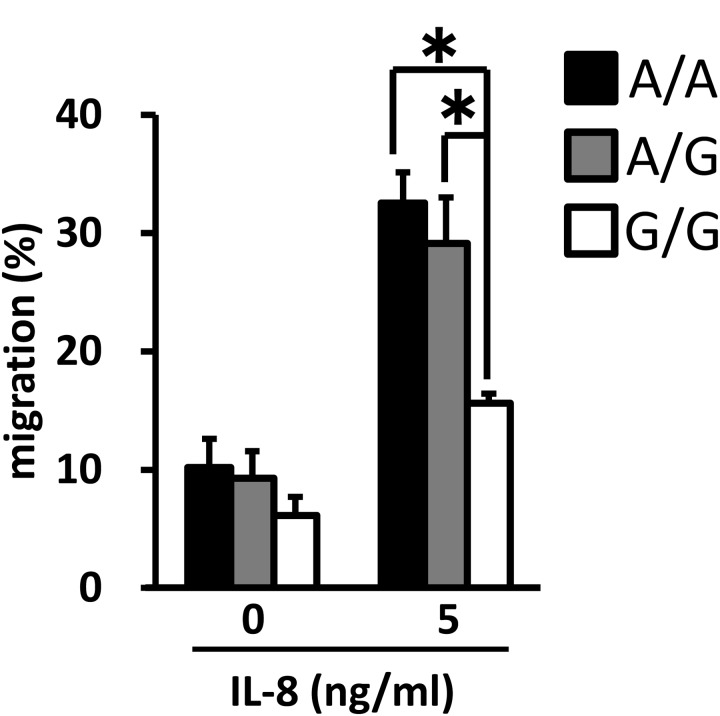
Since a stronger correlation between the genotype of the TNF-α promoter and reproductive performance was observed, we examined the association of the TNF-α promoter genotype with immune function. The PMN apoptosis rate was not affected by SNPs in the TNF-α promoter region (Fig. 2). On the other hand, the transmigration rates of PMNs treated with IL-8 (5 ng/ml) were significantly higher for the animals with the A/A and A/G genotypes than for those with the G/G genotype (Fig. 3).
Fig. 2.
Association of the TNF-α promoter genotype with apoptosis rate of PMNs cultured with or without LPS for 20 h. The data are expressed as means ± SEM (n = 5, n = 9 and n = 4 for A/A, A/G and G/G).
Fig. 3.
Association of the TNF-α promoter genotype with migration of PMNs cultured with IL-8 for 3 h. The data are expressed as means ± SEM of separate experiments (n = 5, n = 5 and n = 5 for A/A, A/G and G/G). The asterisk denotes significantly different values (P < 0.05).
Association of TNF-α promoter polymorphisms with cytokine production by immune cells
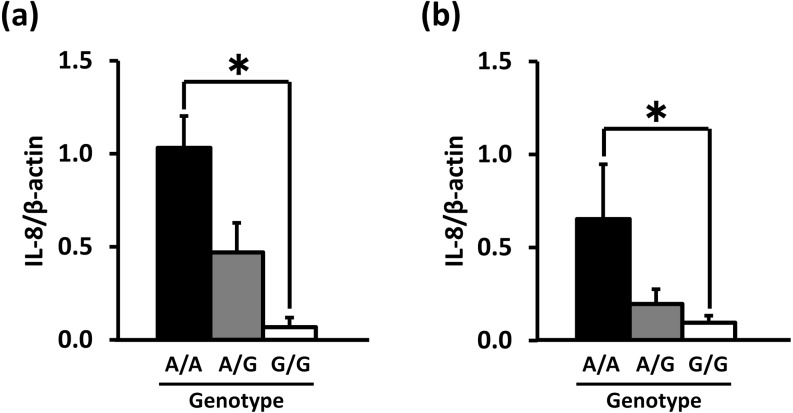
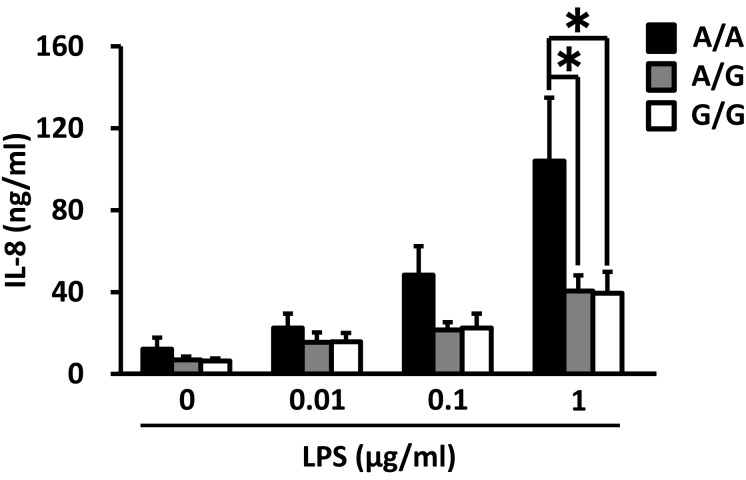
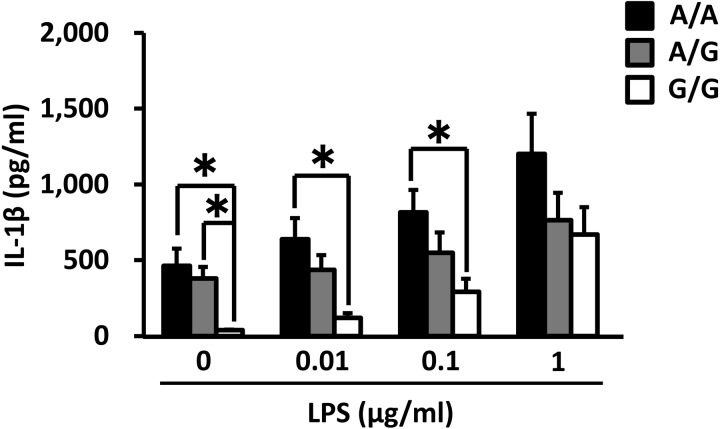
IL-8 mRNA expression in PMNs and PBMCs before culture was significantly higher for the A/A genotype than for the G/G genotype (0 h of culture, Fig. 4). However, there was no significant difference in TNF-α, IL-6, IL-1β and TLR4 mRNA expression levels (data not shown). In PMNs and PBMCs cultured for 4 h, TNF-α, IL-8, IL-6, IL-1β and TLR4 mRNA expression levels were not significantly different among the genotypes (data not shown). Following treatment with 1 µg/ml LPS for 4 h, PBMCs from animals of the A/A genotype demonstrated significantly higher IL-8 production compared with the PBMCs from animals of the G/G and A/G genotypes (Fig. 5). IL-1β production in the LPS-treated (0, 0.01 or 0.1 µg/ml) cells derived from the A/A animals was also significantly higher than for those from the G/G group (Fig. 6). On the other hand, the production of TNF-α, IL-8 and IL-1β in the LPS-treated PMNs was not affected by the polymorphism in the TNF-α promoter (data not shown).
Fig. 4.
Association of the TNF-α promoter genotype and IL-8 mRNA expression levels in PMNs (a) and PBMCs (b) before culturing. The data are expressed as means ± SEM (n = 4, n = 7 and n = 3 for A/A, A/G and G/G in PMNs; n = 4, n = 8 and n = 6 for A/A, A/G and G/G in PBMCs). The asterisk denotes significantly different values (P < 0.05).
Fig. 5.
Association of the TNF-α promoter genotype with IL-8 production by PBMCs cultured with LPS for 4 h. The data are expressed as means ± SEM (n = 4, n = 9 and n = 6 for A/A, A/G and G/G). The asterisk denotes significantly different values (P < 0.05).
Fig. 6.
Association of the TNF-α promoter genotype with IL-1β production by PBMCs cultured with LPS for 4 h. The data are expressed as means ± SEM (n = 5, n = 9 and n = 7 for A/A, A/G and G/G). The asterisk denotes significantly different values (P < 0.05).
Discussion
The present study indicates that SNPs in the TNF-α promoter and exon are associated with reproductive performance in cattle. In addition, our findings provided evidence that the migration, gene expression and production of cytokines in immune cells (PMNs and PBMCs) differed based on the TNF-α promoter genotype. These results suggest that SNPs in the TNF-α gene affect immune function and reproductive performance in dairy cows.
In the present study, we observed that the rates of occurrence of early first postpartum ovulation (within 3 weeks) in animals with the A/A genotype in the TNF-α promoter (9.8%) and the T/T genotype in the TNF-α exon (12.5%) were lower compared with in the other groups. Brannstrom et al. (1995) reported that injection of TNF-α together with luteinizing hormone (LH) increases the LH-induced ovulation rates in rats [16]. Moreover, intrafollicular injection of TNF-α antiserum blocked ovulation in ewes, suggesting that TNF-α may be essential for the ovulatory process [6]. The occurrence of early first ovulation postpartum within 3 weeks is positively associated with the recovery of normal ovarian function, the day of first AI and the conception rate [8]. Therefore, animals with the A/A genotype in the TNF-α promoter and T/T genotype in the TNF-α exon may have low reproductive performance compared with other genotypes. Furthermore, our results suggest that animals with these genotypes may have defective follicular development after parturition. Thus, these genotypes may be associated with reproductive performance in dairy cow. In the present study, it was not determined whether TNF-α genotypes correlated with TNF-α levels in the blood and follicular fluid in the preovulatory phase. Thus, it is necessary to examine TNF-α blood levels in animals with different TNF-α genotypes within 3 weeks postpartum.
Cytokines such as TNF-α [6], IL-1 [17] and IL-8 [18, 19] are present in high concentrations in the preovulatory follicular fluid, where they induce infiltration of neutrophils and macrophages in the preovulatory follicle at the time of ovulation [20]. Neutrophil depletion by administration of a neutralizing antibody reduced the ovulation rate in rats, indicating their critical role in ovulation [21]. Our findings suggest that the transmigration ability of PMNs treated with IL-8 (which induces migration of immune cells) was significantly higher in the animals with the A/A and A/G genotypes than in these with the G/G genotype. In addition, IL-8 and IL-1β production in PBMCs isolated from the A/A animals was significantly higher compared with the other genotypes. Therefore, the difference in the transmigration ability of PMNs (neutrophils) and in the production of IL-8 and IL-1β by PBMCs (macrophages) among the animals carrying different SNPs in the TNF-α promoter may be associated with the resumption of ovulation in postpartum cows.
It is known that SNPs within the promoter region affect transcriptional regulation and gene expression. In human immune cells treated with LPS, the A/G SNP in the TNF-α promoter region resulted in an increase in TNF-α mRNA expression compared with that seen in the corresponding cells of the G/G genotype [4]. In the present study, SNPs in the TNF-α promoter region did not affect mRNA and protein expressions of TNF-α, IL-1β and IL-6 in immune cells but did influence those of IL-8. On the other hand, although IL-1β mRNA expression in PBMCs did not change, production of IL-1β by PBMCs was significantly different between genotypes. Therefore, these results suggested that SNP in the TNF-α promoter region may affect translation of the IL-1β mRNA and its protein release.
In the present study, we found that SNP in the TNF-α promoter region affected production of IL-8 and IL-1β in PBMCs. Although it is not clear how SNPs in the TNF-α promoter affect the production of other factors, MAPK14 (mitogen-activated protein kinase 14) may be associated with production of IL-8 and IL-1β in PBMCs. In fact, MAPK14 is involved in posttranscriptional regulation of inflammatory gene expression such as the expression of IL-8 and IL-1β on chromosome 23, in which the TNF-α gene is also located. Generally, there is a genetic linkage by which one genetic mutation (SNP) influences the expression of other genes. Thus, MAPK14 induced by a genetic linkage of SNP in the TNF-α promoter region may be involved in the increase in production of IL-8 and IL-1β in PBMCs.
In our study, cows in late lactation that had physiologically stable conditions were used to analyze immune cell function. We observed high transmigration ability in PMNs and an increase in the production of IL-8 and IL-1β in PBMCs in the animals with the A/A genotype of the TNF-α promoter region, which suggest that these were basic abilities in the animals with the A/A genotype. However, it is not clear whether these abilities of the A/A genotype are moderate or excessive in vivo. Furthermore, the results of the present study may not be indicative of the immune cell function observed at 3 weeks postpartum, as the function of the immune system is affected by the perinatal and/or lactation period. Therefore, we plan to examine the immune cell function in the animals with the A/A genotype in the TNF-α promoter region at 3 weeks postpartum.
In conclusion, we investigated the relationship between single nucleotide substitutions in the TNF-α gene and reproductive performance and immune functions in dairy cows. Our data demonstrate that SNPs in the TNF-α gene are associated with reproductive performance and immune functions in cows, suggesting that TNF-α could be a potential genetic marker for immune response and reproductive performance in dairy cattle.
References
- 1.Hansen LB. Consequences of selection for milk yield from a geneticist’s viewpoint. J Dairy Sci 2000; 83: 1145–1150 [DOI] [PubMed] [Google Scholar]
- 2.Lucy MC. Reproductive loss in high-producing dairy cattle: where will it end? J Dairy Sci 2001; 84: 1277–1293 [DOI] [PubMed] [Google Scholar]
- 3.Savva A, Kanni T, Damoraki G, Kotsaki A, Giatrakou S, Grech I, Katoulis A, Papadavid E, Giamarellos-Bourboulis EJ. Impact of Toll-like receptor-4 and tumour necrosis factor gene polymorphisms in patients with hidradenitis suppurativa. Br J Dermatol 2013; 168: 311–317 [DOI] [PubMed] [Google Scholar]
- 4.Lu MC, Yang KL, Tung CH, Huang KY, Yu HC, Liu SQ, Lai NS. Higher LPS-stimulated TNF-alpha mRNA levels in peripheral blood mononuclear cells from Chinese ankylosing spondylitis patients with -308G/A polymorphism in promoter region of tumor necrosis factor: association with distinct A33/B58/Cw10 haplotypes. Rheumatol Int 2008; 29: 189–195 [DOI] [PubMed] [Google Scholar]
- 5.Wang X, Xu S, Gao X, Ren H, Chen J. Genetic polymorphism of TLR4 gene and correlation with mastitis in cattle. J Genet Genomics 2007; 34: 406–412 [DOI] [PubMed] [Google Scholar]
- 6.Murdoch WJ, Colgin DC, Ellis JA. Role of tumor necrosis factor-alpha in the ovulatory mechanism of ewes. J Anim Sci 1997; 75: 1601–1605 [DOI] [PubMed] [Google Scholar]
- 7.Miyamoto A, Okuda K, Schweigert FJ, Schams D. Effects of basic fibroblast growth factor, transforming growth factor-beta and nerve growth factor on the secretory function of the bovine corpus luteum in vitro. J Endocrinol 1992; 135: 103–114 [DOI] [PubMed] [Google Scholar]
- 8.Kawashima C, Kaneko E, Amaya Montoya C, Matsui M, Yamagishi N, Matsunaga N, Ishii M, Kida K, Miyake Y, Miyamoto A. Relationship between the first ovulation within three weeks postpartum and subsequent ovarian cycles and fertility in high producing dairy cows. J Reprod Dev 2006; 52: 479–486 [DOI] [PubMed] [Google Scholar]
- 9.Stevenson JS, Britt JH. Relationships among luteinizing hormone, estradiol, progesterone, glucocorticoids, milk yield, body weight and postpartum ovarian activity in Holstein cows. J Anim Sci 1979; 48: 570–577 [DOI] [PubMed] [Google Scholar]
- 10.Higuchi M, Miyashita N, Awata T. Rapid communication: a PCR-RFLP in the coding region of the bovine tumor necrosis factor-alpha locus. J Anim Sci 1999; 77: 3400–3401 [DOI] [PubMed] [Google Scholar]
- 11.Kahl S, Elsasser T, Proszkowiec Wegla M, Connor E. Association of tumor necrosis factor-alpha (TNF-alpha) gene promoter polymorphisms with hyper-responsiveness to endotoxin (LPS) in calves. J Dairy Sci (ADSA-CSAS-ASAS joint annual meeting 2009): abstract M32.
- 12.Zerbe H, Schneider N, Leibold W, Wensing T, Kruip TA, Schuberth HJ. Altered functional and immunophenotypical properties of neutrophilic granulocytes in postpartum cows associated with fatty liver. Theriogenology 2000; 54: 771–786 [DOI] [PubMed] [Google Scholar]
- 13.Mehrzad J, Klein G, Kamphues J, Wolf P, Grabowski N, Schuberth HJ. In vitro effects of very low levels of aflatoxin B1 on free radicals production and bactericidal activity of bovine blood neutrophils. Vet Immunol Immunopathol 2011; 141: 16–25 [DOI] [PubMed] [Google Scholar]
- 14.Jiemtaweeboon S, Shirasuna K, Nitta A, Kobayashi A, Schuberth HJ, Shimizu T, Miyamoto A. Evidence that polymorphonuclear neutrophils infiltrate into the developing corpus luteum and promote angiogenesis with interleukin-8 in the cow. Reprod Biol Endocrinol 2011; 9: 79 [DOI] [PMC free article] [PubMed] [Google Scholar]
- 15.Mutayoba BM, Meyer HH, Schams D, Schallenberger E. Development of a sensitive enzyme immunoassay for LH determination in bovine plasma using the streptavidin-biotin technique. Acta Endocrinol (Copenh) 1990; 122: 227–232 [DOI] [PubMed] [Google Scholar]
- 16.Brännström M, Bonello N, Wang LJ, Norman RJ. Effects of tumour necrosis factor alpha (TNF alpha) on ovulation in the rat ovary. Reprod Fertil Dev 1995; 7: 67–73 [DOI] [PubMed] [Google Scholar]
- 17.Hurwitz A, Payne DW, Packman JN, Andreani CL, Resnick CE, Hernandez ER, Adashi EY. Cytokine-mediated regulation of ovarian function: interleukin-1 inhibits gonadotropin-induced androgen biosynthesis. Endocrinology 1991; 129: 1250–1256 [DOI] [PubMed] [Google Scholar]
- 18.Chang RJ, Gougeon A, Erickson GF. Evidence for a neutrophil-interleukin-8 system in human folliculogenesis. Am J Obstet Gynecol 1998; 178: 650–657 [DOI] [PubMed] [Google Scholar]
- 19.Yoshino O, Osuga Y, Koga K, Hirota Y, Yano T, Tsutsumi O, Fujimoto A, Kugu K, Momoeda M, Fujiwara T, Taketani Y. Upregulation of interleukin-8 by hypoxia in human ovaries. Am J Reprod Immunol 2003; 50: 286–290 [DOI] [PubMed] [Google Scholar]
- 20.Brännström M, Norman RJ. Involvement of leukocytes and cytokines in the ovulatory process and corpus luteum function. Hum Reprod 1993; 8: 1762–1775 [DOI] [PubMed] [Google Scholar]
- 21.Brännström M, Bonello N, Norman RJ, Robertson SA. Reduction of ovulation rate in the rat by administration of a neutrophil-depleting monoclonal antibody. J Reprod Immunol 1995; 29: 265–270 [DOI] [PubMed] [Google Scholar]


