

Abstract
To determine whether hypoxia has an effect on luteinization, we examined the influence of hypoxia on a model of bovine luteinizing and non-luteinizing granulosa cell culture. The granulosa cells were obtained from small antral follicles (≤ 6 mm in diameter). To induce luteinization, the cells were treated for 24 h with insulin (2 µg/ml), forskolin (10 µM) or insulin in combination with forskolin at 20% O2. After 24 h, progesterone (P4) production was higher in the treated cells, which we defined as luteinizing granulosa cells, than in non-treated cells, which we defined as non-luteinizing granulosa cells. P4 production by non-luteinizing granulosa cells was not affected by hypoxia (24 h at 10% and 5% O2), while P4 production by granulosa cells treated with insulin in combination with forskolin was significantly increased under hypoxia (24 h at 10% and 5% O2). Because hypoxia affected P4 production by the luteinizing granulosa cells but not by the non-luteinizing granulosa cells, hypoxia seems to promote P4 production during, rather than before, luteinization. In the cells treated with insulin in combination with forskolin, mRNA and protein expression of steroidogenic acute regulatory protein (StAR) and protein expression of 3β-hydroxysteroid dehydrogenase (3β-HSD) increased under 10% O2, while mRNA and protein expressions of key protein and enzymes in P4 biosynthesis did not increase under 5% O2. The overall results suggest that hypoxia plays a role in progressing and completing the luteinization by enhancing P4 production through StAR as well as 3β-HSD expressions in the early time of establishing the corpus luteum.
Keywords: Granulosa cells, Hypoxia, Luteinization, Progesterone
In the ovary, follicular vascularization is restricted to the theca cell layer, while the granulosa cell layer and oocyte develop in an avascular environment. As the follicle develops, the blood vessels in the theca cell layer increase in number and size but do not penetrate the granulosa cell layer [1,2,3]. Ovarian blood flow decreases toward ovulation, and gradually increases with luteal development [4]. In addition, the O2 concentration in the follicular fluid in large follicles is less than in small follicles [5]. These conditions seem to represent a physiological hypoxia during follicular growth. Furthermore, immediately after ovulation, the ruptured follicle is also thought to be under a hypoxic condition due to bleeding and immature vascularization [6].
Hypoxia is defined as a reduction in available oxygen whether in a whole organism or in a tissue or cell. Hypoxia response elements of target genes are recognized and regulated by hypoxia-inducible factor 1 (HIF-1), comprising the subunit factors HIF-1α and aryl hydrocarbon receptor nuclear translocator (ARNT; HIF-1β) [7,8,9]. Hypoxia and HIF-1α have been studied on luteal function related to the steroidogenesis at various stages in cows [10,11,12]. Expression of HIF-1α in the corpus luteum (CL) was highest at the early luteal stage in cattle [12], humans [13] and monkeys [14]. In granulosa cells, HIF-1α expression peaks around the time of ovulation [1, 14, 15] and is upregulated by low oxygen conditions (2% O2) in synergy with human chorionic gonadotrophin (hCG), a mimic of luteinizing hormone (LH) [15]. The above findings indicate that the follicle, specifically the granulosa cell layer, is in a hypoxic condition around the time of ovulation.
Around the time of ovulation, granulosa cells and theca cells start to be luteinized after an LH surge, and after ovulation, they differentiate into luteal cells and then produce a large amount of progesterone (P4), which is essential for establishing pregnancy [16]. Luteinization causes important changes in follicular function, as the main product of the luteinized cells is changed from estrogen (E2) to P4. These changes include modifications of the rate-limiting elements of steroid synthesis. The key protein and enzymes in P4 biosynthesis include steroidogenic acute regulatory protein (StAR; STAR), which transports cholesterol from the outer mitochondrial membrane to the inner mitochondrial membrane, cytochrome P450 side-chain cleavage (P450scc; CYP11A1), which converts cholesterol into pregnenolone and 3β-hydroxysteroid dehydrogenase (3β-HSD; HSD3B), which converts pregnenolone into P4 [17,18,19,20,21]. A common process in luteinization involves rupture and collapse of the follicle at ovulation and also the invasion of some elements, including theca cells and blood vessels [22]. Based on the above findings, luteinization and hypoxia may take place simultaneously. However, it is unclear whether hypoxia contributes to P4 synthesis during luteinization.
In the present study, we hypothesized that hypoxia plays some roles in luteinization by stimulating the P4 generating system. To test this hypothesis, we used a model of bovine luteinizing and non-luteinizing granulosa cells in a culture system. We induced hypoxic conditions (10% and 5% O2) in the culture system and examined P4 production as well as mRNA and protein expression of StAR, P450scc and 3β-HSD. Furthermore, it has been confirmed that the conditions used in the present study are hypoxic by determining the protein expression of HIF-1α, which is known to accumulate in cells and function specifically under hypoxic conditions [23, 24].
Materials and Methods
Granulosa cell isolation and culture
Bovine ovaries were obtained from a local slaughterhouse and were transported to the laboratory in ice-cold sterile physiological saline. The ovaries with healthy follicles were washed several times in a sterile saline containing 100 IU/ml of penicillin (Meiji Seika Pharma, Tokyo, Japan; 611400D3051) and 100 µg/ml streptomycin (Meiji Seika Pharma; 6161400D1034). Granulosa cells in follicular fluid were aspirated aseptically from healthy small follicles (≤ 6 mm in diameter) using 2.5-ml disposable syringe and 24-gauge needle, pooled and transferred to a plastic Petri disc filled with Dulbecco’s Modified Eagle’s Medium (DMEM) and Ham’s F-12 medium (1:1 [v/v]; Invitrogen, Carlsbad, CA, USA; 12400–024) containing 10% calf serum (Invitrogen; 16170078), 20 µg/ml gentamicin (Sigma-Aldrich, St. Louis, MO, USA; G1397) and 2 µg/ml amphotericin B (Sigma-Aldrich; A9528) along with 50 IU heparin sodium salt (Nacalai Tesque, Kyoto, Japan; 17513–41). After removing cumulus-oocyte complexes (COCs) with a fine glass pipet under a dissecting microscope, granulosa cells in follicular fluid were centrifuged (800 × g, 5 min at 4 C) and then resuspended in Tris NH4Cl to break the blood cells after discarding the supernatant. Cell suspensions were centrifuged again and resuspended in DMEM (Sigma-Aldrich; D1152) with 100 IU/ml penicillin, 100 µg/ml streptomycin and 0.1% bovine serum albumin (BSA; Roche Diagnostics, Manheim, Germany; 10735086001) after the supernatant was discarded. This washing step was done two times. Cell suspensions were then centrifuged, filtered through metal meshes (100 µm × 2, 80 µm × 2) to avoid cell aggregation and resuspended in a suitable volume of culture medium (DMEM and Ham’s F-12 containing 10% calf serum and 20 µg/ml gentamicin). The cell viability of granulosa cells was assessed by trypan blue dye exclusion.
The dispersed granulosa cells were seeded at 0.5 × 10⁵ viable cells per 1 ml in culture medium in 75 cm2 culture flasks (20 ml/ flask; Greiner Bio-One, Frickenhausen, Germany; 658175) and cultured in a humidified atmosphere of 5% CO2 in air at 37.5 C in a N2-O2-CO2-regulated incubator (ESPEC, Osaka, Japan; no. BNP-110) for 3–4 days. When the cultured cells reached 80–90% confluence, cell passage was done using 0.1% bovine trypsin (Sigma-Aldrich; T92012) and sterile phosphate-buffered saline (PBS; Nissui Pharmaceutical, Tokyo, Japan; 05913). The granulosa cells were seeded at a concentration of 2.0 × 10⁵ viable cells per 1 ml in 48-well cluster dishes (0.5 ml/ well; Greiner Bio-One; 662160) for determination of P4 production, in 24-well cluster dishes (1.0 ml/ well; Greiner Bio-One; 677180) for determination of gene expression and in 75 cm2 culture flasks (20 ml/ flask; Greiner Bio-One; 658175) for determination of protein expression.
Model of luteinizing and non-luteinizing granulosa cells and hypoxic culture conditions
To prepare luteinizing and non-luteinizing granulosa cells, the culture medium was replaced with fresh medium containing 0.1% BSA, 5 ng/ml sodium selenite (Sigma-Aldrich; S5261), 5 µg/ml transferrin (Sigma-Aldrich; T4132) and 0.5 mM ascorbic acid (Wako-Pure Chemical Industries, Osaka, Japan; 031–12061), and the cells were then incubated under a normal culture atmosphere (20% O2, 5% CO2, 75% N2) without or with insulin (2 µg/ml; Sigma-Aldrich; I4011), forskolin (10 µM; Research Biochemicals International, Natick, MA, USA; 70–0501-05) or insulin (2 µg/ml) in combination with forskolin (10 µM) for 24 h. The concentration of insulin and forskolin was selected based on a previous report [25]. The culture media from these cultured cells were collected to determine the effect of insulin and forskolin treatment on P4 production for 24 h.
To determine the effect of hypoxia on P4 production, mRNA and protein expressions of STAR, CYP11A1 and HSD3B, the luteinizing and non-luteinizing granulosa cells were incubated under various O2 concentrations, 20% O2 (normoxia), 10% O2 (hypoxia) or 5% O2 (hypoxia), for 24 h in small individual culture chambers. The chambers were refilled with a nonstandard gas mixture, as described previously [10], containing the indicated O2 level (20%, 10% or 5% O2) and 5% CO2 in an N2 base.
P4 production determination
To determine P4 production, enzyme immunoassay (EIA) and DNA assay were performed. The conditioned media were collected and stored at –30 C until assayed for determining the P4 concentration after the granulosa cells were incubated under normoxic or hypoxic conditions without or with insulin (2 µg/ml), forskolin (10 µM) or insulin (2 µg/ml) in combination with forskolin (10 µM) for 24 h. The concentration of P4 was determined by EIA as described previously [26]. The standard curve ranged from 0.391 to 100 ng/ml. To fit the range of the standard concentration, the culture media were diluted. The cultured cells were also stored at –30 C until the DNA content was measured by the spectrophotometric method of Labarca and Paigen [27] and were used to standardize the P4 concentration. Four experiments were performed, and each treatment was tested in triplicate wells in each experiment. Insulin treatment increase the cell number, while the hypoxic conditions did not alter the cell number (data not shown).
RNA isolation, cDNA synthesis and real-time PCR
Total RNA of cultured luteinizing and non-luteinizing granulosa cells under normoxic and hypoxic conditions for 24 h was extracted to determine mRNA expression of STAR, CYP11A1 and HSD3B. Total RNA was prepared from granulosa cells using TRIsure (Bioline, London, UK; BIO-38033) according to the manufacturer’s directions. Extracted RNA from each sample was quantified using a NanoDrop Lite Spectrophotometer (Thermo Fisher Scientific, Waltham, MA, USA). The total RNA was reverse transcribed using a ThermoScript RT-PCR system (Invitrogen; 11146–016).
STAR, CYP11A1 and HSD3B gene expressions were measured by real-time PCR using a MyiQ (Bio-Rad, Tokyo, Japan) and iQ SYBR Green supermix (Bio-Rad; No. 170–8880) starting with 1 ng reverse-transcribed total RNA as described previously [28]. Standard curves of sample cDNA were generated using serial dilutions (1:2 to 1:1000). The expression of 18S ribosomal RNA (18SrRNA) was used as an internal control. In a preliminary experiment, 18SrRNA was confirmed to not be influenced by luteinization and hypoxia (data not shown). Twenty-base pair primers with 50–60% GC-contents were synthesized (Table 1).
Table 1. Primers used in real-time PCR.
| Gene | Primer | Sequence (5′–3′) | Accession no. | Product (bp) |
| STAR | Forward | CCCATGGAGAGGCTTTATGA | Y17259 | 115 |
| Reverse | TGATGACCGTGTCTTTTCCA | |||
| CYP11A1 | Forward | CTGGCATCTCCACAAAGACC | J05245 | 131 |
| Reverse | GTTCTCGATGTGGCGAAAGT | |||
| HSD3B | Forward | CCAAGCAGAAAACCAAGGAG | X17614 | 109 |
| Reverse | ATGTCCACGTTCCCATCATT | |||
| 18SrRNA | Forward | TCGCGGAAGGATTTAAAGTG | AY779625 | 141 |
| Reverse | AAACGGCTACCACATCCAAG |
The PCR conditions were: 95 C for 30 sec, followed by 45 cycles of 94 C for 6 sec, 60 C for 30 sec and 65 C for 6 sec. Use of the QuantiTect SYBR Green PCR system at elevated temperatures resulted in reliable and sensitive quantification of the PCR products with high linearity. The melting curve analysis was checked to verify that only the target amplicon was amplified.
HIF-1α, StAR, P450scc and 3β-HSD protein expressions
The luteinizing and non-luteinizing granulosa cells cultured under normoxic and hypoxic conditions for 24 h were washed with ice-cold PBS and scraped from the culture flask in 1 ml ice-cold homogenization buffer (25 mM Tris-HCl, 300 mM sucrose, 2 mM EDTA, Complete [protease inhibitor cocktail; Roche Diagnostics; 11697498001], pH 7.4). The cell suspension was centrifuged at 19,000 × g for 30 min, the supernatant was discarded, and the suspension was then lysed in 100 µl of lysis buffer (20 mM Tris-HCl, 150 mM NaCl, 1% Triton X-100, 10% glycerol [Sigma; G7757], Complete, pH 7.4). The protein samples were then stored at –80 C until HIF-1α, StAR, P450scc and 3β-HSD protein analyses were performed by Western blotting.
The protein concentration was determined by the method of Osnes et al. [29] using BSA as a standard. The protein samples were solubilized in SDS gel-loading buffer (50 mM Tris-HCl, 2% SDS [Nacalai Tesque; 31607–94], 10% glycerol, 1% β-mercaptoethanol [Wako Pure Chemical Industries; 137–06862], pH 6.8) and heated at 95 C for 10 min. Samples (50 µg protein) were subjected to electrophoresis on a 7.5% SDS-PAGE gel that included a pre-stained molecular weight marker (Bio-Rad; 161–0374) for 1 h at 200 V.
The separated proteins were electrophoretically transblotted to a PVDF membrane (GE Healthcare, Buckinghamshire, UK; RPN1416LFP) for 1 h at 25 V in transfer buffer (25 mM Tris-HCl, 192 mM glycine, 20% methanol, pH 8.3). The membrane was washed in TBS-T (0.1% Tween 20 in TBS [25 mM Tris-HCl, 137 mM NaCl, pH 7.5]) for 10 min and was incubated in PVDF blocking buffer (Toyobo, Osaka, Japan; NYBR01) for 1 h at room temperature. The membranes were then incubated separately with a primary antibody in immunoreaction enhancer solution (Toyobo, Osaka, Japan; NKB-101) specific to each protein, HIF-1α antibody (Sigma-Aldrich; SAB2104366; 1:500), StAR antibody (Abcam; ab96637; 1:3,000), P450scc antibody (Abcam; ab75497; 1:1,000), 3β-HSD antibody (Abcam; ab75710; 1:3,000) and β-actin antibody (ACTB; Sigma-Aldrich; A2228; 1:8,000), for overnight at 4 C. The membranes were washed three times for 5 min in TBS-T at room temperature, incubated with a secondary antibody in immunoreaction enhancer solution (for HIF-1α, StAR and P450scc [1:5,000], anti-rabbit Ig, HRP-linked whole antibody produced in donkey; Amersham Biosciences, Piscataway, NJ, USA; NA934; for 3β-HSD and ACTB [1:40,000], anti-mouse Ig, HRP-linked whole antibody produced in sheep; Amersham Biosciences; NA931) for 1 h and washed three times in TBS-T for 5 min at room temperature. The signal was detected with an ECL Western blotting detection system (Amersham Biosciences; RPN2109). The intensity of the immunological reaction (HIF-1α, StAR, P450scc, 3β-HSD, ACTB) in the cells was estimated by measuring the optical density in the defined area by computerized densitometry using NIH Image (National Institutes of Health, Bethesda, MD, USA).
Statistical analysis
All experimental data are shown as the mean ± SEM. The statistical analysis was performed using the GraphPad Prism 4 computer program. The statistical significance of differences in P4 production was assessed by ANOVA followed by a Fisher’s protected least-significant difference procedure (PLSD) as a multiple comparison test, while the statistical significance of differences in the amounts of STAR, CYP11A1 and HSD3B mRNA and the StAR, P450scc and 3β-HSD protein levels were assessed by two-way ANOVA with replications followed by Bonferroni post-tests to compare replicate means. P<0.05 was considered statistically significant.
Results
P4 production by luteinizing and non-luteinizing granulosa cells
Insulin and forskolin increased P4 production by granulosa cells cultured for 24 h under normoxia (20% O2) (Fig. 1; P<0.05), with the highest P4 production was shown in granulosa cells cultured with insulin in combination with forskolin. Non-treated granulosa cells produced only a low level of P4. Based on these results, the treated and non-treated granulosa cells were used as models of luteinizing and non-luteinizing granulosa cells for further experiments to determine the effect of hypoxia.
Fig. 1.

Progesterone (P4) production by granulosa cells for 24 h in the presence or absence of insulin (2 µg/ml), forskolin (10 µM) or insulin (2 µg/ml) in combination with forskolin (10 µM) under 20% O2 (Cont, control; Ins, insulin; Fors, forskolin; Ins + Fors, insulin in combination with forskolin). All values represent mean ± SEM of four separate experiments. Different letters indicate significant differences (P < 0.05), as determined by a Fisher’s PLSD as a multiple comparison test.
Effects of hypoxia on HIF-1α protein expression
The expressions of HIF-1α protein were increased under 10% O2 (Fig. 2A) and 5% O2 (Fig. 2B) after 24 h.
Fig. 2.
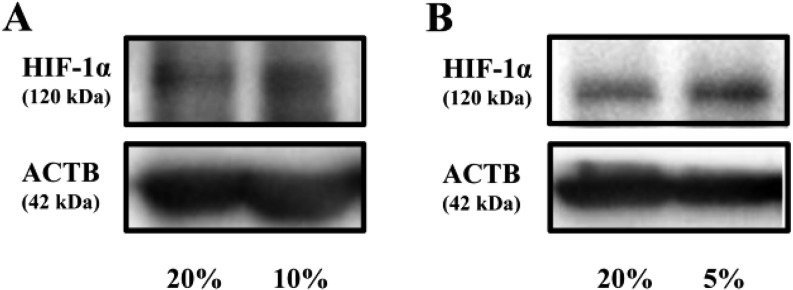
Effects of hypoxia on HIF-1α protein. Representatives samples of Western blotting for HIF-1α protein expressions under 20% O2 or 10% O2 (A) and 20% O2 or 5% O2 (B) for 24 h in non-treated granulosa cells.
Effects of hypoxia on P4 production by non-luteinizing and luteinizing granulosa cells
Hypoxia, both 10% and 5% O2, increased P4 production by luteinizing granulosa cells, while the same conditions did not affect P4 production by non-luteinizing granulosa cells (Fig. 3). The culture conditions under 10% O2 significantly increased P4 production both in granulosa cells treated with insulin and those treated with insulin in combination with forskolin compared with normoxia (20% O2) (Fig. 3A; P < 0.05). However, under 5% O2, P4 production was significantly increased only in granulosa cells treated with insulin in combination with forskolin (Fig. 3B; P < 0.05).
Fig. 3.

Effects of hypoxia on progesterone (P4) production by non-luteinizing and luteinizing granulosa cells. The cells were cultured under 20% O2 or 10% O2 (A) and 20% O2 or 5% O2 (B) for 24 h in the presence or absence of insulin (2 µg/ml), forskolin (10 µM) or insulin (2 µg/ml) in combination with forskolin (10 µM) (mean ± SEM). All values are expressed as a percentage of normoxia (20% O2) of four separate experiments. Asterisks indicate significant differences (P < 0.05) as determined by ANOVA followed by Fisher’s PLSD as a multiple comparison test.
Effects of hypoxia on STAR, CYP11A1 and HSD3B mRNA expressions in non-luteinizing and luteinizing granulosa cells
A real-time PCR analysis showed that the culture conditions under 10% O2 significantly increased STAR mRNA expression in granulosa cells treated with insulin in combination with forskolin compared with normoxia (20% O2) (Fig. 4A; P < 0.05). However, the conditions under 5% O2 did not affect STAR, CYP11A1 and HSD3B mRNA expressions (Fig. 4B).
Fig. 4.

Effects of hypoxia on STAR, CYP11A1 and HSD3B mRNA by non-luteinizing and luteinizing granulosa cells. The cells were cultured under 20% O2 or 10% O2 (A) and 20% O2 or 5% O2 (B) for 24 h in the presence or absence of insulin (2 µg/ml), forskolin (10 µM) or insulin (2 µg/ml) in combination with forskolin (10 µM). The amounts of STAR, CYP11A1 and HSD3B mRNA are expressed relative to the amounts of 18SrRNA. The asterisk indicates a significant difference (P < 0.05) within the same treatment group, as determined by two-way ANOVA with replications (n = 3) followed by Bonferroni post-tests to compare replicate means.
Effects of hypoxia on StAR, P450scc and 3β-HSD protein expressions in non-luteinizing and luteinizing granulosa cells
The culture conditions under 10% O2 significantly increased StAR and 3β-HSD protein expressions in granulosa cells treated with insulin in combination with forskolin compared with normoxia (Fig. 5A and 5B; P < 0.05), while the conditions under 5% O2 did not affect StAR, P450scc and 3β-HSD protein expressions (Fig. 5C and 5D).
Fig. 5.

Effects of hypoxia on StAR, P450scc and 3β-HSD protein by non-luteinizing and luteinizing granulosa cells. The cells were cultured under 20% O2 or 10% O2 (A and B) and 20% O2 or 5% O2 (C and D) for 24 h in the presence or absence of insulin (2 µg/ml), forskolin (10 µM) or insulin (2 µg/ml) in combination with forskolin (10 µM). Representative samples of Western blotting for StAR, P450scc, 3β-HSD and β-actin are shown in Fig. 5A for 10% O2 and in Fig. 5C for 5% O2. The blot was incubated with primary antibodies against StAR, P450scc, 3β-HSD or β-actin and then incubated with secondary antibody conjugated to HRP. The resultant signal was detected by chemiluminescence and quantitated by computer-assisted densitometry. All protein levels are expressed relative to the amounts of β-actin. Asterisks indicate significant differences (P < 0.05) within the same treatment groups, as determined by two-way ANOVA with replications (n = 3) followed by Bonferroni post-tests to compare replicate means.
Discussion
Luteinization occurs after an LH surge, and the follicle differentiates into CL after ovulation. Meanwhile, the follicle is under its most hypoxic conditions around the time of ovulation [1, 14, 15]. Since hypoxia and luteinization occur at the same time, it raises the question whether hypoxia plays some roles during luteinization. In the present study, we used a model of luteinizing granulosa cells induced by insulin (2 µg/ml) and forskolin (10 µM). Bovine granulosa cells obtained from small antral follicles are known to differentiate into large luteal-like cells during culture in vitro [25]. Our results showed that the cultured granulosa cells treated with insulin in combination with forskolin showed increased P4 production after 24 h, and the production was the highest among the groups (Fig. 1). Insulin or insulin-like growth factor-I (IGF-I) is known to stimulate proliferation and P4 production in granulosa cells [30,31,32,33,34]. In addition, forskolin induces an increased intracellular cyclic AMP concentration via activation of adenylate cyclase [35]. Furthermore, insulin in combination with forskolin mimics the effect of LH and activates adenylate cyclase through upregulation of P4 production [36]. Therefore, these granulosa cells were used for further experiments in the present study.
Hypoxic conditions are known to cause accumulation of HIF-1α protein in cells and to enhance transcription of hypoxia-inducible genes [23, 24]. In the present study, we induced hypoxic conditions in our culture system by using low oxygen tension. We selected 10% and 5% O2 as the hypoxic conditions based on the following previous studies. The O2 levels in antral follicles of humans and pigs are around 7–11% [37, 38]. Basini et al. [5] demonstrated that severe hypoxic conditions (lowering the level to 1% O2) decreased both E2 and P4 production by swine granulosa cells, while partial hypoxia (5% O2) did not affect them. Hillier [39] also reported that partial hypoxic conditions are possibly more comparable to the conditions of follicular development, which relies on E2 and P4 production. The finding that the protein expression of HIF-1α was increased by 10% and 5% O2 conditions in the present study (Fig. 2A and 2B) shows that the cells were hypoxic. Furthermore, newly formed CLs after ovulation increase P4 production [16] and express high levels of HIF-1α [12]. In the present study, both P4 production and HIF-1α expression of luteinizing granulosa cells were increased under 10% O2. Thus, the O2 conditions in the cells cultured under 10% O2 may be similar to the O2 conditions in the cells under luteinization.
P4 production by the CL is essential for establishing and maintaining pregnancy. During luteinization, granulosa cells and theca cells differentiate into luteal cells, and P4 starts to be produced in large amounts [16]. The present results showed that under 10% O2 and 5% O2 for 24 h, P4 production by cultured granulosa cells treated with insulin in combination with forskolin increased (Fig. 3A and 3B). Furthermore, under 10% O2, P4 production by the granulosa cells treated with only insulin also increased. Interestingly, hypoxic conditions did not affect the P4 production by non-luteinizing granulosa cells. These results suggest that hypoxic conditions promote P4 production during, rather than before, luteinization.
In our previous study [10], hypoxia inhibited basal and LH-stimulated P4 production by cultured bovine mid luteal cells, suggesting that hypoxia facilitates luteolysis. On the other hand, in the present study, hypoxia increased P4 production and seemed to promote P4 production during luteinization of granulosa cells. We have no clear explanation for these contradictive effects of hypoxia on P4 production between luteinizing granulosa cells and luteal cells. Hypoxia may differently affect cells depending on the differentiation status of granulosa and luteal cells. Mid luteal cells are matured luteal cells that produce the highest level of P4, while in the present study, we used luteinizing granulosa cells, which are immature luteal cells that have just begun to produce P4. The difference in cell status may be the reason for the contradictive action of hypoxia on luteolysis and luteinization.
Luteinization includes modification of steroidogenic enzymes and the steroidogenic acute regulatory protein expressions to bring about large-scale synthesis of P4. StAR, P450scc and 3β-HSD are known as the key protein and enzymes involved in P4 biosynthesis [20, 21, 40]. The expression of StAR and 3β-HSD are upregulated in theca and granulosa cells during the luteinization process [41,42,43,44,45]. The development of P450scc also characterizes the differentiation of follicular granulosa cells because the enzyme is not present or present only in low abundance in granulosa cells of the preovulatory follicle [46]. Our findings that 10% O2 increased the mRNA and protein expressions of StAR (Fig. 4A) suggest that hypoxia enhances P4 production by increasing StAR expression. StAR is essential for steroidogenesis because it imports cholesterol, a precursor of all steroids, into mitochondria [47]. Expression of StAR has also been shown to undergo luteinization-dependent upregulation in both pigs [40, 48] and cows [43]. Thus, its expression is an important marker for the luteinization process. Under 10% O2, the protein expression of 3β-HSD was also increased but not the mRNA expression. The protein expression of 3β-HSD may be more highly stabilized under 10% O2 than the mRNA expression. Under 5% O2, there was no significant increase in StAR, P450scc and 3β-HSD mRNA and protein expressions in luteinizing granulosa cells; however, we could see that the mRNA and protein expressions of this protein and the enzymes were slightly increased under 5% O2 in granulosa cells treated with insulin in combination with forskolin (Fig. 4B). These results suggest that 10% O2 may reflect the O2 concentration in vivo in the follicle around the time of ovulation. We previously showed that 3% O2 decreases P4 production [10]. If we applied this lower O2 concentration to our present model, P4 production and steroidogenesis may decrease too. Further studies are needed to confirm the relationship between HIF1 and steroidogenic factors.
In conclusion, the overall findings suggest that hypoxia (10% O2) promotes the P4 synthesis during luteinization by enhancing the expression of StAR and partly the expression of 3β-HSD, and this condition is important for establishing the CL.
Acknowledgments
This research was supported by a Grant-in-Aid for Scientific Research (No. #24380155) of the Japan Society for the Promotion Science (JSPS).
References
- 1.Kim J, Bagchi IC, Bagchi MK. Signaling by hypoxia-inducible factors is critical for ovulation in mice. Endocrinology 2009; 150: 3392–3400 [DOI] [PMC free article] [PubMed] [Google Scholar]
- 2.Suzuki T, Sasano H, Takaya R, Fukaya T, Yajima A, Nagura H. Cyclic changes of vasculature and vascular phenotypes in normal human ovaries. Hum Reprod 1998; 13: 953–959 [DOI] [PubMed] [Google Scholar]
- 3.Redmer DA, Reynolds LP. Angiogenesis in the ovary. Rev Reprod 1996; 1: 182–192 [DOI] [PubMed] [Google Scholar]
- 4.Wise TH, Caton D, Thatcher WW, Barron DH, Fields MJ. Ovarian function during the estrous cycle of the cow: ovarian blood flow and progesterone release rate. J Anim Sci 1982; 55: 627–637 [DOI] [PubMed] [Google Scholar]
- 5.Basini G, Bianco F, Grasselli F, Tirelli M, Bussolati S, Tamanini C. The effects of reduced oxygen tension on swine granulosa cell. Regul Pept 2004; 120: 69–75 [DOI] [PubMed] [Google Scholar]
- 6.Amselgruber WM, Schäfer M, Sinowatz F. Angiogenesis in the bovine corpus luteum: an immunocytochemical and ultrastructural study. Anat Histol Embryol 1999; 28: 157–166 [DOI] [PubMed] [Google Scholar]
- 7.Salceda S, Caro J. Hypoxia-inducible factor 1α (HIF-1α) protein is rapidly degraded by the ubiquitin-proteasome system under normoxic conditions. Its stabilization by hypoxia depends on redox-induced changes. J Biol Chem 1997; 272: 22642–22647 [DOI] [PubMed] [Google Scholar]
- 8.Wang GL, Jiang BH, Rue EA, Semenza GL. Hypoxia-inducible factor 1 is a basic-helix-loop-helix-PAS heterodimer regulated by cellular O2 tension. Proc Natl Acad Sci USA 1995; 92: 5510–5514 [DOI] [PMC free article] [PubMed] [Google Scholar]
- 9.Welsh DJ, Peacock AJ. Cellular responses to hypoxia in the pulmonary circulation. High Alt Med Biol 2013; 14: 111–116 [DOI] [PubMed] [Google Scholar]
- 10.Nishimura R, Sakumoto R, Tatsukawa Y, Acosta TJ, Okuda K. Oxygen concentration is an important factor for modulating progesterone synthesis in bovine corpus luteum. Endocrinology 2006; 147: 4273–4280 [DOI] [PubMed] [Google Scholar]
- 11.Nishimura R, Komiyama J, Tasaki Y, Acosta TJ, Okuda K. Hypoxia promotes luteal cell death in bovine corpus luteum. Biol Reprod 2008; 78: 529–536 [DOI] [PubMed] [Google Scholar]
- 12.Nishimura R, Okuda K. Hypoxia is important for establishing vascularization during corpus luteum formation in cattle. J Reprod Dev 2010; 56: 110–116 [DOI] [PubMed] [Google Scholar]
- 13.van den Driesche S, Myers M, Gay E, Thong KJ, Duncan WC. HCG up-regulates hypoxia inducible factor-1 alpha in luteinized granulosa cells: implications for the hormonal regulation of vascular endothelial growth factor A in the human corpus luteum. Mol Hum Reprod 2008; 14: 455–464 [DOI] [PubMed] [Google Scholar]
- 14.Duncan WC, van den Driesche S, Fraser HM. Inhibition of vascular endothelial growth factor in the primate ovary up-regulates hypoxia-inducible factor-1alpha in the follicle and corpus luteum. Endocrinology 2008; 149: 3313–3320 [DOI] [PubMed] [Google Scholar]
- 15.Tam KK, Russell DL, Peet DJ, Bracken CP, Rodgers RJ, Thompson JG, Kind KL. Hormonally regulated follicle differentiation and luteinization in the mouse is associated with hypoxia inducible factor activity. Mol Cell Endocrinol 2010; 327: 47–55 [DOI] [PubMed] [Google Scholar]
- 16.Concannon P, Hansel W, Mcentee K. Changes in LH, progesterone and sexual behavior associated with preovulatory luteinization in the bitch. Biol Reprod 1977; 17: 604–613 [DOI] [PubMed] [Google Scholar]
- 17.Clark BJ, Wells J, King SR, Stocco DM. The purification, cloning, and expression of a novel luteinizing hormone-induced mitochondrial protein in MA-10 mouse Leydig tumor cells. Characterization of the steroidogenic acute regulatory protein (StAR). J Biol Chem 1994; 269: 28314–28322 [PubMed] [Google Scholar]
- 18.Clark BJ, Soo SC, Caron KM, Ikeda Y, Parker KL, Stocco DM. Hormonal and developmental regulation of the steroidogenic acute regulatory protein. Mol Endocrinol 1995; 9: 1346–1355 [DOI] [PubMed] [Google Scholar]
- 19.Stocco DM. A StAR search: implications in controlling steroidgenesis. Biol Reprod 1997; 56: 328–336 [DOI] [PubMed] [Google Scholar]
- 20.Juengel JL, Niswender GD. Molecular regulation of luteal progesterone synthesis in domestic ruminants. J Reprod Fertil Suppl 1999; 54: 193–205 [PubMed] [Google Scholar]
- 21.Niswender GD. Molecular control of luteal secretion of progesterone. Reproduction 2002; 123: 333–339 [DOI] [PubMed] [Google Scholar]
- 22.Murphy BD, Gévry N, Ruiz-Cortés T, Coté F, Downey BR, Sirois J. Formation and early development of the corpus luteum in pigs. Reprod Suppl 2001; 58(Suppl): 47–63 [PubMed] [Google Scholar]
- 23.Semenza GL. Regulation of mammalian O2 homeostasis by hypoxia-inducible factor 1. Annu Rev Cell Dev Biol 1999; 15: 551–578 [DOI] [PubMed] [Google Scholar]
- 24.Wenger RH. Cellular adaptation to hypoxia: O2-sensing protein hydroxylases, hypoxia-inducible transcription factors, and O2-regulated gene expression. FASEB J 2002; 16: 1151–1162 [DOI] [PubMed] [Google Scholar]
- 25.Fujita Y, Okuda K, Horikawa K, Naito C. In vitro differentiation of bovine granulosa cells obtained from small antral follicles. J Reprod Dev 1996; 42: 133–138 [Google Scholar]
- 26.Okuda K, Uenoyama Y, Lee KW, Sakumoto R, Skarzynski DJ. Progesterone stimulation by prostaglandin F2α involves the protein kinase C pathway in cultured bovine luteal cells. J Reprod Dev 1998; 44: 79–84 [Google Scholar]
- 27.Labarca C, Paigen K. A simple, rapid, and sensitive DNA assay procedure. Anal Biochem 1980; 102: 344–352 [DOI] [PubMed] [Google Scholar]
- 28.Sakumoto R, Komatsu T, Kasuya E, Saito T, Okuda K. Expression of mRNAs for interleukin-4, interleukin-6 and their receptors in porcine corpus luteum during the estrous cycle. Domest Anim Endocrinol 2006; 31: 246–257 [DOI] [PubMed] [Google Scholar]
- 29.Osnes T, Sandstad O, Skar V, Osnes M, Kierulf P. Total protein in common duct bile measured by acetonitrile precipitation and a micro bicinchoninic acid (BCA) method. Scand J Clin Lab Invest 1993; 53: 757–763 [DOI] [PubMed] [Google Scholar]
- 30.Savion N, Lui GM, Laherty R, Gospodarowicz D. Factors controlling proliferation and progesterone production by bovine granulosa cells in serum-free medium. Endocrinology 1981; 109: 409–420 [DOI] [PubMed] [Google Scholar]
- 31.Holtorf AP, Furuya K, Ivell R, McArdle CA. Oxytocin production and oxytocin messenger ribonucleic acid levels in bovine granulosa cells are regulated by insulin and insulin-like growth factor-I: dependence on developmental status of the ovarian follicle. Endocrinology 1989; 125: 2612–2620 [DOI] [PubMed] [Google Scholar]
- 32.McArdle CA, Holtorf AP. Oxytocin and progesterone release from bovine corpus luteal cells in culture: effects of insulin-like growth factor I, insulin, and prostaglandins. Endocrinology 1989; 124: 1278–1286 [DOI] [PubMed] [Google Scholar]
- 33.Saumande J. Culture of bovine granulosa cells in a chemically defined serum-free medium: the effect of insulin and fibronectin on the response to FSH. J Steroid Biochem Mol Biol 1991; 38: 189–196 [DOI] [PubMed] [Google Scholar]
- 34.Gong JG, McBride D, Bramley TA, Webb R. Effects of recombinant bovine somatotrophin, insulin-like growth factor-I and insulin on the proliferation of bovine granulosa cells in vitro. J Endocrinol 1993; 139: 67–75 [DOI] [PubMed] [Google Scholar]
- 35.Lioutas C, Einspanier A, Kascheike B, Walther N, Ivell R. An autocrine progesterone positive feedback loop mediates oxytocin upregulation in bovine granulosa cells during luteinization. Endocrinology 1997; 138: 5059–5062 [DOI] [PubMed] [Google Scholar]
- 36.Meidan R, Altstein M, Girsh E. Biosynthesis and release of oxytocin by granulosa cells derived from preovulatory bovine follicles: effects of forskolin and insulin-like growth factor-I. Biol Reprod 1992; 46: 715–720 [DOI] [PubMed] [Google Scholar]
- 37.Knudsen JF, Litkowski LJ, Wilson TL, Guthrie HD, Batta SK. Concentrations of hydrogen ions, oxygen, carbon dioxide and bicarbonate in porcine follicular fluid. J Endocrinol 1978; 79: 249–250 [DOI] [PubMed] [Google Scholar]
- 38.Fischer B, Künzel W, Kleinstein J, Gips H. Oxygen tension in follicular fluid falls with follicle maturation. Eur J Obstet Gynecol Reprod Biol 1992; 43: 39–43 [DOI] [PubMed] [Google Scholar]
- 39.Hillier SG. Gonadotropic control of ovarian follicular growth and development. Mol Cell Endocrinol 2001; 179: 39–46 [DOI] [PubMed] [Google Scholar]
- 40.Pescador N, Stocco DM, Murphy BD. Growth factor modulation of steroidogenic acute regulatory protein and luteinization in the pig ovary. Biol Reprod 1999; 60: 1453–1461 [DOI] [PubMed] [Google Scholar]
- 41.LaVoie HA, Garmey JC, Veldhuis JD. Mechanisms of insulin-like growth factor I augmentation of follicle-stimulating hormone-induced porcine steroidogenic acute regulatory protein gene promoter activity in granulosa cells. Endocrinology 1999; 140: 146–153 [DOI] [PubMed] [Google Scholar]
- 42.Bao B, Calder MD, Xie S, Smith MF, Salfen BE, Youngquist RS, Garverick HA. Expression of steroidogenic acute regulatory protein messenger ribonucleic acid is limited to theca of healthy bovine follicles collected during recruitment, selection, and dominance of follicles of the first follicular wave. Biol Reprod 1998; 59: 953–959 [DOI] [PubMed] [Google Scholar]
- 43.Pescador N, Soumano K, Stocco DM, Price CA, Murphy BD. Steroidogenic acute regulatory protein in bovine corpora lutea. Biol Reprod 1996; 55: 485–491 [DOI] [PubMed] [Google Scholar]
- 44.Kerban A, Boerboom D, Sirois J. Human chorionic gonadotropin induces an inverse regulation of steroidogenic acute regulatory protein messenger ribonucleic acid in theca interna and granulosa cells of equine preovulatory follicles. Endocrinology 1999; 140: 667–674 [DOI] [PubMed] [Google Scholar]
- 45.Conley AJ, Kaminski MA, Dubowsky SA, Jablonka-Shariff A, Redmer DA, Reynolds LP. Immunohistochemical localization of 3 beta-hydroxysteroid dehydrogenase and P450 17 α-hydroxylase during follicular and luteal development in pigs, sheep, and cows. Biol Reprod 1995; 52: 1081–1094 [DOI] [PubMed] [Google Scholar]
- 46.Zlotkin T, Farkash Y, Orly J. Cell-specific expression of immunoreactive cholesterol side-chain cleavage cytochrome P-450 during follicular development in the rat ovary. Endocrinology 1986; 119: 2809–2820 [DOI] [PubMed] [Google Scholar]
- 47.Orly J, Stocco DM. The role of the steroidogenic acute regulatory (StAR) protein in female reproductive tissues. Horm Metab Res 1999; 31: 389–398 [DOI] [PubMed] [Google Scholar]
- 48.LaVoie HA, Benoit AM, Garmey JC, Dailey RA, Wright DJ, Veldhuis JD. Coordinate developmental expression of genes regulating sterol economy and cholesterol side-chain cleavage in the porcine ovary. Biol Reprod 1997; 57: 402–407 [DOI] [PubMed] [Google Scholar]