

Abstract
Although age-dependent effects on blood pressure (BP) have been reported, they have not been systematically investigated in large-scale genome-wide association studies (GWASs). We leveraged the infrastructure of three well-established consortia (CHARGE, GBPgen, and ICBP) and a nonstandard approach (age stratification and metaregression) to conduct a genome-wide search of common variants with age-dependent effects on systolic (SBP), diastolic (DBP), mean arterial (MAP), and pulse (PP) pressure. In a two-staged design using 99,241 individuals of European ancestry, we identified 20 genome-wide significant (p ≤ 5 × 10⁻⁸) loci by using joint tests of the SNP main effect and SNP-age interaction. Nine of the significant loci demonstrated nominal evidence of age-dependent effects on BP by tests of the interactions alone. Index SNPs in the EHBP1L1 (DBP and MAP), CASZ1 (SBP and MAP), and GOSR2 (PP) loci exhibited the largest age interactions, with opposite directions of effect in the young versus the old. The changes in the genetic effects over time were small but nonnegligible (up to 1.58 mm Hg over 60 years). The EHBP1L1 locus was discovered through gene-age interactions only in whites but had DBP main effects replicated (p = 8.3 × 10⁻⁴) in 8,682 Asians from Singapore, indicating potential interethnic heterogeneity. A secondary analysis revealed 22 loci with evidence of age-specific effects (e.g., only in 20 to 29-year-olds). Age can be used to select samples with larger genetic effect sizes and more homogenous phenotypes, which may increase statistical power. Age-dependent effects identified through novel statistical approaches can provide insight into the biology and temporal regulation underlying BP associations.
Introduction
Age is a major predictor of cardiovascular health1 but its impact on the genetic architecture of blood pressure (BP) has been largely unexplored. A Norwegian study of parent-offspring pairs, siblings, and twins reported that 60%–70% of the genetic variance of BP at ages 20 and 60 was attributable to genes active at both ages.2 For the genes that are active across the age spectrum, we do not know whether the magnitude of the genetic effects are constant or vary with age.3 Family and population studies suggest that age may modify the effects of some BP genes. Among relative pairs that shared 50% of their genes on average, the correlation of BP traits was higher in members of similar ages2 and BPs of parents and offspring measured around the same age yielded correlations similar to that of sibpairs.4 Variance components models that explicitly incorporated age-dependent genetic effects identified 26 loci that were missed by linkage analyses that assumed constant effects across ages.5 Further strengthening the evidence for age-dependent effects, candidate gene studies have identified SNPs that interact with age to influence BP.6–10
No large-scale BP studies have assessed the pervasiveness of gene-age interactions by using common variants from genome-wide association studies (GWASs). Most aggregate studies have focused on the discovery of genetic main effects, relying on the meta-analysis of GWASs that included age as a continuous covariate in the study-specific analyses.11–16 Not only do these studies fail to provide any knowledge about the change in genetic effects over time, but they use age adjustments that do not sufficiently control for the confounding by age6–10 and they meta-analyze studies with substantially different age distributions (such as containing only the young or the elderly), which may obscure genetic effects that are age dependent. The primary aim of this investigation was to identify both known and novel BP loci whose magnitude of genetic effects differed by age. Identifying such gene-age interactions can provide insight into the biology and temporal regulation of known BP genes and facilitate the discovery of BP genes obscured in a main-effects-only analysis.
We employed age stratification and metaregression to identify BP loci whose magnitude of genetic effects differ by age (see Figure 1 for an overview of the design). This nonstandard approach was borne out of a previous analysis in which we failed to identify any loci when gene-age interaction analysis was performed within each study and the results meta-analyzed. Realizing that the null results could be due to study design issues relating to the way age was handled rather than a true lack of interactions, we developed a more computationally intensive alternative. We stratified participants from each study into 10-year age bins and conducted a GWAS of each BP trait (systolic BP [SBP], diastolic BP [DBP], mean arterial pressure [MAP], and pulse pressure [PP]) within each subgroup (representing a study and age bin). We then collected the SNP effect estimates (the coefficients from the GWAS that indicated the change in BP for each copy of the coded allele) and standard errors from all subgroups. We identified significant gene-age interactions through linear regression of the SNP effect estimates onto the median age of each subgroup; we referred to this as metaregression because the SNP effect estimates and the median ages were subgroup-level variables instead of measures on individuals and we weighted the subgroup results according to their precision (by the inverse variance of the SNP effects from the GWAS).
Figure 1.
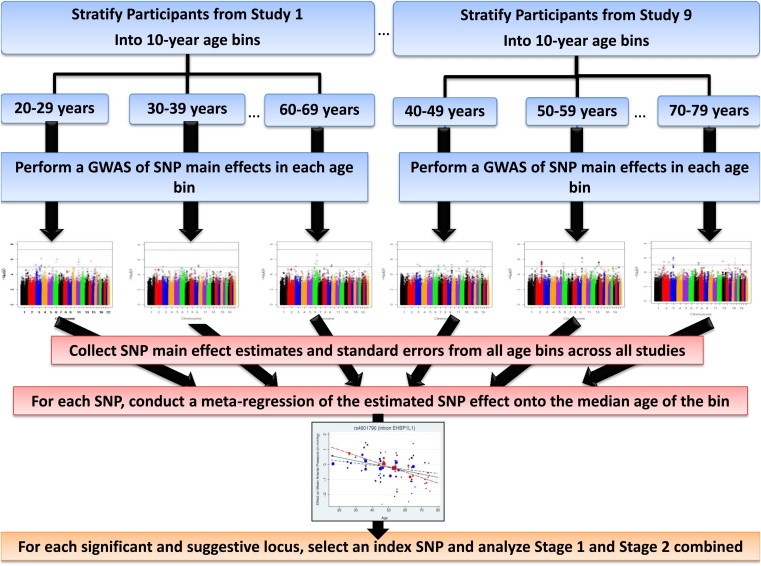
Study Design for the Primary Analysis
We also conducted a secondary “within-age bins” analysis to interrogate the 30%–40% of genetic variance in BP that is generally attributed to age-specific genetic effects2 and the differential influence of genetic mechanisms during different periods of life.17 For the secondary analysis, we meta-analyzed the genetic effects across all studies within each age strata separately (e.g., a meta-analysis of 20- to 29-year-olds only). Overall, we show that explicit modeling of the age dependency of genetic effects can enhance our understanding of intraindividual variation in complex traits.
Subjects and Methods
Subjects
Participants from each study provided written informed consent and all studies received approval from their respective institutional review boards.
Stage 1 Samples
The stage 1 analysis (N = 55,796) included nine studies from the Cohorts for Heart and Aging Research in Genome Epidemiology (CHARGE) Consortium: Age, Gene/Environment Susceptibility-Reykjavik (AGES; N = 3,128), Atherosclerosis Risk in Communities (ARIC; N = 9,306), Coronary Artery Risk Development in Young Adults (CARDIA; N = 1,713), Cardiovascular Health Study (CHS; N = 2,902), Framingham Heart Study (FHS; N = 7,520), Multi-Ethnic Study of Atherosclerosis (MESA; N = 2,339), Rotterdam Study I (RS I; N = 4,389), Rotterdam Study II (RS II; N = 1,912), and the Women’s Genome Health Study (WGHS; N = 22,587). Participants aged <20 years or ≥80 years were excluded from the stage 1 samples except for the 17- to 20-year-olds included in the CARDIA Study; the latter was targeted to young adults, and therefore all subjects in this sample ranged from 17 to 32 years old. Detailed descriptions of the study designs and summary statistics are provided in the Supplemental Data and Tables S1 and S2.
Stage 2 Samples
Stage 2 included 15 studies and 43,445 participants of European ancestry, largely from the Global Blood Pressure Genetics Consortium (Global BPgen) and the ICBP (International Consortium for Blood Pressure). The stage 2 studies included the Busselton Health (BHS; N = 1,135), Cohorte Lausannoise (CoLaus; N = 4,943), European Prospective Investigation of Cancer-Norfolk (EPIC; N = 2,407), Fenland (N = 1,399), Kooperative Gesundheitsforschung in der Region Augsburg Third Survey (KORA S3; N = 1,594), LifeLines Cohort (N = 8,088), Myocardial Infarction Genetics Consortium (MIGen; N = 1,196), Netherlands Study of Depression and Anxiety (NESDA; N = 1,547), Prevention of Renal and Vascular End Stage Disease (PREVEND; N = 3,303), Precocious Coronary Artery Disease (PROCARDIS; N = 7,050), SardiNIA (N = 1,248), Study of Health In Pomerania (SHIP; N = 4,058), Supplementation en Vitamines et Mineraux Antioxydants (SUVIMAX; N = 1,673), Tracking Adolescent’s Individual Lives Survey (TRAILS; N = 1,556), and the Young Finns (YFS; N = 2,248) studies. Detailed descriptions of the study designs and summary statistics are provided in the Supplemental Data and Tables S4 and S5. Individuals aged 20–80 years old were included in the analysis, along with the TRAILS clinical and population cohorts that included individuals <20 years old.
Singapore Samples
The Singapore samples included four studies of Asians comprised of 8,682 Chinese, Indian, and Malay individuals from Singapore. These studies were the Singapore Chinese Eye (N = 1,849), Singapore Indian Eye (N = 2,476), Singapore Malay Eye (N = 2,502), and the Singapore Prospective Study Program (N = 1,855). Detailed descriptions of the study designs and summary statistics are provided in the Supplemental Data and Tables S6 and S7.
Phenotypes
Blood pressure (BP) measurements and covariates were selected from a single visit that maximized the sample size or age range of the study. Each study conducted phenotype harmonization on systolic blood pressure (SBP) and diastolic blood pressure (DBP). For individuals on antihypertensive medications at the time of the chosen clinic visit, 10 and 5 mmHg were added to the measured SBP and DBP, respectively.18 The addition of a constant to the measured BP in treated participants has been shown to increase statistical power and reduce shrinkage bias, compared to no medication adjustment or the exclusion of treated individuals.19 Mean arterial pressure (MAP) and pulse pressure (PP) were calculated from the medication-adjusted SBP and DBP values as MAP = SBP/3 + 2DBP/3 and PP = SBP − DBP. Outliers, defined as those with BP values that were at least four standard deviations away from the mean of their subgroup (defined by study and age bin), were excluded from the analysis.
Genotypes
The genotyping platforms, SNP quality control filters, imputation software, and reference human genome used varied by study and are detailed in Tables S2, S5, and S7. Each study imputed the allele dosages for ∼2.5 million SNP genotypes.
Association Analyses within Each Study-Age Bin Subgroup
Each stage 1 study stratified participants into six 10-year age bins (20–29 years, 30–39 years, 40–49 years, 50–59 years, 60–69 years, and 70–79 years) for a total of 28 subgroups (defined by study and age bin); the CARDIA study used one age bin from 17 to 32 years of age (the entire study sample). For age bins containing more than 250 individuals, a genome-wide association analysis (GWAS) of SNP main effects was conducted by regressing each BP trait (SBP, DBP, MAP, and PP) onto the allele dosage (the observed [genotyped data] or estimated [imputed data] number of copies of the coded allele in an individual) while adjusting for age, age-squared, body-mass-index, gender, and field center (if a multicenter study). The adjustment for both age and age-squared allowed age to have a nonlinear main effect on BP as suggested by multiple longitudinal studies.20–22 The estimated SNP effect (the coefficient for the allele dosage) from the GWAS represented the BP change associated with each copy of the coded allele in that age bin. The GWAS analysis software used by each stage 1 study is detailed in Table S2. Genomic control was applied to the GWAS results from each stage 1 subgroup to control for population stratification (the genomic inflation factors, λ, ranged from 0.977 to 1.057; see Table S3).
The stage 2 and Singapore studies adopted a similar strategy: they stratified participants into 10-year age bins, combining adjacent age bins when necessary to achieve a sufficient sample size (two studies used an age bin for 20- to 39-year-olds, one study used an age bin for 60- to 79-year-olds, and another used age bins for 35- to 49-year-olds and 50- to 64-year-olds). Because many of the stage 2 and Singapore studies had smaller sample sizes than did the stage 1 studies, the association analysis was performed in all subgroups containing more than 124 individuals (see Tables S5 and S7 for analysis software). After stage 1 analysis, the SNP with the smallest p value by the 2 df test, the “index” SNP, was chosen to represent each locus for each trait. The stage 2 and Singapore analyses were conducted only for these index SNPs, and therefore no genomic control was applied to their analyses. In all stages of this investigation, family-based studies maintained independence between bins and applied analysis methods to account for correlations between family members in the same bin.
Harmonization of Subgroup-Specific Association Results
The association results were harmonized to ensure that the beta coefficients from different subgroups represented the effect of the same allele on the BP trait. Autosomal SNPs were aligned to the positive strand of HapMap release 22 via NCBI Build 36. The LiftOver utility mapped SNP coordinates between NCBI builds. We supplemented the quality control performed by the individual studies by excluding (1) genotyped SNPs called in fewer than 90% of participants or with Hardy-Weinberg p < 10−6 and (2) imputed SNPs with r2 < 0.3 (ratio of the empirically observed variance of the allele dosage to the expected binomial variance). We further excluded SNPs with fewer than 40 copies of the minor allele in any stage 1 subgroup or fewer than 20 copies in the stage 2 or Singapore subgroups.
Aggregate Analyses
Metaregression to Reveal SNP-Age Interactions
For each BP trait (SBP, DBP, MAP, and PP), we collected the estimated SNP effects and standard errors (multiplied by the square root of the genomic inflation factor) from the stage 1 subgroup analyses. We performed a metaregression of the SNP association coefficients onto an intercept and the median age of the subgroup (using PROC MIXED in SAS 9.1, SAS Institute). We let αi be the SNP main effect and agei be the median age of included individuals from the GWAS of the subgroup indexed by i. We fit the regression αi = β0 + β1∗agei + ei, where the errors, ei, were assumed to be independent and normally distributed with zero means and variances equal to that of the SNP coefficients from the subgroup-specific association analyses. The coefficient for the median age (β1) represented the change in the SNP effect with each year of age (the gene-age interaction) and the intercept (β0) represented the hypothetical SNP effect at age 0; the predicted SNP effect at a particular age was the addition of the intercept and the product of that age and the coefficient for age.
We performed a joint 2 degree of freedom (df) likelihood ratio test that there was no SNP main effect or SNP-age interaction (β0 = 0 and β1 = 0). We also performed a 1 df test of the SNP-age interaction (β1 = 0), although this test was used to gauge whether interaction was driving the 2 df test and whether the 1 df interaction test could enhance gene discovery efforts. After metaregression, we applied genomic control to the joint 2 df tests (λ varied between 1.07 and 1.09) and 1 df interaction tests (λ varied between 1.02 and 1.03); Figure S1 contains the quantile-quantile plots for the raw p values.
We identified all suggestive (5 × 10⁻⁸ < p ≤ 10−6) and significant (p ≤ 5 × 10⁻⁸) results from the joint 2 df tests for each trait and divided them into distinct loci based on regional plots that extended up to one megabase in each direction from the most-significantly associated SNP (r2 < 0.4 considered separate loci); we selected one index SNP (the most-significantly associated by the 2 df test) for each locus-trait combination and conducted separate metaregressions with the stage 2 subgroups. We then conducted a combined metaregression of all stage 1 and stage 2 subgroups for each index SNP-trait combination.
Main-Effects-Only Meta-analysis of Index SNPs
To determine whether the index SNP-trait associations would have been detected in a main-effects-only analysis, we conducted an inverse-variance weighted meta-analysis of SNP main effects by using the stage 1 and combined stages 1 and 2 subgroups (with SAS v.9.1). Genomic control was applied to the stage 1 meta-analysis results for each trait (λ varied between 1.10 and 1.17; see Figure S1) because the inflation factors were available. No genomic control adjustment was applied to the main-effects-only meta-analysis of stage 2 subgroups because we analyzed only the index SNPs.
Evaluating Significant Stage 1 and Combined Stages 1 and 2 Results in Singapore Subgroups
For each index SNP that achieved genome-wide significance in either the stage 1 or the combined stages 1 and 2 metaregression analyses, we conducted a joint 2 df test and a 1 df main-effects-only test using all Singapore subgroups. We performed both the main-effects-only and joint 2 df tests to evaluate potential differences in aging and interactions across populations. The age distributions in Singapore and stage 1 were similar (4.7% and 7.5% of participants were under 40 years of age, respectively, versus 21.9% of participants in stage 2), so we followed up significant SNPs from stage 1 even if they were not significant in the combined analysis with stage 2. Loci with main effects or linear gene-age interactions limited to those more than 40 years of age might be detected in the stage 1 and Singapore subgroups only. To maintain a 0.05 level of significance, a Bonferroni adjustment was applied for the two tests and the number of index SNPs chosen for that trait.
Secondary Within-Age Bins Meta-Analysis
We conducted an inverse-variance weighted meta-analysis of the SNP main effects separately within each age bin (i.e., meta-analysis using all subgroups in the 20–29 years age bin). We used the METAL software23 to perform the genome-wide meta-analysis in each age bin that contained two or more stage 1 studies. The 30–39 years age bin contained only one study, so five meta-analyses were conducted for each BP trait. Genomic control was applied after meta-analysis (λ varied between 1.00 and 1.045; see Table S17). Significant and suggestive associations from each meta-analysis were separated into loci (regions that were suggestive/significant were narrow and spanned <110 kilobases each). The index SNP chosen to represent each locus-trait association was followed up in a combined meta-analysis of all stage 1 and stage 2 subgroups from the corresponding age bin, as well as the Singapore subgroups. Because some replication bins used different age ranges, the median of the replication bin determined age bin membership. The TRAILS cohort was included in replication analyses for the 20- to 29-year-olds.
Results
Table 1 displays the age distribution of the subjects in each stage 1 and stage 2 study. The narrow age ranges in CARDIA, CHS, and TRAILS demonstrate the utility of the age bin approach; these studies would have contributed little information to the meta-analysis if we incorporated gene-age interactions into these study-level analysis even though they provided information on undersampled age groups. For the stage 1 meta-analysis of gene-age interactions, we analyzed 28 GWASs (one for each study and age bin subgroup) per trait representing 55,796 individuals of European ancestry. We then followed up the significant (p ≤ 5 × 10⁻⁸) and suggestive (5 × 10⁻⁸ < p ≤ 10−6) loci in a combined analysis of the stage 1 subgroups with 59 stage 2 subgroups comprised of 43,445 participants of European ancestry. A Singapore sample, which included 19 subgroups containing 8,682 Chinese, Indian, and Malay individuals, was used to assess the interethnic generalizability of significant findings. An overview of the primary results is provided in Figure 2.
Table 1.
Age Distribution of Each Stage 1 and Stage 2 Study
| Study |
Number of Individuals in Each Age Bin |
|||||
|---|---|---|---|---|---|---|
| 20–29 | 30–39 | 40–49 | 50–59 | 60–69 | 70–79 | |
| Stage 1 Metaregression: 28 GWASs with N = 55,796 | ||||||
| AGES | 1,260 | 1,603 | 265 | |||
| ARIC | 2,392 | 4,772 | 2,142 | |||
| CARDIA | 1,713 | |||||
| CHS | 1,230 | 1,672 | ||||
| FHS | 533 | 1,926 | 2,608 | 1,916 | 537 | |
| MESA | 342 | 708 | 726 | 563 | ||
| RS1 | 910 | 2,060 | 1,419 | |||
| RS II | 740 | 851 | 321 | |||
| WGHS | 7,219 | 10,386 | 4,271 | 711 | ||
| Total | 2,246 | 1,926 | 13,821 | 21,035 | 12,082 | 4,686 |
| Stage 2 Metaregression: 59 GWAS with N = 43,445 | ||||||
| BHS | 276 | 223 | 225 | 207 | 204 | |
| CoLaus | 534 | 1,437 | 1,334 | 1,195 | 443 | |
| EPIC | 442 | 775 | 819 | 371 | ||
| Fenland | 388 | 607 | 404 | |||
| KORA S3 | 191 | 984 | 419 | |||
| LifeLines | 393 | 1,576 | 3,039 | 1,893 | 899 | 288 |
| MIGen | 124 | 527 | 391 | 154 | ||
| NESDA | 340 | 361 | 424 | 422 | ||
| PREVEND | 853 | 980 | 820 | 650 | ||
| PROCARDIS | 649 | 2,399 | 3,362 | 640 | ||
| SardiNIA | 287 | 232 | 268 | 257 | 204 | |
| SHIP | 550 | 729 | 726 | 760 | 733 | 560 |
| SUVIMAX | 819 | 854 | ||||
| TRAILS CC | 266 | |||||
| TRAILS Pop | 1,290 | |||||
| YFS | 1,562 | 686 | ||||
| Total | 3,126 | 6,403 | 10,982 | 11,529 | 8,695 | 2,710 |
Age bins that encompassed more than one decade were assigned the bin containing their median age.
Figure 2.
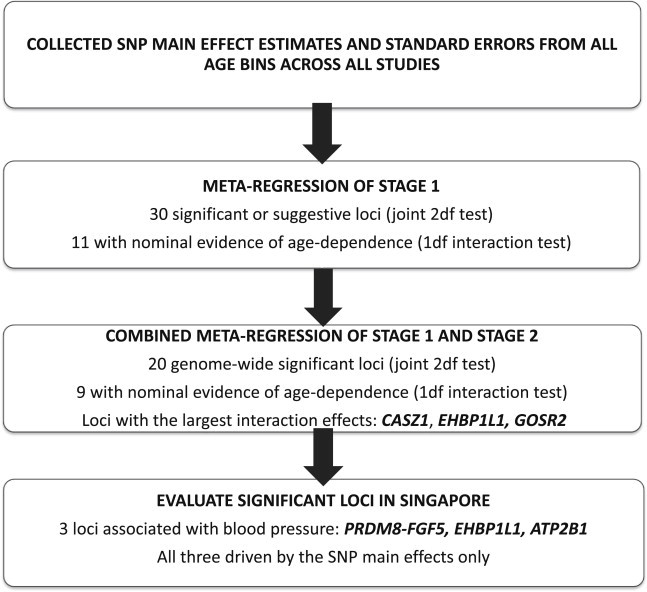
Overview of Results from Each Stage of the Primary Analysis
Metaregression of Blood Pressure onto Age: Identifying Linear Gene-Age Interactions
In the metaregression of stage 1 subgroups, 13 loci attained genome-wide significance and 17 loci exhibited suggestive evidence for at least one BP trait by a 2 df joint test of the SNP main effect and SNP-age interaction (see Tables S8, S9, S10, S11, and S12). Ten of these 30 loci were not reported in published GWAS results, including the Fer-1-like 5 (FER1L5) locus that achieved genome-wide significance. Eleven of the significant or suggestive loci demonstrated nominal (p ≤ 0.05) evidence of age dependency through the 1 df test of SNP-age interaction. For each trait, we selected an index SNP (most significantly associated by the 2 df test) to represent each significant or suggestive locus so that the stage 2 analyses could be conducted. A total of 63 index SNP-trait combinations were followed up across the 30 loci. A total of 20, 17, 22, and 4 SNPs were followed up for SBP, DBP, MAP, and PP, respectively (Figure S2 contains the regional association plots for the stage 1 analyses, created with LocusZoom24).
As shown in Table 2, 20 loci harbored index SNPs that were significant in the combined metaregression of stage 1 and stage 2. The strongest statistical evidence for interaction was provided by the EH domain binding protein 1-like 1 (EHBP1L1) locus associated with MAP (p = 2.9 × 10⁻⁷ for the 1 df interaction test); this locus was discovered only through the inclusion of the age interaction (Figure S2 contains the regional plot for this locus). Of the 20 loci that achieved genome-wide significance, 9 exhibited at least nominal (p ≤ 0.05) evidence of gene-age interactions (see Table 2). The index SNPs in CASZ1 (MIM 609895), EHBP1L1, and GOSR2 (MIM 604027) exhibited the largest modulation of BP effects by age (as shown by the magnitude of the interaction coefficients), with the coded alleles increasing their respective BP traits in young individuals but decreasing them in older individuals (see Figure 3). For these three loci, the estimated difference in SNP effects on the primary trait for 20-year-olds compared to 80-year-olds ranged from 1.17 mmHg to 1.58 mmHg. The age at which the variant changed direction of effect was ∼27 years for GOSR2, 33 (SBP) to 36 (MAP) years for CASZ1, and 41 (MAP) to 42 (DBP) years for EHBP1L1.
Table 2.
Significant Findings from the Combined Metaregression of Stage 1 and Stage 2 Subgroups
| SNP ID | Chr | Position (in basepairs) | Genomic Location | Primary Trait | Other Trait(s) | NS | N | Ref Freq | Ref All | p Value Main-Effects-Only Model |
Metaregression Model with SNP Main Effect and Age Interaction (2 df) |
|||||
|---|---|---|---|---|---|---|---|---|---|---|---|---|---|---|---|---|
| β0 | se(β0) | β1 | se(β1) | p Value of Interaction | p Value of 2 df Test | |||||||||||
| At Least Nominal Evidence (p < 0.05) of Interactions | ||||||||||||||||
| rs880315 | 1 | 10,719,453 | intron CASZ1 | SBP | MAP | 56 | 74,498 | 0.64 | T | 2.35 × 10⁻⁷ | 0.861 | 0.353 | −0.026 | 0.007 | 1.52 × 10⁻⁴ | 1.21 × 10⁻⁹∗ |
| rs6797587 | 3 | 48,172,618 | near 3′ CDC25A | MAP | DBPa | 87 | 99,189 | 0.68 | G | 4.69 × 10⁻¹¹∗ | 0.748 | 0.202 | −0.008 | 0.004 | 0.04 | 4.36 × 10⁻¹¹∗ |
| rs11099098 | 4 | 81,388,936 | intergenic (PRDM8-FGF5) | SBP | MAP | 81 | 96,217 | 0.29 | T | 2.85 × 10⁻¹³∗ | −0.199 | 0.335 | 0.016 | 0.007 | 0.02 | 1.56 × 10⁻¹³∗ |
| rs198846 | 6 | 26,215,442 | downstream HIST1H1T | DBP | MAPa | 87 | 99,207 | 0.84 | G | 1.78 × 10⁻¹³∗ | 0.088 | 0.250 | −0.011 | 0.005 | 0.03 | 1.48 × 10⁻¹³∗ |
| rs12705390 | 7 | 106,198,013 | intergenic (CCDC71L-PIK3CG) | PP | 87 | 99,094 | 0.78 | G | 1.08 × 10⁻¹²∗ | 0.281 | 0.264 | −0.014 | 0.005 | 0.006 | 2.42 × 10⁻¹³∗ | |
| rs7070797 | 10 | 63,221,779 | intergenic (C10orf107-ARID5B) | MAP | SBP, DBPa | 87 | 99,189 | 0.84 | G | 6.31 × 10⁻¹⁹∗ | 0.014 | 0.282 | 0.012 | 0.006 | 0.02 | 5.62 × 10⁻¹⁹∗ |
| rs4601790 | 11 | 65,110,482 | intron EHBP1L1 | MAP | DBP | 87 | 99,188 | 0.27 | G | 0.001 | 0.909 | 0.220 | −0.022 | 0.004 | 2.90 × 10⁻⁷ | 9.93 × 10⁻⁹∗ |
| rs11072518 | 15 | 73,021,663 | upstream COX5A | MAP | SBP, DBP | 87 | 99,189 | 0.36 | T | 3.91 × 10⁻²¹∗ | 0.973 | 0.192 | −0.010 | 0.004 | 0.006 | 1.11 × 10⁻²¹∗ |
| rs17608766 | 17 | 42,368,270 | intron or UTR 3′ of GOSR2 | PP | 86 | 97,437 | 0.84 | T | 5.62 × 10⁻⁹∗ | 0.524 | 0.322 | −0.019 | 0.006 | 0.003 | 4.49 × 10⁻¹⁰∗ | |
| Joint Test Driven by Main Effects Only | ||||||||||||||||
| rs7537765 | 1 | 11,809,890 | intron CLCN6 | MAP | SBPa, DBP | 87 | 99,181 | 0.16 | G | 1.66 × 10⁻¹⁹∗ | −0.957 | 0.249 | 0.008 | 0.005 | 0.12 | 5.58 × 10⁻¹⁹∗ |
| rs6707357 | 2 | 164,722,539 | intergenic (FIGN-GRB14) | SBP | 87 | 99,177 | 0.45 | T | 1.49 × 10⁻¹¹∗ | −0.634 | 0.268 | 0.004 | 0.005 | 0.50 | 1.03 × 10⁻¹⁰∗ | |
| rs7733138 | 5 | 157,807,971 | intergenic (nearest gene EBF1) | MAP | DBPa | 87 | 99,189 | 0.39 | T | 6.01 × 10⁻¹³∗ | 0.006 | 0.194 | −0.007 | 0.004 | 0.05 | 8.75 × 10⁻¹³∗ |
| rs4841569 | 8 | 11,489,586 | intergenic (BLK-GATA4) | SBP | MAP | 82 | 97,928 | 0.57 | G | 5.56 × 10⁻¹⁰∗ | 0.140 | 0.311 | 0.008 | 0.006 | 0.21 | 2.03 × 10⁻⁹∗ |
| rs1813353 | 10 | 18,747,454 | intron CACNB2 | MAP | SBP, DBP | 87 | 99,189 | 0.68 | T | 1.29 × 10⁻¹⁷∗ | 0.564 | 0.202 | −0.003 | 0.004 | 0.52 | 1.13 × 10⁻¹⁶∗ |
| rs11191454 | 10 | 104,649,994 | intron AS3MT | SBP | 84 | 97,234 | 0.08 | G | 6.50 × 10⁻¹²∗ | −0.320 | 0.484 | −0.011 | 0.010 | 0.25 | 2.98 × 10⁻¹¹∗ | |
| rs1801253 | 10 | 115,795,046 | missense ADRB1 | MAP | SBPa, DBP | 82 | 97,928 | 0.27 | G | 7.71 × 10⁻¹⁴∗ | −0.336 | 0.215 | −0.002 | 0.004 | 0.71 | 6.86 × 10⁻¹³∗ |
| rs381815 | 11 | 16,858,844 | intron PLEKHA7 | MAP | 87 | 99,189 | 0.25 | T | 3.31 × 10⁻⁹∗ | 0.028 | 0.217 | 0.006 | 0.004 | 0.16 | 9.26 × 10⁻⁹∗ | |
| rs2681472 | 12 | 88,533,090 | intron ATP2B1 | SBP | DBPa, MAP | 87 | 99,177 | 0.17 | G | 4.59 × 10⁻²³∗ | −0.483 | 0.348 | −0.008 | 0.007 | 0.24 | 2.84 × 10⁻²²∗ |
| rs3184504 | 12 | 110,368,991 | missense SH2B3 | MAP | SBP, DBPa | 87 | 99,187 | 0.48 | T | 1.17 × 10⁻²¹∗ | 0.325 | 0.186 | 0.003 | 0.004 | 0.47 | 1.09 × 10⁻²⁰∗ |
| rs260014 | 20 | 57,192,854 | upstream ZNF831 | MAP | SBPa, DBP | 82 | 97,941 | 0.85 | T | 1.50 × 10⁻¹¹∗ | −0.302 | 0.284 | −0.004 | 0.006 | 0.49 | 1.02 × 10⁻¹⁰∗ |
Abbreviations are as follows: Chr., chromosome; NS, number of study and age bin subgroups included in the analysis; N, number of participants represented by the analysis; Ref Freq, frequency of the coded allele; Ref All, the coded allele; se, standard error; SBP, systolic blood pressure; DBP, diastolic blood pressure; MAP, mean arterial pressure; PP, pulse pressure. The primary trait had the minimum p value for the joint 2 df test of the index SNP in that locus. The other traits column indicates nonprimary traits significantly associated with SNPs in this locus.
The index SNP for this trait differed from the index SNP for the primary trait (see Tables S8, S9, S10, S11, and S12). The p value main effect test was derived from the model containing only the SNP main effect (i.e., test that the intercept is zero). For the model containing the SNP main effect and age interaction, β0 is the theoretical SNP effect on blood pressure (in mmHg) at birth (age = 0) and β1 is the change in the SNP effect on blood pressure (in mmHg) per 1 year increase in age; the estimated SNP effect at a particular age was the addition of the intercept and the product of that age and the coefficient for age. Asterisks (∗) indicate values that achieve genome-wide significance.
Figure 3.
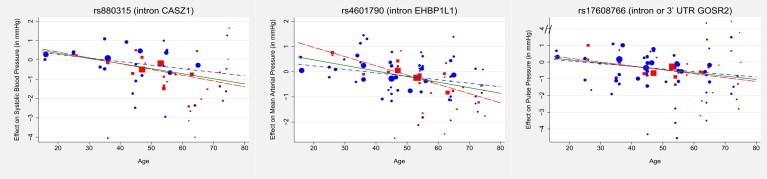
CASZ1, EHBP1L1, GOSR2, the Three Loci Exhibiting the Largest SNP-Age Interactions during the Combined Metaregression of Stage 1 and Stage 2 Subgroups
The figures display the SNP effect as a function of age. Study- and age bin-specific genetic effects from stage 1 and stage 2 are represented by red squares and blue circles, respectively, with the symbol size proportional to the inverse variance of the SNP main effect. The corresponding stage 1, stage 2, and combined consortia metaregressions are represented by red long-dashed, blue dashed-dotted, and green solid lines, respectively. The coded alleles of all three index SNPs are associated with increased blood pressure in the young but reduced blood pressure in the elderly.
As shown in Table S13, five loci (EHBP1L1, CASZ1, MAP4 [MIM 157132]-CDC25A [MIM 116947], CCDC71L-PIK3CG [MIM 601232], GOSR2) would have been missed by the two-stage main-effects-only meta-analysis but were captured by the two-stage joint 2 df tests. Four of these five loci (MAP4-CDC25A, CCDC71L-PIK3CG, EHBP1L1, GOSR2) lacked suggestive main effects in the stage 1 main-effects-only analysis and would not have been followed up in stage 2, and the CASZ1 locus would have been followed up but failed to achieve genome-wide significance in the combined stage 1 and stage 2 main-effects-only analysis.
In summary, the joint analysis of SNP main effects and SNP-age interactions by metaregression identified 20 genome-wide significant loci, 9 of which exhibited nominal gene-age interactions. Five loci, including the EHBP1L1 locus with the strongest statistical evidence of interaction, were missed when SNP-age interactions were excluded from the model.
Generalizability of Genome-wide Significant Associations to Singapore Subgroups
We examined the interethnic generalizability of the 47 index SNP-trait associations (from 22 loci) that achieved genome-wide significance in the metaregression of stage 1 subgroups only (AGT [MIM 106150] and FER1L5 loci) or in the metaregression of the combined stage 1 and stage 2 subgroups (the 20 loci in Table 2). We evaluated 13, 15, 17, and 2 SNPs for SBP, DBP, MAP, and PP, respectively; however, two SNPs were not available in the Singapore subgroups. Because of the potential differences in aging and interactions across ethnic populations, we performed the SNP main-effects-only test and the joint 2 df test in the meta-analysis of Chinese, Indian, and Malay subgroups from Singapore. After a Bonferroni correction for the planned number of SNPs tested per trait and the two tests performed, 2, 1, 2, and 0 SNPs met the significance threshold for SBP (p ≤ 1.92 × 10⁻³), DBP (p ≤ 1.67 × 10⁻³), MAP (p ≤ 1.47 × 10⁻³), and PP (p ≤ 0.0125), respectively, corresponding to three loci replicating an association for at least one BP trait. The Singapore subgroups confirmed an association between EHBP1L1 and DBP (main effects only p = 8.3 × 10⁻⁴), as well as the associations between SBP and MAP with the PRDM8-FGF5 (MIM 165190) and ATP2B1 (MIM 108731) loci.
As shown in Table S13, the index SNPs in CASZ1, CCDC71L-PIK3CG, EHBP1L1, and GOSR2, which were identified through the joint 2 df test in the primary analysis, had stronger evidence of main effects (p < 0.05) than interactions (tested with the joint 2 df test) in Singapore subgroups. The missense variant in FER1L5 that was significantly associated with DBP in the stage 1 analysis demonstrated nominal (p = 0.03) evidence of a main effect in the same direction in the meta-analysis of Singapore subgroups. In addition, an intronic variant (rs11741255) in C5orf56 that demonstrated suggestive evidence in the stage 1 analysis but that appeared to be driven by main effects achieved nominal (p = 0.04) evidence of a main effect in the same direction in the meta-analysis of the Singapore subgroups. The C5orf56 index SNP, only 6.1 kb away from interferon regulatory factor 1 (IRF1 [MIM 147575]), had a much larger effect size (2.28 mmHg versus 0.35 mmHg) and smaller minor allele frequency (0.02 versus 0.40) in Singapore subgroups than in stage 1 subgroups. Variants near or in C5orf56 have been associated with biomarkers and diseases of inflammation such as for fibrinogen,25,26 C-reactive protein,27 and Crohn disease.28,29
In summary, the Singapore samples confirm associations between BP and the EHBP1L1, PRDM8-FGF5, and ATP2B1 loci. Many of the loci found through age interactions in the populations of European descent exhibited stronger evidence of main effects in Singapore samples, indicating potential interethnic heterogeneity in age interactions.
Using the One Degree-of-Freedom Test to Detect Interactions
In the primary analysis, we used the 1 df interaction test to determine whether the associations identified by the joint 2 df test were driven by SNP main effects alone. To gauge the role of the 1 df interaction test in finding interaction loci, we repeated the two-stage metaregression analyses with the 1 df interaction test instead of the joint 2 df test. Only three loci exhibited significant (RAB31 [MIM 605694]) or suggestive (EHBP1L1 and PGBD4-KATNBL1) associations by the 1 df interaction test in the stage 1 analysis (see Tables S14, S15, and S16); the coded allele of SNP rs7233332 in an RAB31 intron was associated (p = 2.95 × 10⁻⁸) with a decrease in PP for individuals aged <49.5 years and an increase in PP thereafter. However, this significant association failed to replicate in the stage 2 or Singapore subgroups. None of these suggestive or significant loci achieved genome-wide significance for the 1 df interaction test using the combined stage 1 and stage 2 analysis (see Table S16). Thus, the 1 df interaction test failed to produce any novel or known replicated loci, underscoring the importance of the joint 2 df test for identifying gene-age interactions.
The Secondary Analysis: Exploring Age-Specific Genetic Effects
As a secondary analysis, we explored age-specific genetic effects by meta-analyzing the GWAS results (SNP main effects) within each age bin separately (e.g., 20- to 29-year-old subgroup only). The second age bin (30- to 39-year-olds) contained only one study in stage 1; therefore, five age-bin-specific meta-analyses were conducted per trait. A total of 22 distinct loci (31 SNP-trait combinations) were significantly or suggestively associated with BP traits in the stage 1 analyses, yielding, respectively, 9, 6, 12, and 4 loci for SBP, DBP, MAP, and PP (see Tables S18, S19, S20, S21, and S22). Each locus was significant or suggestive in only one age bin; it is unlikely that a single 10-year age bin will isolate the age-dependent effect, and therefore the lack of a supportive pattern in adjacent bins may indicate a false positive or may be due to statistical issues (such as the lack of data for a meta-analysis in the adjacent 30- to 39-year age bin, differences in sample sizes between bins, or differences in study composition between age bins [such as the CARDIA study, which is present only in the youngest age bin]). In total, we identified six loci in the 20–29 years age bin (N ≈ 2,200), five loci in the 40–49 years age bin (N ≈ 13,800), six loci in the 50–59 years age bins (N ≈ 21,000), four loci in the 60–69 years age bin (N ≈ 12,100), and one locus in the 70–79 years age bin (N = 3,014). Thirteen of these loci (see Table 3), including all six in the youngest age bin and the lone finding in the oldest age bin, lacked strong evidence in the literature and failed to achieve even suggestive associations in the main-effects-only meta-analyses and SNP-age metaregressions using all age bins. This demonstrates the importance and promise of meta-analysis across cohorts within age bins. In the 20- to 29-year-olds, a SNP (rs16833934) in a locus near microRNA 1263 (MIR1263) was significantly (p = 1.39 × 10⁻⁸) associated with a 1.63 mmHg reduction of DBP per copy of the G allele.
Table 3.
Selected Significant and Suggestive Findings from the Within-Age-Bin Meta-analysis of Stage 1 Subgroups
| Age Bin | rs Number (NCBI 36) | Chr. | Position | Genomic Location | Ref Allele | Trait | No. Studies | N | All Freq | β (in mmHg) | se (β) | λ | p Value | Direction of Effects |
|---|---|---|---|---|---|---|---|---|---|---|---|---|---|---|
| 20–29 | rs16833934 | 3 | 165,219,944 | intergenic near MIR1263 | G | DBP | 2 | 2,242 | 0.26 | −1.63 | 0.29 | 1.00 | 1.39 × 10⁻⁸∗ | - - |
| MAP | 2 | 2,241 | 0.26 | −1.33 | 0.27 | 1.02 | 7.12 × 10⁻⁷ | - - | ||||||
| rs12195230 | 6 | 97,606,768 | intron KLHL32 | G | SBP | 2 | 2,246 | 0.75 | 1.79 | 0.35 | 1.01 | 4.60 × 10⁻⁷ | ++ | |
| rs12195036 | 6 | 166,371,687 | near LINC00602 | T | MAP | 2 | 2,241 | 0.95 | −3.11 | 0.61 | 1.02 | 5.04 × 10⁻⁷ | - - | |
| rs2702888 | 8 | 6,752,442 | DEFB1-DEFA6 | G | PP | 2 | 2,242 | 0.65 | −1.36 | 0.27 | 1.00 | 3.87 × 10⁻⁷ | - - | |
| rs2196122 | 11 | 4,842,124 | OR51H1P-OR51H2P | G | SBP | 2 | 2,246 | 0.84 | 1.91 | 0.38 | 1.01 | 7.20 × 10⁻⁷ | ++ | |
| rs10143078 | 14 | 69,951,242 | intron SYNJ2BP | C | SBP | 2 | 2,246 | 0.04 | −4.06 | 0.81 | 1.01 | 5.93 × 10⁻⁷ | - - | |
| 40–49 | rs825937 | 2 | 4,785,902 | near LINC01249 | C | PP | 5 | 13,810 | 0.83 | 0.83 | 0.16 | 1.01 | 2.32 × 10⁻⁷ | +++++ |
| rs11816631 | 10 | 99,552,562 | SFRP5-GOLGA7B | G | PP | 3 | 9,946 | 0.06 | 1.99 | 0.39 | 1.01 | 2.95 × 10⁻⁷ | +++ | |
| 50–59 | rs3118867 | 9 | 89,451,515 | intron DAPK1 | G | DBP | 7 | 21,033 | 0.47 | −0.49 | 0.09 | 1.05 | 3.87 × 10⁻⁷ | - - - - - - - |
| MAP | 7 | 21,035 | 0.47 | −0.55 | 0.11 | 1.04 | 4.12 × 10⁻⁷ | - - - - - - - | ||||||
| 60–69 | rs4638749 | 2 | 108,250,474 | downstream SULT1C3 | G | DBP | 8 | 12,082 | 0.76 | −0.81 | 0.16 | 1.03 | 6.13 × 10⁻⁷ | +- - - - - - - |
| rs4841895 | 9 | 136,563,863 | RXRA-COL5A1 | G | MAP | 8 | 12,082 | 0.65 | 0.81 | 0.16 | 1.02 | 7.62 × 10⁻⁷ | ++++++++ | |
| rs747685 | 17 | 721,801 | intron NXN | T | MAP | 8 | 12,082 | 0.86 | 1.50 | 0.30 | 1.02 | 6.32 × 10⁻⁷ | ++++++++ | |
| rs747687 | 17 | 722,084 | intron NXN | G | DBP | 8 | 12,082 | 0.86 | 1.37 | 0.26 | 1.03 | 1.50 × 10⁻⁷ | ++++++++ | |
| 70–79 | rs603788 | 10 | 78,881,268 | intron KCNMA1 | G | DBP | 4 | 3,014 | 0.50 | 1.73 | 0.35 | 1.00 | 9.37 × 10⁻⁷ | ++++ |
| MAP | 4 | 3,014 | 0.50 | 2.08 | 0.42 | 1.01 | 8.84 × 10⁻⁷ | ++++ |
Abbreviations are as follows: Chr, chromosome; Ref Allele, coded allele; N, number of participants meta-analyzed in the age bin; All Freq, coded allele frequency; β, effect of each copy of the coded allele on blood pressure; se(β), standard error of the β; λ, genomic inflation factor in that age bin. Age bins 1 through 6 comprised individuals 20 to 29 years old and subsequently in 10 year increments. Asterisk (∗) indicates value achieves the p ≤ 5 × 10⁻⁸ threshold for significance.
Although none of the index SNPs from the 13 loci listed in Table 3 were significant in the combined stage 1 and stage 2 analysis (see Table S22), the significant association near the microRNA in the young is biological plausibile because microRNAs can change gene expression during aging.30 Four known loci (FIGN [MIM 605295]-GRB14 [MIM 601524], PRDM8-FGF5, AS3MT [MIM 611806], POC1B [MIM 614784]-ATP2B1) achieved genome-wide significance during the stage 1 or combined stage 1 and stage 2 within-age bins analysis; these loci had decent stage 1 (N ≈ 14,000 to 21,000) and stage 2 (N ≈ 11,000) sample sizes, were associated with BP in the 40–49 or 50–59 years age strata, and were implicated in the main effects meta-analyses with all age bins.
In summary, age-specific genetic effects can influence BP and designing studies to leverage age specificity, particularly in the young, may enhance gene-discovery efforts.
Discussion
Identifying gene-environment interactions that influence common complex traits and diseases is an arduous task. Linkage and candidate gene studies indicate the presence of environment-dependent genetic effects, yet few have been identified through published genome-wide interaction studies.31–45 The complex genetic and environmental architecture underlying blood pressure is no exception. Even though previous epidemiological studies suggest age-dependent effects, we identified 20 loci for BP in the analysis of 99,241 participants of European descent (N = 55,796 in stage 1 and N = 43,445 in stage 2), 9 of which exhibited nominal evidence of gene-age interactions. Index SNPs in CASZ1, EHBP1L1, and GOSR2 exhibited the largest gene-age interactions, with the coded alleles increasing BP traits in the young and decreasing them in the old. The effect of each of these SNPs on a BP trait may change by as much as 1.58 mmHg over 60 years.
The EHBP1L1 locus demonstrated the most compelling evidence for gene-age interactions: it exhibited no appreciable main effects and its discovery depended on the inclusion of gene-age interactions. A missense variant (rs6591182) in EHBP1L1 was suggestively associated with lobular inflammation in women with nonalcoholic fatty liver disease;46 this variant was 4,150 basepairs from our index SNP but was in low linkage disequilibrium (r2 = 0.315). Our index SNP (rs4601790) was associated with the expression of the small ubiquitin-like modifier-1 (SUMO1 [MIM 601912]; p = 4 × 10⁻⁵) in HapMap CEU samples,47 which causes posttranslational modifications in proteins influencing apoptosis, gene transcription, and protein stability. SUMO-1 negatively regulates reactive oxygen species production from NADPH oxidases in human vascular smooth muscle cells;48 the overproduction of reactive oxygen species has been implicated in cardiovascular and age-related disease.48 Other potential BP effectors near the EHBP1L1 index SNP include potassium channel subfamily K member 7 (KCNK7 [MIM 603940]), mitogen-activated protein kinase 11 (MAP3K11 [MIM 600050] is a positive regulator of JNK signaling pathway), and microRNA 4690 (MIR4690).
Several biological phenomena could contribute to gene-age interactions. For example, intracellular levels of cyclic adenosine monophosphate (cAMP) may connect aging and the effect of the known CASZ1 locus on BP. Basal levels of cAMP may vary by age49 and changes in intracellular cAMP may alter CASZ1b and CASZ1a mRNA levels.50 These CASZ1 isoforms encode zinc finger transcription factors involved in cell survival and tumor suppression.50 After tetracycline induction of CASZ1 in neuroblastoma cell lines, 125 genes experienced expression level changes ≥1.5-fold, including the potential BP effectors tyrosine hydroxylase (MIM 191290; catalyzes the rate-limiting step in the synthesis of catecholamines), dopamine beta-hydroxylase (MIM 609312), angiotensin II receptor type 1 (MIM 106165), and endothelin receptor type A (MIM 131243).51 Thus, the dynamic nature of gene expression and posttranslational protein modification could contribute to gene-age interactions.8,9,52 A lifetime of behavioral and environmental exposures can trigger epigenetic mechanisms, such as DNA methylation, histone modification, and microRNA expression, causing changes in gene expression during aging.30 Increased generation of reactive oxygen species and oxidative damage with age may mediate the accumulation of posttranslational modifications to proteins, thereby causing aging and age-related diseases like hypertension.53 Changes in the cardiovascular environment, such as the increased vascular stiffness that often accompanies aging, may result in enhanced or muted genetic effects on BP. This is clinically relevant because different treatment strategies might be warranted at different ages if the mechanisms of BP regulation vary across the age spectrum.
We gleaned several important lessons from this investigation. First, the two loci that were significantly associated with PP (CCDC71L-PIK3CG and GOSR2) lacked corroboration from any other trait, indicating that the PP association might be independent of SBP and DBP. Second, careful sample selection might balance the need for massive sample sizes. The <30-year-old age bin yielded six significant or suggestive loci using ≈2,240 individuals from two studies; these loci were not detected in the metaregression or main effects meta-analysis using all age bins. Young-onset hypertension is postulated to have a stronger genetic basis than older-onset hypertension54 because the latter may be modulated by the accumulation of behavioral and lifetime exposures. We can reduce the sample size by recruiting individuals at the age when the genetic effect is the strongest55 or by analyzing longitudinal (repeated-measures) data. The latter increases the probability that participants are examined at the age of largest genetic effect for the largest number of variants while providing stronger evidence of causation6 and further insight into the landscape of hypertension genetics over an individual’s lifespan. An alternate explanation for the discovery of significant loci in the <30-year-olds, which also supports careful sample selection, is a more accurate phenotype due to less confounding by antihypertensive medications; frequent use of antihypertensives may have masked putative associations in the older age groups. The third lesson we learned was that genetic replication may depend on the age distribution of the replication sample if gene-age interactions are present. The utilization of the main-effects and interaction tests may help remedy the nonreplication of genetic findings across samples and ethnicities.5 Our EHBP1L1 locus, identified only through gene-age interactions using individuals of European ancestry, replicated using main effects only in Singapore subgroups. In addition, three of the four known loci discovered only through gene-age interactions using cohorts of European ancestry had stronger evidence of main effects in Singapore subgroups, perhaps due to the limited age range of the latter (three of the four Singapore studies contained only individuals over 40 years old). Gene-age interactions coupled with different age distributions might contribute to the observed interethnic heterogeneity of BP loci.
The age bin approach we used has some advantages compared to the standard practice (meta-analysis of study-specific GWASs that adjust for age only through simple covariate adjustments). We adjusted for body mass index (BMI), gender, age, age-squared, and field center in the GWAS conducted within each age bin; the possibility of these coefficients varying across age bins contrasts with traditional unstratified GWAS where the same adjustment is applied for each covariate across all age bins. Because the effect of BMI, gender, and the SNP may differ by age, adjustments applied within each bin might produce more accurate estimates of all the covariate effects, thus potentially amplifying the SNP effects. Furthermore, the metaregression of the age-bin results made it possible to include all studies for investigating gene-age interactions, even those like CARDIA with a narrow age range (17- to 32-year-olds) that contribute little information otherwise (when gene-age interactions are incorporated into the study-specific analysis).
A drawback is that our age bin method required a larger computational and data management burden than the standard approach. The standard approach would have required nine GWASs per trait in the stage 1 analysis, whereas we analyzed 28 GWASs per trait. We also managed an additional 78 files per trait for the stage 2 and the Singapore analyses, bringing our total data management burden to 106 files per trait (in total, we analyzed 424 files for the 4 BP traits instead of 120 if we did not use the age bin approach, a 3.5-fold increase in the data management burden). Because many studies have unstratified GWAS results available for common traits like SBP and DBP, reanalysis using age bins may have deterred study participation. Our sample size was also slightly reduced compared to the standard approach. We omitted individuals in age bins with insufficient sample sizes (<250 for stage 1 samples and <124 for stage 2 samples) and, in order to maintain independence across age bins, included family members from only one age bin. This reduced the sample size and hence reduced the power; this, coupled with fitting an extra parameter to the model for the interaction, may explain why we missed some of the known BP-associated loci. Similarly, a few stage 2 studies combined adjacent age bins to achieve the threshold sample size for analysis. The estimated SNP effect at the median age in these wide and sparse age bins may have greater error, impacting our ability to detect gene-age interactions in the metaregression and secondary meta-analyses.
Our analysis was predicated on several assumptions. The within-age-bin meta-analyses indicated that our assumption of linear interactions and additive main effects may not be valid. We may need to expand the toolbox of methods and develop new statistical models to properly capture complex gene-age interactions.52 We made the implicit assumption of a strong correlation between biological and chronological age;56 this correlation may differ across individuals and populations, and age may be a very different construct due to disparities in environment and lifestyle. For example, an association identified in 30- to 40-year-olds in one population may manifest in 50- to 60-year-olds in another population. There may even be heterogenity of aging within a population; conditions such as metabolic syndrome may be associated with premature vascular stiffness and biological aging. We assumed that the same covariates were important in all age strata. Because BP levels are often modulated by various diseases in the elderly, different covariate adjustments may enhance our ability to explain the genetic variability in the older age groups. We decided a priori to use a fixed-effects metaregression model that ignored any heterogeneity in SNP effects not due to age. We ignored heterogeneity due to other population attributes and assumed that there was one true SNP effect at each age (the fixed effects model) rather than a distribution of true SNP effects at each age (the random effects model).
There were some additional limitations to our analysis. The method we used to infer the underlying BP in treated participants ignored the number, dose, and type of antihypertensive medications taken and might not accurately impute the blood pressure, particularly in resistant individuals or those on multiple medications. There were also differences in genotyping and reference panels for imputation across the studies and we restricted analysis to the index SNPs in the Singapore studies. Given that the allele frequencies and linkage disequilibrium patterns may differ across populations, this might hinder our ability to find these gene-age interactions in Singapore samples. Although BP physiology may be different in the female and male lifecourse due to hormonal regulation and menopause, we ignored sex-specific gene-age interactions.6 Although important, stratifying by age bin and sex would have resulted in GWASs of inadequate sample sizes for many of the studies included in this investigation and lower statistical power. Two of the studies, CARDIA (stage 1) and TRAILS (stage 2), were designed to study young adults and adolescents, respectively, and contributed individuals under age 20; the inclusion of these young participants did not drive the significance of loci identified by the 2 df test because these were still significant for at least one trait when both studies were omitted from the analysis. Lastly, and importantly, this study was designed as a two-staged discovery; all promising gene-age interactions observed require replication in additional large independent samples with a diverse range of ages.
We report nine BP-associated loci whose effects might be age dependent, including the EHBP1L1 locus, which exhibited the strongest statistical evidence of interaction and was discovered only through the inclusion of gene-age interactions. Our results highlight the context-dependent nature of genetic effects and demonstrate that modeling age-dependent effects can enhance our understanding of the temporal regulation of known genes and identify additional genes influencing intraindividual variation in complex traits like BP.
Consortia
The members of the LifeLines Cohort Study are Behrooz Z. Alizadeh, Rudolf A. de Boer, H. Marike Boezen, Marcel Bruinenberg, Lude Franke, Pim van der Harst, Hans L. Hillege, Melanie M. van der Klauw, Gerjan Navis, Johan Ormel, Dirkje S. Postma, Judith G.M. Rosmalen, Joris P. Slaets, Harold Snieder, Ronald P. Stolk, Bruce H.R. Wolffenbuttel, and Cisca Wijmenga.
Acknowledgments
B.M.P. served on a data and safety monitoring board for a clinical trial (Zoll LifeCor) and a steering committee for the Yale Open Data Access Project funded by Medtronic. P.M.R. received a grant from Amgen (>$10,000) for genotyping the WGHS. A.C. is on the Science Advisory Board of Affymetrix and Biogen Idec.
Contributor Information
Jeannette Simino, Email: jeannette@wubios.wustl.edu.
Aravinda Chakravarti, Email: aravinda@jhmi.edu.
LifeLines Cohort Study:
Behrooz Z. Alizadeh, Rudolf A. de Boer, H. Marike Boezen, Marcel Bruinenberg, Lude Franke, Pim van der Harst, Hans L. Hillege, Melanie M. van der Klauw, Gerjan Navis, Johan Ormel, Dirkje S. Postma, Judith G.M. Rosmalen, Joris P. Slaets, Harold Snieder, Ronald P. Stolk, Bruce H.R. Wolffenbuttel, and Cisca Wijmenga
Supplemental Data
Web Resources
The URLs for data presented herein are as follows:
HUGO Gene Nomenclature Committee, http://www.genenames.org/
International HapMap Project, http://hapmap.ncbi.nlm.nih.gov/
Lift Genome Annotations, http://genome.ucsc.edu/cgi-bin/hgLiftOver
LocusZoom, http://csg.sph.umich.edu/locuszoom/
Online Mendelian Inheritance in Man (OMIM), http://www.omim.org/
SCAN: SNP and CNV Annotation Database, http://www.scandb.org/newinterface/about.html
SNAP Pairwise LD, http://www.broadinstitute.org/mpg/snap/ldsearchpw.php
UCSC Genome Browser, http://genome.ucsc.edu
Note Added in Proof
Since this manuscript was submitted, a gene-centric meta-analysis of more than 150,000 individuals of European descent identified a BP-associated SNP near (55 kb away; r2 = 0.47) our finding in EHBP1L1. The variant identified by Tragante et al. exhibited main effects, whereas our SNP exhibited only gene-age interactions.
Tragante, V., Barnes, M.R., Ganesh, S.K., Lanktree, M.B., Guo, W., Franceschini, N., Smith, E.N., Johnson, T., Holmes, M.V., Padmanabhan, S., et al. (2014). Gene-centric meta-analysis in 87,736 individuals of European ancestry identifies multiple blood-pressure-related loci. Am. J. Hum. Genet. 94, 349–360.
References
- 1.North B.J., Sinclair D.A. The intersection between aging and cardiovascular disease. Circ. Res. 2012;110:1097–1108. doi: 10.1161/CIRCRESAHA.111.246876. [DOI] [PMC free article] [PubMed] [Google Scholar]
- 2.Tambs K., Eaves L.J., Moum T., Holmen J., Neale M.C., Naess S., Lund-Larsen P.G. Age-specific genetic effects for blood pressure. Hypertension. 1993;22:789–795. doi: 10.1161/01.hyp.22.5.789. [DOI] [PubMed] [Google Scholar]
- 3.Wang X., Snieder H. Familial aggregation of blood pressure. In: Flynn J.T., editor. Clinical Hypertension and Vascular DIseases: Pediatric Hypertension. Springer Science+Business Media LLC; New York: 2011. pp. 241–258. [Google Scholar]
- 4.Havlik R.J., Garrison R.J., Feinleib M., Kannel W.B., Castelli W.P., McNamara P.M. Blood pressure aggregation in families. Am. J. Epidemiol. 1979;110:304–312. doi: 10.1093/oxfordjournals.aje.a112815. [DOI] [PubMed] [Google Scholar]
- 5.Shi G., Gu C.C., Kraja A.T., Arnett D.K., Myers R.H., Pankow J.S., Hunt S.C., Rao D.C. Genetic effect on blood pressure is modulated by age: the Hypertension Genetic Epidemiology Network Study. Hypertension. 2009;53:35–41. doi: 10.1161/HYPERTENSIONAHA.108.120071. [DOI] [PMC free article] [PubMed] [Google Scholar]
- 6.Takeuchi F., Isono M., Katsuya T., Yamamoto K., Yokota M., Sugiyama T., Nabika T., Fujioka A., Ohnaka K., Asano H. Blood pressure and hypertension are associated with 7 loci in the Japanese population. Circulation. 2010;121:2302–2309. doi: 10.1161/CIRCULATIONAHA.109.904664. [DOI] [PubMed] [Google Scholar]
- 7.Bao X., Mills P.J., Rana B.K., Dimsdale J.E., Schork N.J., Smith D.W., Rao F., Milic M., O’Connor D.T., Ziegler M.G. Interactive effects of common beta2-adrenoceptor haplotypes and age on susceptibility to hypertension and receptor function. Hypertension. 2005;46:301–307. doi: 10.1161/01.HYP.0000175842.19266.95. [DOI] [PubMed] [Google Scholar]
- 8.Strazzullo P., Iacone R., Siani A., Cappuccio F.P., Russo O., Barba G., Barbato A., D’Elia L., Trevisan M., Farinaro E. Relationship of the Trp64Arg polymorphism of the beta3-adrenoceptor gene to central adiposity and high blood pressure: interaction with age. Cross-sectional and longitudinal findings of the Olivetti Prospective Heart Study. J. Hypertens. 2001;19:399–406. doi: 10.1097/00004872-200103000-00007. [DOI] [PubMed] [Google Scholar]
- 9.Jin H.S., Sober S., Hong K.W., Org E., Kim B.Y., Laan M., Oh B., Jeong S.Y. Age-dependent association of the polymorphisms in the mitochondria-shaping gene, OPA1, with blood pressure and hypertension in Korean population. Am. J. Hypertens. 2011;24:1127–1135. doi: 10.1038/ajh.2011.131. [DOI] [PubMed] [Google Scholar]
- 10.Bhatnagar V., Liu L., Nievergelt C.M., Richard E., Brophy V.H., Pandey B., Lipkowitz M.S., O’Connor D.T. Paraoxonase 1 (PON1) C/T-108 association with longitudinal mean arterial blood pressure. Am. J. Hypertens. 2012;25:1188–1194. doi: 10.1038/ajh.2012.106. [DOI] [PMC free article] [PubMed] [Google Scholar]
- 11.Newton-Cheh C., Johnson T., Gateva V., Tobin M.D., Bochud M., Coin L., Najjar S.S., Zhao J.H., Heath S.C., Eyheramendy S., Wellcome Trust Case Control Consortium Genome-wide association study identifies eight loci associated with blood pressure. Nat. Genet. 2009;41:666–676. doi: 10.1038/ng.361. [DOI] [PMC free article] [PubMed] [Google Scholar]
- 12.Levy D., Ehret G.B., Rice K., Verwoert G.C., Launer L.J., Dehghan A., Glazer N.L., Morrison A.C., Johnson A.D., Aspelund T. Genome-wide association study of blood pressure and hypertension. Nat. Genet. 2009;41:677–687. doi: 10.1038/ng.384. [DOI] [PMC free article] [PubMed] [Google Scholar]
- 13.Kato N., Takeuchi F., Tabara Y., Kelly T.N., Go M.J., Sim X., Tay W.T., Chen C.H., Zhang Y., Yamamoto K. Meta-analysis of genome-wide association studies identifies common variants associated with blood pressure variation in east Asians. Nat. Genet. 2011;43:531–538. doi: 10.1038/ng.834. [DOI] [PMC free article] [PubMed] [Google Scholar]
- 14.Wain L.V., Verwoert G.C., O’Reilly P.F., Shi G., Johnson T., Johnson A.D., Bochud M., Rice K.M., Henneman P., Smith A.V., LifeLines Cohort Study. EchoGen consortium. AortaGen Consortium. CHARGE Consortium Heart Failure Working Group. KidneyGen consortium. CKDGen consortium. Cardiogenics consortium. CardioGram Genome-wide association study identifies six new loci influencing pulse pressure and mean arterial pressure. Nat. Genet. 2011;43:1005–1011. doi: 10.1038/ng.922. [DOI] [PMC free article] [PubMed] [Google Scholar]
- 15.Ehret G.B., Munroe P.B., Rice K.M., Bochud M., Johnson A.D., Chasman D.I., Smith A.V., Tobin M.D., Verwoert G.C., Hwang S.J., International Consortium for Blood Pressure Genome-Wide Association Studies. CARDIoGRAM consortium. CKDGen Consortium. KidneyGen Consortium. EchoGen consortium. CHARGE-HF consortium Genetic variants in novel pathways influence blood pressure and cardiovascular disease risk. Nature. 2011;478:103–109. doi: 10.1038/nature10405. [DOI] [PMC free article] [PubMed] [Google Scholar]
- 16.Fox E.R., Young J.H., Li Y., Dreisbach A.W., Keating B.J., Musani S.K., Liu K., Morrison A.C., Ganesh S., Kutlar A., International Consortium for Blood Pressure Genome-wide Association Studies (ICBP-GWAS) Association of genetic variation with systolic and diastolic blood pressure among African Americans: the Candidate Gene Association Resource study. Hum. Mol. Genet. 2011;20:2273–2284. doi: 10.1093/hmg/ddr092. [DOI] [PMC free article] [PubMed] [Google Scholar]
- 17.Flynn J.T., Ingelfinger J.R., Portman R.J. Humana Press; New York: 2011. Pediatric Hypertension. [Google Scholar]
- 18.Cui J.S., Hopper J.L., Harrap S.B. Antihypertensive treatments obscure familial contributions to blood pressure variation. Hypertension. 2003;41:207–210. doi: 10.1161/01.hyp.0000044938.94050.e3. [DOI] [PubMed] [Google Scholar]
- 19.Tobin M.D., Sheehan N.A., Scurrah K.J., Burton P.R. Adjusting for treatment effects in studies of quantitative traits: antihypertensive therapy and systolic blood pressure. Stat. Med. 2005;24:2911–2935. doi: 10.1002/sim.2165. [DOI] [PubMed] [Google Scholar]
- 20.Franklin S.S., Gustin W., 4th, Wong N.D., Larson M.G., Weber M.A., Kannel W.B., Levy D. Hemodynamic patterns of age-related changes in blood pressure. The Framingham Heart Study. Circulation. 1997;96:308–315. doi: 10.1161/01.cir.96.1.308. [DOI] [PubMed] [Google Scholar]
- 21.Landahl S., Bengtsson C., Sigurdsson J.A., Svanborg A., Svärdsudd K. Age-related changes in blood pressure. Hypertension. 1986;8:1044–1049. doi: 10.1161/01.hyp.8.11.1044. [DOI] [PubMed] [Google Scholar]
- 22.Pearson J.D., Morrell C.H., Brant L.J., Landis P.K., Fleg J.L. Age-associated changes in blood pressure in a longitudinal study of healthy men and women. J. Gerontol. A Biol. Sci. Med. Sci. 1997;52:M177–M183. doi: 10.1093/gerona/52a.3.m177. [DOI] [PubMed] [Google Scholar]
- 23.Willer C.J., Li Y., Abecasis G.R. METAL: fast and efficient meta-analysis of genomewide association scans. Bioinformatics. 2010;26:2190–2191. doi: 10.1093/bioinformatics/btq340. [DOI] [PMC free article] [PubMed] [Google Scholar]
- 24.Pruim R.J., Welch R.P., Sanna S., Teslovich T.M., Chines P.S., Gliedt T.P., Boehnke M., Abecasis G.R., Willer C.J. LocusZoom: regional visualization of genome-wide association scan results. Bioinformatics. 2010;26:2336–2337. doi: 10.1093/bioinformatics/btq419. [DOI] [PMC free article] [PubMed] [Google Scholar]
- 25.Dehghan A., Yang Q., Peters A., Basu S., Bis J.C., Rudnicka A.R., Kavousi M., Chen M.H., Baumert J., Lowe G.D., Wellcome Trust Case Control Consortium Association of novel genetic Loci with circulating fibrinogen levels: a genome-wide association study in 6 population-based cohorts. Circ Cardiovasc Genet. 2009;2:125–133. doi: 10.1161/CIRCGENETICS.108.825224. [DOI] [PMC free article] [PubMed] [Google Scholar]
- 26.Danik J.S., Paré G., Chasman D.I., Zee R.Y., Kwiatkowski D.J., Parker A., Miletich J.P., Ridker P.M. Novel loci, including those related to Crohn disease, psoriasis, and inflammation, identified in a genome-wide association study of fibrinogen in 17 686 women: the Women’s Genome Health Study. Circ Cardiovasc Genet. 2009;2:134–141. doi: 10.1161/CIRCGENETICS.108.825273. [DOI] [PMC free article] [PubMed] [Google Scholar]
- 27.Dehghan A., Dupuis J., Barbalic M., Bis J.C., Eiriksdottir G., Lu C., Pellikka N., Wallaschofski H., Kettunen J., Henneman P. Meta-analysis of genome-wide association studies in >80 000 subjects identifies multiple loci for C-reactive protein levels. Circulation. 2011;123:731–738. doi: 10.1161/CIRCULATIONAHA.110.948570. [DOI] [PMC free article] [PubMed] [Google Scholar]
- 28.Franke A., McGovern D.P., Barrett J.C., Wang K., Radford-Smith G.L., Ahmad T., Lees C.W., Balschun T., Lee J., Roberts R. Genome-wide meta-analysis increases to 71 the number of confirmed Crohn’s disease susceptibility loci. Nat. Genet. 2010;42:1118–1125. doi: 10.1038/ng.717. [DOI] [PMC free article] [PubMed] [Google Scholar]
- 29.Barrett J.C., Hansoul S., Nicolae D.L., Cho J.H., Duerr R.H., Rioux J.D., Brant S.R., Silverberg M.S., Taylor K.D., Barmada M.M., NIDDK IBD Genetics Consortium. Belgian-French IBD Consortium. Wellcome Trust Case Control Consortium Genome-wide association defines more than 30 distinct susceptibility loci for Crohn’s disease. Nat. Genet. 2008;40:955–962. doi: 10.1038/NG.175. [DOI] [PMC free article] [PubMed] [Google Scholar]
- 30.Berdasco M., Esteller M. Hot topics in epigenetic mechanisms of aging: 2011. Aging Cell. 2012;11:181–186. doi: 10.1111/j.1474-9726.2012.00806.x. [DOI] [PMC free article] [PubMed] [Google Scholar]
- 31.Basson J., Sung Y.J., Schwander K., Kume R., Simino J., de las Fuentes L., Rao D. Gene-education interactions identify novel blood pressure loci in the Framingham Heart Study. Am. J. Hypertens. 2014;27:431–444. doi: 10.1093/ajh/hpt283. [DOI] [PMC free article] [PubMed] [Google Scholar]
- 32.Simino J., Sung Y.J., Kume R., Schwander K., Rao D.C. Gene-alcohol interactions identify several novel blood pressure loci including a promising locus near SLC16A9. Front. Genet. 2013;4:277. doi: 10.3389/fgene.2013.00277. [DOI] [PMC free article] [PubMed] [Google Scholar]
- 33.Figueroa J.D., Han S.S., Garcia-Closas M., Baris D., Jacobs E.J., Kogevinas M., Schwenn M., Malats N., Johnson A., Purdue M.P. Genome-wide interaction study of smoking and bladder cancer risk. Carcinogenesis. 2014 doi: 10.1093/carcin/bgu064. Published online March 24, 2014. [DOI] [PMC free article] [PubMed] [Google Scholar]
- 34.Zhang R., Chu M., Zhao Y., Wu C., Guo H., Shi Y., Dai J., Wei Y., Jin G., Ma H. A genome-wide gene-environment interaction analysis for tobacco smoke and lung cancer susceptibility. Carcinogenesis. 2014 doi: 10.1093/carcin/bgu076. Published online March 22, 2014. [DOI] [PMC free article] [PubMed] [Google Scholar]
- 35.Wu T., Schwender H., Ruczinski I., Murray J.C., Marazita M.L., Munger R.G., Hetmanski J.B., Parker M.M., Wang P., Murray T. Evidence of gene-environment interaction for two genes on chromosome 4 and environmental tobacco smoke in controlling the risk of nonsyndromic cleft palate. PLoS ONE. 2014;9:e88088. doi: 10.1371/journal.pone.0088088. [DOI] [PMC free article] [PubMed] [Google Scholar]
- 36.Liao S.Y., Lin X., Christiani D.C. Gene-environment interaction effects on lung function- a genome-wide association study within the Framingham heart study. Environ. Health. 2013;12:101. doi: 10.1186/1476-069X-12-101. [DOI] [PMC free article] [PubMed] [Google Scholar]
- 37.Boardman J.D., Domingue B.W., Blalock C.L., Haberstick B.C., Harris K.M., McQueen M.B. Is the gene-environment interaction paradigm relevant to genome-wide studies? The case of education and body mass index. Demography. 2013;51:119–139. doi: 10.1007/s13524-013-0259-4. [DOI] [PMC free article] [PubMed] [Google Scholar]
- 38.Wang L., Rundek T., Beecham A., Hudson B., Blanton S.H., Zhao H., Sacco R.L., Dong C. Genome-wide interaction study identifies RCBTB1 as a modifier for smoking effect on carotid intima-media thickness. Arterioscler. Thromb. Vasc. Biol. 2014;34:219–225. doi: 10.1161/ATVBAHA.113.302706. [DOI] [PMC free article] [PubMed] [Google Scholar]
- 39.Tang H., Wei P., Duell E.J., Risch H.A., Olson S.H., Bueno-de-Mesquita H.B., Gallinger S., Holly E.A., Petersen G.M., Bracci P.M. Genes-environment interactions in obesity- and diabetes-associated pancreatic cancer: a GWAS data analysis. Cancer Epidemiol. Biomarkers Prev. 2014;23:98–106. doi: 10.1158/1055-9965.EPI-13-0437-T. [DOI] [PMC free article] [PubMed] [Google Scholar]
- 40.Surakka I., Isaacs A., Karssen L.C., Laurila P.P., Middelberg R.P., Tikkanen E., Ried J.S., Lamina C., Mangino M., Igl W., ENGAGE Consortium A genome-wide screen for interactions reveals a new locus on 4p15 modifying the effect of waist-to-hip ratio on total cholesterol. PLoS Genet. 2011;7:e1002333. doi: 10.1371/journal.pgen.1002333. [DOI] [PMC free article] [PubMed] [Google Scholar]
- 41.Velez Edwards D.R., Naj A.C., Monda K., North K.E., Neuhouser M., Magvanjav O., Kusimo I., Vitolins M.Z., Manson J.E., O’Sullivan M.J. Gene-environment interactions and obesity traits among postmenopausal African-American and Hispanic women in the Women’s Health Initiative SHARe Study. Hum. Genet. 2013;132:323–336. doi: 10.1007/s00439-012-1246-3. [DOI] [PMC free article] [PubMed] [Google Scholar]
- 42.Wu C., Kraft P., Zhai K., Chang J., Wang Z., Li Y., Hu Z., He Z., Jia W., Abnet C.C. Genome-wide association analyses of esophageal squamous cell carcinoma in Chinese identify multiple susceptibility loci and gene-environment interactions. Nat. Genet. 2012;44:1090–1097. doi: 10.1038/ng.2411. [DOI] [PubMed] [Google Scholar]
- 43.Siegert S., Hampe J., Schafmayer C., von Schönfels W., Egberts J.H., Försti A., Chen B., Lascorz J., Hemminki K., Franke A. Genome-wide investigation of gene-environment interactions in colorectal cancer. Hum. Genet. 2013;132:219–231. doi: 10.1007/s00439-012-1239-2. [DOI] [PubMed] [Google Scholar]
- 44.Gauderman W.J., Zhang P., Morrison J.L., Lewinger J.P. Finding novel genes by testing G × E interactions in a genome-wide association study. Genet. Epidemiol. 2013;37:603–613. doi: 10.1002/gepi.21748. [DOI] [PMC free article] [PubMed] [Google Scholar]
- 45.Sohns M., Viktorova E., Amos C.I., Brennan P., Fehringer G., Gaborieau V., Han Y., Heinrich J., Chang-Claude J., Hung R.J. Empirical hierarchical bayes approach to gene-environment interactions: development and application to genome-wide association studies of lung cancer in TRICL. Genet. Epidemiol. 2013;37:551–559. doi: 10.1002/gepi.21741. [DOI] [PMC free article] [PubMed] [Google Scholar]
- 46.Chalasani N., Guo X., Loomba R., Goodarzi M.O., Haritunians T., Kwon S., Cui J., Taylor K.D., Wilson L., Cummings O.W., Nonalcoholic Steatohepatitis Clinical Research Network Genome-wide association study identifies variants associated with histologic features of nonalcoholic fatty liver disease. Gastroenterology. 2010;139:1567–1576, e1–e6. doi: 10.1053/j.gastro.2010.07.057. [DOI] [PMC free article] [PubMed] [Google Scholar]
- 47.Gamazon E.R., Zhang W., Konkashbaev A., Duan S., Kistner E.O., Nicolae D.L., Dolan M.E., Cox N.J. SCAN: SNP and copy number annotation. Bioinformatics. 2010;26:259–262. doi: 10.1093/bioinformatics/btp644. [DOI] [PMC free article] [PubMed] [Google Scholar]
- 48.Pandey D., Chen F., Patel A., Wang C.Y., Dimitropoulou C., Patel V.S., Rudic R.D., Stepp D.W., Fulton D.J. SUMO1 negatively regulates reactive oxygen species production from NADPH oxidases. Arterioscler. Thromb. Vasc. Biol. 2011;31:1634–1642. doi: 10.1161/ATVBAHA.111.226621. [DOI] [PMC free article] [PubMed] [Google Scholar]
- 49.Birkenfeld A., Ben-Zvi A. Age associated changes in intracellular cyclic adenosine monophosphate. Clin. Exp. Immunol. 1984;55:651–654. [PMC free article] [PubMed] [Google Scholar]
- 50.Liu Z., Naranjo A., Thiele C.J. CASZ1b, the short isoform of CASZ1 gene, coexpresses with CASZ1a during neurogenesis and suppresses neuroblastoma cell growth. PLoS ONE. 2011;6:e18557. doi: 10.1371/journal.pone.0018557. [DOI] [PMC free article] [PubMed] [Google Scholar]
- 51.Liu Z., Yang X., Li Z., McMahon C., Sizer C., Barenboim-Stapleton L., Bliskovsky V., Mock B., Ried T., London W.B. CASZ1, a candidate tumor-suppressor gene, suppresses neuroblastoma tumor growth through reprogramming gene expression. Cell Death Differ. 2011;18:1174–1183. doi: 10.1038/cdd.2010.187. [DOI] [PMC free article] [PubMed] [Google Scholar]
- 52.Bookman E.B., McAllister K., Gillanders E., Wanke K., Balshaw D., Rutter J., Reedy J., Shaughnessy D., Agurs-Collins T., Paltoo D., for the NIH G × E Interplay Workshop participants Gene-environment interplay in common complex diseases: forging an integrative model-recommendations from an NIH workshop. Genet. Epidemiol. 2011;35:217–225. doi: 10.1002/gepi.20571. [DOI] [PMC free article] [PubMed] [Google Scholar]
- 53.Oien D.B., Osterhaus G.L., Latif S.A., Pinkston J.W., Fulks J., Johnson M., Fowler S.C., Moskovitz J. MsrA knockout mouse exhibits abnormal behavior and brain dopamine levels. Free Radic. Biol. Med. 2008;45:193–200. doi: 10.1016/j.freeradbiomed.2008.04.003. [DOI] [PMC free article] [PubMed] [Google Scholar]
- 54.Yang H.C., Liang Y.J., Wu Y.L., Chung C.M., Chiang K.M., Ho H.Y., Ting C.T., Lin T.H., Sheu S.H., Tsai W.C. Genome-wide association study of young-onset hypertension in the Han Chinese population of Taiwan. PLoS ONE. 2009;4:e5459. doi: 10.1371/journal.pone.0005459. [DOI] [PMC free article] [PubMed] [Google Scholar]
- 55.Lasky-Su J., Lyon H.N., Emilsson V., Heid I.M., Molony C., Raby B.A., Lazarus R., Klanderman B., Soto-Quiros M.E., Avila L. On the replication of genetic associations: timing can be everything! Am. J. Hum. Genet. 2008;82:849–858. doi: 10.1016/j.ajhg.2008.01.018. [DOI] [PMC free article] [PubMed] [Google Scholar]
- 56.Izzo J.L., Jr. Aging and systolic hypertension: cluster patterns and problem-solving strategies to answer the genetic riddle. Hypertension. 2001;37:1067–1068. doi: 10.1161/01.hyp.37.4.1067. [DOI] [PubMed] [Google Scholar]
Associated Data
This section collects any data citations, data availability statements, or supplementary materials included in this article.