Abstract
Thymic atrophy is a prominent feature of malnutrition. Forty-eight hours’ starvation of normal mice reduced the total thymocyte count to 13% of that observed in freely fed controls, predominantly because of a diminution in the cortical CD4+CD8+ thymocyte subpopulation. Prevention of the fasting-induced fall in the level of the adipocyte-derived hormone leptin by administering exogenous recombinant leptin protected mice from these starvation-induced thymic changes. The ob/ob mouse, which is unable to produce functional leptin because of a mutation in the obese gene, has impaired cellular immunity together with a marked reduction in the size and cellularity of the thymus. We found that ob/ob mice had a high level of thymocyte apoptosis resulting in a ratio of CD4+CD8+ (cortical) to CD4–CD8– (precursor) thymocytes that was 4-fold lower than that observed in wild-type mice. Peripheral administration of recombinant leptin to ob/ob mice reduced thymocyte apoptosis and substantially increased both thymic cellularity and the CD4+CD8+/CD4–CD8– ratio. In contrast, a comparable weight loss in pair-fed PBS-treated ob/ob mice had no impact on thymocyte number. In vitro, leptin protected thymocytes from dexamethasone-induced apoptosis. These data indicate that reduced circulating leptin concentrations are pivotal in the pathogenesis of starvation-induced lymphoid atrophy.
Introduction
Leptin is a 16-kDa adipocyte-derived hormone (1) whose plasma concentrations are proportional to fat mass (2, 3) but are lowered rapidly by fasting in both rodents and humans (4–6). Indeed, there is increasing evidence that leptin is a key signal of nutritional status regulating several aspects of metabolism and neuroendocrine function as part of an adaptive response to starvation (4, 7).
Lymphoid atrophy is a well-recognized consequence of nutritional deprivation in animals, including humans (8–14). This disproportionate loss of lymphoid tissue with starvation is particularly pronounced in the thymus, which has been designated “the barometer of malnutrition” (9). The thymus is crucial to T-cell development; it provides the specialized microenvironment required for T-cell maturation and the generation of a diverse T-cell receptor repertoire (15–22). We have demonstrated previously that the long isoform of the leptin receptor, thought to be of prime importance in leptin signaling, is expressed by mature CD4+ T cells and that leptin is able to modulate the activity of these cells directly (23). To our knowledge, the role of leptin in the pathogenesis of starvation-induced thymic atrophy has not been investigated previously.
Acute starvation causes a significant reduction in circulating leptin levels (4–6). We therefore hypothesized that exogenous administration of leptin during fasting would protect mice from the lymphoid atrophy associated with acute starvation. We determined the effect of leptin on the weight and cellularity of lymphoid and nonlymphoid tissues in mice fasted for 48 hours and compared this with the effects observed in PBS-treated starved mice and ad libitum–fed controls. We also looked at the effect of acute starvation with and without leptin repletion on specific thymocyte and splenocyte subpopulations and thymic histology.
Ob/ob mice are unable to produce functional leptin because of a mutation in the obese gene (1). In addition to a phenotype of insulin resistance and obesity, these totally leptin-deficient mice display a number of features seen in starvation including hyperphagia, infertility, decreased body temperature, diminished energy expenditure, hypercorticosteronemia, and suppression of the gonadal and thyroid axes (24–26). This has led to the suggestion that these mice are in a state of perceived chronic starvation because of their lack of leptin (4, 7). Indeed, ob/ob mice have been found to exhibit defective cell-mediated immunity and lymphoid atrophy (27, 28) analogous to that observed in chronic human undernutrition (10, 12–14, 29). Therefore, in order to examine the effect of in vivo leptin replacement on lymphoid tissue and thymocyte survival in a chronically leptin-deficient model, we administered leptin to ob/ob mice. Finally, to address whether leptin was able to influence the survival of thymocytes directly, we determined the effect of leptin on steroid-induced thymocyte apoptosis in vitro.
Methods
Mice.
Ten-week-old male C57BL/6 wild-type and ob/ob mice (Harlan UK, Oxford, United Kingdom) were housed in pairs at 22–23°C, with a 12-hour dark/12-hour light cycle (lights on at 0700 hours).
Starvation experiment.
Mice comprised 3 groups (n = 8 per group). One group was allowed ad libitum access to laboratory chow and received intraperitoneal injections of 0.2 mL PBS at 0900 and 1800 hours twice daily for 2 days. Two groups of mice were deprived of chow for 48 hours and received intraperitoneal injections of either 0.2 mL PBS or recombinant murine leptin (1 μg/g initial body weight) at 0900 and 1800 hours. All mice were allowed continuous access to water. This experimental paradigm of leptin administration during starvation has been shown to achieve circulating leptin concentrations 6 and 12 hours after injection, similar to that of ad libitum–fed control mice and has been considered as replacement therapy (4, 7, 23). At the end of 48 hours, mice were sacrificed by CO2 inhalation and blood was collected by terminal cardiac puncture between 0900 and 1000 hours and immediately centrifuged; the plasma was separated and stored at –20°C until assayed for glucose, insulin, and corticosterone.
Ob/ob mice.
Mice comprised 3 groups (n = 6 per group). One group was allowed to feed ad libitum, the second group was injected with recombinant murine leptin (1 μg/g initial body weight twice daily intraperitoneally), and the third group was pair-fed to the food intake of the leptin-treated mice and received twice-daily injections of PBS. All mice were weighed, and their food intake was recorded daily. On the morning after 10 days of leptin administration, mice were sacrificed and blood was collected as above. All the experiments were performed according to British Home Office regulations.
Assays.
Glucose was measured by the glucose oxidase method (YSI 2300 Stat Plus glucose analyzer; Yellow Springs Instrument Co. Yellow Springs, Ohio, USA). Plasma insulin was measured by RIA as described previously (30). Plasma corticosterone concentration was measured using a commercially available RIA (ICN Biomedicals Inc. Costa Mesa, California, USA).
Organ weight/cellularity.
Organs were removed from sacrificed mice, and liver and kidney weights were determined to the nearest 0.01 g. Spleens were removed and weighed to the nearest 0.1 mg. A single-cell suspension of splenocytes was prepared using the blunt end of a syringe and passing the suspension through nylon gauze. Red blood cells were lysed with ammonium chloride lysing buffer. All thymic tissue was carefully removed using fine forceps after exposure of the chest cavity and weighed to the nearest 0.1 mg. Thymic weight was not determined in the ob/ob mice because it was not possible to completely dissect this organ free of its surrounding connective tissue. A single-cell suspension of thymocytes was prepared by teasing the thymuses with sterile needles on a Petri dish. Red cells were lysed with ammonium chloride lysing buffer. Splenocyte and thymocyte numbers were determined by counting cells 3 times from different areas of a hemocytometer and calculating the mean cell counts. Cell subpopulations were analyzed by 2-color flow cytometry using a FACScalibur (Becton Dickinson Immunocytometry Systems, Mountain View, California, USA) with the appropriate FITC- or phycoerythrin-conjugated mAb’s (anti-CD4, anti-CD8; PharMingen, San Diego, California, USA).
Histology.
The acute starvation experiment was repeated using the protocol above in age-matched mice. On this occasion intact thymuses were removed, formalin-fixed, paraffin-embedded, sectioned, and stained with hematoxylin and eosin (H&E) for histologic evaluation of thymic architecture.
Apoptosis experiments.
Thymocyte apoptosis was determined by flow-cytometric analysis of annexin-V binding to thymocytes counterstained with propidium iodide (PI). Annexin V is a calcium-dependent phospholipid-binding protein with a high affinity for phosphatidylserine. This molecule is normally present in the inner lipid bilayer, but becomes exposed on the cell surface within the first few hours of the onset of apoptosis (31). PI is a red DNA-binding dye that can only enter cells whose membranes are disrupted. The effect of in vivo leptin administration on thymocyte survival was determined by comparing the level of apoptosis in thymocytes freshly harvested from ob/ob mice chronically treated with leptin (as described above) with that of freshly harvested thymocytes from pair-fed and ad libitum–fed ob/ob and wild-type mice (n = 6 per group). To investigate whether leptin had a direct anti-apoptotic action on thymocytes, we determined the effect of leptin on dexamethasone-induced apoptosis of thymocytes in vitro. Water-soluble dexamethasone (Sigma Chemical Co., St. Louis, Missouri, USA) was used at a final concentration of 10–7 M. Freshly harvested thymocytes from wild-type mice were washed once with culture medium (RPMI, 10% FCS) and incubated overnight at 37°C at a concentration of 10 × 106 thymocytes in 1 mL of medium in 1 of 3 conditions: (a) medium alone (b) dexamethasone alone (c) leptin (10–8 M) and dexamethasone. Thymocytes were also cultured at 4°C as a negative control. Cells were then washed and immediately stained with annexin V–FITC (Roche Diagnostics Ltd., East Sussex, United Kingdom) in the appropriate buffers and counterstained with PI as described previously (32). The levels of FL1-H (stained with annexin V–FITC) and FL2-H (stained with PI) were analyzed on a FACScalibur flow cytometer (Becton Dickinson Immunocytometry Systems).
Statistical analyses.
Analyses were performed using 1-way ANOVA with Tukey post hoc testing for normally distributed data or by Kruskal-Wallis ANOVA for skewed data. Results are expressed as mean ± SEM; P values less than 0.05 were considered to be statistically significant.
Results
Acute starvation led to a disproportionate fall in lymphoid mass.
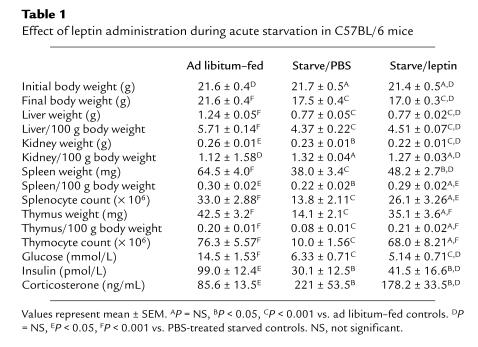
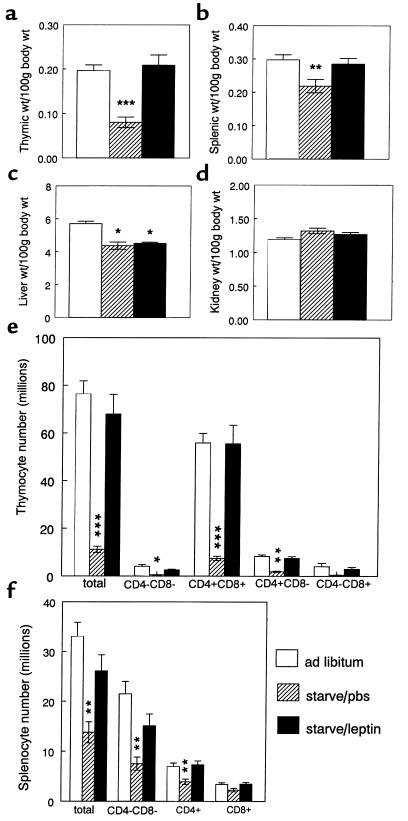
The effect of acute starvation with and without exogenous leptin administration on the body weight, organ weight, and metabolic parameters of wild-type C57BL/6 mice are shown in Table 1. The greatest effect of acute starvation was on the thymus (Figure 1). Mice treated with leptin during the period of starvation were completely protected against the profound thymic atrophy induced by the 48-hour fast (Figure 1a). Although not as dramatic as the changes observed in the thymus, starvation for 48 hours also caused a significant reduction in splenic weight. The effect of starvation on splenic atrophy was significantly blunted when exogenous leptin was administered during the period of starvation (Figure 1b). In contrast to the effect of leptin on lymphoid tissue, leptin administration during fasting had no impact on nonlymphoid tissue mass (Table 1; Figure 1, c and d).
Table 1.
Effect of leptin administration during acute starvation in C57BL/6 mice
Figure 1.
The effect of leptin administration during starvation on lymphoid (a, b, e, and f) and nonlymphoid tissues (c and d) in C57BL/6 mice. (a) Thymic weight, (b) splenic weight, (c) liver weight, (d) kidney weight, (e) thymocyte subpopulations, and (f) splenic subpopulations. Values represent mean ± SEM. *P < 0.05 vs. ad libitum–fed controls; **P < 0.05, ***P < 0.0001 PBS-treated starved mice vs. both ad libitum–fed controls and leptin-treated starved mice.
The effects of acute starvation on thymocyte subpopulations were reversed by leptin.
Acute starvation caused a dramatic fall in the mean total thymocyte count to 13% of that observed in control mice (Table 1). This reduction in total thymic cellularity was mirrored by a reduction in the absolute numbers of all thymocyte subsets examined (Figure 1e). The greatest effect of fasting was seen in the double-positive CD4+CD8+ thymocyte subpopulation. Starvation caused a reduction in both the absolute cell number (Figure 1e) and the overall relative proportion of CD4+CD8+ thymocytes (66.0 ± 1.26%) compared with that observed in ad libitum–fed mice (76.2 ± 1.32%; P < 0.001). Although acute starvation caused a relative increase in the overall percentage of single-positive CD4+CD8– thymocytes (17.0 ± 0.7% [fasted, PBS] vs. 11.1 ± 0.69% [fed]; P < 0.005), there was still a significant reduction in absolute numbers of CD4+ CD8– thymocytes in the PBS-treated starved group compared with the ad libitum–fed controls (1.90 ± 0.24 [fasted, PBS] vs. 8.36 ± 0.61 million [fed]; P < 0.0001). Leptin protected completely against these starvation-induced changes in both thymocyte number (Figure 1e) and subpopulation proportions (percent CD4+CD8+ thymocytes: 76.6 ± 1.92 [fasted, leptin] vs. 76.2 ± 1.32 [fed], P = NS; percent CD4+CD8– thymocytes: 10.8 ± 1.39 [fasted, leptin] vs. 11.1 ± 0.69 [fed], P = NS). The relative proportions of CD4–CD8– or CD4–CD8+ thymocytes were not significantly affected by starvation or leptin treatment.
Leptin spared splenic T cells from the effects of acute starvation.
Forty-eight–hour starvation resulted in a 42% reduction in the total number of splenocytes (Table 1; Figure 1f). The absolute number of splenocytes negative for both CD4 and CD8 (non–T cells) was particularly reduced by acute starvation (7.53 ± 1.31 [fast, PBS] vs. 21.5 ± 2.46 million [fed]), although leptin was able to only partially prevent the fasting-induced changes in this subpopulation (15.1 ± 2.36 million [fast, leptin]). The greatest effect of leptin was seen in the CD4+ splenic T-cell subpopulation. Starvation reduced the number of CD4+ splenocytes to 56% that of fed controls (3.92 ± 0.53 [fast, PBS] vs. 6.98 ± 0.69 million [fed]), an effect that was completely abrogated by the administration of exogenous leptin (7.35 ± 0.76 million [fast, leptin]). A similar trend was seen in the CD8+ subset (Figure 1f).
Leptin protected against the starvation-induced loss of cortical thymocytes.
Representative histologic sections of thymuses from each group are shown in Figure 2. The normal corticomedullary differentiation of the thymus (Figure 2, a and b) was lost following starvation, reflecting a marked reduction in the number of cortical thymocytes with relative preservation of the medullary architecture (Figure 2c). In contrast, the thymuses from starved mice treated with exogenous leptin during starvation retained corticomedullary differentiation and cortical thymocyte density (Figure 2, e and f). In the PBS-treated starved thymuses, there were abundant small, darkly stained apoptotic thymocytes visible throughout the remaining cortex (Figure 2d). Although occasional apoptotic thymo-cytes were seen in leptin-treated starved thymuses, they were far less prevalent than in thymuses from the PBS-treated starvation group.
Figure 2.
The effect of leptin administration during starvation on thymic histology in C57BL/6 mice. (a and b) Ad libitum–fed controls. (c and d) PBS-treated starved mice. (e and f) Leptin-treated starved mice. Sections are stained with H&E and shown at ×25 (a, c, and e) and ×250 (b, d, and f). c, cortex; m, medulla; a, apoptotic thymocytes.
The starvation-induced changes in plasma insulin, glucose, and corticosterone were not significantly affected by leptin.
Starvation of both PBS and leptin-treated mice caused a similar significant reduction in both plasma glucose and insulin concentrations (Table 1). As expected, fasting was associated with a significant increase in plasma corticosterone concentrations. However, although leptin treatment during fasting somewhat blunted the starvation-induced rise in plasma corticosterone, this effect was not statistically significant (Table 1).
The thymus of the obese (ob/ob) C57BL/6 mouse is markedly hypocellular.
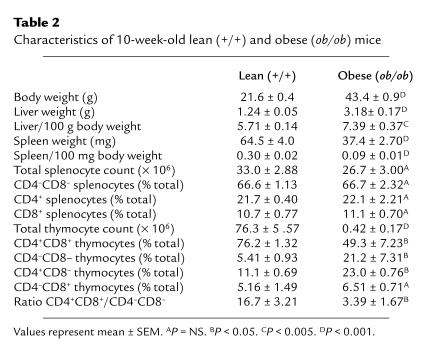
Details of the organ weight and cellularity in 10-week-old C57BL/6 ob/ob mice and age-matched wild-type controls are shown in Table 2. As anticipated, body and liver weights were significantly greater in the ob/ob mice in comparison with the wild-type mice. Splenic weights were significantly lower in the ob/ob mice compared with the wild-type controls, although total splenocyte number was similar. Indeed, there was no significant difference in the relative proportion of the different splenocyte subpopulations examined between ob/ob and wild-type mice. In contrast, thymic cellularity was dramatically reduced in the ob/ob mice in comparison with wild-type mice with a significant alteration in the relative proportions of the examined thymocyte subpopulations between the two groups. Ob/ob mice had a significantly lower percentage of CD4+CD8+ thymocytes and a significantly higher percentage of CD4–CD8– and CD4+CD8– thymocytes compared with wild-type mice. Indeed, there was a greater than 4-fold reduction in the ratio of CD4+CD8+ to CD4–CD8– thymocytes in the ob/ob mice compared with wild-type mice (Table 2).
Table 2.
Characteristics of 10-week-old lean (+/+) and obese (ob/ob) mice
Leptin administration increased thymic cellularity in ob/ob mice.
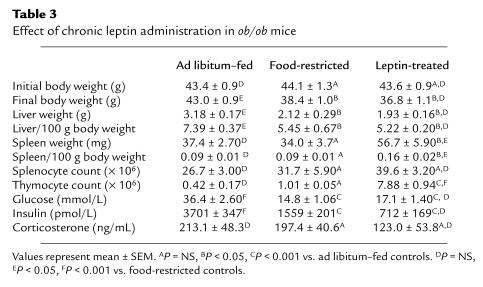
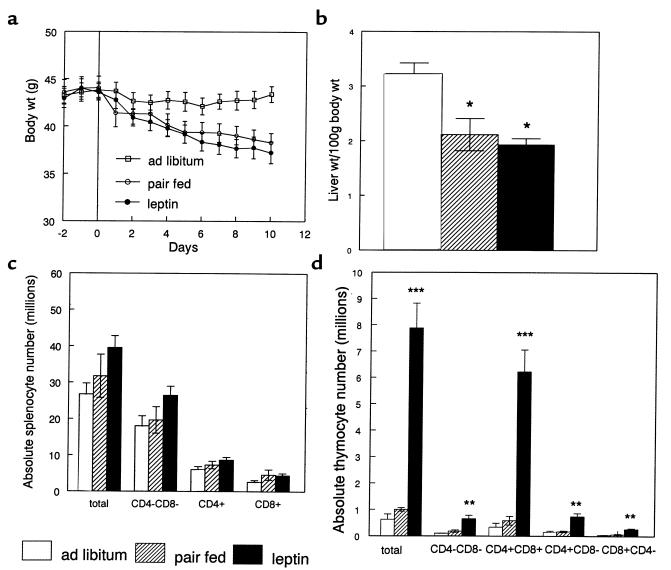
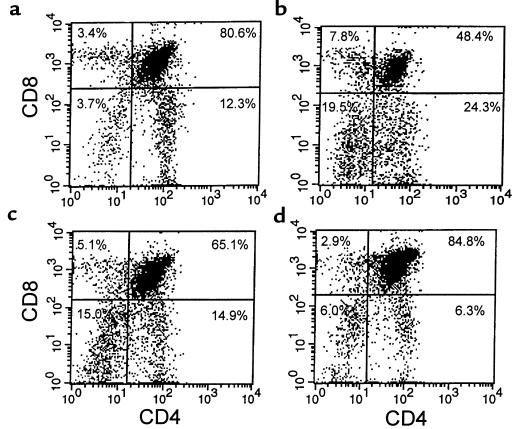
The effects of administering recombinant leptin for 10 days on organ weight, cellularity, and metabolic parameters in ob/ob mice are shown in Table 3. Leptin administration led to a similar reduction in body weight and liver mass in both food-restricted and leptin-treated mice (Figure 3, a and b). Although splenic weight was significantly higher in leptin-treated mice than both ad libitum and food-restricted controls, there was no statistical difference when total splenocyte numbers or splenocyte subpopulations were compared between groups (Figure 3c). Leptin treatment of ob/ob mice had a considerable impact on the thymus. Whereas food restriction alone had no significant effect on total thymocyte count, leptin treatment in ob/ob mice caused an 18-fold increase in total thymic cellularity (Figure 3d). This leptin-induced increase in thymocyte number was seen in all examined thymocyte subpopulations. The greatest increment, however, was found in the number of CD4+CD8+ thymocytes, with a relative reduction in the number of CD4–CD8– thymocytes. Indeed, there was a 3-fold increase in the proportion of CD4+CD8+ to CD4–CD8– thymocytes following chronic leptin administration (10.2 ± 1.78), whereas this ratio remained similar in the pair-fed and ad libitum–fed mice (3.93 ± 1.57 and 3.39 ± 1.67, respectively; P = NS). Representative flow-cytometric analyses with CD4 and CD8 staining of thymocytes from wild-type mice and ob/ob mice are shown in Figure 4.
Table 3.
Effect of chronic leptin administration in ob/ob mice
Figure 3.
The effect of chronic leptin administration on (a) body weight, (b) liver weight, (c) splenocyte subpopulations, and (d) thymocyte subpopulations in ob/ob mice. Values represent mean ± SEM. *P < 0.05 vs. ad libitum–fed controls. **P < 0.05, ***P < 0.0005, PBS-treated starved mice vs. both ad libitum–fed and pair-fed control mice.
Figure 4.
Representative flow-cytometric analyses of thymocytes stained for CD4 and CD8. (a) Wild-type mice, (b) ad libitum–fed ob/ob mice, (c) pair-fed ob/ob mice, and (d) leptin-treated ob/ob mice.
The metabolic effects of leptin administered peripherally for 10 days to ob/ob mice are shown in Table 3. There was a similar reduction in plasma glucose concentration in the food-restricted mice and the leptin-treated mice. Leptin treatment reduced plasma insulin levels of ob/ob mice to a greater extent than that observed by a similar degree of food restriction and weight loss; however, this effect did not reach statistical significance. After 10 days of exogenous leptin administration, the mean plasma corticosterone concentration was not statistically different between any of the groups of ob/ob mice (Table 3).
Thymocyte apoptosis was reduced by in vivo treatment of ob/ob mice with leptin.
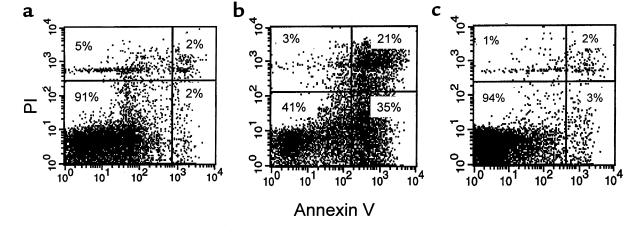
Representative flow-cytometric analyses with annexin V and PI staining of thymocytes are shown in Figure 5. Thymocytes derived from wild-type mice had a low level of apoptosis (Figure 5a) compared with those from ad libitum–fed ob/ob mice (Figure 5b). Analysis of thymocyte apoptosis from pair-fed ob/ob mice gave results similar to ad libitum–fed ob/ob mice (not shown). Leptin treatment in vivo reduced the level of apoptosis in thymocytes from ob/ob mice to that observed in wild-type control mice (Figure 5c).
Figure 5.
Representative flow-cytometric analyses of thymocytes stained with annexin V and PI. (a) Wild-type mice. (b) Ad libitum–fed ob/ob mice. (c) Leptin-treated ob/ob mice. Shown are live thymocytes (lower-left quadrant), thymocytes in the early stages of apoptosis (lower-right quadrant), thymocytes in the late stages of apoptosis (upper-right quadrant), and dead thymocytes (upper-left quadrant).
Leptin protected thymocytes from steroid-induced apoptosis in vitro.
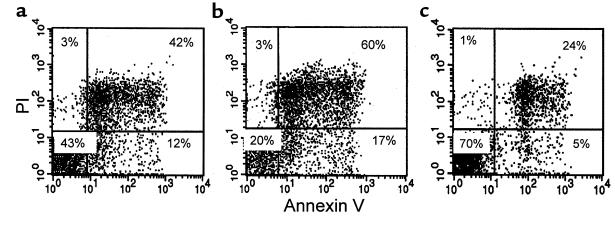
Murine thymocytes cultured at 37°C underwent spontaneous apoptosis (Figure 6a), the level of which was increased in the presence of dexamethasone (Figure 6b). Dexamethasone-induced thymocyte apoptosis was completely prevented by the presence of leptin in the cultures (Figure 6c).
Figure 6.
Representative flow-cytometric analyses of wild-type C57BL/6 thymocytes stained with annexin V and PI, and cultured in vitro with (a) medium alone (b) dexamethasone alone, and (c) dexamethasone and leptin. Shown are live thymocytes (lower-left quadrant), thymocytes in the early stages of apoptosis (lower-right quadrant), thymocytes in the late stages of apoptosis (upper-right quadrant), and dead thymocytes (upper-left quadrant).
Discussion
Lymphoid atrophy has long been recognized as a prominent feature of starvation in animals and humans (8–14); our findings now suggest that the reduction in plasma leptin concentration with fasting is of prime importance in its pathogenesis. Consistent with previous reports (8, 9–12), the thymus underwent the most profound reduction in weight and cellularity with starvation. Whereas the mass of nonlymphoid organs (kidney and liver) were unaffected by leptin treatment during fasting, we have shown that exogenous leptin, administered only during the period of fasting, was able to completely protect against the thymic atrophy induced by acute starvation. Similar results were observed for the spleen, although the effects of both fasting and the response to exogenous leptin were less dramatic in this organ.
Thymocyte subpopulations at different stages of maturation are found in distinct parts of the thymus and can be distinguished by their expression of cell-surface molecules, the most important of which are the CD4, CD8, and T-cell receptor molecules. The greatest loss in thymocyte number with acute starvation was in the double-positive (CD4+CD8+) thymocyte subpopulation. Leptin treatment during starvation completely protected against the fasting-induced loss of these immature thymocytes. As the double-positive thymocyte is the major cell type in the thymic cortex, this finding is consistent with the dramatic reduction in cortical cellularity and loss of corticomedullary differentiation observed histologically following starvation. In addition, many of the remaining cortical thymocytes in the PBS-treated starved thymuses appeared apoptotic. In contrast, in the thymuses taken from mice that had been treated with leptin during starvation, the cortex was well preserved and apoptotic thymocytes were sparse. The more mature single-positive thymocytes reside in the thymic medulla. The observed increase in the overall proportion of single-positive CD4+CD8– thymocytes remaining in the PBS-treated starved thymuses is, therefore, likely to reflect the relative preservation of the thymic medulla over the cortex during starvation. However, because a small proportion of the earliest T-lineage precursors is also CD4+CD8– in mice (33), it is feasible that an interruption of early thymocyte maturation could contribute to the observed increase in the relative proportion of this subset. The absolute number of single-positive CD4+CD8– thymocytes was, nevertheless, still significantly reduced by starvation. Again, these fasting-induced changes in thymocyte subpopulation number and proportion were not seen if exogenous leptin was administered during the period of starvation.
Leptin was partially able to protect against the effect of acute starvation in reducing the total number of splenocytes in wild-type mice. However, it was only in the CD4+ splenic T-cell subpopulation that leptin was found to completely abrogate the effect of acute starvation. Splenocytes negative for both CD4 and CD8 comprise a heterogeneous population of cell types including B cells, natural killer (NK) cells, and macrophages. Collectively, leptin treatment was able to only partially protect these cells against the effects of acute starvation. These findings would suggest that factors in addition to the fasting-induced fall in leptin are responsible for the overall reduction in this splenocyte subpopulation with starvation. Whether leptin has differential effects on the survival of the individual cell types that comprise this subpopulation remains to be determined.
Like others, we found that the spleens of ob/ob mice were significantly smaller compared with those of age-matched wild-type mice (27, 28). Although the absolute splenocyte number and relative proportions of the various splenocyte subpopulations expressing CD4 and CD8 markers tended to be lower in the ob/ob mice than wild-type mice, these differences were not statistically significant. It is therefore not surprising that although treatment of ob/ob mice for 10 days with recombinant leptin significantly increased spleen size, it was without a significant impact on total splenocyte number or subpopulation proportions. In chronic leptin deficiency, unlike acute starvation (where circulating leptin concentrations are rapidly lowered), the number of splenocytes expressing CD4 or CD8 markers appears to be relatively well maintained.
In marked contrast to our findings in the spleen, the cellularity of the thymus was considerably lower in ob/ob compared with wild-type mice. In addition, the ob/ob mice had a significantly lower percentage of double-positive and higher percentage of double-negative and CD4+CD8– thymocytes compared with age-matched wild-type controls. In wild-type mice, where food restriction reduced thymocyte number, food restriction in ob/ob mice had no further suppressive effect on the already reduced thymic cellularity. As was the case when exogenous leptin was administered to fasted wild-type mice, leptin administration to ob/ob mice had a dramatic effect on thymic cellularity. After only 10 days, thymocyte number had increased by over 18-fold in the leptin-treated ob/ob mice. This augmentation of thymocyte number was seen in all thymocyte subpopulations. However, as we observed with leptin treatment during acute starvation, this overall improvement was largely due to an increase in the double-positive thymocyte number. The abnormally low ratio of double-positive to double-negative thymocytes we had observed in ob/ob compared with wild-type mice was also improved by chronic leptin administration. The double-positive thymocytes are by far the most numerous cells in the normal thymus, and any reduction in their number would certainly be expected to have a major impact on total thymic cellularity. It therefore seems likely that the effect of leptin in protecting against thymic atrophy may be due to its influence on the survival of, or entry into, this immature thymocyte subpopulation.
Starvation is accompanied by significant metabolic and endocrine changes that could potentially contribute to the observed lymphoid atrophy. However, the starvation-induced fall in plasma insulin and glucose concentrations was not significantly affected by leptin administered during 48 hours of starvation in wild-type mice, consistent with a previous report (4). As anticipated, leptin treatment of ob/ob mice was found to reduce food intake and body weight (34–38). The resulting improvement in insulin sensitivity was reflected by reduced plasma insulin and glucose concentrations (36–38). Similar reductions in these parameters were observed in both the leptin-treated and the food-restricted ob/ob mice. It therefore seems unlikely, at least in these models, that leptin’s effect on thymic cellularity is secondary to changes in insulin or glucose. Activation of the hypothalamic-pituitary-adrenal (HPA) axis is a feature of nutritional deprivation (4, 25). Administration of recombinant leptin during fasting has been shown to blunt (although not prevent) the starvation-induced rise in plasma corticosterone in mice fasted for 48 hours (4). Another study reported that leptin had no significant impact on the increase in corticosterone observed after 24 hours of fasting in lean mice (39). In our experiments we have also found that, although leptin tended to decrease the fasting-induced rise in corticosterone concentrations, the levels remained statistically similar to that of PBS-treated starved control mice. This regime of leptin administration during acute starvation, however, was able to completely reverse the effects of starvation on thymic involution. Furthermore, there was a marked increase in thymic cellularity after just 10 days of leptin administration to ob/ob mice, over which time period plasma corticosterone concentrations were not significantly reduced by leptin treatment. The effects of glucocorticoids on the thymus are complex; intrathymic production of glucocorticoids is well established, and their importance in antigen-specific thymocyte development and survival is becoming increasingly recognized (40–44). However, because glucocorticoids are also well-known to have lympholytic effects (45–47), with an effect on the immature cortical thymocyte subpopulation in particular (47), it is still possible that suppression of the HPA axis may make some contribution to the observed lymphoprotective effect of leptin in vivo. As leptin administration has also been shown to blunt the suppressive effects of fasting on the thyroid, gonadal, and growth hormone axes (4, 48), a potential contribution of other leptin-induced endocrine changes to the overall lymphoprotective action of leptin cannot be excluded. It remains to be seen whether an intracerebroventricular infusion of leptin, administered at a centrally effective dose that had no effect on peripheral circulating leptin levels, would be able confer similar protection against starvation-induced thymic atrophy as was seen with peripheral leptin administration in this study. We have, however, demonstrated that an enhanced level of thymocyte apoptosis underlies the marked thymic atrophy found in the leptin-deficient ob/ob mouse and that leptin administration in vivo is able to inhibit this process. Furthermore, we have shown that leptin can inhibit the steroid-induced apoptotic pathway in thymocytes cultured in vitro. Leptin has been found previously to inhibit induced apoptosis in pancreatic beta cells (49). It now seems likely that the ability of leptin to protect against thymic atrophy also involves a direct anti-apoptotic mechanism.
Since its first description in 1810, starvation has been recognized to cause a disproportionate depletion of lymphoid tissue compared with nonlymphoid tissue. These changes affect the thymus in particular (8–14). We have found that prevention of the starvation-induced reduction in plasma leptin concentration by exogenous administration of recombinant leptin was able to protect normal mice from this “nutritional thymectomy.” In addition, leptin administered chronically to ob/ob mice dramatically improved their marked thymic hypocellularity. Because the majority of thymocytes (over 95%) die within the thymus as a result of mechanisms designed to delete autoreactive, non–self restricted cells (15–22), the thymus is an energy-expensive organ (50). Our findings are consistent with the hypothesis that the physiological role of leptin is as a signal of starvation (4, 7, 23). We propose that a reduced leptin concentration is pivotal to the pathogenesis of starvation-induced lymphoid atrophy.
Acknowledgments
This work was funded by the Medical Research Council (MRC), United Kingdom. J.K. Howard and G.M. Lord are MRC Clinical Training Fellows. We thank M. Chiesi and N. Levens from Novartis for providing the recombinant murine leptin, and Z. Wang, R-M. Wang, E. Eren, and D. Palmer for technical advice and photographic assistance.
Footnotes
Giuseppe Matarese’s present address is Laboratorio di Immunologia, Dipartimento di Biologia e Patologia Cellulare e Molecolare, Universita di Napoli “Federico II,” via Pansini 5-80131 Napoli, Italy.
Jane K. Howard and Graham M. Lord contributed equally to this work.
References
- 1.Zhang Y, et al. Positional cloning of the mouse obese gene and its human homologue. Nature. 1994;372:425–432. doi: 10.1038/372425a0. [DOI] [PubMed] [Google Scholar]
- 2.Considine RV, et al. Serum immunoreactive-leptin concentrations in normal-weight and obese humans. N Engl J Med. 1996;334:292–295. doi: 10.1056/NEJM199602013340503. [DOI] [PubMed] [Google Scholar]
- 3.Maffei M, et al. Leptin levels in human and rodent: measurement of plasma leptin and ob RNA in obese and weight-reduced subjects. Nat Med. 1995;1:1155–1161. doi: 10.1038/nm1195-1155. [DOI] [PubMed] [Google Scholar]
- 4.Ahima RS, et al. Role of leptin in the neuroendocrine response to fasting. Nature. 1996;382:250–252. doi: 10.1038/382250a0. [DOI] [PubMed] [Google Scholar]
- 5.Boden G, Chen X, Mozzoli M, Ryan I. Effect of fasting on serum leptin in normal human subjects. J Clin Endocrinol Metab. 1996;81:3419–3423. doi: 10.1210/jcem.81.9.8784108. [DOI] [PubMed] [Google Scholar]
- 6.Weigle DS, et al. Effect of fasting, refeeding, and dietary fat restriction on plasma leptin levels. J Clin Endocrinol Metab. 1997;82:561–565. doi: 10.1210/jcem.82.2.3757. [DOI] [PubMed] [Google Scholar]
- 7.Flier JS. What’s in a name? In search of leptin’s physiologic role. J Clin Endocrinol Metab. 1998;83:1407–1413. doi: 10.1210/jcem.83.5.4779. [DOI] [PubMed] [Google Scholar]
- 8.Simon, J. 1845. A physiological essay on the thymus gland. Renshaw. London, United Kingdom.
- 9.Jackson, C.M. 1925. The effects of inanition and malnutrition upon growth and structure. Blakiston’s Sons and Co. Philadelphia, PA.
- 10.Smythe PM, et al. Thymolymphatic deficiency and depression of cell-mediated immunity in protein-calorie malnutrition. Lancet. 1971;2:939–943. doi: 10.1016/s0140-6736(71)90267-4. [DOI] [PubMed] [Google Scholar]
- 11.Martinez D, Cox S, Lukassewycz OA, Murphy WH. Immune mechanisms in leukemia: suppression of cellular immunity by starvation. J Natl Cancer Inst. 1975;55:935–939. doi: 10.1093/jnci/55.4.935. [DOI] [PubMed] [Google Scholar]
- 12.Chandra RK. Nutrition and immunity: lessons from the past and new insights into the future. Am J Clin Nutr. 1991;53:1087–1101. doi: 10.1093/ajcn/53.5.1087. [DOI] [PubMed] [Google Scholar]
- 13.Watts T. Thymus weights in malnourished children. J Trop Pediatr. 1969;15:155–158. doi: 10.1093/tropej/15.4.155. [DOI] [PubMed] [Google Scholar]
- 14.Chevalier P. Thymic ultrasonography in children, a non-invasive assessment of nutritional immune deficiency. Nutr Res. 1997;17:1271–1276. [Google Scholar]
- 15.Blackman M, Kappler J, Marrack P. The role of the T-cell receptor in positive and negative selection of developing T-cells. Science. 1990;248:1335–1341. doi: 10.1126/science.1972592. [DOI] [PubMed] [Google Scholar]
- 16.von-Boehmer H. Positive selection of lymphocytes. Cell. 1994;76:219–228. doi: 10.1016/0092-8674(94)90330-1. [DOI] [PubMed] [Google Scholar]
- 17.Ashton-Rickardt PG, et al. Evidence for a differential avidity model of T cell selection in the thymus. Cell. 1994;76:651–663. doi: 10.1016/0092-8674(94)90505-3. [DOI] [PubMed] [Google Scholar]
- 18.Ignatowicz L, Kappler J, Marrack P. The repertoire of T-cells shaped by a single MHC/peptide ligand. Cell. 1996;84:521–529. doi: 10.1016/s0092-8674(00)81028-4. [DOI] [PubMed] [Google Scholar]
- 19.Anderson G, Owen JJ, Moore NC, Jenkinson EJ. Thymic epithelial cells provide unique signals for positive selection of CD4+CD8+ thymocytes in vitro. J Exp Med. 1994;179:2027–2031. doi: 10.1084/jem.179.6.2027. [DOI] [PMC free article] [PubMed] [Google Scholar]
- 20.Ritter MA, Boyd RL. Development in the thymus: it takes two to tango. Immunol Today. 1993;14:462–469. doi: 10.1016/0167-5699(93)90250-O. [DOI] [PubMed] [Google Scholar]
- 21.Boyd RL, et al. The thymic microenvironment. Immunol Today. 1993;14:445–459. doi: 10.1016/0167-5699(93)90248-J. [DOI] [PubMed] [Google Scholar]
- 22.Shortman K, Egerton M, Spangrude GJ, Scollay R. The generation and fate of thymocytes. Semin Immunol. 1990;2:3–12. [PubMed] [Google Scholar]
- 23.Lord GM, et al. Leptin modulates the T-cell immune response and reverses starvation-induced immunosuppression. Nature. 1998;394:897–901. doi: 10.1038/29795. [DOI] [PubMed] [Google Scholar]
- 24.Bray GA, Fisler J, York DA. Neuroendocrine control of the development of obesity: understanding gained from experimental animal models. Front Neuroendocrinol. 1990;11:128–181. [Google Scholar]
- 25.Schwartz MW, Dallman MF, Woods SC. Hypothalamic response to starvation: implications for the study of wasting disorders. Am J Physiol. 1995;269:R949–R957. doi: 10.1152/ajpregu.1995.269.5.R949. [DOI] [PubMed] [Google Scholar]
- 26.Harris RBS, et al. A leptin dose-response study in obese (ob/ob) and lean (+/?) mice. Endocrinology. 1998;139:8–19. doi: 10.1210/endo.139.1.5675. [DOI] [PubMed] [Google Scholar]
- 27.Chandra RK. Cell-mediated immunity in genetically obese C57BL/6J ob/ob mice. Am J Clin Nutr. 1980;33:13–16. doi: 10.1093/ajcn/33.1.13. [DOI] [PubMed] [Google Scholar]
- 28.Meade CJ, Sheena J, Mertin J. Effects of the obese (ob/ob) genotype on spleen cell immune function. Int Arch Allergy Appl Immunol. 1979;58:121–127. doi: 10.1159/000232183. [DOI] [PubMed] [Google Scholar]
- 29.Pertschuk MJ, Crosby LO, Barot L, Mullen JL. Immunocompetency in anorexia nervosa. Am J Clin Nutr. 1982;35:968–972. doi: 10.1093/ajcn/35.5.968. [DOI] [PubMed] [Google Scholar]
- 30.Kulkarni RN, et al. Leptin rapidly suppresses insulin release from insulinoma cells, rat and human islets and, in vivo, in mice. J Clin Invest. 1997;100:2729–2736. doi: 10.1172/JCI119818. [DOI] [PMC free article] [PubMed] [Google Scholar]
- 31.Vermes I, Haanen C, Steffens-Nakken H, Reutelingsperger C. A novel assay for apoptosis: flow cytometric detection of phosphatidylserine expression on early apoptotic cells using fluorescein labelled annexin V. J Immunol Methods. 1995;184:39–51. doi: 10.1016/0022-1759(95)00072-i. [DOI] [PubMed] [Google Scholar]
- 32.Ferlin-Bezombes, et al. IFN-alpha is a survival factor for human myeloma cells and reduces dexamethasone-induced apoptosis. J Immunol. 1998;161:2692–2699. [PubMed] [Google Scholar]
- 33.Wu L, et al. CD4 expressed on earliest T-lineage precursor cells in the adult murine thymus. Nature. 1991;349:71–74. doi: 10.1038/349071a0. [DOI] [PubMed] [Google Scholar]
- 34.Halaas JL, et al. Weight-reducing effects of the plasma protein encoded by the obese gene. Science. 1995;269:543–546. doi: 10.1126/science.7624777. [DOI] [PubMed] [Google Scholar]
- 35.Campfield LA, Smith FJ, Guisez Y, Devos R, Burn P. Recombinant mouse ob protein: evidence for a peripheral signal linking adiposity and central neural networks. Science. 1995;269:546–549. doi: 10.1126/science.7624778. [DOI] [PubMed] [Google Scholar]
- 36.Pelleymounter MA, et al. Effects of the obese gene product on body weight regulation in ob/ob mice. Science. 1995;269:540–543. doi: 10.1126/science.7624776. [DOI] [PubMed] [Google Scholar]
- 37.Stephens TW, et al. The role of neuropeptide Y in the antiobesity action of the obese gene product. Nature. 1995;377:530–532. doi: 10.1038/377530a0. [DOI] [PubMed] [Google Scholar]
- 38.Schwartz MW, et al. Specificity of leptin action on elevated blood glucose levels and hypothalamic neuropeptide Y gene expression in ob/ob mice. Diabetes. 1996;45:531–535. doi: 10.2337/diab.45.4.531. [DOI] [PubMed] [Google Scholar]
- 39.Huang Q, Rivest R, Richard D. Effects of leptin on corticotropin-releasing factor (CRF) synthesis and CRF neuron activation in the paraventricular hypothalamic nucleus of obese (ob/ob) mice. Endocrinology. 1998;139:1524–1532. doi: 10.1210/endo.139.4.5889. [DOI] [PubMed] [Google Scholar]
- 40.Ritter MA. Embryonic mouse thymocyte development: enhancing effect of corticosterone at physiological levels. Immunology. 1977;33:241–246. [PMC free article] [PubMed] [Google Scholar]
- 41.King LB, et al. A targeted glucocorticoid receptor antisense transgene increases thymocyte apoptosis and alters thymocyte development. Immunity. 1995;3:647–656. doi: 10.1016/1074-7613(95)90135-3. [DOI] [PubMed] [Google Scholar]
- 42.Vacchio MS, Ashwell JD. Thymus-derived glucocorticoids regulate antigen-specific positive selection. J Exp Med. 1997;185:2033–2038. doi: 10.1084/jem.185.11.2033. [DOI] [PMC free article] [PubMed] [Google Scholar]
- 43.Tolosa E, King LB, Ashwell JD. Thymocyte glucocorticoid resistance alters positive selection and inhibits autoimmunity and lymphoproliferative disease in MRL-lpr/lpr mice. Immunity. 1998;8:67–76. doi: 10.1016/s1074-7613(00)80459-8. [DOI] [PubMed] [Google Scholar]
- 44.Vacchio MS, King LB, Ashwell JD. Regulation of thymocyte development by glucocorticoids. Behring Inst Mitt. 1996;97:24–31. [PubMed] [Google Scholar]
- 45.Dougherty TF. Effect of hormone on lymphatic tissue. Physiol Rev. 1952;32:379–401. doi: 10.1152/physrev.1952.32.4.379. [DOI] [PubMed] [Google Scholar]
- 46.Wyllie AH. Glucocorticoid-induced thymocyte apoptosis is associated with endogenous endonuclease activation. Nature. 1980;284:555–556. doi: 10.1038/284555a0. [DOI] [PubMed] [Google Scholar]
- 47.Ishdate M, Metcalf D. The pattern of lymphopoiesis in the mouse thymus after corticosterone administration or adrenalectomy. Aust J Exp Biol Med Sci. 1963;41:637–649. doi: 10.1038/icb.1963.53. [DOI] [PubMed] [Google Scholar]
- 48.Carro E, Senaris R, Considine RV, Casanueva FF, Dieguez C. Regulation of in vivo growth hormone secretion by leptin. Endocrinology. 1997;138:2203–2206. doi: 10.1210/endo.138.5.5238. [DOI] [PubMed] [Google Scholar]
- 49.Shimabukuro M, Wang MY, Zhou YT, Newgard CB, Unger RH. Protection against lipoapoptosis of beta cells through leptin-dependent maintenance of Bcl-2 expression. Proc Natl Acad Sci USA. 1998;95:9558–9561. doi: 10.1073/pnas.95.16.9558. [DOI] [PMC free article] [PubMed] [Google Scholar]
- 50.George AJT, Ritter MA. Thymic involution with aging: obsolescence or good housekeeping? Immunol Today. 1996;17:267–272. doi: 10.1016/0167-5699(96)80543-3. [DOI] [PubMed] [Google Scholar]


