Abstract
The mechanisms by which amorphous intermediates transform into crystalline materials are poorly understood. Currently, attracting enormous interest is the crystallization of amorphous calcium carbonate, a key intermediary in synthetic, biological and environmental systems. Here we attempt to unify many contrasting and apparently contradictory studies by investigating this process in detail. We show that amorphous calcium carbonate can dehydrate before crystallizing, both in solution and in air, while thermal analyses and solid-state nuclear magnetic resonance measurements reveal that its water is present in distinct environments. Loss of the final water fraction—comprising less than 15% of the total—then triggers crystallization. The high activation energy of this step suggests that it occurs by partial dissolution/recrystallization, mediated by surface water, and the majority of the particle then crystallizes by a solid-state transformation. Such mechanisms are likely to be widespread in solid-state reactions and their characterization will facilitate greater control over these processes.
 The crystallization of amorphous calcium carbonate is a widely studied process. Here, the authors probe the mechanism and show that transformation to calcite is preceded by dehydration, even in solution, and that loss of the final water fraction triggers crystallization.
The recognition that hydrated amorphous precursor phases can play key roles in the formation of vertebrate and invertebrate biominerals has generated significant interest in these phases1,2,3,4. Providing organisms with a mouldable, space-filling starting material5, which can be delivered on demand for the rapid, yet controlled production of structurally and morphologically complex crystalline biominerals, this biogenic strategy offers a perfect candidate for biomimicry6. Focusing on amorphous calcium carbonate (ACC), it has proven possible to profit from ACC precursor phases to generate CaCO3 microlens arrays at the gas–liquid interface7, single crystals with complex forms via templating approaches8,9, thin films and fibres of calcite and vaterite in the presence of polyelectrolytes2,10,11 and inorganic/organic composites12,13. A range of synthetic approaches have also been used to control the crystallization of ACC. For example, the stability of ACC can be tuned using soluble inorganic and organic additives14,15,16 by association with insoluble matrices17,18 and by varying the particle size19. However, widespread exploitation of ACC in materials synthesis has hitherto been limited by the challenges of characterizing structure14,20,21, tuning stability17, controlling morphologies6 and determining crystallization mechanisms.
A significant contribution to our current understanding of ACC and its crystallization has of course come from the study of biominerals. Biogenic ACC can be classified as either stable or transient, where the stable form is hydrated (with approximate composition CaCO3:H2O) and the transient form anhydrous1. The best characterized transient system is that of the sea urchin embryo, in which tri-radiate, single-crystal calcite spicules form from ACC within a membrane-bound vacuole. The ACC is tightly bound by the membrane such that the system remains free of bulk water4,22,23,24, and under these conditions the initial hydrated ACC is observed to dehydrate to a more stable anhydrous ACC phase, before it subsequently crystallizes via a ‘solid-state’ mechanism24,25. While a comparable stepwise transformation has been observed when ACC is heated in air to drive off the water15,26,27,28,29, the mechanisms of these structural transformations are not yet well understood. By comparison, ACC typically crystallizes very rapidly in aqueous solution, such that characterization of this process has proven extremely challenging30,31,32,33,34,35.
This work therefore employs a bio-inspired strategy to address an intensively debated topic—the crystallization mechanism of ACC–by characterizing the transformation of synthetic ACC in aqueous environments. Encapsulation of ACC particles within porous silica shells provides an effective inorganic mimic of the spicule environment of the sea urchin, thereby sufficiently retarding the crystallization to allow characterization of the transformation. The mechanisms and structural changes that accompany ACC dehydration in air were also investigated in detail with ACC samples with well-defined water contents generated by annealing at different temperatures, and characterizing these using thermogravimetric analysis (TGA) and solid-state NMR. Comparison of both systems demonstrates that while identical dehydration processes can occur both in air and in solution, ACC crystallization at room temperature must be initiated by a local dissolution/reprecipitation, as mediated by water present on the particle surface or in the environment. The majority of the particle can then crystallize via a solid-state transformation.
Results
Crystallization of silica-coated ACC particles
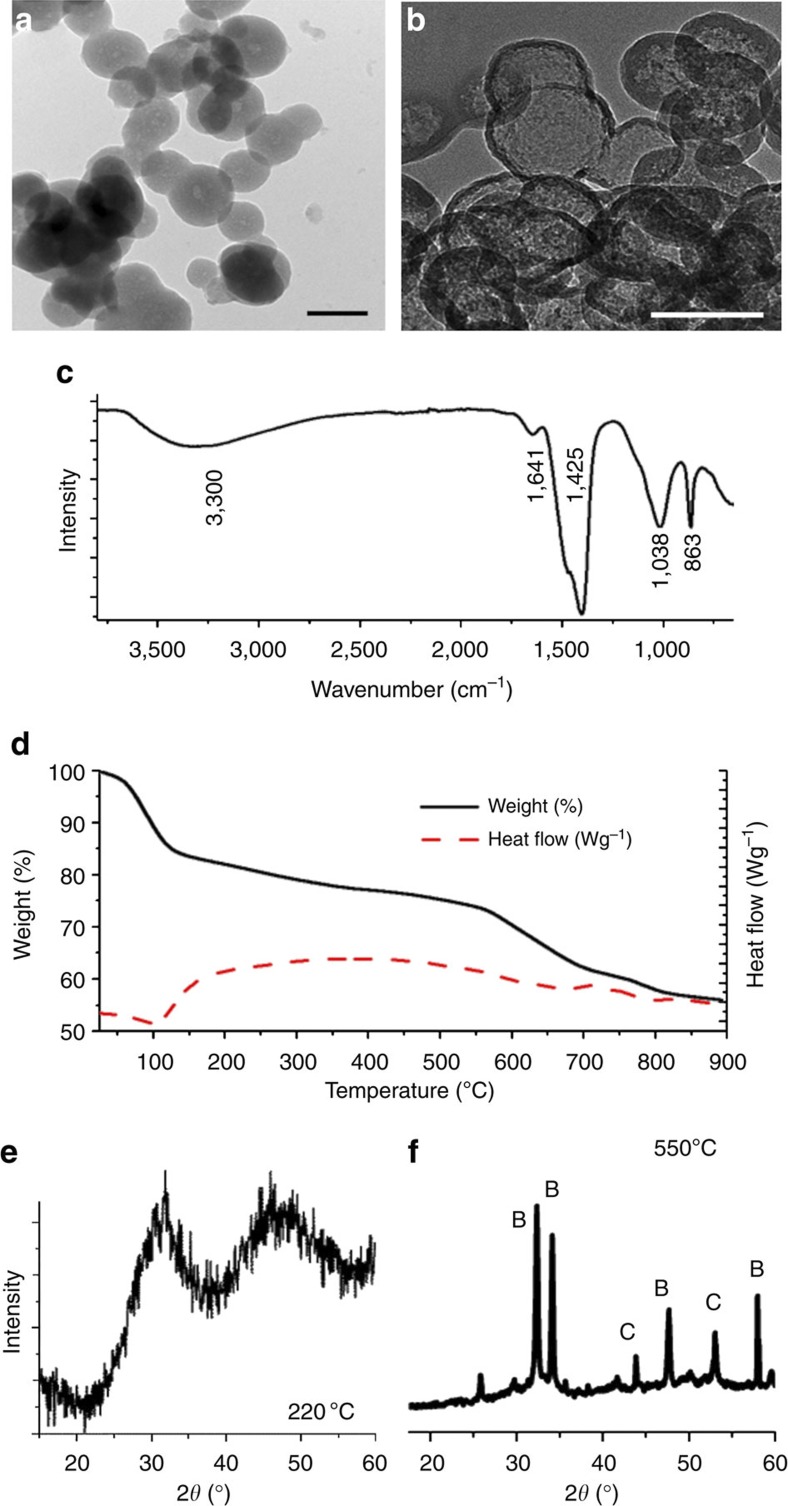
Transmission electron microscopy (TEM) confirmed that the silica-coated ACC particles36 (prepared by simple mixing of solutions of CaCl2 and Na2CO3/Na2SiO3) had diameters of ~100 nm (Fig. 1a), while subsequent leaching of the encapsulated ACC through incubation in 1 M HCl for 24 h demonstrated that a continuous ~5–10 nm thick silica shell forms around each ACC particle (Fig. 1b). Infrared spectra (Fig. 1c) showed bands characteristic of both ACC and amorphous silica, with peaks corresponding to the carbonate group appearing at 1,425 cm−1 (ν3), 1,075 cm−1 (ν1) and 863 cm−1 (ν2), due to water at 1,641 cm−1 and silica at 1,038 cm−1. Bands (ν4) at 747 and 714 cm−1, which are the characteristic of crystalline vaterite and calcite, respectively, were notably absent.
Figure 1. Analysis of as-prepared silica-coated ACC particles ACC-SiO2.
TEM images of (a) ACC-SiO2 particles and (b) silica shells formed after dissolution of the ACC core—scale bar, 100 nm. (c) Infrared spectrum and (d) TGA of ACC-SiO2 particles, and PXRD spectra of ACC-SiO2 particles after heating to (e) 220 °C and (f) 550 °C. B, belite; C, calcite.
TGA of freshly precipitated ACC-SiO2 particles (Fig. 1d) showed an 18–20 wt% loss below 200 °C due to dehydration of the ACC and SiO2, and an additional 7–10 wt% loss between 200–550 °C, attributed to release of CO2 on reaction of the SiO2 shell with the CaCO3. Powder X-ray diffraction (PXRD) was also performed during in situ heating of the ACC-SiO2 particles, where this demonstrated transformation from ACC (Fig. 1e) to Ca2SiO4 (belite) and calcite over 400 °C (Fig. 1f). A gradual weight loss of 18–20 wt% above 550 °C was observed rather than the sharp transition typically observed on conversion of CaCO3 to CaO. TGA of the silica shells alone that is, after leaching out the ACC revealed that they comprise ~20 wt% water (Supplementary Fig. 1). With a 100-nm particle diameter, a 5-nm-thick silica shell, and ACC and hydrated silica (SiO2·H2O) densities of 1.62 g cm−3 (ref. 37) and ~1.9 g cm−3, respectively, the ACC-SiO2 particles have compositions of ~22 wt% SiO2·H2O and ~78 wt% CaCO3·H2O. Given that the unheated ACC-SiO2 particles comprise 20 wt% water, ~4–6 wt% H2O is associated with the SiO2 component and ~14–16 wt% with the ACC.
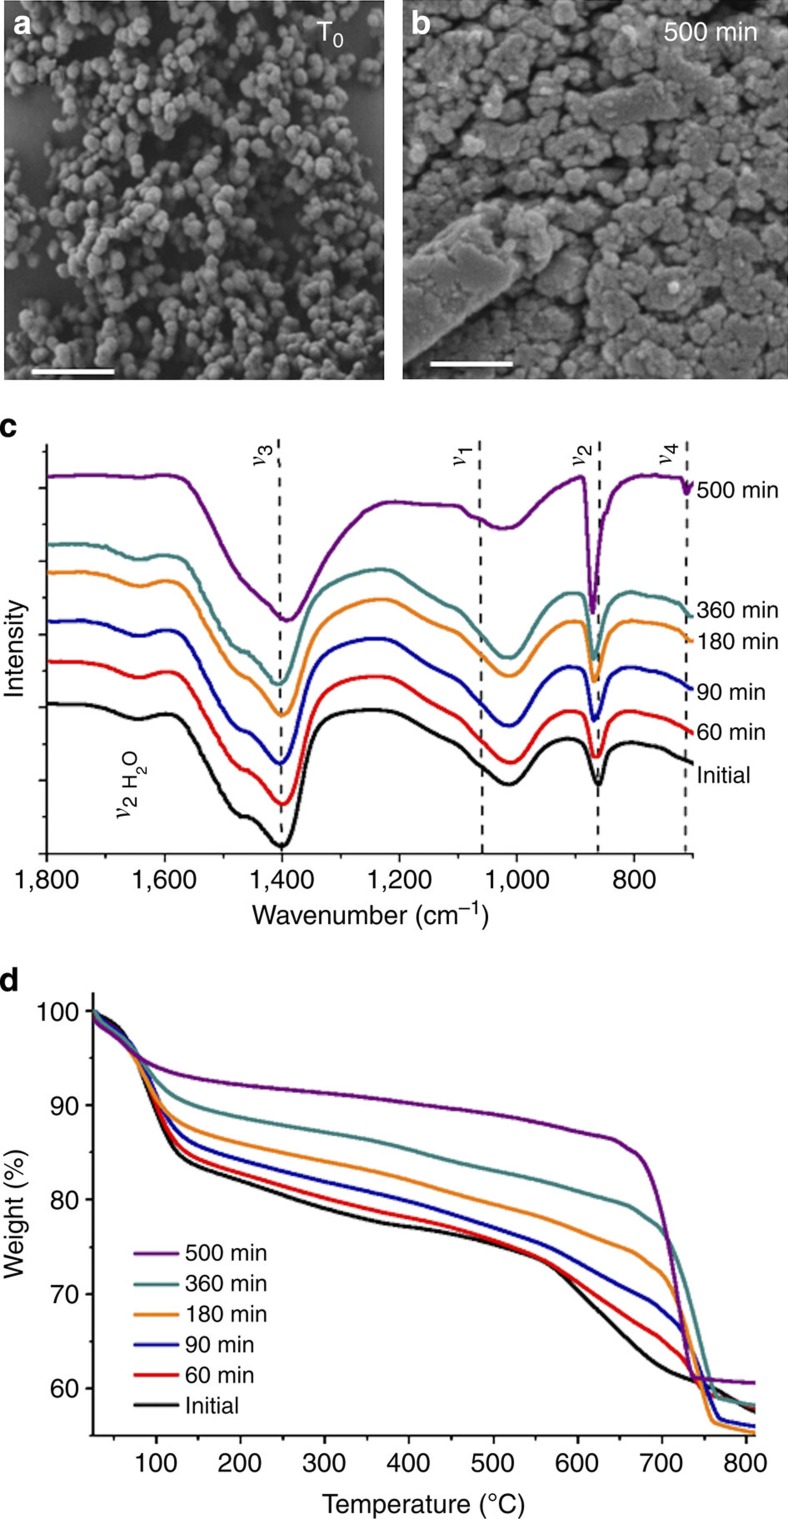
The stability and crystallization in solution of ACC-SiO2 was investigated by resuspending 15 mg particles in 100 ml Milli-Q water and characterizing their structures and compositions with time (Fig. 2). Scanning electron microscopy (SEM) demonstrated the structural stability of the particles and showed that they aggregate during incubation (Fig. 2a,b) where infrared and TGA confirmed that this is accompanied by negligible change in the silica content of the particles (Fig. 2c,d and Supplementary Table 1). Addressing changes that occur in the ACC during their incubation in water, time-dependent infrared measurements (Fig. 2c) revealed a structural rearrangement, as was apparent from a narrowing of the ν3 band, a reduction in intensity of the ν1 absorption band and a shift in the ν2 band. Importantly, this was accompanied by dehydration of the ACC, which occurs before any evidence of crystalline phases is detected. The onset of crystallization occurs after ~8 h, as shown by the appearance of a characteristic calcite peak at 714 cm−1 (ν4).
Figure 2. Dehydration of ACC-SiO2 particles on incubation in solution.
SEM images of ACC-SiO2 particles after incubation in solution for (a) 0 min and (b) 500 min—scale bar, 500 nm. (c) Infrared spectra and (d) thermogravimetric analyses of ACC-SiO2 particles, showing the structural and compositional changes in the particles with incubation in solution.
TGA of ACC-SiO2 samples incubated in solution for different times clearly showed a decrease in the water-associated weight loss under 200 °C from 20 wt% to a constant 6 wt% (due to the SiO2·H2O phase, Fig. 2d). Also observed was the gradual appearance of a sharp CaCO3 to CaO transition above 550 °C (which is observed for uncoated ACC), and a reduction in the weight loss in the intermediate range (200–500 °C) for longer incubation times. Both of these phenomena demonstrate reduced calcium silicate formation in ACC samples with greater degrees of dehydration. This can be explained by the fact that co-precipitation of ACC in the presence of silicate also results in the occlusion of the silicate ions within the ACC, which results in an increase in its thermal stability38. During dehydration/restructuring of the ACC, silicate ions are likely to be expelled, resulting in reduced calcium silicate formation and possibly also the aggregation behaviour observed by SEM. Confirmation that the presence of silicate ions within the ACC does not change the pathway by which it crystallizes was obtained by monitoring the crystallization in water of ACC particles, which were precipitated in the absence of silicate, and then coated with a silica shell. While this method is less satisfactory as it never succeeds in completely coating every ACC particle present, the data obtained clearly demonstrate that the pure ACC particles also dehydrate before recrystallization (Supplementary Fig. 2).
We also explored the combined effects of encapsulation and stabilizing soluble additives with this system. It is well recognized that soluble macromolecules and ions, such as Mg2+, silica, sulphate and phosphate at moderate concentrations (<<[Ca2+]), contribute to the extended lifetime of biogenic ACC22,39,40. However, this alone cannot provide the stability observed for biogenic ACC15, strongly suggesting that the environment of the ACC within an organism also makes a significant contribution to its stability39,41. ACC was therefore precipitated in the presence of the crystallization inhibitor aspartic acid, and its crystallization was investigated. ACC-Asp-SiO2 particles crystallized by an identical pathway (dehydration followed by crystallization) where a small band at ≈700 cm−1 corresponding to crystalline CaCO3 was observed in infrared spectra after 18 h. This compares with the appearance of an equivalent peak at 8 h for ACC-SiO2 and under 1 h for uncoated ACC-Asp15 (Supplementary Fig. 3). The soluble additive and confinement therefore appear to act synergistically in retarding ACC crystallization.
Crystallization of lipid bilayer-coated ACC particles
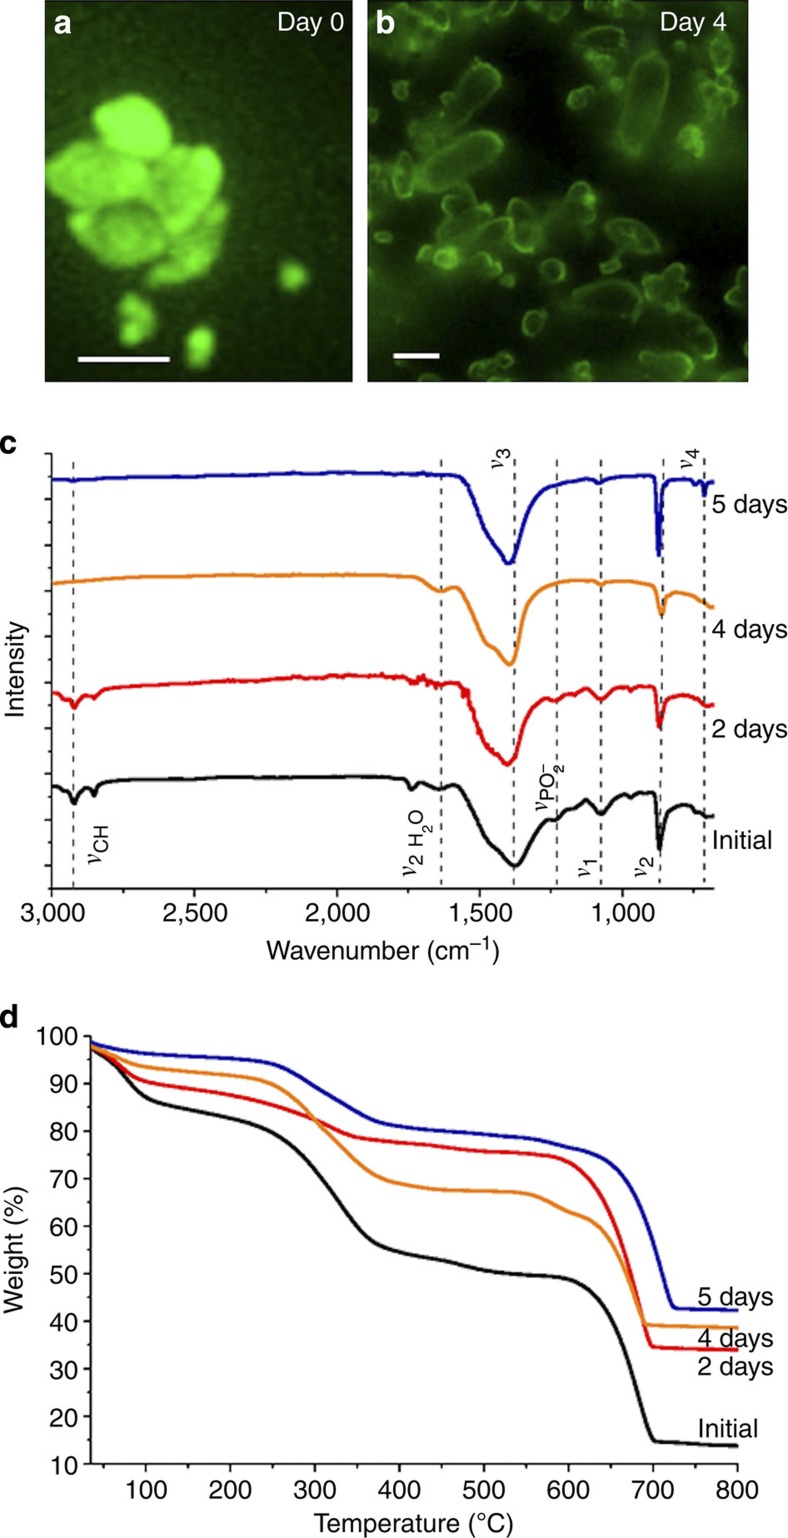
Having demonstrated that encapsulation of ACC within a porous silica shell reduces the rate of ACC crystallization in solution, we extended our approach to explore whether ACC encapsulation within a lipid membrane—as in biological systems4,23—may act in an analogous way. ACC particles were coated with phosphatidylcholine-dihexadecyl phosphate (DHP) membranes using standard methods42, and their stability in Milli-Q water was investigated by isolating and characterizing the coated particles at different times. Laser scanning confocal microscopy, made possible by addition of a fluorescent phosphocholine (PC) molecule to the lipid mixture, demonstrated that the ACC particles were coated by lipid membranes and that they agglomerated with time (Fig. 3a,b). Notably, structural changes in the ACC comparable to those seen during the transformation of ACC-SiO2 were observed on incubation in solution, as shown by a reduction in intensity of the ν1 absorption band and a shift in the ν2 band. There was also a reduction in the intensity of the bands associated with the PC/DHP membrane43, (2,923 cm−1 (νCH) and 1,234 cm−1 (νPO2−)). No bands at 714 cm−1 (calcite) or 747 cm−1 (vaterite) were detected even after 4 days of incubation (Fig. 3c).
Figure 3. Characterization and dehydration of ACC particles coated with lipid bilayers.
Laser scanning confocal microscopy images of aggregates as prepared (a)—scale bar, 1 μm and after 4 days (b) incubation in solution—scale bar, 4 μm, (c) Infrared spectra and (d) thermogravimetric analyses of ACC particles coated with lipid bilayers after certain incubation periods in solution.
TGA of freshly prepared samples showed a weight loss due to lipid decomposition of ~30 wt% between 230 and 530 °C (Fig. 3d). This compares with ~20 wt% loss, estimated for 100 nm ACC spheres coating with single bilayers44, which suggests the presence of multilamellar coatings or additional vesicles. Importantly, the TGA analysis also demonstrated that the coated ACC particles underwent a very slow dehydration during incubation in solution, shown by the loss of water below 230 °C. Indeed, the water content decreased from an initial ~18–20 wt% to 10–13 wt% after 2 days, although the particles were still ACC, as judged by infrared spectroscopy. The mass loss associated with decomposition of organic materials that occurs at 230–530 °C also decreases from ~30 to 16 wt% over 2–4-day incubation. The data therefore indicate that the lipid coating of the ACC particles is lost/undergoes reorganization with time in solution, precluding investigation of extended periods leading to crystallization. However, the data clearly show that a lipid membrane can effectively stabilize ACC and that the ACC dehydrates before crystallization.
Characterization of ACC with different hydration levels
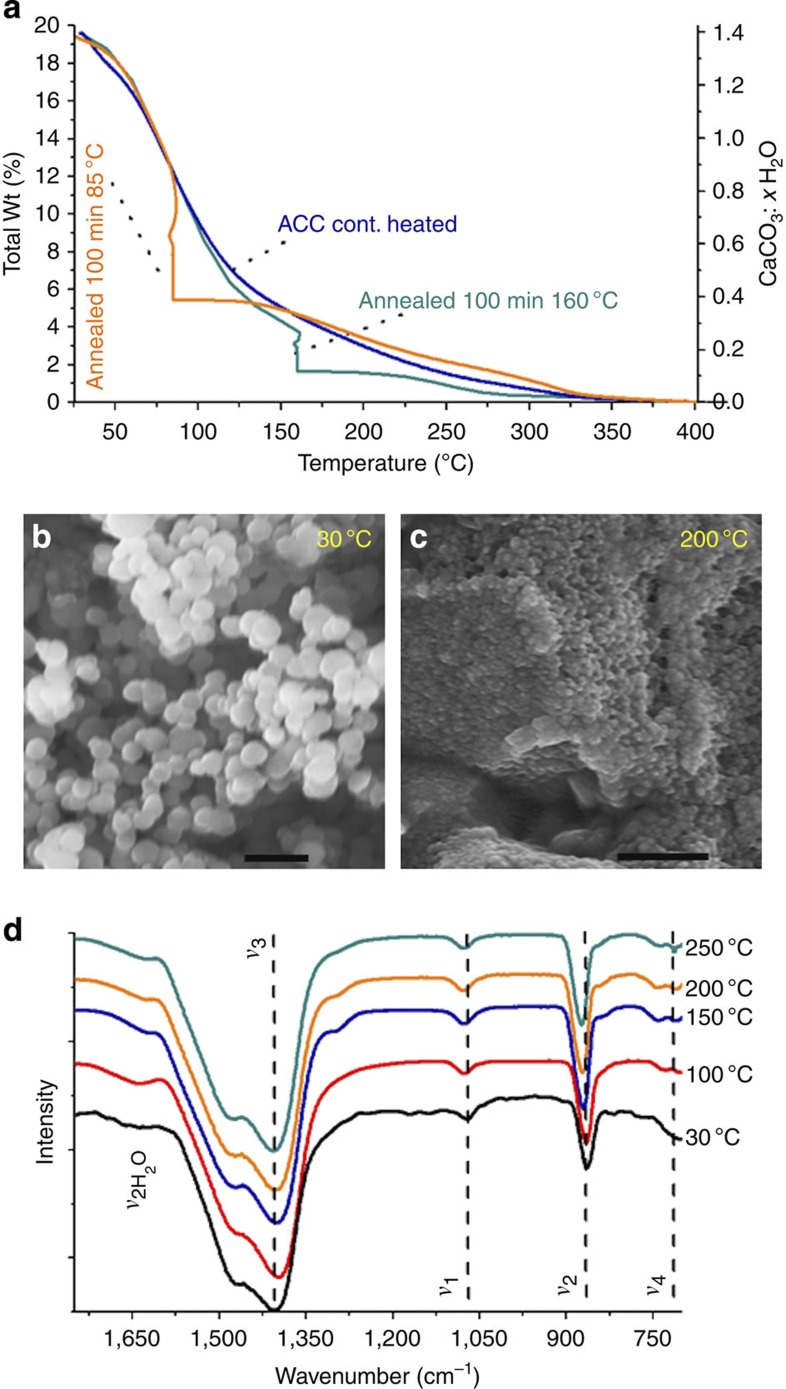
Detailed studies of the transformation from hydrated ACC to anhydrous ACC to crystalline calcite were then performed by annealing ACC samples at specific temperatures. TGA showed that ACC precipitated from the combination of 1 M CaCl2 with 1 M (NH4)2CO3 contained 20±1 wt% water, with 15±1 wt% water structurally associated with the ACC, which is consistent with the commonly reported molecular composition of ~CaCO3:H2O. ACC samples were then heated to, and isothermally annealed at, specific temperatures (between 25 and 220 °C in 5 °C steps) under a N2 stream, until the weight of each sample had stabilized. TGA/differential scanning calorimetry (DSC) was subsequently used to determine the amount of water lost at each temperature, the water fraction remaining and the crystallization onset temperature. Figure 4a shows representative TGA spectra that clearly demonstrate that ACC can be systematically dehydrated by application of defined heating cycles (a full range of curves is given in Supplementary Fig. 4). SEM showed that the 50-nm ACC particles aggregated during heating (Fig. 4b,c), while infrared spectroscopy (Fig. 4d) confirmed that the ACC remained amorphous after each isothermal annealing. Dehydration was accompanied by a structural rearrangement in the ACC, which on careful scrutiny shows up as a narrowing of the ν3 band, a reduction in intensity of the ν1 absorption band and a slight shift in the ν2 band to higher frequencies. Notably, these spectral changes are identical to those observed for ACC samples undergoing crystallization in solution (Fig. 2c). DSC showed that crystallization only occurred at temperatures above 290 °C, regardless of whether samples were continuously heated or whether they had been annealed at different temperatures. Crystallization activation energies of ~100 kJ mol−1 were derived in all cases using standard methods (Supplementary Figs 4 and 5)45 and can be compared with reported values of 73 kJ mol−1 (ref. 31) or 151–304 kJ mol−1 (ref. 28), depending on preparation conditions.
Figure 4. Crystallization of uncoated ACC particles.
(a) Total weight percent water (Total wt%) and corresponding molecular composition (CaCO3: xH2O) from TGA from 25 to 400 °C), electron micrographs with a scale bar, 200 nm after isothermal annealing at 30 °C (b) and 200 °C (c), (d) infrared spectra of ACC particles after a heating procedure involving a ramp (15 °C min−1), followed by isothermal annealing (100 min) and a second ramp (15 °C min−1) all under a 100-ml min−1 N2 flow).
The activation energies associated with liberation of different water fractions were derived as averages of at least six isothermal measurements using equation (1) (ref. 46). Here α (as defined in equation (2)) represents the degree of dehydration, A is a pre-exponential factor, f(α) describes the reaction model and Wmax, Wmin and Wt are the fractions of H2O present at the beginning, end and time t during an isothermal dehydration event.
 |
 |
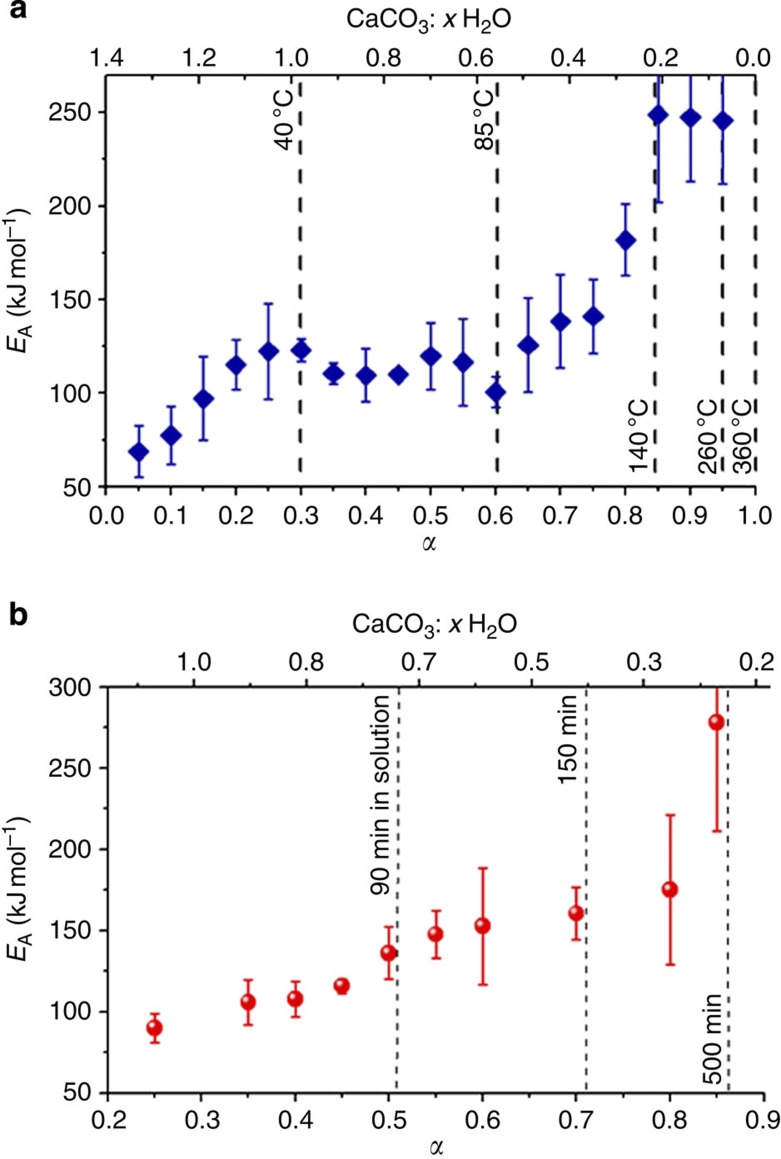
Plots of these activation energies are given in Fig. 5 and show a general increase in the activation energy with increasing dehydration. Further, they indicate the existence of three apparent dehydration regimes. The first shows an increase in Ea up to α~0.2–0.3, which corresponds to the loss of the surface water, while the second corresponds to a plateau regime from 40 to ~85 °C (0.3≤α≤0.6). The Ea then increases to a regime from 140–260 °C (0.85≤α≤1), which is characterized by high activation energies of ~245 kJ mol−1 (Fig. 5a). Estimates of the weight loss and activation energies (Ea) of each of the dehydration regimes are summarized in Table 1. The dehydration of the silica-coated ACC particles in air was also similarly assessed to determine the influence of the silica shell on ACC dehydration. The activation energies also increased as dehydration progressed, although no well-defined plateau regions were observed. The derived activation energies were somewhat higher than for the uncoated ACC in air, demonstrating that the silica coating can retard ACC crystallization by providing a barrier to water loss (Fig. 5b).
Figure 5. Activation energies of dehydration.
The activation energies (Ea) as a function of the degree of dehydration (α)/molecular composition of ACC CaCO3: xH2O (all water) for uncoated ACC particles (a) and ACC-SiO2 particles (b). The error bars are s.d.
Table 1. Summary of data derived from the thermal analysis of uncoated ACC in air.
| ~Wt% range | α | CaCO3: xH2O | Ea (kJ mol−1) |
Dehydration model |
||||
|---|---|---|---|---|---|---|---|---|
| Type | f(α)=kT | R2 | k (°C−1) | |||||
| 25–40 °C | 20 to 14 | 0.0–0.3 | ~1.4–0.98 | 80 | Second-order reaction | [1/(1−α)]−1 | 0.98 | 0.153* |
| 40–140 °C | 14 to 3 | 0.3–0.85 | ~0.98–0.25 | 140 | Contracting volume | 1−(1−α)1/3 | 0.92 | 0.0042 |
| 140–260 °C | 3 to 0.5 | 0.85–0.95 | ~0.25–0.08 | 245 | Second-order nucleation | α1/2 | 0.85 | 0.0031 |
| 25–260 °C | − | − | − | 125 | Contracting volume | 1−(1−α)1/3 | 0.92 | 0.0038 |
α is the degree of dehydration, Ea is the average activation energy associated with water loss for a given temperature range and CaCO3: xH2O shows the number of moles of water associated with 1 CaCO3 formula unit. The best-fit solid-state reaction models (f(α)=kT) are further given together with the associated coefficient of determination R2 and the rate constant, k.
*f(α)=k[min−1]t.
Mechanism of dehydration of ACC
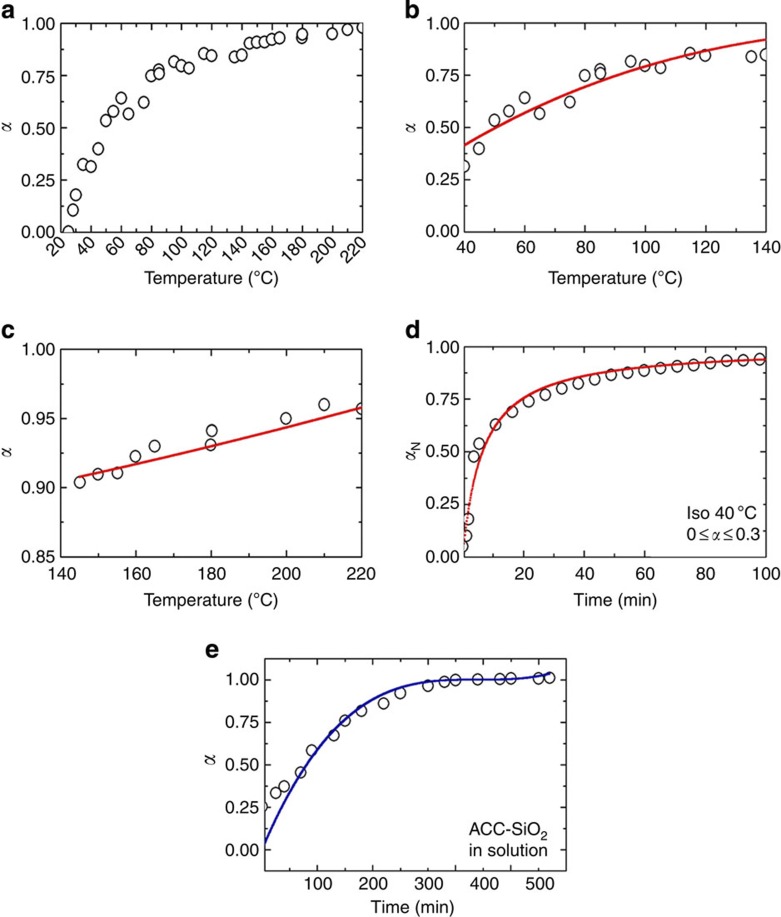
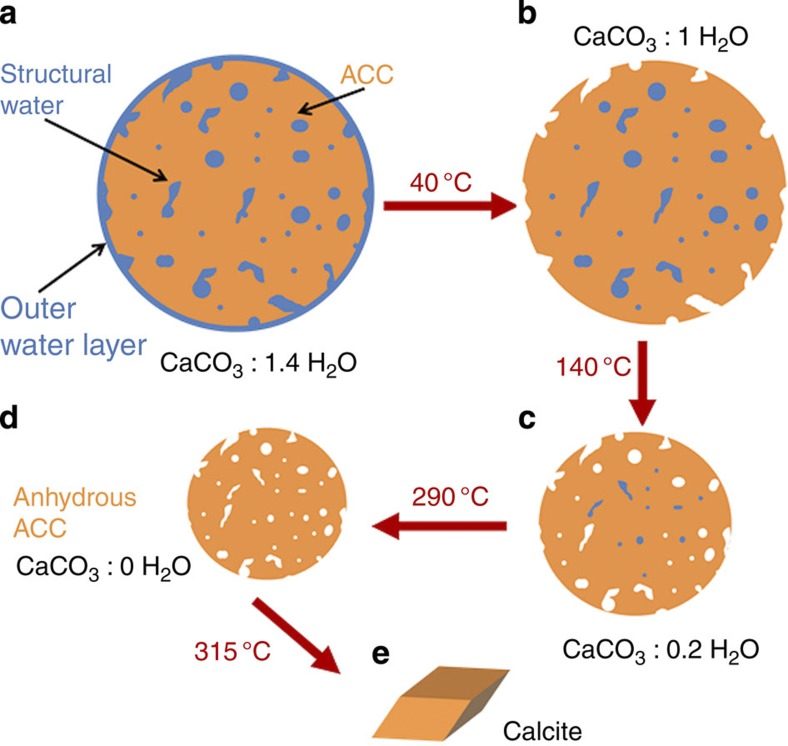
Plots of the gradual dehydration of ACC in air over the range 25–220 °C were derived using α values obtained at the end of each annealing period (Fig. 6). The rate of dehydration decreases at higher temperatures, demonstrating that it becomes increasingly difficult to remove water as the limit of anhydrous ACC is reached, in keeping with the activation energy measurements (Fig. 5). The dehydration curve also provides further insight into the mechanism of dehydration of ACC in air by considering fits to common solid-state reaction models (f(α)) (ref. 47) are presented in Table 1. While the validity of such analysis has been widely debated because of the mathematical interdependence between activation energy, pre-exponential factor and chosen model48,49, this method provides some insight into the dehydration mechanisms that may operate. The full dehydration curve (Fig. 6a) is best described by a geometric contraction model, in which the reaction rapidly initiates on the particle surface and then proceeds towards its centre. The intermediate temperature range (40–140 °C), which represents 65% of the total water fraction, can also be described by the same model (Fig. 6b). In both cases, a contracting sphere provided a slightly better fit than a contracting cylinder, with R2 values of 0.92 and 0.89, respectively, as compared with 0.90 and 0.85. The final dehydration at 140–220 °C, which represents less than 15 wt% of the initial water content, is in contrast best described by a second-order nucleation model (Fig. 6c). Removal of the last water is therefore not diffusion limited but is determined by the barriers to water release. The dehydration regime from 0≤α≤0.3 (~40 °C) is best described by an isothermal process following a second-order rate equation, as is consistent with loss of surface water and common adsorption isotherms (Fig. 6d). The dehydration of the ACC-SiO2 particles in solution as a function of time (Fig. 6e) showed that the overall behaviour from 0.3≤α≤1 obeys an identical three-dimensional model (contracting sphere, R2=0.94) as for the dehydration of uncoated ACC in air. A schematic of the dehydration mechanism according to the overall contraction model is given in Fig. 7. These analyses therefore strongly support the existence of the distinct dehydration regimes identified using the derived activation energies.
Figure 6. Analysis of the progress of dehydration.
Dehydration curves of ACC and ACC-SiO2 particles as a function of temperature (T) or time (t), together with best fits to the common solid-state reaction models described in Table 1. (a) Dehydration of uncoated ACC on heating in air is shown over the range 20–220 °C. Panels b and c show specific ranges of this dehydration process where b shows the range 40–140 °C, and is fitted by a geometric contraction and c shows the range 140–220 °C, which is fitted by a second-order nucleation model. Panel d shows the dehydration of the same sample under isothermal annealing at 40 °C. (e) Dehydration as a function of time for ACC-SiO2 particles on incubation in solution at 25 °C. α is the total fraction of water (as in Fig. 5), while αN refers only to the fraction of water lost over each particular range (from 0 at the start to 1 at the end).
Figure 7. Schematic of stages of dehydration.
On going from a to b, surface-bound water is lost, during b to c water is lost from the interior of the ACC and the ACC particle shrinks. On going from c to d, the most deeply located water is expelled and on going from d to e, crystallization to calcite occurs.
NMR analysis
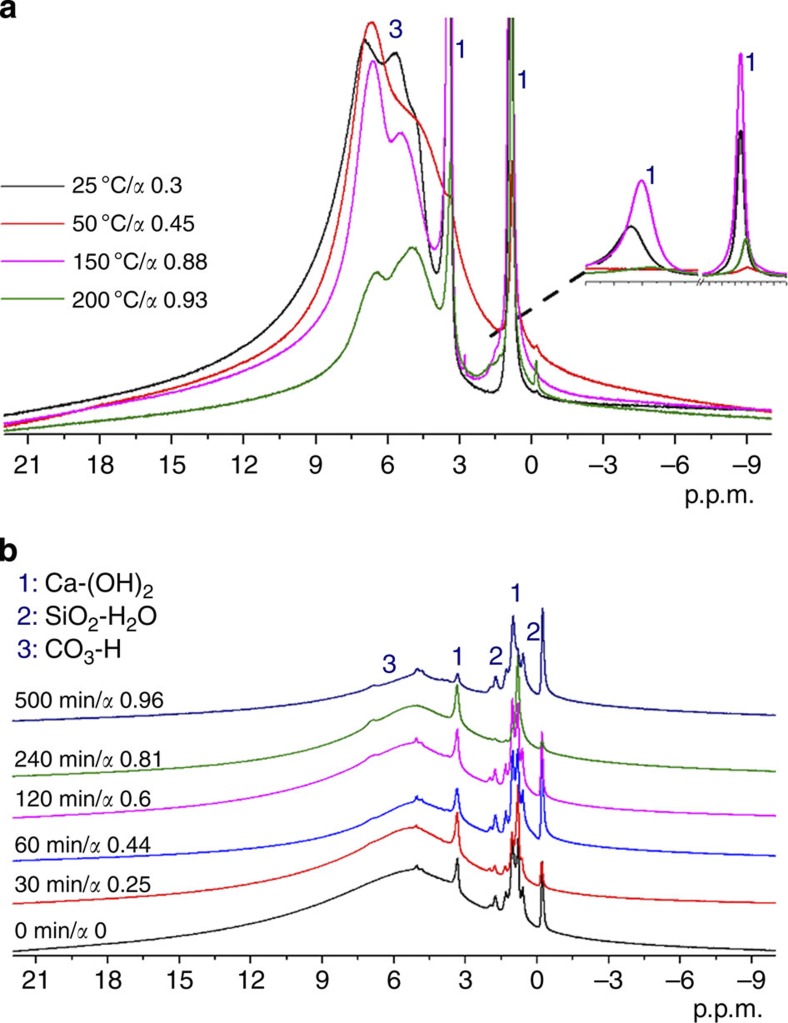
Further insight into the nature of the water environments in hydrated ACC was gained from 1H solid-state NMR (SSNMR) measurements of ACC samples that had been isothermally annealed to different levels of dehydration. Analysis of a fully hydrated sample demonstrated the presence of five different proton environments, namely, a rigid structural phase associated with Ca2+ (two types of OH− at 0.9 and 3.4 p.p.m.), two partially mobile phases due to H2O (4.9, 5.7 p.p.m.) and a signal due to CO32− (H+) framework components (7 p.p.m.; Fig. 8)50. As dehydration progressed, there was little change in the OH− signal, while the 1H signal from H2O and HCO3− decreased. Heating of the samples resulted in coalescence of the 1H signals giving a broader signal centred at ~5.2–5.5 p.p.m., that is, a weighted average of the 4.9 and 5.7 p.p.m. signals. This is due to exchange of protons between the two environments, showing that they are in physical contact. The 1H signal from HCO32− shifts downfield (~6.7 p.p.m.) when the dehydration temperature is increased, suggesting that the 1H in these sites also exchange with water 1H, so that its chemical shift becomes a weighted average of that for the HCO3− site (~7 p.p.m.) and the water sites (4.9, 5.7 p.p.m.). ACC-SiO2 particles with different water contents were also characterized, where these were generated on incubation in solution for different times. Again, as-prepared samples showed the presence of different proton environments within the ACC, along with signals originating in the hydrated SiO2 shell51.
Figure 8. Solid-state NMR analysis.
1H solid-state NMR spectra of (a) uncoated ACC particles and (b) ACC-SiO2 particles with different levels of dehydration, where the ACC-SiO2 particles were dehydrated by incubation in solution and the uncoated ACC particles were dehydrated through isothermal heating.
Discussion
By employing a bio-inspired strategy, where encapsulation of ACC particles within silica shells retards crystallization, we here show that in common with biomineralization processes and the transformation of ACC in air, synthetic ACC also dehydrates at room temperature in an aqueous environment. This is driven by the generation of a more stable, low water content ACC phase26. Characterization of this dehydration process revealed a strong dependence of the activation energy required to remove water on the degree of dehydration. The activation energies required to remove the first water fractions (up to 0.3 H2O) are close to the hydration energy of calcite faces in a humid atmosphere52, as expected if the first stage of dehydration removes more accessible water of hydration. Note that this is far more than monolayer coverage of water on the outer surface of the ACC particles, and undoubtedly includes water condensed around the contact points of adjacent particles as well as some more deeply located water. The higher activation energies measured for the remaining fractions may reflect the increasingly hindered escape of water molecules in low humidity environments53.
Although it has been noted that a mechanistic interpretation of the magnitudes of activation energies for solid-state reactions is well-nigh impossible54, the results are in good agreement with modelling studies of ACC dehydration. These predict an increase in hydration energy with increasing degrees of dehydration owing to the formation of a stronger hydrogen-bond network surrounding neighbouring Ca2+ and CO32− ions55. This may also be associated with the observed structural reorganization of the ACC during heating. A model of ACC dehydration has also been predicted by combined computer simulations and structural studies of synthetic ACC (CaCO3·H2O)56, which suggested that the water molecules in hydrated ACC are located, along with carbonate ions, within a network of nanoporous channels in a Ca2+-rich framework. These channels could therefore provide a conduit for loss of water during dehydration, where this process would also be accompanied by a structural rearrangement in which CO32− ions relocate from the channels into the calcium framework. Again, channels may close at higher levels of dehydration. The results obtained in this work are consistent with either model.
Our study also provides insight into the crystallization process itself. Considering first dry ACC, crystallization is only observed at temperatures of ~300 °C, where this is triggered by/coincides with the loss of the final water fraction. With no water present, the transformation of anhydrous ACC to calcite must proceed by a solid-state transformation. Indeed, our experiments show that the final dehydration step is associated with a very high activation energy of ~245 kJ mol–1. Activation energies of dehydration of crystalline solids vary widely but are typically of the order of 100 kJ mol−1 (ref. 54). That ACC crystallizes very rapidly in solution at room temperature indicates that this must occur by an alternative mechanism with a lower-energy barrier. Indeed, when isolated, ACC only shows extended stability when washed with solvents such as ethanol, which can substitute for much of the surface water57. Even then, the rate of crystallization is dependent on the ambient humidity. Further, ACC that has no surface-bound water (as prepared by freeze drying) is extremely stable, only crystallizing under normal levels of humidity after 6 weeks58.
These data therefore strongly suggest that while ACC can certainly dehydrate at room temperature, the free energy barrier to nucleation is such that formation of the first crystalline phase can only occur via a partial dissolution/reprecipitation. We emphasize that we are not proposing that the ACC fully dissolves and then reprecipitates. Instead, this would appear most probably to occur within a domain on the surface of an ACC particle, or could happen within an ACC particle containing pockets of entrapped water. Crystallization of the entire ACC particle can then occur by a solid-state transformation, which has also been termed secondary nucleation59, where the presence of the crystal nucleus induces structural changes in the adjacent ACC24; the low water content of the ACC precludes local dissolution/crystallization. Such a transformation is supported by the structural changes that accompany dehydration of the ACC. The transformation mechanism of ACC at room temperature is therefore defined by a balance between the rates of dehydration and dissolution/reprecipitation. ACC with surface water would be expected to transform via the solid-state mechanism mentioned above, while a full dissolution/reprecipitation mechanism would be anticipated for ACC in bulk solution.
These mechanisms are also consistent with data presented in the literature. In situ small angle X-ray scattering/wide angle X-ray scattering studies of CaCO3 precipitation in concentrated (1 M) solutions have suggested that initial dehydration or reorganization of ACC, followed by direct transformation to vaterite, occurs at early reaction times, before changing to a dissolution-reprecipitation mechanism30,31. Evidence for a direct transformation also comes from cryo-TEM studies of ACC transformation into vaterite, which revealed the development of nuclei within the ACC particles32. Further support for nucleation of the new crystal phase within ACC comes from observations that ACC typically aggregates before direct transformation into a crystal60 that ACC particles crystallize more slowly in small volumes with few particles present,61,62 and that small ACC particles show greater stability19. Once initial nuclei of vaterite or calcite are established, subsequent growth occurs via dissolution of the surrounding ACC, as shown by depletion zones around crystal nuclei17,63, through measurements of the changes in the solution composition on crystallization33,34 and by simultaneous small angle X-ray scattering/wide angle X-ray scattering studies of CaCO3 precipitation30,31,35.
Looking beyond CaCO3, our results are also relevant to many other natural or synthetic transformations, such as amorphous titania to anatase or rutile, or ferrihydrite to goethite or haematite. These are hydrated, metastable, amorphous or nanocrystalline phases transforming after an initial dehydration, either thermally or in aqueous solution64. Similarly, a dissolution-recrystallization mechanism or a solid-state transformation have been proposed for the transformation of ferrihydrite, to haematite or goethite65. However, it is generally agreed that haematite formation involves an ‘internal’ dehydration (about a 25% weight loss) followed by crystallization, possibly by a topotactic route. Further examples are the dehydration of crystal hydrates, which often proceeds via an amorphous phase, as dehydration often destroys a crystal lattice54. Just as with ACC, the precise mechanisms of these transformations are still being vigorously debated.
In conclusion, our data provide insight into the mechanisms of transformation of ACC to crystalline polymorphs in biological, environmental and synthetic systems. Thermal analysis and SSNMR demonstrated that ACC undergoes parallel dehydration and structural changes both in solution and in air where these processes enable a subsequent ‘solid-state’ transformation. The water in ACC exists in different environments and it is the loss of the final component that triggers crystallization. This step is associated with a high free energy barrier such that at room temperature the first crystal nucleus can only form via a dissolution/reprecipitation mechanism mediated by water present on particle surfaces or in solution. The majority of the structural water present within hydrated ACC is therefore of little importance to its stability, but plays a key role in the initial precipitation of ACC, lowering the energy barrier towards the formation of this hydrated phase compared with the anhydrous crystalline polymorphs. Through application of a bio-inspired strategy, we also show that confinement stabilizes ACC, most probably by creating a barrier to water diffusion, by retarding dissolution/reprecipitation-based nucleation and by limiting ACC aggregation. This effect is enhanced in the presence of crystallization inhibitors, suggesting that nature employs both biomacromolecules and confinement to tailor the stability of ACC in organisms. CaCO3 is not unique in this multi-step crystallization pathway, and the mechanisms observed are likely to provide new insight into the formation of many common natural and synthetic materials.
Methods
Materials and general preparative methods
Analytical grade (NH4)2CO3, CaCl2·2H2O and L-aspartic acid sodium salt monohydrate were purchased from Sigma-Aldrich and used as received. Na2SiO3 solution (1.35 g cm−3) was from Merck Chemicals, and aqueous stock solutions were prepared using Milli-Q water, 18.2 MΩcm. Stock solutions of L-α PC (1,2-dipalmitoyl-sn-glycero-3-phosphatidylcholine, >99%, Sigma) were prepared in HPLC-grade chloroform. Glassware used to prepare solutions was soaked overnight in 10% w/v NaOH, followed by rinsing with dilute HCl and finally washing with Milli-Q water. Glass slides and crystallizing dishes were placed overnight in Piranha solution (70:30 wt% H2SO4: H2O2) and then washed copiously with Milli-Q water before drying with acetone.
Preparation of ACC
Except where otherwise noted, ACC was produced by combining equal volumes (0.5–1.5 ml) of 1 M (NH4)2CO3 (pH 9.15) with 1 M CaCl2 (pH ~6.8) at 4 °C, and the ACC precipitate was immediately filtered through a 0.45-μm Isopore GTTP membrane filter (Millipore) before washing with ethanol, and drying over silica gel for 1 h.
Synthesis of ACC-silica particles and hollow silica shells
ACC particles encapsulated in silica shells were synthesized following Kellermeier et al.36 In brief, 125 ml of 10 mM CaCl2·2H2O was mixed with 125 ml of 10 mM Na2CO3/6 mM Na2SiO3 solution, and the precipitates generated were incubated in the reaction solution for 10 min to allow formation of a silica shell. The solutions were then filtered using a 0.45-μm Isopore GTTP membrane filter (Millipore) and washed with ethanol before being left to dry. The dried ACC-silica particles (~15 mg) were subsequently dispersed in 100 ml of Milli-Q water and aliquots were removed at different times to investigate the crystallization mechanisms. Confirmation of encapsulation of ACC was obtained by leaching the ACC from the silica shell by immersing ~500 mg of ACC-SiO2 particles in 1 M HCl (50 ml) for 24 h.
Dehydration of aspartic acid-stabilized ACC-silica particles
Silica-coated ACC particles stabilized with Asp were synthesized by combining equal volumes of 10 mM Na2CO3/6 mM Na2SiO3 and 10 mM CaCl2·2H2O/5 mM aspartic acid. The onset time of crystallization of these particles was then compared with that of pure ACC-silica particles, prepared as above.
Synthesis of pure ACC particles coated with silica shells
ACC was also synthesized in the absence of silica and was then coated with a silica shell. This method enables characterization of the transformation of ACC in the absence of occluded silica but suffers from the limitation that a fraction of the original ACC particles are not completely coated, and therefore crystallize rapidly. ACC was prepared by direct combination of 0.5 ml of 20 mM CaCl2·2H2O with 0.5 ml of 20 mM Na2CO3. Post-deposition of silica was then achieved by the delayed addition (4 s after preparing the ACC) of 1 ml of 12 mM Na2SiO3. The transformation of these silica-coated ACC particles in water was then studied using infrared and TGA as described for ACC containing silica.
Synthesis of ACC particles coated with lipid bilayers
Precipitated and dried ACC particles were coated with bilayers of L-α PC and DHP according to the method of Bugni42. ACC (5–25 mg) was dispersed in 1 ml of ethanol and were briefly sonicated (1–2 s), before depositing them on a glass slide and leaving to dry at 40 °C. Approximately 0.2 ml of a lipid stock solution (100 mg PC and 10 mg DHP per ml chloroform) was then applied dropwise to the ACC film, before rapidly evaporating the solvent under nitrogen. Subsequently, the resulting ACC bilayer aggregates were placed in 100 ml of Milli-Q Water and were gently agitated to displace them from the glass support. The transformation mechanism of the ACC bilayer particles was investigated by removing and analysing aliquots with time. The lipid bilayer coating on the ACC was confirmed using confocal fluorescence microscopy where particles were coated using a lipid stock solution containing PC labelled with a fluorescent group (1 wt% NBD-labelled PC (1-oleoyl-2-[12-[(7-nitro-2-1.3-benzoxadiazol-4-yl)amino]dodecanoyl]-sn-glycero-3-phosphocholine) (Avanti Polar Lipids).
Preparation of ACC with different hydration levels
ACC containing different amounts of structural water was obtained by the simple heating and subsequent isothermal storage of ACC particles prepared in the standard manner. Samples were heated in a nitrogen atmosphere using a TA Instruments STD Q600 at a rate of 15 °C min−1 and were then maintained at the desired temperature until the weight stabilized, as judged by <1 wt% change over 100 min. Samples were then stored over silica gel before analysis. The isothermal annealing was carried out at 5 °C intervals in the temperature range 25–200 °C. Samples for NMR analysis were maintained at 40 °C for 1 h before the measurements to avoid transformation during the analysis58.
Analysis of dehydration progress
The mechanism of dehydration of uncoated ACC in air under thermal treatment and ACC particles encapsulated in silica shells was investigated by replotting the weight loss curves as dehydration curves showing the fractional loss of total water (α) (below 400 °C) as a function of temperature using the water fraction present at the end of each isothermal period. These were then fitted to the results expected from common solid-state reaction models. For comparison, progressive dehydration of the ACC-SiO2 particles in solution at 25 °C was considered as a function of incubation time in solution, where α values were determined by TGA analysis (weight loss below 200 °C). Activation energies associated with the dehydration of ACC at different degrees of hydration, CaCO3.xH2O, in air were obtained by isoconversion methods based on recorded overlapping α values during isothermal storage present in flanking isotherms. A plot of ln(dα/dt)α versus 1/T, where the value of (dα/dt)α is determined for each isothermal dehydration event and temperature T, returns a straight line of gradient—Ea/R.
Characterization
The CaCO3 precipitates were characterized by infrared spectroscopy, PXRD, TGA, DSC, SEM, TEM and SSNMR. Crystal morphologies were characterized using SEM by mounting glass slides supporting the CaCO3 particles on SEM stubs using adhesive conducting pads and coating with Pt/Pd. Imaging was performed using a LEO 1,530 Gemini FEG-SEM operating at 3 kV or a FEI Nona NanoSEM 650. TEM was carried out using a FEI Tecnai TF20 FEGTEM fitted with an high-angle annular dark field detector and a Gatan Orius SC600A charge-coupled device camera, operating at 200 kV. Fluorescent confocal microscopy was performed using an Inverted Olympus IX-70 wide-field microscope with 100 W mercury illumination epifluorescence and differential interference contrast optics.
Individual crystal polymorphs and initial amorphous character were confirmed with infrared spectroscopy using a Perkin Elmer attenuated total reflectance-infrared. Further confirmation of polymorphs and polymorphic transitions was obtained with PXRD using a Bruker D8 Advanced diffractometer equipped with a CuKα1 X-ray source and internal heating stage. Samples were placed on a silicon wafer, and XRD data were collected at angles from 5° to 70° in intervals of 0.02, with a scan rate of 1° min−1. Polymorphic transitions were also followed using DSC (TA Instruments DSC Q200), with a heating rate of 10–25 °C min−1 under a nitrogen flow rate of 100 ml min−1. The compositions of the different ACC samples were investigated using TGA, where data were recorded using a TA Instruments STD Q600, with a heating rate of 10–25 °C min−1 under a 100-ml min−1 N2 flow. SSNMR experiments were performed using standard methodologies with a Bruker 9.4 Tesla Avance-400 wide bore spectrometer, at frequencies of 400.1 MHz (1H). One-dimensional data sets were acquired on samples spun at 10 kHz using MAS (1H π/2 pulse length 2.5 μs, contact time 2.5 ms, at a 1H field strength of 100 kHz) and a repetition time of 2 s was employed in all experiments. On occasions where there was insufficient material to fill a 4-mm outer diameter rotor, the unfilled volume was taken up with polytetrafluoroethylene tape. The number of scans acquired depended on the quantity of available sample, and was generally between 256 and 512.
Author contributions
J.I. performed experiments, analysed data and wrote the paper; W.C.W. and M.J.D. collected and interpreted SSNMR spectra. E.H.N., A.N.K. and Y.-Y.K. performed preliminary experiments. H.K.C. gave conceptual advice and wrote the paper. F.C.M. supervised the project and wrote the manuscript.
Additional information
How to cite this article: Ihli, J. et al. Dehydration and crystallization of amorphous calcium carbonate in solution and in air. Nat. Commun. 5:3169 doi: 10.1038/ncomms4169 (2014).
Supplementary Material
Supplementary Figures 1-5 and Supplementary Table 1
Acknowledgments
This work was supported by an Engineering and Physical Sciences Research Council Leadership Fellowship (F.C.M., J.I. and Y.-Y.K., EP/H005374/1), EPSRC Grant EP/K006304/1 and EPSRC DTA studentship (W.C.W.). F.C.M. is also supported by an EPSRC Programme Grant (Grant number EP/I001514/1), which funds the Materials Interface with Biology consortium.
References
- Addadi L., Raz S. & Weiner S. Taking advantage of disorder: amorphpous clacium carbonate and its roles in biomineralization. Adv. Mater. 15, 959–970 (2003). [Google Scholar]
- Gower L. B. Biomimetic model systems for investigating the amorphous precursor pathway and its role in biomineralization. Chem. Rev. 108, 4551–4627 (2008). [DOI] [PMC free article] [PubMed] [Google Scholar]
- Mahamid J., Sharir A., Addadi L. & Weiner S. Amorphous calcium phosphate is a major component of the forming fin bones of zebrafish: Indications for an amorphous precursor phase. Proc. Natl Acad. Sci. USA 105, 12748–12753 (2008). [DOI] [PMC free article] [PubMed] [Google Scholar]
- Beniash E., Aizenberg J., Addadi L. & Weiner S. Amorphous calcium carbonate transforms into calcite during sea urchin larval spicule growth. Proc. Biol. Sci. 264, 461–465 (1997). [Google Scholar]
- Yang L., Killian C. E., Kunz M., Tamura N. & Gilbert P. U. P. A. Biomineral nanoparticles are space-filling. Nanoscale 3, 603–609 (2011). [DOI] [PubMed] [Google Scholar]
- Meldrum F. & Cölfen H. Controlling mineral morphologies and stuctures in biological and synthetic systems. Chem. Rev. 108, 4332–4432 (2008). [DOI] [PubMed] [Google Scholar]
- Lee K. et al. Self-assembly of amorphous calcium carbonate microlens arrays. Nat. Commun. 3, 725 (2012). [DOI] [PMC free article] [PubMed] [Google Scholar]
- Li C. & Qi L. M. Bioinspired fabrication of 3D ordered macroporous single crystals of calcite from a transient amorphous phase. Angew. Chem. Int. Ed. 47, 2388–2393 (2008). [DOI] [PubMed] [Google Scholar]
- Finnemore A. S. et al. Nanostructured calcite single crystals with gyroid morphologies. Adv. Mater. 21, 3928–3932 (2009). [Google Scholar]
- Cantaert B. et al. Think positive: phase separation enables a positively charged additive to induce dramatic changes in calcium carbonate morphology. Adv. Funct. Mater. 22, 907–915 (2012). [Google Scholar]
- Olszta M. J., Gajjeraman S., Kaufman M. & Gower L. B. Nanofibrous calcite synthesized via a solution-precursor-solid mechanism. Chem. Mater. 16, 2355–2362 (2004). [Google Scholar]
- Gebauer D. et al. A transparent hybrid of nanocrystalline cellulose and amorphous calcium carbonate nanoparticles. Nanoscale 3, 3563–3566 (2011). [DOI] [PubMed] [Google Scholar]
- Oaki Y., Kajiyama S., Nishimura T., Imai H. & Kato T. Nanosegregated amorphous composites of calcium carbonate and an organic polymer. Adv. Mater. 20, 3633–3637 (2008). [Google Scholar]
- Lam R. S. K., Charnock J. M., Lennie A. & Meldrum F. C. Synthesis-dependant structural variations in amorphous calcium carbonate. Cryst. Eng. Comm. 9, 1226–1236 (2007). [Google Scholar]
- Ihli J., Kim Y. Y., Noel E. H. & Meldrum F. C. The effect of additives on amorphous calcium carbonate (acc): janus behavior in solution and the solid state. Adv. Funct. Mater. 23, 1575–1585 (2013). [Google Scholar]
- Bentov S., Weil S., Glazer L., Sagi A. & Berman A. Stabilization of amorphous calcium carbonate by phosphate rich organic matrix proteins and by single phosphoamino acids. J. Struct. Biol. 171, 207–215 (2010). [DOI] [PubMed] [Google Scholar]
- Han T. Y. J. & Aizenberg J. Calcium carbonate storage in amorphous form and its template-induced crystallization. Chem. Mater. 20, 1064–1068 (2008). [Google Scholar]
- Aizenberg J., Muller D. A., Grazul J. L. & Hamann D. R. Direct fabrication of large micropatterned single crystals. Science 299, 1205–1208 (2003). [DOI] [PubMed] [Google Scholar]
- Nudelman F., Sonmezler E., Bomans P. H. H., de With G. & Sommerdijk N. Stabilization of amorphous calcium carbonate by controlling its particle size. Nanoscale 2, 2436–2439 (2010). [DOI] [PubMed] [Google Scholar]
- Goodwin A. L. et al. Nanoporous structure and medium-range order in synthetic amorphous calcium carbonate. Chem. Mater. 22, 3197–3205 (2010). [Google Scholar]
- Politi Y. et al. Structural characterization of the transient amorphous calcium carbonate precursor phase in sea urchin embryos. Adv. Funct. Mater. 16, 1289–1298 (2006). [Google Scholar]
- Aizenberg J., Lambert G., Addadi L. & Weiner S. Stabilization of amorphous calcium carbonate by specialized macromolecules in biological and synthetic precipitates. Adv. Mater. 8, 222–226 (1996). [Google Scholar]
- Beniash E., Addadi L. & Weiner S. Cellular control over spicule formation in sea urchin embryos: a structural approach. J. Struct. Biol. 125, 50–62 (1999). [DOI] [PubMed] [Google Scholar]
- Politi Y. et al. Transformation mechanism of amorphous calcium carbonate into calcite in the sea urchin larval spicule. Proc. Natl Acad. Sci. USA 105, 17362–17366 (2008). [DOI] [PMC free article] [PubMed] [Google Scholar]
- Gong Y. U. T. et al. Phase transitions in biogenic amorphous calcium carbonate. Proc. Natl Acad. Sci. USA 109, 6088–6093 (2012). [DOI] [PMC free article] [PubMed] [Google Scholar]
- Radha A. V., Forbes T. Z., Killian C. E., Gilbert P. U. P. A. & Navrotsky A. Transformation and crystallization energetics of synthetic and biogenic amorphous calcium carbonate. Proc. Natl Acad. Sci. USA 107, 16438–16443 (2010). [DOI] [PMC free article] [PubMed] [Google Scholar]
- Günther C., Becker A., Wolf G. & Epple M. In vitro synthesis and structural characterization of amorphous calcium carbonate. Z. Anorg. Allg. Chem. 631, 2830–2835 (2005). [Google Scholar]
- Koga N., Nakagoe Y. & Tanaka H. Crystallization of amorphous calcium carbonate. Thermochim. Acta 318, 239–244 (1998). [Google Scholar]
- Xu X., Han J. T., Kim D. H. & Cho K. Two modes of transformation of amorphous calcium carbonate films in air. J. Phys. Chem. B 110, 2764–2770 (2006). [DOI] [PubMed] [Google Scholar]
- Bots P., Benning L. G., Rodriguez-Blanco J. D., Roncal-Herrero T. & Shaw S. Mechanistic insights into the crystallization of amorphous calcium carbonate (ACC). Cryst. Growth Des. 12, 3806–3814 (2012). [Google Scholar]
- Rodriguez-Blanco J. D., Shaw S. & Benning L. G. The kinetics and mechanisms of amorphous calcium carbonate (ACC) crystallization to calcite, via vaterite. Nanoscale 3, 265–271 (2011). [DOI] [PubMed] [Google Scholar]
- Pouget E. M. et al. The initial stages of template-controlled CaCO3 formation revealed by Cryo-TEM. Science 323, 1455–1458 (2009). [DOI] [PubMed] [Google Scholar]
- Brecevic L. & Nielsen A. E. Solubility of amorphous calcium carbonate. J. Cryst. Growth 98, 504–510 (1989). [Google Scholar]
- Sawada K. The mechanisms of crystallization and transformation of calcium carbonates. Pure Appl. Chem. 69, 921–928 (1997). [Google Scholar]
- Pontoni D., Bolze J., Dingenouts N., Narayanan T. & Ballauff M. Crystallization of calcium carbonate observed in-situ by combined small- and wide-angle X-ray scattering. J. Phys. Chem. B 107, 5123–5125 (2003). [Google Scholar]
- Kellermeier M. et al. Stabilization of amorphous calcium carbonate in inorganic silica-rich environments. J. Am. Chem. Soc. 132, 17859–17866 (2010). [DOI] [PubMed] [Google Scholar]
- Liu J. et al. Evaluation of the particle growth of amorphous calcium carbonate in water by means of the porod invariant from SAXS. Langmuir 26, 17405–17412 (2010). [DOI] [PubMed] [Google Scholar]
- Gal A., Weiner S. & Addadi L. The stabilizing effect of silicate on biogenic and synthetic amorphous calcium carbonate. J. Am. Chem. Soc. 132, 13208–13211 (2010). [DOI] [PubMed] [Google Scholar]
- Gal A. et al. Calcite crystal growth by a solid-state transformation of stabilized amorphous calcium carbonate nanospheres in a hydrogel. Angew. Chem. Int. Ed. 52, 4867–4870 (2013). [DOI] [PubMed] [Google Scholar]
- Sato A. et al. Glycolytic intermediates induce amorphous calcium carbonate formation in crustaceans. Nat. Chem. Biol. 7, 197–199 (2011). [DOI] [PubMed] [Google Scholar]
- Wang Y.-W., Christenson H. K. & Meldrum F. C. Confinement leads to control over calcium sulfate polymorph. Adv. Funct. Mater. 23, 5615–5623 (2013). [Google Scholar]
- Ross E. E., Mok S.-W. & Bugni S. R. Assembly of lipid bilayers on silica and modified silica colloids by reconstitution of dried lipid films. Langmuir 27, 8634–8644 (2011). [DOI] [PubMed] [Google Scholar]
- Pohle W. et al. FTIR-spectroscopic characterization of phosphocholine-headgroup model compounds. J. Mol. Struct. 563–564, 463–467 (2001). [Google Scholar]
- Huang C. & Mason J. T. Geometric packing constraints in egg phosphatidylcholine vesicles. Proc. Natl Acad. Sci. USA 75, 308–310 (1978). [DOI] [PMC free article] [PubMed] [Google Scholar]
- Patel A. & Pratap A. Kinetics of crystallization of Zr52Cu18Ni14Al10Ti6 metallic glass. J. Therm. Anal. Calorim. 107, 159–165 (2012). [Google Scholar]
- Adnadevic B., Mojovic Z., Abu Rabi A. & Jovanovic J. Isoconversional kinetic analysis of isothermal selective ethanol adsorption on zeolite type NaZSM-5. Chem. Eng. Technol. 30, 1228–1234 (2007). [Google Scholar]
- Khawam A. & Flanagan D. R. Solid-state kinetic models: basics and mathematical fundamentals. J. Phys. Chem. B 110, 17315–17328 (2006). [DOI] [PubMed] [Google Scholar]
- Galwey A. K. & Brown M. E. Arrhenius parameters and compensation behaviour in solid-state decompositions. Thermochim. Acta 300, 107–115 (1997). [Google Scholar]
- Koga N. A review of the mutual dependence of Arrhenius parameters evaluated by the thermoanalytical study of solid-state reactions: the kinetic compensation effect. Thermochim. Acta 244, 1–20 (1994). [Google Scholar]
- Nebel H., Neumann M., Mayer C. & Epple M. On the structure of amorphous calcium carbonate a detailed study by solid-state NMR spectroscopy. Inorg. Chem. 47, 7874–7879 (2008). [DOI] [PubMed] [Google Scholar]
- Vega A. J. Heteronuclear chemical-shift correlations of silanol groups studied by two-dimensional cross-polarization magic angle spinning NMR. J. Am. Chem. Soc. 110, 1049–1054 (1988). [Google Scholar]
- de Leeuw N. H. & Parker S. C. Surface structure and morphology of calcium carbonate polymorphs calcite, aragonite, and vaterite: an atomistic approach. J. Phys. Chem. B 102, 2914–2922 (1998). [Google Scholar]
- Zhu H. & Grant D. J. W. Dehydration behavior of nedocromil magnesium pentahydrate. Int. J. Pharm. 215, 251–262 (2001). [DOI] [PubMed] [Google Scholar]
- Galwey A. K. Structure and order in thermal dehydrations of crystalline solids. Thermochim. Acta 355, 181–238 (2000). [Google Scholar]
- Saharay M., Yazaydin A. O. & Kirkpatrick R. J. Dehydration-induced amorphous phases of calcium carbonate. J. Phys. Chem. B 117, 3328–3336 (2013). [DOI] [PubMed] [Google Scholar]
- Reeder R. J. et al. Structure model of synthetic amorphous calcium carbonate. Geochim. Cosmochim. Acta 74, A855–A855 (2010). [Google Scholar]
- Sand K. K. et al. Binding of ethanol on calcite: the role of the OH bond and its relevance to biomineralization. Langmuir 26, 15239–15247 (2010). [DOI] [PubMed] [Google Scholar]
- Ihli J., Kulak A. N. & Meldrum F. C. Freeze-drying yields stable and pure amorphous calcium carbonate (ACC). Chem. Commun. 49, 3134–3136 (2013). [DOI] [PubMed] [Google Scholar]
- Killian C. E. et al. Mechanism of calcite co-orientation in the sea urchin tooth. J. Am. Chem. Soc. 131, 18404–18409 (2009). [DOI] [PubMed] [Google Scholar]
- Stephens C. J., Kim Y. Y., Evans S. D., Meldrum F. C. & Christenson H. K. Early stages of crystallization of calcium carbonate revealed in picoliter droplets. J. Am. Chem. Soc. 133, 5210–5213 (2011). [DOI] [PubMed] [Google Scholar]
- Stephens C. J., Ladden S. F., Meldrum F. C. & Christenson H. K. Amorphous calcium carbonate is stabilised in confinement. Adv. Func. Mater. 20, 2108–2115 (2010). [Google Scholar]
- Tester C. C. et al. In vitro synthesis and stabilization of amorphous calcium carbonate (ACC) nanoparticles within liposomes. Cryst. Eng. Comm. 13, 3975–3978 (2011). [Google Scholar]
- Lee J. R. I. et al. Structural development of mercaptophenol self-assembled monolayers and the overlying mineral phase during templated CaCO3 crystallization from a transient amorphous film. J. Am. Chem. Soc. 129, 10370–10381 (2007). [DOI] [PubMed] [Google Scholar]
- Yanagisawa K. & Ovenstone J. Crystallization of anatase from amorphous titania using the hydrothermal technique: effects of starting material and temperature. J. Phys. Chem. B 103, 7781–7787 (1999). [Google Scholar]
- Cudennec Y. & Lecerf A. The transformation of ferrihydrite into goethite or hematite, revisited. J. Solid State Chem. 179, 716–722 (2006). [Google Scholar]
Associated Data
This section collects any data citations, data availability statements, or supplementary materials included in this article.
Supplementary Materials
Supplementary Figures 1-5 and Supplementary Table 1


