To the editor: In our previous paper, Lubeck and Cai1, we used super-resolution microscopy to resolve a large number of mRNAs in single cells. In this correspondence, we present a sequential barcoding scheme to multiplex different mRNAs.
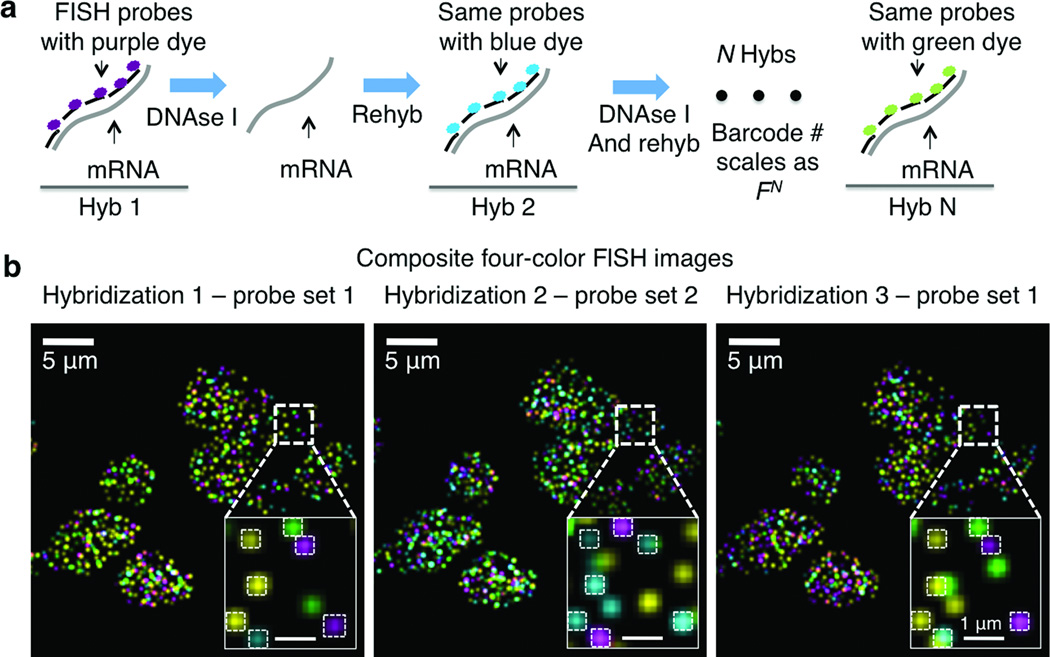
Here, the mRNAs in cells are barcoded by sequential rounds of hybridization, imaging, and probe stripping (Fig. 1a, Supplementary Fig. 1). As the transcripts are fixed in cells, the corresponding fluorescent spots remain in place during multiple rounds of hybridization, and can be aligned to read out a fluorophore sequence. This sequential barcode is designed to uniquely identify an mRNA.
Figure 1.
Sequential barcoding. (a) Schematic of sequential barcoding. In each round of hybridization, 24 probes are hybridized on each transcript, imaged and then stripped by DNAse I treatment. The same probe sequences are used in different rounds of hybridization, but probes are coupled to different fluorophores. (b) Composite four-color FISH Data from 3 rounds of hybridizations on multiple yeast cells. Twelve genes are encoded by 2 rounds of hybridization, with the third hybridization using the same probes as hybridization 1. The boxed regions are magnified in the bottom right corner of each image. The matching spots are shown and barcodes are extracted. Spots without colocalization are due to nonspecific binding of probes in the cell as well as mis-hybridization. The number of each barcode can be quantified to provide the abundances of the corresponding transcripts in single cells.
During each round of hybridization, we targeted each transcript by a set of FISH probes labeled with a single type of fluorophore. We imaged the sample and then treated it with DNAse I to remove the FISH probes. In a subsequent round the mRNA was hybridized with the same FISH probes, but now labeled with a different dye. The number of barcodes available scales as FN, where F is the number of fluorophores and N is the number of hybridization rounds. For example, with 4 dyes, 8 rounds o=f hybridization can cover the entire transcriptome (48=65,536).
As a demonstration, we barcoded 12 genes in single yeast cells with 4 dyes and 2 rounds of hybridization (42=16, with 4 barcodes left out). Cells are immobilized on glass surfaces (Supplementary Methods). The DNA probes are hybridized, imaged, and then removed by DNAse I treatment (88.5±11.0% (SE) efficiency Supplementary Fig. 2). The remaining signal is photobleached (Supplementary Fig. 3). Even after 6 hybridizations, mRNAs were observed at 70.9±21.8% (SE) of the original intensity (Supplementary Fig. 4). We observed that 77.9±5.6% (SE) of the spots that co-localized in the first two hybridizations also co-localize with the third hybridization (Fig. 1b, Supplementary Figs. 5, 6). The mRNA abundances are quantified by counting the occurrence of corresponding barcodes in the cell (Supplementary Figs. 7, 8, n=37 cells). We also show that mRNAs can be stripped and re-hybridized efficiently in adherent mammalian cells (Supplementary Figs. 9, 10).
Sequential barcoding has many advantages. First it scales up quickly; with even two dyes the coding capacity is in principle unlimited. Second, during each hybridization, all available FISH probes against a transcript can be used, increasing the brightness of the FISH signal. Lastly, barcode readout is robust, enabling full Z-stacks on native samples.
This barcoding scheme is conceptually akin to sequencing transcripts in single cells with FISH. Compared to Ke et al2, our method takes advantage of the high hybridization efficiency of FISH (>95% of the mRNAs are detected1,3) and the fact that base pair resolution is usually not needed to uniquely identify a transcript. We note that FISH probes can also be designed to resolve a large number of splice-isoforms, SNPs3, as well as chromosome loci4 in single cells. In combination with our previous report of super-resolution FISH1, the sequential barcoding method will enable the transcriptome to be directly imaged at single cell resolution in complex samples, such as the brain.
Supplementary Material
Footnotes
Competing financial interests
The authors declare no competing financial interests.
References
- 1.Lubeck E, Cai L. Nat. Methods. 2012;9:743–748. doi: 10.1038/nmeth.2069. [DOI] [PMC free article] [PubMed] [Google Scholar]
- 2.Ke R, et al. Nat. Methods. 2013;10:857–860. doi: 10.1038/nmeth.2563. [DOI] [PubMed] [Google Scholar]
- 3.Levesque MJ, et al. Nat. Methods. 2013;10:865–867. doi: 10.1038/nmeth.2589. [DOI] [PMC free article] [PubMed] [Google Scholar]
- 4.Levesque MJ, Raj A. Nat Meth. 2013;10:246–248. doi: 10.1038/nmeth.2372. [DOI] [PMC free article] [PubMed] [Google Scholar]
Associated Data
This section collects any data citations, data availability statements, or supplementary materials included in this article.


