Abstract
Background:
To seek pleasure is man's innate nature. In his search for gratification, man has discovered a world of substances that intoxicated him. Those who fell within its trap, their life changed, their families aggrieved and they shrank from company. The addiction remained alone in the end. To many death was a relief.
Methods:
A community based cross- sectional study was conducted in the Catchment area of UHTC (Urban Health and training Centre) where all males aged ≥15 years residing in the study area were included. Data was collected by home visit using WHO questionnaire (AUDIT: Alcohol use disorder identification test) Modified Kuppuswamy scale was used to assess the socio-economic status of the families. Data was analyzed by appropriate test using SPSS 20.0 version. Logistic regression was applied to the positively associated results.
Results:
According to the AUDIT score, Hazardous, Dependent and harmful drinkers were 7.7%, 9.2% and 2.4% respectively. Age, marital status, education of the head of the family, occupation of the respondent, caste, family history of alcohol use had statistically significant association (P < 0.05, 95% confidence interval). Logistic regression was applied and marital status, family history of alcohol use and caste retained their statistical significance (P < 0.05, 95% confidence interval).
Conclusions:
It can be concluded that being young, being low educated, being married and having a family history of alcohol use are more at risk to it. This indicates the dire necessity to consider the above factors in order to combat with this evil of alcohol use.
Keywords: AUDIT, harmful and dependent users, hazardous, independent association socio-demographic determinants, prevalence of alcohol use, WHO questionnaire
INTRODUCTION
Alcohol has been consumed in India for centuries. A number of mythological and religious books have highlighted the role it played in society. The pattern of drinking in India has undergone a change from occasional and ritualistic use to being a social event.
The unrecorded alcohol consumption in India is estimated to be 1.7 liters pure alcohol per capita for population older than 15 for the years after 1995 (estimated by a group of key alcohol experts).[1] The average age of initiation has been reduced from 28 years during the 80's to 20's during the recent years.[2] There has been a widespread agreement that the health and well-being of many young people today are seriously being threatened by the use of alcohol.[3]
In 1979, the 32nd World Health Assembly declared in resolution WHA-32.40 that ‘problems related to alcohol and particularly its extreme consumption rank among the World's major public health problems and constitute serious hazards for Health, welfare, and life.” WHO estimates that there are about 2 billion people worldwide who consume alcoholic beverages and 76.3 million with diagnosable alcohol use disorders.[4]
The harmful use of alcohol is a particularly grave threat to men. It is the leading risk factor for death in males ages 15-59, mainly due to injuries, violence, and cardiovascular diseases. Globally, 6.2% of all male deaths are attributable to alcohol, compared to 1.1% of female deaths. Men also have far greater rates of total burden attributed to alcohol.[5]
Alcohol misuse wreaks a high social cost. In addition to the health costs, there are indirect costs linked to a wide variety of social costs – family disruption, marital disharmony, impact on development of children, deprivation of the family, absenteeism and industrial loss, crime and violence, etc.[6]
The rationale of this study is that the independent association of alcohol use with the socio-demographic determinants depicts the real picture by eliminating the confounding factors. This is a step to know which socio-demographic determinants have to be dealt with in order to reduce this addiction.
METHODS
District profile
The present study is carried out in Meerut, which is an ancient city located 70 km (43 miles) northeast of the national capital New Delhi.
Study design
Community-based cross-sectional study.
Study area
Urban Slum, Multan Nagar in the field practice area of the department of Community Medicine, SMC (Subharti Medical College), Meerut.
Study population
All males aged ≥15 years residing in the study area.
Study period
September 2010 to October 2011.
Inclusion criteria
Males aged ≥15 years who have completed 15 years of age at the time of data collection, residing in the study area have been included in the sampling universe.
Exclusion criteria
Males staying in the study area of Meerut for less than 6 months and all the mentally challenged males were excluded from the study.
Sample size
Sample size for the proposed study was calculated according to National Family Health Survey-3[7] where prevalence of alcohol use in U.P. was given as 25.3% in males; therefore, the adequate sample size calculated was approximately 324 assuming 10% non-response and considering 5% absolute error using the formula; 
Sampling technique
Simple Random Sampling Technique.
Methodology
The proposed study was conducted in the urban slum of Multan Nagar in the field practice area of the Department of Community Medicine, SMC, Meerut after taking clearance from ethical committee. Sampling universe was 2112 registered families in the study area, and the sampling unit was a family in this study. All male members aged >15 years were taken from each household, where on an average, there were 2 males aged >15 years based on the demographic profile of the area; therefore, 324/2 = 162 households were taken in order to cover the required sample size.
Individual unit (family) constituting the sample was randomly selected by random number table method. All the male members aged ≥ 15 years were taken from each family after taking their written consent. If male aged ≥ 15 years were not found in a family, then the next family was visited. If the selected subject was not found at the first interview, date and time was taken from their family members for revisit.
The purpose of screening was clearly stated in terms of its relevance to the individual's health status assuring the maintenance of confidentiality.
Research tool3
Data was collected by home visit using WHO questionnaire (AUDIT: Alcohol Use Disorder Identification Test) as study tool by a structure interview each study subject.[8] Additional information was obtained on the socio-demographic determinants of alcohol use. The AUDIT is a 10-question alcohol screening instrument developed by W.H.O. and validated in six-country sample from four industrialized and two developing countries. Questions included in the instrument showed reliability across a wide range of cultural settings. The AUDIT has been shown to be highly sensitive (80%) and specific (89%) screening instrument.[9]
Modified Kuppuswamy scale[3] was used to assess the socio-economic status of the families.
Socio-economic status
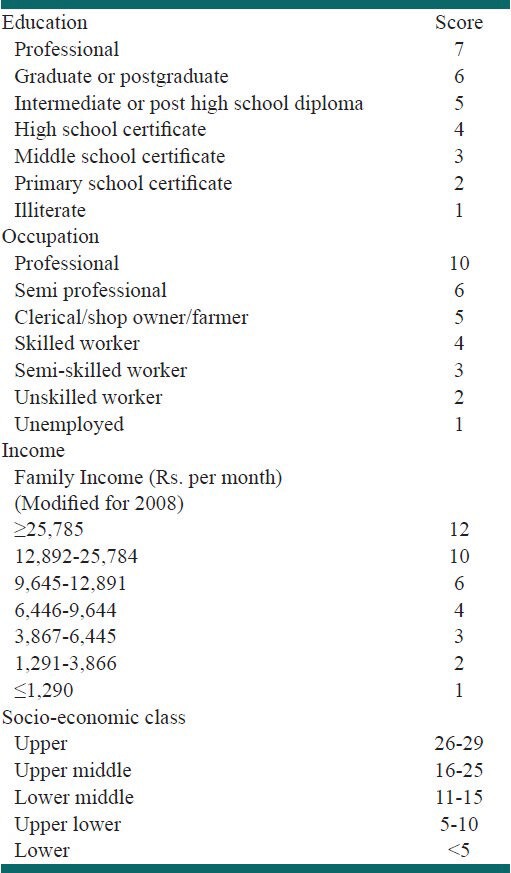
Modified Kuppuswamy's scale was used for assessing socio-economic status of subjects under study [Table 1].
Table 1.
Kuppuswamy's socio-economic status scale
Data was analyzed by using appropriate statistical tests by SPSS 16.0 version, and the results were expressed in proportions. Chi-square test was used, and if the cell frequency was less than 5, the result was obtained by Fischer's Exact test. Appropriate graphs were used to show the results.
All the alcohol users were motivated to visit the Mental Health Clinic at Urban Health and Training Center, Multan Nagar being run with the help of the department of Psychiatry, Subharti Medical College, Meerut.
The following definitions were used according to AUDIT:
Current drinker
Current drinkers are those who accepted drinking alcohol during the past one year.[8]
Problem drinkers
Persons scoring 8 or more on AUDIT were considered as problem drinkers.[8]
Non-problem drinkers
Persons scoring 1-7 on AUDIT were considered as non-problem drinkers.[10]
Teetotalers
Persons scoring 0 on AUDIT were considered as teetotalers.[11]
RESULTS
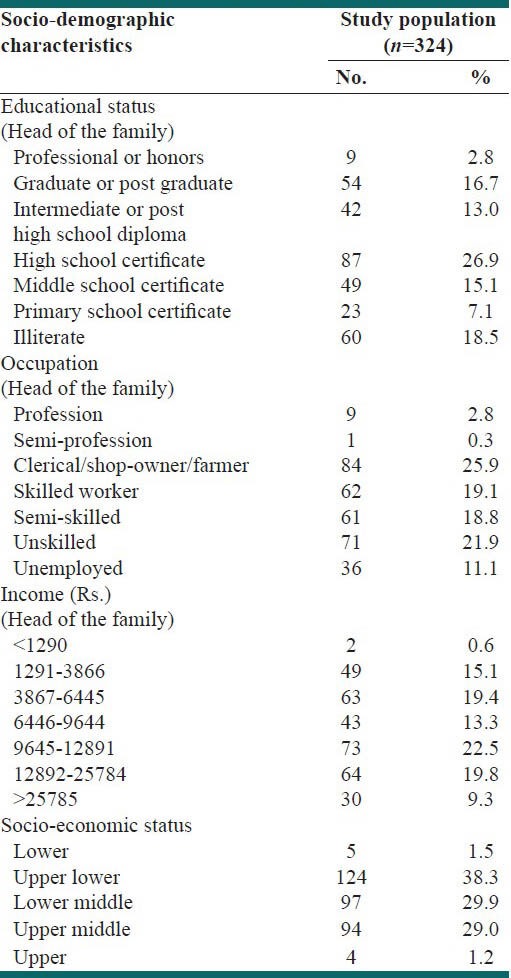
The socio-demographic characteristics of the population are displayed in Tables 2.1 and 2.2.
Table 2.1.
Distribution of the socio-demographic characteristics of the study population
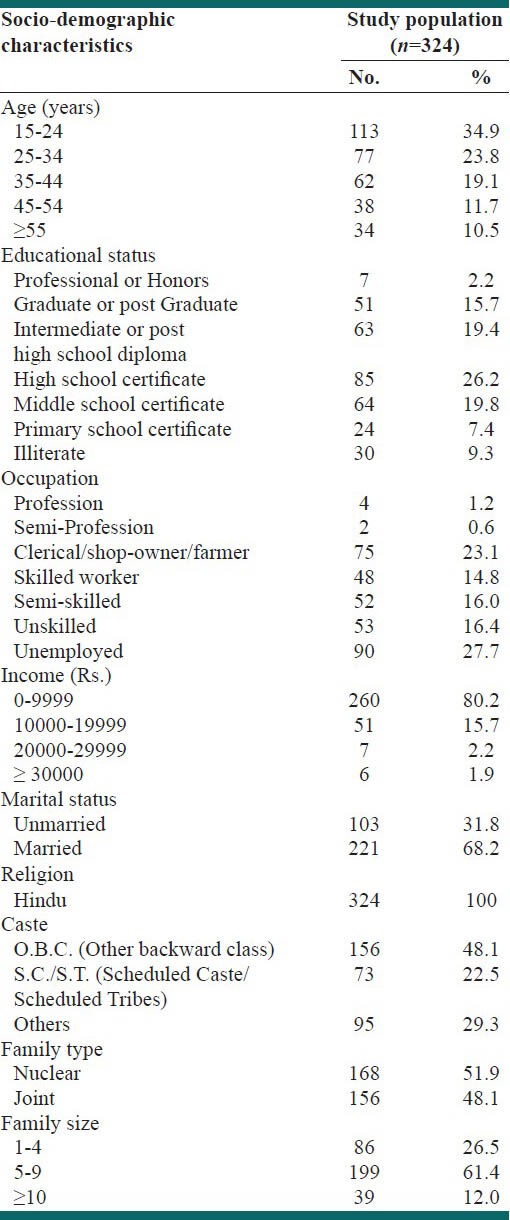
Table 2.2.
Distribution of the socio-economic status (Kuppuswamy scale) of the study population
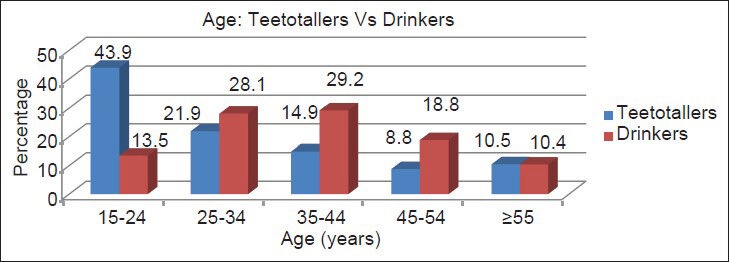
The prevalence of alcohol use among males aged >15 years in the urban slum of Meerut, North India was 29.6% where 8.3% were problem drinkers while 21.3% were non-problem drinkers at 95% confidence interval [Figure 1]. The majority (29.2%) of the current drinkers belonged to 25-44 years of age group with least (10.4%) being above 55 years of age while majority of the teetotalers (43.9%) belonged to 15-24 years of age group with least being (8.8%) in the 45-54 years of age group. The association of alcohol use with age was highly statistically significant [Figure 2]. The mean age was 37.0 + 12.6 years in current drinkers while it was 31.6 + 14.9 years in the group of teetotalers. On application of Z-test for means, the association between mean age and alcohol use was highly statistically significant (P = 0.0008).
Figure 1.
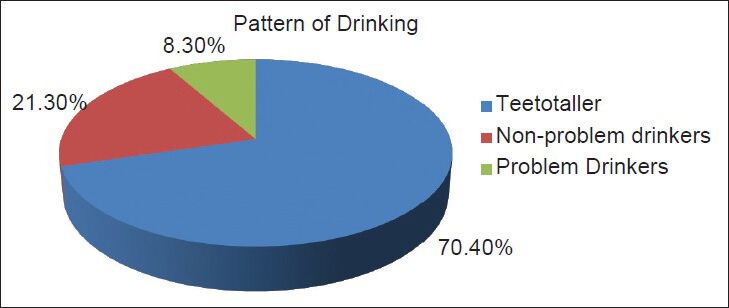
Pattern of alcohol use
Figure 2.
Distribution of teetotalers and current drinkers according to age groups
The Table 2 shows that 28.1% of the current drinkers and 25.4% of the teetotalers were educated upto high school. On the contrary, 14.6% of the current drinkers and 21.5% of the teetotalers received education upto intermediate, and this association was not found to be statistically significant (P = 0.05). When the groups were divided into – illiterates and literates, then there was a statistically significant association between alcohol use and literacy.
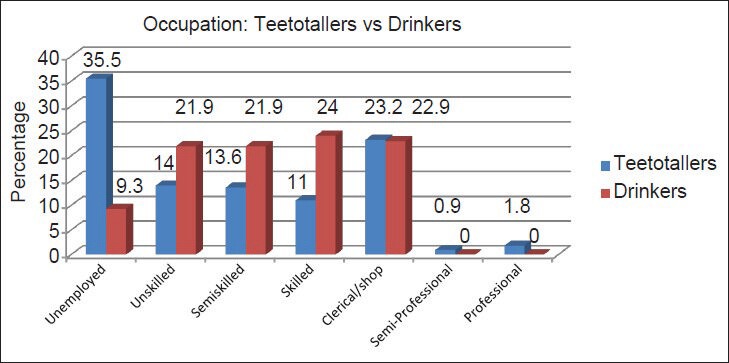
In the Table 3, just 9.3% of the current drinkers were unemployed as compared to 35.5% in the group of teetotalers. Similarly, 22.9% were in the clerical/shopkeeper group among the current drinkers with 23.2% being in the teetotalers group. None in the group of current drinkers was semi-professional. The association between alcohol use and their occupational status was found to be highly statistically significant. On applying Chi-square test, highly statistically significant association was found between alcohol use and employment (P = 0.0001).
Table 3.
Association between alcohol use and the education of respondent

The current drinkers were 77.1% in the income range of Rs. 0-9999 while 81.6% of the teetotalers belonged to the same income group. Among current drinkers, 2.2% were in the Rs. 20000-29999 income group while teetotalers being 5.2%. No statistically significant association was found between alcohol use and income of the respondent (P = 0.100).
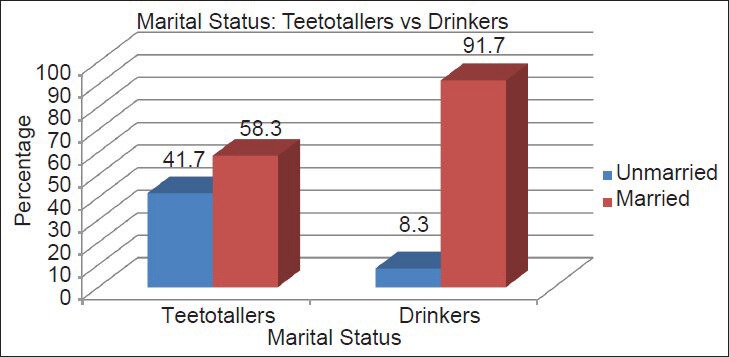
The Figure 3 shows that just 8.3% of current drinkers were unmarried while 41.7% of the teetotalers belonged to the same group. Furthermore, 91.7% of the current drinkers were married while 58.3% of the teetotalers belonged to the same group. Marital status and alcohol use had a highly statistically significant association (P = 0.0001).
Figure 3.
Distribution of teetotalers and current drinkers according to marital status
About 47% of the current drinkers were O.B.C. while 48.7% of the teetotalers were from the same group. A higher percentage (34.4%) of current drinkers was from S.C./S.T. category while only 17.5% of the teetotalers belonged to the same category. This association between caste and alcohol use was found to be statistically significant (P = 0.001) [Figure 4].
Figure 4.
Distribution of teetotalers and current drinkers according to caste
There were 3.1% of the current drinkers in the lower socio-economic group as compared to 0.9% of the teetotalers and 41.7% of the current drinkers, and 36.8% of the teetotalers belonged to upper lower group of socio-economic status. No statistically significant association was found between alcohol use and socio-economic status (P = 0.310).
The 22.9% of the current drinkers had their head of the family illiterate as compared to 16.7% of the teetotallers in the same group and similarly 10.4 % of the current drinkers had their head of the family graduate while 19.3% of the teetotallers had the same educational status. It was further observed that none of the current drinkers had their head of the family professional while 3.9% of the teetotallers were of the same group and this association was found to be statistically significant [Table 4].
Table 4.
Association between alcohol use and the occupation of respondent

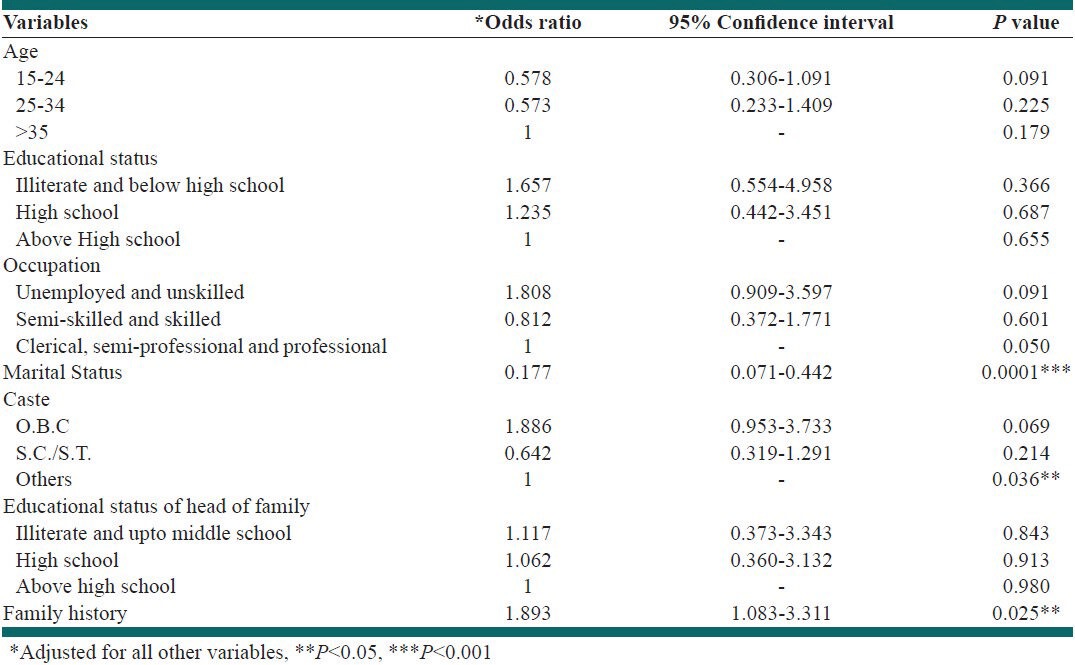
On applying Logistic regression, marital status (P = 0.0001), caste (P = 0.036), and family history of alcohol use (P = 0.025) remained statistically significant as independent variables. Looking at the O.R. (Odds Ratio) in Table 5, individuals who were illiterate and educated below high school had 65% higher risk of alcohol use as compared to those educated above high school (O.R. = 1.65). Similarly, unskilled and unemployed had 80% higher risk of alcohol use as compared to the category of semi-professional and professionals (O.R. = 1.80). The individuals belonging to the O.B.C. (Other Backward Class) category had 88% extra risk of alcohol use as compared to the category of others (O.R. = 1.88).
Table 5.
Predictors of alcohol use: Results from logistic regression analysis
Strengths and limitations
A standardized and validated WHO questionnaire is used in this study: AUDIT
Logistic regression analysis to know which socio-demographic determinants actually have an impact on the intake of alcohol as the most deterrent determinant of alcohol use.
Limitation
Most significant and unavoidable limitation is the recall bias.
DISCUSSIONS
In the present study, 324 subjects were analyzed to assess the prevalence of alcohol use and its association with the socio-demographic determinants. In this study, the prevalence of current drinkers was found to be 29.6%, which included 21.3% of non-problem drinkers and 8.3% of problem drinkers. Teetotalers constituted 70.4% of the study subjects.
The present study findings of the prevalence of problem drinking were consistent with the findings of Bongers et al.[12] and Mbatia et al.,[13] which stated prevalence of problem drinkers as 9% and 8.7%, respectively. Much higher prevalence was reported by Barros et al. study[14] – 13.1% problem drinkers in men. Brisibe et al.[15] reported 57.7% of non-problem drinkers, which were much higher than our study. The findings of the index study were inconsistent with that of Dhupdale N. et al.[16] and Seale Paul et al.[9] where prevalence of current drinkers was found to be 49%, which included ex-drinkers 9.5% and 86.5% among males, respectively.
As far as the socio-demographic determinants were concerned, according to our study, majority (29.2%) of the current drinkers belonged to 25-44 years of age group with least (10.4%) being above 55 years of age. The Indian studies like Gururaj et al.,[17] Meena et al.,[18] Sathya Prakash et al.,[19] and Deswal et al.[20] reported similar findings as seen in this study. The review of alcohol use outside India indicates that young men have a high prevalence of problem drinking. Seale et al.[9] and Larangeira et al.[21] reported that higher alcohol consumption was found among the lowest age ranges. This is consistent with the findings of the present study. The association of alcohol use with age was highly statistically significant (P < 0.001) in our study, which is consistent with the findings of Sathya Prakash et al.[19] This is interpreted by the fact that the age of indulgence into alcohol use is being lowered.
In the present study, educational status of the study population was not found to be statistically associated with alcohol use while it was statistically significant when comparison was made between illiterates and literates in the study population. Among the Indian studies, Gupta. et al.,[22] Deswal et al.,[20] Gururaj et al.,[17] D’Costa et al.,[11] Medhi et al.,[23] Sathya Prakash et al.,[19] and John A. et al.[24] showed in their study that alcohol use was found to be significantly associated with educational status, which is consistent with our findings. Barros et al.,[14] Jukkala et al.,[25] Huu Bich et al.,[26] and Larangeira et al.[21] gave evidence for a negative relationship between educational level and drinking, which is consistent with our findings. This interprets that education as such is not an important predictor of alcohol use.
Based on our study findings, the association between alcohol use and their occupational status was found to be highly statistically significant (P < 0.001), and these findings are consistent with the study observations of Sundaram et al.[27] and Sathya Prakash et al.[20] As far as the international studies are considered, our findings are consistent with the findings of Bongers et al.,[12] Royo-Bordonada et al.,[28] and Bobak et al.[29] This is probably explained by the fact that the type of occupation decides the level of stress, the peer group, and others; therefore, it is an important factor affecting its use.
The association between alcohol use and income was not found to be statistically significant (P > 0.05) in the present study. Medhi et al.,[24] and D’Costa et al.[11] found no statistically significant association like our study. On the contrary, inconsistent results with our study were reported by Sathya Prakash et al.[19]
The association of alcohol use with the socio-economic status was not found to be statistically significant in our study, which is consistent with the findings of the study of Ahmad et al.[30] Results of Tomkins et al.[31] are also consistent with our findings. This can be explained as alcohol use is not at all related to the income as those who are poor but still indulged into addiction as compared to the so-called high class society people.
Current drinkers were more common in the married group (91.7%) as compared to unmarried (8.3%) in our study, which is consistent with findings of Singh et al.,[32] Meena et al.,[18] Negi et al.,[33] Deswal et al.,[20] and John et al,[25] Bongers et al.,[12] Barros et al.,[14] Seale et al.[9] stated findings, which are inconsistent with our observations which according to them could be due to the loneliness in the unmarried groups. Marital status and alcohol use had high statistically significant association (P < 0.001). According to Deswal et al.,[20] John et al.,[25] and Barros et al.,[14] alcohol use was found to be significantly associated with marital status, which probably is related to the stress borne in the married group.
CONCLUSIONS
Article focus
Problems of alcohol use in India have attracted the attention of public health policy makers and research workers.
Though certain studies are done on the socio-demographic determinants, they are very few.
No study regarding the same has been conducted in this part of North India-Meerut till date.
Key messages
Keeping the above points in view, the present study was conducted to know the prevalence of alcohol use and the various socio-demographic factors related to it, so that the necessary measures can be taken for its prevention.
This study shows the independent association of marital status, caste, and family history of alcohol use, which is not known in this part of the country.
ACKNOWLEDGEMENT
I owe all the work done by me to the Almighty lord who was the doer solving the complexities and making them simple as ever.
Footnotes
Source of Support: Nil
Conflict of Interest: None declared.
REFERENCES
- 1.Alcohol per capita consumption, patterns of drinking and abstention worldwide after 1995. Appendix 2. Eur Addict Res. 2001;7:155–7. [Google Scholar]
- 2.Subramanian SV, Nandy S, Irving M, Gordon D, Davey Smith G. Role of socioeconomic markers and state prohibition policy in predicting alcohol consumption amongst men and women in India: A multi level statistical analysis. Bull World Health Organ. 2005;83:829–36. [PMC free article] [PubMed] [Google Scholar]
- 3.Park K. Park's textbook of preventive and social Medicine. 20th ed. Jabalpur: Banarsidas Bhanot Publishers; 2009. Medicine and social sciences; p. 609. [Google Scholar]
- 4.Geneva: WHO; 2004. World Health Organization (WHO), Global status report on alcohol, Department of Mental Health and Substance Abuse. [Google Scholar]
- 5.Geneva: WHO; 2011. World Health Organization (WHO), Global status report on alcohol, Department of Mental Health and Substance Abuse. [Google Scholar]
- 6.Benegal V, Bajpai A, Basu D, Bohra N, Chatterji S, Galgali R, et al. Proposal to the Indian psychiatric society for adopting a specialty section on addiction medicine. Alcohol and other Substance Abuse. Indian J Psychiatry. 2007;49:277–82. doi: 10.4103/0019-5545.37669. [DOI] [PMC free article] [PubMed] [Google Scholar]
- 7.National family Health Survey-3, 2005-2006, Vol. 1, Table 13.10:433. [Last accessed on 2009 Oct 6]. Available from: http://www.nfhsindia.org/nfhs3.html .
- 8.Saunders JB, Aasland OG, Babor TF, de la Fuente JR, Grant M. Development of the Alcohol Use Disorders Identification Test (AUDIT): WHO collaborative project on early detection of persons with harmful alcohol consumption – II. Addiction. 1993;88:791–804. doi: 10.1111/j.1360-0443.1993.tb02093.x. [DOI] [PubMed] [Google Scholar]
- 9.Seale JP, Seale JD, Alvarado M, Vogel RL, Terry NE. Prevalence of problem drinking in a Venezuelan Native American population. Alcohol Alcohol. 2002;37:198–204. doi: 10.1093/alcalc/37.2.198. [DOI] [PubMed] [Google Scholar]
- 10.Sampath SK, Chand PK, Murthy P. Problem drinking among male inpatients in a rural general hospital. Indian J Community Med. 2007;1:93. [Google Scholar]
- 11.D’Costa G, Nazareth I, Naik D, Vaidya R, Levy G, Patel V, et al. Harmful alcohol use in Goa, India, and its associations with violence: A study in primary care. Alcohol Alcohol. 2007;4:131–7. doi: 10.1093/alcalc/agl103. [DOI] [PubMed] [Google Scholar]
- 12.Bongers IM, van Oers HA, van de Goor IA, Garretsen HF. Alcohol use and problem drinking: Prevalence's in the general Rotterdam population. Subst Use Misuse. 1997;32:1491–512. doi: 10.3109/10826089709055874. [DOI] [PubMed] [Google Scholar]
- 13.Mbatia J, Jenkins R, Singleton N, White B. Prevalence of alcohol consumption and hazardous drinking, tobacco and drug use in Urban Tanzania, and their associated risk factors. Int J Environ Res Public Health. 2009;6:1991–2006. doi: 10.3390/ijerph6071991. [DOI] [PMC free article] [PubMed] [Google Scholar]
- 14.Barros MB, Botega NJ, Dalgalarrondo P. Prevalence of alcohol abuse and associated factors in a population based study. Brazilian J Psychiatry. 2008;57:115–27. doi: 10.1590/s0034-89102006005000032. [DOI] [PubMed] [Google Scholar]
- 15.Brisibe S, Ordinioha B. Socio-demographic characteristics of alcohol abusers in a rural Ijaw community in Bayelsa State, South-South Nigeria. Ann Afr Med. 2011;10:97–102. doi: 10.4103/1596-3519.82066. [DOI] [PubMed] [Google Scholar]
- 16.Dhupdale NY, Motghare DD, Ferreira AM. Prevalence and pattern of alcohol consumption in rural Goa. Indian J Community Med. 2006;31:238–44. [Google Scholar]
- 17.Gururaj G, Girish N, Benegal V. New Delhi: World Health Organization, South East Asia Regional office; 2006. Burden and socioeconomic impact of alcohol, The Bangalore study. [Google Scholar]
- 18.Meena, Khanna P, Vohra AK, Rajput R. Prevalence and pattern of alcohol and substance abuse in urban areas of Rohtak city. Indian J Psychiatry. 2002;44:348–52. [PMC free article] [PubMed] [Google Scholar]
- 19.Sathya PM, Benegal V, Balakrishna N. Alcohol consumption: Prevalence and pattern in Andaman and Nicobar Islands. 2008. [Last assessed on 2010 Oct 2]. Available from: http://www.nimhans.kar.nic.in/deaddiction/cam .
- 20.Deswal BS, Jindal AK, Gupta KK. Epidemiology of alcohol use among residents of remote hills of Arunachal Pradesh. Indian Journal of Community Medicine. 2006 Apr-Jun;31:26–30. [Google Scholar]
- 21.Laranjeira R, Pinsky I, Sanches M, Zaleski M, Caetano R. Alcohol use patterns among Brazilian adults. Braz J Psychiatr. 2010;32:231–41. doi: 10.1590/s1516-44462009005000012. [DOI] [PubMed] [Google Scholar]
- 22.Gupta PC, Saxena S, Pednekar MS, Maulik PK. Alcohol consumption among middle-aged and elderly men: A community study from Western India. Alcohol Alcohol. 2003;38:327–31. doi: 10.1093/alcalc/agg077. [DOI] [PubMed] [Google Scholar]
- 23.Medhi G, Hazarika N, Mahanta J. Correlates of alcohol consumption and tobacco use among tea industry workers of Assam. Subst Use Misuse. 2006;41:691–706. doi: 10.1080/10826080500411429. [DOI] [PubMed] [Google Scholar]
- 24.John A, Barman A, Bal D, Chandy G, Samuel J, Thokchom M, Joy N, et al. Hazardous alcohol use in rural southern India: Nature, prevalence and risk factors. Natl Med J India. 2009;22:123–5. [PubMed] [Google Scholar]
- 25.Jukkala T, Mäkinen IH, Kislitsyna O, Ferlander S, Vågerö D. Economic strain, social relations, gender, and binge drinking in Moscow. Soc Sci Med. 2008;66:663–74. doi: 10.1016/j.socscimed.2007.10.017. [DOI] [PubMed] [Google Scholar]
- 26.Huu Bich T, Thi Quynh Nga P, Ngoc Quang L, Van Minh H, Ng N, Juvekar S, et al. Patterns of alcohol consumption in diverse rural populations in the Asian region. Glob Health Action. 2009:2. doi: 10.3402/gha.v2i0.2017. [DOI] [PMC free article] [PubMed] [Google Scholar]
- 27.Sundaram KR, Mohan D, Advani GB, Sharma HK, Bajaj JS. Alcohol abuse in a rural community in India. Part I: Epidemiological study. Drug Alcohol Depend. 1984;14:27–36. doi: 10.1016/0376-8716(84)90016-4. [DOI] [PubMed] [Google Scholar]
- 28.Royo-Bordonada MA, Cid-Ruzafa J, Martin-Moreno JM, Guallar E. Drug and alcohol use in Spain: Consumption habits, attitudes and opinions. Public Health. 1997;111:277–84. [PubMed] [Google Scholar]
- 29.Bobak M, McKee M, Rose R, Marmot M. Alcohol consumption in a national sample of the Russian population. Addiction. 1999;94:857–66. doi: 10.1046/j.1360-0443.1999.9468579.x. [DOI] [PubMed] [Google Scholar]
- 30.Ahmed A, Khalique N, Khan Z. Analysis of substance abuse in male adolescents. Iranian J Paediatr. 2009;19:399–403. [Google Scholar]
- 31.Tomkins S, Saburova L, Kiryanov N, Andreev E, McKee M, Shkolnikov V, et al. Prevalence and socio-economic distribution of hazardous patterns of alcohol drinking: Study of alcohol consumption in men aged 25-54 years in Izhevsk, Russia. Addiction. 2007;102:544–53. doi: 10.1111/j.1360-0443.2006.01693.x. [DOI] [PMC free article] [PubMed] [Google Scholar]
- 32.Singh J, Singh G, Mohan V. A comparative study of prevalence of regular alcohol users among the male individuals in an urban and rural area of district Amritsar, Punjab. Indian J Community Med. 2000;25:238–44. [Google Scholar]
- 33.Negi KS, Kandpal SD, Rawat CM. Prevalence of alcoholism among the males in a rural and urban area of district Dehradun (Uttaranchal) Indian J Prev Soc Med. 2003;34:29–37. [Google Scholar]


