INTRODUCTION
Glucocorticoids are potential mediators to cause muscle wasting. In skeletal muscle, glucocorticoids decrease the rate of protein synthesis and increase the rate of protein degradation. Various stressed conditions, including severe burn injury, sepsis, uremia, and acidosis induce glucocorticoid release in association with muscle wasting 1,2. Glucocorticoid-induced myopathy is also seen in patients receiving glucocorticoids for the treatment of rheumatic arthritis, bronchial asthma, and ulcerative colitis. Muscle atrophy complicates the care of these patients, prolongs the recovery, affects the effectiveness of other therapeutic regimens, and reduces life quality. Therefore, pharmacological intervention regimen that antagonizes the side effects of glucocorticoids on muscle wasting would be beneficial to the patients.
It has been reported that anabolic-androgenic steroids have the potential to reverse the glucocorticoid-induced catabolic effects on muscles 3–5. In long-term glucocorticoid-treated patients, androgen was found to preserve muscle mass 3. Androgen also attenuated muscle wasting in COPD patients receiving prolonged glucocorticoid therapy 4,5. However, so far, the precise mechanisms by which androgens reverse glucocorticoid-induced muscle wasting are not known.
IGF-I is an endogenous growth factor that regulates several cellular biochemical pathways in skeletal muscle. The signaling pathways downstream of IGF-I associated with increased protein synthesis in skeletal muscle include the phosphatidylinositol-3 kinase (PI3K)/protein kinase B (Akt)/p70 ribosomal protein S6 kinase (p70S6K) pathway and the PI3K/Akt/glycogen synthase kinase 3β (GSK3β) pathway 6,7. In addition, two muscle-specific ubiquitin E3-ligases, muscle atrophy F-box (MAFbx) and muscle RING finger-1 (MuRF1) are associated with protein degradation in skeletal muscle and were also found to be regulated by PI3K/Akt pathway. Now we also know that PI3K/Akt signaling pathway is not specific to IGF-I. Insulin can also activate the PI3K/Akt signaling pathway by its own receptor.
Recent studies have demonstrated that acute treatment with corticosteroids decreased IGF-I level in serum and IGF-I mRNA level in rat diaphragm and gastrocnemius 8, while treatment with androgen increased IGF-I mRNA level in the bovine satellite cell culture 9. Androgen also increased both IGF-I protein level and IGF-I mRNA level in rat diaphragm muscles 10,11. A more recent study also revealed that dihydrotestosterone (DHT), one of the most potent natural androgens, induced a rapid increase in the phosphorylation of p70S6K, one of the downstream targets of IGF-I/insulin 12. All these findings led us to postulate that androgen’s effects in reversing muscle wasting are related to activating the signaling pathways downstream of IGF-I/insulin. The present study was designed to explore the effects of androgen on signaling pathways downstream of IGF-I/insulin in a glucocorticoid-induced catabolic animal model. First, we determined the in vivo effects of androgen treatment on muscle atrophy induced by glucocorticoid. Then, on the molecular basis, we investigated the effects of androgen on the downstream targets of IGF-I/insulin in the skeletal muscle in a glucocorticoid-induced catabolic state. Several downstream targets, Akt, p70S6K and GSK-3β were examined here. In addition, the expressions of the ubiquitin E3-ligases, MAFbx and MuRF1were also assessed.
MATERIALS AND METHODS
Animal care and experimental design
The study protocol was approved by the Animal Use and Care Committee of the First Affiliated Hospital of General Hospital of PLA, Beijing, China, and adhered to the Institutes of Health Guide for the Care and Use of Laboratory Animals. Female Sprague-Dawley rats with initial body weight ranging from 190 to 200 g [certificate number: SCSK(Jing)2005-0013] and rat chow [certificate number: SCSK(Jing) 2006-0003] were purchased from Institute of Laboratory Animal Science, Chinese Academy of Medical Sciences. Each animal was housed individually under controlled environment (room temperature 22°C; 12 h light-dark cycle, light on at 8:00 am), and was fed rat chow and water ad libitum. Testosterone (Sigma, St. Louis, MO) was suspended in sesame oil (5mg/ml), and dexamethasone (Sigma, St. Louis, MO) was suspended in 0.9% saline (1mg/ml). After an adaptation period of 7 days, forty rats were randomly divided into 4 groups: (1) control group that received 10 days of saline injections (0.1 ml/100 g/day) and 13 days of sesame oil injections (0.1 ml/100 g/day); (CON group, n=10); (2) dexamethasone group that received similar treatment as the CON group except 10 days of dexamethasone (0.1 mg/100 g/day) instead of saline injections (DEX group, n=10); (3) testosterone group that received similar treatment as the CON group except 13 days of testosterone (0.5 mg/100 g/day) instead of sesame oil injections, (TES group, n=10); and (4) combined treatment group that received both 10 days of dexamethasone (0.1 mg/100 g/day) injections and 13 days of testosterone (0.5 mg/100 g/day) injections (TES+DEX group, n=10). The time points of the first sesame oil or testosterone injections were 3 days earlier than that of the first saline or dexamethasone injections. The doses of the hormones and duration of treatment was similar to that reported by Eason and Konno who demonstrated the metabolic effects of these two agents 13,14. The sesame oil or testosterone was injected alternatively into subcutaneous tissue of left and right upper limbs. Saline and dexamethasone were injected intraperitoneally. All the injections were conducted from 8:00 am to 10:00 am of the day. The volume of each injected agent was about 0.2 ml. All animals were weighed each day before the injection. The doses of the injected agents were adjusted to reflect the changes in body weight. At 24 hours after the last injection, the last body weights were obtained and animals were anesthetized with overdose of pentobarbital sodium (100 mg/kg body weight ip). Blood samples were withdrawn from the abdominal aorta and were centrifuged. The serum was collected and immediately stored at −20°C until analyses for the concentrations of IGF-I and androgen concentrations. The gastrocnemius muscle from the left hind limb was dissected, weighed, and quickly frozen in liquid nitrogen for biochemical assays. The same muscle of the contralateral leg was also surgically removed, weighed, stretched to its resting length, and immediately frozen in isopentane pre-cooled by liquid nitrogen, for histological analysis. All muscle samples were stored at −80°C until histochemical and biochemical analysis.
Radioimmunoassay
Serum testosterone level was measured in duplicate by radioimmunoassay with the use of reagents from CellChip Biotechnology (Beijing, China) following the manufacturer’s protocol. The minimum detectable testosterone concentration of the assay at 95% confidence level is 0.02 ng/ml and the intra- and inter-assay coefficient of variation was 10% and 15%, respectively.
Estimate in the change of muscle mass
Although we tried to group animals with an even distribution of initial body weight, there were still minor differences in the averages of initial total body weights among each group. Because the wet muscle weight can be measured only at the end of each experiment, the average muscle weight of each experimental group was adjusted to reflect this difference by multiplying its measured average muscle weight (MW) by the ratio of the initial average body weight (BW) of the CON group to that of the experimental group, according to the method described by Ma et al 15, i.e.
Assessment of muscle fiber cross-sectional area (CSA)
Frozen whole muscle samples were cut at the mid-belly, oriented in tragacanth gum, and serially sectioned (10 micrometers thick) in a cryostat at –20°C. All muscle samples underwent hematoxylin and eosin staining. Muscle fiber CSA was determined by microscopic images of digitized muscle sections, using a computer-based imaging processing system. A microscope stage micrometer was used to calibrate the imaging system for morphometry. The cross-sectional area of 200–300 individual fibers was determined from the number of pixels within manually outlined fiber boundaries.
ELISA Assays
Serum IGF-I was measured in duplicate by ELISA with the use of reagents from Boster (Wuhan, China) according to the manufacturer’s protocol. The sensitivity for IGF-I was below 5 pg/ml.
Protein extraction and Western blotting
One hundred milligrams of muscle tissue were homogenized in 500 μl of ice-cold modified RIPA buffer containing 50 mM Tris-HCl (pH 7.4), 1% NP-40, 0.25% Na deoxycholate, 150 mM NaCl, 1mM EDTA, 1mM PMSF, 1 μg/ml aprotinin, 1 μg/ml leupeptin, 1 μg/ml pepstatin, 1 mM Na3VO4, 1mM NaF. The homogenate was subjected to centrifugation for 30 min at 12000g at 4°C. The supernatant was removed and stored at −80°C until analysis. The protein concentration of the supernatant was determined by bicinchoninic acid assay (BCA, Pierce), with BSA as standard. The protein samples (50 μg per lane) were mixed with SDS-PAGE loading buffer and boiled for 5 minutes before loading. Electrophoresis was performed using 10% SDS-PAGE gels. Proteins were electrophoretically transferred to polyvinylidene difluoride (PVDF) membranes (for 2 h at 1.5A/cm2) using an immunoblot transfer apparatus. After transfer, the membranes were blocked with 5% (w/v) BSA in Tween 20 Tris-buffered saline (TTBS) (50 mM Tris [pH 7.5], 0.9% NaCl, and 0.1% Tween-20) for 1 hour at room temperature (RT) and then incubated overnight at 4°C with primary antibody. After three washings with TTBS, the membranes were incubated for 1 hour at RT with secondary antibody. After the membranes were washed three times, the signals were detected with an enhanced chemiluminescence reagent (ECL; Applygen, Beijing, China) and an X-ray film (Eastman Kodak, Rochester, NY) was exposed to the PVDF membranes. Primary antibodies that were purchased from Cell Signaling Technology (Beverly, MA) include: against mouse Akt and phospho (Ser473)-Akt (1:1000 dilution); against human GSK3β and phospho (Ser9)-GSK3β (1:1000 dilution); against human p70S6K and phospho (Thr389)-p70S6K (1:2000 dilution). The horseradish-peroxidase–conjugated secondary antibody was purchased from Jackson Immunoresearch (West Grove, PA).
RNA extraction and real-time quantitative PCR
Total RNA was isolated from the gastrocnemius muscle using TRIzol reagent (Promega, Madison, WI) following the instructions from the manufacturer. Acceptable purity of the extracted RNA was determined by observing an optical density ratio (OD at 260 nm/OD at 280 nm) of 1.8–2.0. The concentration of total RNA was estimated by absorbance at 260 nm. cDNA was generated by using reverse transcription system (Promega, Madison, WI) in a 20 μl reaction. The reaction contained 1 μg total RNA. The real-time PCR primers used are as follows: IGF-I, forward, 5′-GCT ATG GCT CCA GCA TTC G-3′, and reverse, 5′-TCC GGA AGC AAC ACT CAT CC-3′ (Accession number: AH 002176); atrogin-1/MAFbx, forward, 5′-CCA TCA GGA GAA GTG GAT CTA TGT T-3′, and reverse, 5′-GCT TCC CCC AAA GTG CAG TA-3′ (Accession number: AY059628); MuRF1, forward, 5′-TGA CCA AGG AAA ACA GCC ACC AG-3′, and reverse, 5′-CTC ACT CTT CTT CTC GTC CAG GAT GG-3′ (Accession number: AY059627); Glyceraldehyde-3-phosphate dehydrogenase (GAPDH), forward, 5′-TGC ACC ACC AAC TGC TTA-3′, and reverse, 5′-GGA TGC AGG GAT GAT GTT C-3′ (Accession number: AF106860). PCR was performed using the Applied Biosystems 7500 Fast Real-Time PCR System and the SYBR Green PCR Master Mix (Applied Biosystems, Foster City, CA) as described by the manufacturer. Each 20 μl reaction contained 10 μl of 2 × SYBR Green PCR Master Mix, target cDNA specific primers (500nM each), and 50 ng of first-strand cDNA sample. The PCR conditions for the genes amplified consisted of one denaturing cycle at 94°C for 2 min, followed by 40 cycles consisting of denaturing at 94°C for 30 s and annealing at 60°C for 40 s. At the end of the PCR, the samples were subjected to a dissociation curve analysis. To control for any variations due to efficiencies of the reverse transcription and PCR, glyceraldehyde-3-phosphate dehydrogenase (GAPDH) was used as an internal control. All PCR runs were performed in duplicate. For each sample, a value or threshold cycle (Ct) was calculated based on the time (measured by the number of PCR cycles) at which the reporter fluorescent emission increased beyond a threshold level (based on the background fluorescence of the system). The samples were diluted in such a manner that the Ct value was observed between 15–30 cycles.
Statistical analysis
Statistical tests were performed using SPSS statistical package (version 11.0, SPSS, Chicago, IL). Repeated-measures ANOVA was used to analyze the change of body weight. Other comparisons among groups were made by one-way ANOVA. Post hoc differences were determined with the Student-Neuman-Keuls (S-N-K) test. Significance was set at P<0.05. All values are expressed as mean ± SD.
RESULTS
Testosterone increased serum testosterone concentration
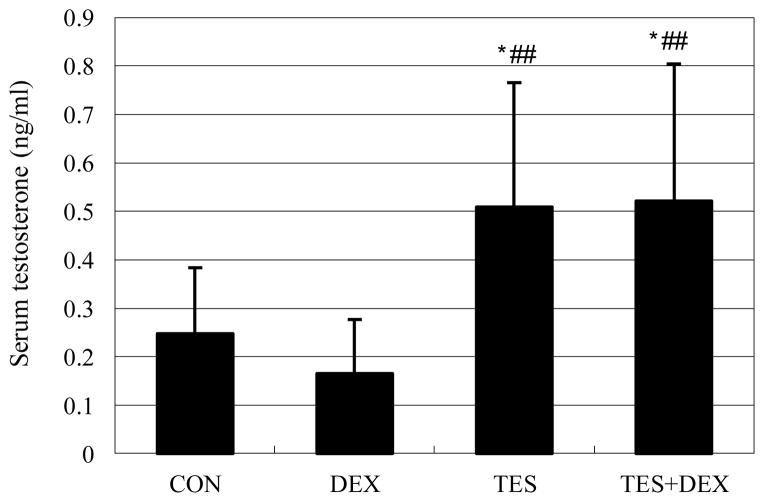
There was no significant difference in serum testosterone concentration between DEX group (0.165±0.112 ng/ml) and CON group (0.248±0.136 ng/ml). Serum testosterone concentration was 105% higher in the TES group than in the CON group, and was 216% (P<0.01) higher in the TES+DEX group than in the DEX group (Fig. 1).
Fig. 1.
Effects of DEX and TES treatment on serum TES concentration. Serum testosterone was analyzed by Radioimmuno-assay. * P<0.05 vs. CON group, ##P<0.01 vs. DEX group. N=10.
Testosterone attenuated Animal body weight loss caused by dexamethasone
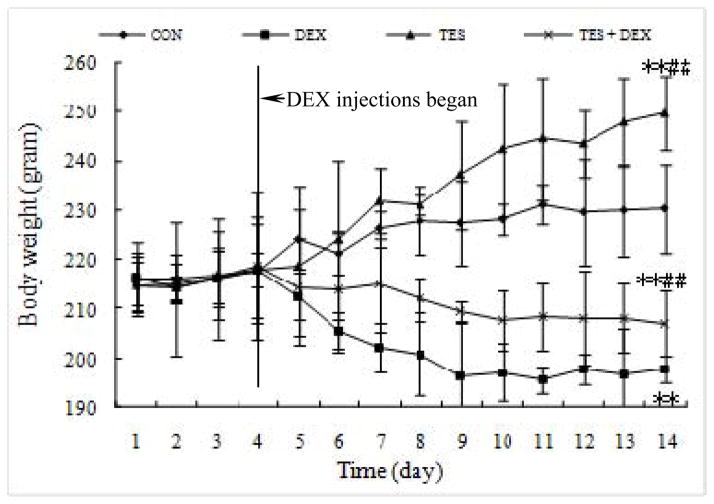
The body weights of various groups of animals during the studies are shown in Figure 2. There were no statistical differences in the average initial body weight among these groups. During the 13 days of treatment, the TES group and CON group steadily gained body weight while the DEX group and TES+DEX group progressively lost their weight after dexamethasone injections. By the end of the study, body weight was 14.2% (P<0.01) lower in the DEX group and 8.4% (P<0.01) higher in the TES group than in the CON group (230.4±8.9 g). However, The body weight was 4.7% (P<0.01) higher in TES+DEX group than in the DEX group.
Fig. 2.
Effects of dexamethasone (DEX) and testosterone (TES) treatment on body weights. **P<0.01 vs. CON group, ##P<0.01 vs. DEX group. N=10 per group.
Testosterone partially prevented the reduction of gastrocnemius muscle weight and muscle fiber CSA induced by dexamethasone
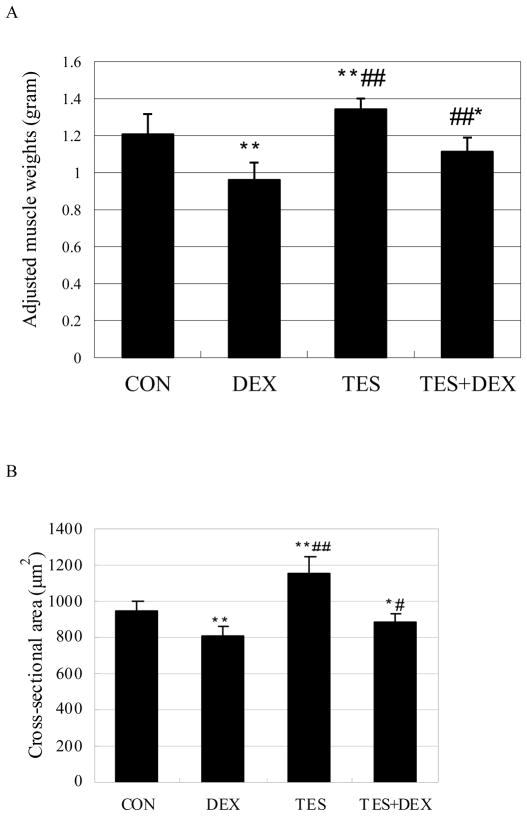
The average muscle weight of each experimental group was adjusted (see MATERIALS AND METHODS). The adjusted average muscle weight of each experimental group was shown in Figure 3. The gastrocnemius muscle weight was 20.4% (P<0.01) lower in the DEX group and 11.3% (P<0.01) higher in the TES group than in the CON group (1.20 ± 0.11 g). However, the muscle weight was 15.9% (P<0.01) higher in DEX+TES group than in the DEX group (Fig. 3A). The differences in muscle fiber CSA between groups showed the same pattern of changes as that in muscle weight. Muscle fiber CSA was 14.5% (P<0.01) lower in the DEX group and 21.9% (P<0.01) higher in the TES group than in the CON group (949.9 ± 45.7 μm2), and was 8.6% (P<0.01) higher in the TES+DEX group than in the DEX group (Fig. 3B).
Fig. 3.
Effects of DEX and TES treatment on gastrocnemius muscle weight and muscle fiber cross-sectional area (CSA). *P<0.05 and **P<0.01 vs. CON group, #P<0.05 and ##P<0.01 vs. DEX group. N=10 per group.
Testosterone prevented the decrease of muscle IGF-I mRNA expression, but failed to prevent the decrease of serum IGF-I concentration induced by dexamethasone
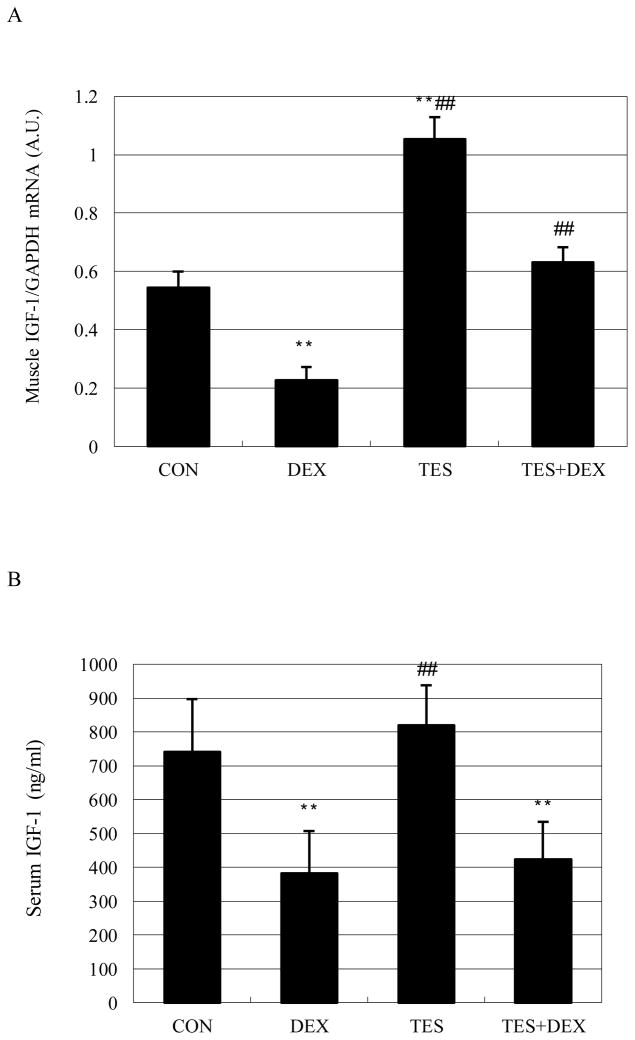
Muscle IGF-I mRNA expression was 58.2% (P<0.01) lower in the DEX group and 94.1% (P<0.01) higher in the TES group than in the CON group, and was 178% (P<0.01) higher in the TES+DEX group than in the DEX group (Fig. 4A). Serum IGF-I concentration was 48.5% (P<0.05) lower in the DEX group than in the CON group (742±156 ng/ml). There were no significant differences in IGF-I concentration between TES group and CON group, and between TES+DEX group and DEX group (Fig. 4B).
Fig. 4.
Effects of DEX and TES treatment on IGF-I mRNA expression in skeletal muscle (N=6 per group) and serum IGF-I concentration (N=10 per group). IGF-I mRNA expression in gastrocnemius muscle was analyzed by real-time PCR. Serum IGF-I was analyzed by ELISA. **P<0.01 vs. CON group, ##P<0.01 vs. DEX group. GAPDH, glyceraldehyde-3-phosphate dehydrogenase; A.U., arbitrary units.
Testosterone prevented dephosphorylation of Akt protein induced by dexamethasone
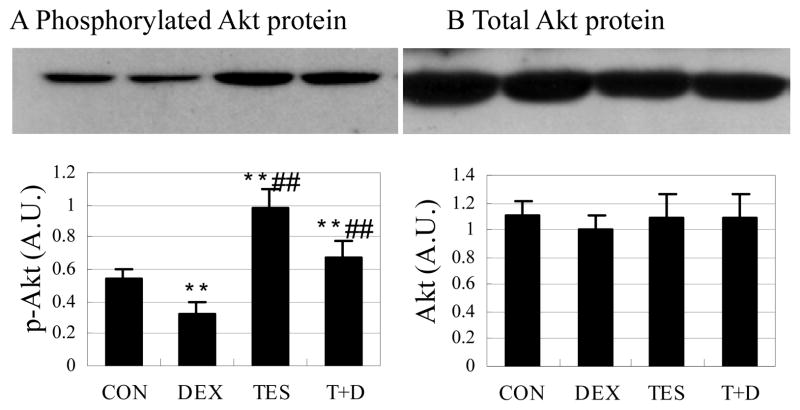
Phosphorylated Akt was 39.4% (P<0.01) lower in the DEX group and 84.1% (P<0.01) higher in the TES group than in the CON group, and was 109% (P<0.01) higher in the TES+DEX group than in the DEX group (Fig. 5A). There were no significant differences in total Akt protein expression between groups (Fig. 5B).
Fig. 5.
Effects of DEX and TES treatment on phosphorylation of Akt in skeletal muscle. Top: Akt protein expression in gastrocnemius muscle was analyzed by Western blot. Bottom: Akt protein was quantified by optical densitometry. **P<0.01 vs. CON group, ##P<0.01 vs. DEX group. N=5 per group.
Testosterone increased phosphorylation of GSK-3β protein
There was no significant difference in phosphorylated GSK-3β between DEX group and CON group. Phosphorylated GSK-3β was 615.0% higher in the TES group (P<0.01) than in the CON group, and was 140.4% (P<0.01) higher in the TES+DEX group than in the DEX group (Fig. 6A). There was no significant difference in total GSK-3β protein expression between groups (Fig. 6B).
Fig. 6.
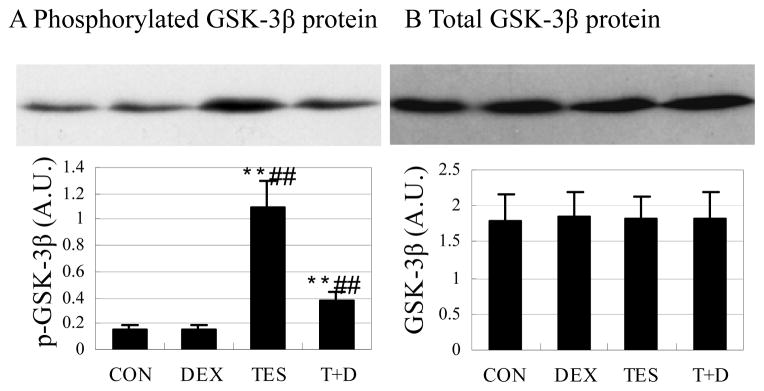
Effects of DEX and TES treatment on phosphorylation of GSK-3β in skeletal muscle. Top: GSK-3β protein expression in gastrocnemius muscle was analyzed by Western blot. Bottom: GSK-3β protein was quantified by optical densitometry. **P<0.01 vs. CON group, ##P<0.01 vs. DEX group. N=5 per group.
Testosterone partly prevented dephosphorylation of p70S6K protein induced by dexamethasone
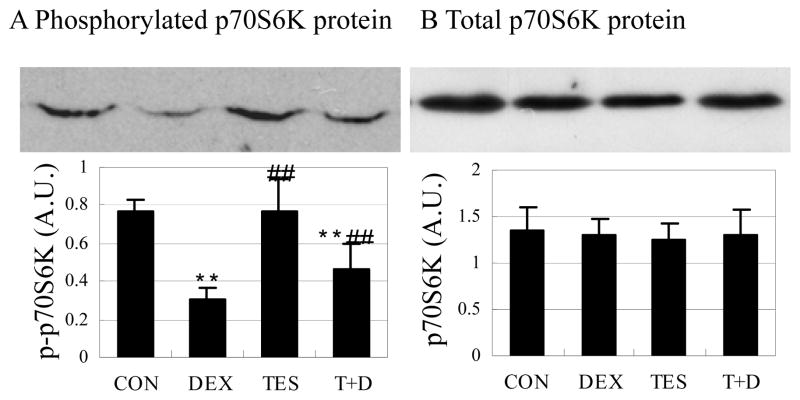
Phosphorylated p70S6K was 60.7% lower in the DEX group (P<0.01) than in the CON group. There was no significant difference in phosphorylated p70S6K between TES group and CON group. Phosphorylated p70S6K was 55.2% higher in the TES+DEX group (P<0.01) than in the DEX group (Fig. 7A). There were no significant differences in total p70S6K protein expression between groups (Fig. 7B).
Fig. 7.
Effects of DEX and TES treatment on phosphorylation of p70S6K in skeletal muscle. Top: p70S6K protein expression in gastrocnemius muscle was analyzed by Western blot. Bottom: p70S6K protein was quantified by optical densitometry. **P<0.01 vs. CON group, ##P<0.01 vs. DEX group. N=5 per group.
Testosterone failed to prevent the increase of muscle MAFbx and MuRF1 mRNA expression induced by dexamethasone
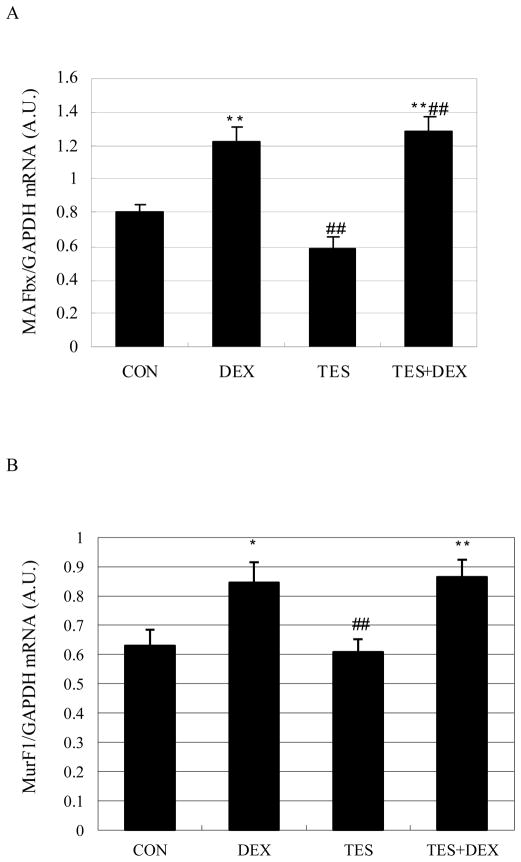
Muscle MAFbx and MuRF1 mRNA expression was 52.6% (P<0.01) higher and 34.2% (P<0.05) higher in the DEX group than in the CON group, respectively. There were no significant differences in MAFbx and MuRF1 mRNA expression between TES group and CON group, and between TES+DEX group and DEX group (Fig. 8).
Fig. 8.
Effects of DEX and TES treatment on MAFbx and MuRF1 mRNA expression in skeletal muscle. mRNA expression in gastrocnemius muscle was analyzed by real-time PCR. *P<0.05 and **P<0.01 vs. CON group, ##P<0.01 vs. DEX group. N=6 per group. GAPDH, glyceraldehyde-3-phosphate dehydrogenase; A.U., arbitrary units.
DISCUSSION
The present study aims at exploring the molecular mechanisms of the anabolic effects of testosterone on muscle protein metabolism in a dexamethasone-induced muscle wasting animal model. The observed catabolic effects of dexamethasone were similar to those reported before 13,16,17. We found that testosterone significantly reduced the body weight loss of the dexamethasone-treated animals, indicating the anabolic effects of testosterone against dexamethasone at the whole body level.
In the present study, the investigations on muscle weights and morphological changes were focused on the hindlimb gastrocnemius muscle, based on the consideration that glucocorticoid-induced protein degradation and muscle atrophy occur predominantly in the fast-twitch muscle fibers 18–20, which is the major component (94%) of the gastrocnemius muscle 21. In addition, the response of fast-twitch muscle fibers seems more sensitive to glucocorticoid and androgen 4,22–24. The present study confirmed the catabolic effect of dexamethasone on muscle wasting by a reduction in both the weight and CSA of the gastrocnemius muscle.
Our study further revealed that dexamethasone treatment caused a reduction of the IGF-I mRNA expression in skeletal muscle and IGF-I protein level in serum. These findings are in agreement with previously reported observations on corticosteroid-treated rats 8, confirming that the catabolic effects of glucocorticoids at least include a mechanism of inhibiting the expression of anabolic agent IGF-I.
In recent years, there have been accumulated evidences that the autocrine and paracrine IGF system within skeletal muscle plays an important role in myogenesis and maintenance of muscle fiber growth 25. More recent studies have suggested that the anabolic effects of androgens in muscle may be mediated, in part, by local IGF-I 10. Our study revealed that androgen treatment increased IGF-I mRNA expression in skeletal muscles in both saline-treated and dexamethasone-treated groups, indicating that the increased IGF-I is associated with the mechanism of the anabolic effects of androgen. The relationship between anabolic effects of androgen and the level of IGF-I mRNA has also been reported before. Previous in vitro study revealed that androgen treatment increased IGF-I mRNA in bovine satellite cells 9. Furthermore, Similar to our findings, in vivo administration of nandrolone, another analogue of androgens was found to produce significantly higher levels of IGF-I in rat muscles compared with those without nandrolone treatment 10. Therefore, the mechanisms of the anabolic effects of androgen are related to the expression of the anabolic factor IGF-I.
More recent research on molecular basis of muscle metabolism has shed further mechanistic insights into the anabolic effects of IGF-I. The binding of IGF-I to its receptor results in activation of the PI3K. PI3K transfers a phosphate group to the membrane-bound PIP2 to generate PIP3. PIP3 serves as a nucleation site for Akt and PDK1. PDK1 phosphorylates and activates Akt, which, in turn, catalyzes the transfer of phosphate groups to several substrates. Akt-mediated phosphorylation of the mTOR phosphorylates the p70S6K which is known to phosphorylate the ribosomal protein S6 and consequently results in ribosome biogenesis and protein synthesis. Phosphorylation of the mTOR also promotes protein synthesis by relieving 4EBP1-mediated inhibition of eIF-4E. Akt phosphorylates and inhibits GSK-3β, another substrate of Akt, which activates the eukaryotic translation factor eIF-2B and increases protein synthesis 26–30. Now we also know that PI3K/Akt signaling pathway is not specific to IGF-I. Insulin can also activate the PI3K/Akt signaling pathway by its own receptor.
The molecular mechanisms of the anabolic effects of androgen are still under investigation. Recent reports by Xu et al 12 suggested that phosphorylation of p70S6K is implicated in androgen-induced muscle anabolism. Since phosphorylation of p70S6K is an important component downstream of PI3K/Akt signaling pathway, it had been speculated that the anabolic effects of androgen are related to the signaling pathways downstream of IGF-I/insulin. The current study for the first time provides evidence that testosterone treatment changed the activity of several downstream targets of IGF-I/insulin that are associated with protein synthesis: Testosterone ameliorated dexamethasone-induced dephosphorylation of Akt and p70S6K, and promoted the phosphorylation of GSK-3β in gastrocnemius muscle. Therefore, the results of the present study mechanistically confirmed that the anabolic effects of androgen are related to the activity of downstream targets of IGF-I/insulin that are associated with protein synthesis.
The involvement of the ubiquitin-proteasome pathway in skeletal muscle protein breakdown had been well-established 31. Differential expression screening studies, designed to identify markers of the atrophy process, identified two E3 ubiquitin ligases, MuRF1 and MAFbx whose mRNA expression increased significantly in multiple models of skeletal muscle atrophy 32–34. In all, 13 distinct models of skeletal muscle atrophy have been shown to result in an increase of MAFbx and MuRF1 32,33,35–41. More recent studies have shown that the in vitro treatment of myotubes with dexamethasone induces atrophy, accompanied by a specific increase in the expression of MAFbx and MuRF1 42,43. The upregulation of MAFbx and MuRF1 was antagonized by simultaneous treatment with IGF-I 42–44, also acting through the PI3K/Akt pathway. Therefore, the PI3K/Akt pathway is involved not only in stimulating skeletal muscle protein synthesis, but also antagonizing the proteolysis via MAFbx and MuRF1. The mechanism by which Akt inhibited MAFbx and MuRF1 upregulation involves the FOXO family of transcription factors 42,43. However, in the present study, in spite of increased Akt phosphorylation, testosterone failed to show significant effects on the dexamethasone-stimulated upregulation of MAFbx and MuRF1 expression. We considered two plausible interpretations. First, testosterone-stimulated Akt phosphorylation may not reach the level to inhibit the dexamethasone-induced upregulation of MAFbx and MuRF1 expression in this animal model. Second, the expression of MAFbx and MuRF1 was only measured at one particular time point and one dose of each agent. We cannot exclude the possibility that the expression of MAFbx and MuRF1 may change at other time points or other doses of testosterone or dexamethasone.
In summary, the present study demonstrated that testosterone remarkably reverses dexamethasone-induced muscle atrophy. We also demonstrated that the mechanisms of androgen’s effects in reversing muscle atrophy are related to activating the downstream targets, Akt, p70S6K and GSK-3β of IGF-I/insulin. It is possible to speculate that the results of the present study may be extrapolated as a molecular basis for use of androgen in critically ill catabolic patients.45 However, our findings do not rule out the possibility that other mechanisms, such as inhibition of myostatin or an apoptotic signaling pathway, may also be involved in potential benefits of androgen against muscle wasting.
Acknowledgments
GRANTS
This work was supported by grants from the National Natural Science Foundation (China, no. 30571919), and the Natural Science Foundation of Beijing (China, no. 7072077).
Contributor Information
Hui-Nan Yin, Email: yinhuinan@gmail.com.
Jia-Ke Chai, Email: cjk304@126.com.
Yong-Ming Yu, Email: yyu@partners.org.
Chuan-An Shen Wu, Email: shenchuanan@hotmail.com, wuchen20012001@yahoo.com.cn.
Yong-Ming Yao, Email: c_ff@sina.com.
Hui Liu, Email: skyphoenix@56.com.
Li-Ming Liang, Email: liangliming304@hotmail.com.
Ronald G. Tompkins, Email: rtompkins@partners.org.
Zhi-Yong Sheng, Email: 13120455689@m165.com.
References
- 1.Tiao G, Fagan J, Roegner V, et al. Energy-ubiquitin-dependent muscle proteolysis during sepsis in rats is regulated by glucocorticoids. J Clin Invest. 1996;97:339–348. doi: 10.1172/JCI118421. [DOI] [PMC free article] [PubMed] [Google Scholar]
- 2.Fang CH, James HJ, Ogle C, Fischer JE, Hasselgren PO. Influence of burn injury on protein metabolism in different types of skeletal muscle and the role of glucocorticoids. J Am Coll Surg. 1995;180:33–42. [PubMed] [Google Scholar]
- 3.Crawford BA, Liu PY, Kean MT, Bleasel JF, Handelsman DJ. Randomized placebo-controlled trial of androgen effects on muscle and bone in men requiring long-term systemic glucocorticoid treatment. J Clin Endocrinol Metab. 2003;88:3167–3176. doi: 10.1210/jc.2002-021827. [DOI] [PubMed] [Google Scholar]
- 4.Creutzberg EC, Schols AM. Anabolic steroids. Curr Opin Clin Nutr Metab Care. 1999;2:243–253. doi: 10.1097/00075197-199905000-00008. [DOI] [PubMed] [Google Scholar]
- 5.Creutzberg EC, Wouters EF, Mostert R, Pluymers RJ, Schols AM. A role for anabolic steroids in the rehabilitation of patients with COPD? A double-blind, placebo-controlled, randomized trial. Chest. 2003;124:1733–1742. doi: 10.1378/chest.124.5.1733. [DOI] [PubMed] [Google Scholar]
- 6.Vary TC. IGF-I stimulates protein synthesis in skeletal muscle through multiple signaling pathways during sepsis. Am J Physiol Regul Integr Comp Physiol. 2006;290:R313–321. doi: 10.1152/ajpregu.00333.2005. [DOI] [PubMed] [Google Scholar]
- 7.Lang CH, Frost RA, Vary TC. Regulation of muscle protein synthesis during sepsis and inflammation. Am J Physiol Endocrinol Metab. 2007;293:E453–459. doi: 10.1152/ajpendo.00204.2007. [DOI] [PubMed] [Google Scholar]
- 8.Gayan-Ramirez G, Vanderhoydonc F, Verhoeven G, Decramer M. Acute treatment with corticosteroids decreases IGF-1 and IGF-2 expression in the rat diaphragm and gastrocnemius. Am J Respir Crit Care Med. 1999;159:283–289. doi: 10.1164/ajrccm.159.1.9803021. [DOI] [PubMed] [Google Scholar]
- 9.Kamanga-Sollo E, Pampusch MS, Xi G, White ME, Hathaway MR, Dayton WR. IGF-I mRNA levels in bovine satellite cell cultures: effects of fusion and anabolic steroid treatment. J Cell Physiol. 2004;201:181–189. doi: 10.1002/jcp.20000. [DOI] [PubMed] [Google Scholar]
- 10.Lewis MI, Horvitz GD, Clemmons DR, Fournier M. Role of IGF-I and IGF-binding proteins within diaphragm muscle in modulating the effects of nandrolone. Am J Physiol Endocrinol Metab. 2002;282:E483–490. doi: 10.1152/ajpendo.00191.2001. [DOI] [PubMed] [Google Scholar]
- 11.Gayan-Ramirez G, Rollier H, Vanderhoydonc F, Verhoeven G, Gosselink R, Decramer M. Nandrolone decanoate does not enhance training effects but increases IGF-I mRNA in rat diaphragm. J Appl Physiol. 2000;88:26–34. doi: 10.1152/jappl.2000.88.1.26. [DOI] [PubMed] [Google Scholar]
- 12.Xu T, Shen Y, Pink H, et al. Phosphorylation of p70s6 kinase is implicated in androgen-induced levator ani muscle anabolism in castrated rats. J Steroid Biochem Mol Biol. 2004;92:447–454. doi: 10.1016/j.jsbmb.2004.07.008. [DOI] [PubMed] [Google Scholar]
- 13.Eason JM, Dodd SL, Powers SK. Use of anabolic steroids to attenuate the effects of glucocorticoids on the rat diaphragm. Phys Ther. 2003;83:29–36. [PubMed] [Google Scholar]
- 14.Konno S. Hydroxyl radical formation in skeletal muscle of rats with glucocorticoid-induced myopathy. Neurochem Res. 2005;30:669–675. doi: 10.1007/s11064-005-2755-4. [DOI] [PubMed] [Google Scholar]
- 15.Ma K, Mallidis C, Bhasin S, et al. Glucocorticoid-induced skeletal muscle atrophy is associated with upregulation of myostatin gene expression. Am J Physiol Endocrinol Metab. 2003;285:E363–371. doi: 10.1152/ajpendo.00487.2002. [DOI] [PubMed] [Google Scholar]
- 16.Fletcher LK, Powers SK, Coombes JS, et al. Glucocorticoid-induced alterations in the rate of diaphragmatic fatigue. Pharmacol Res. 2000;42:61–68. doi: 10.1006/phrs.1999.0658. [DOI] [PubMed] [Google Scholar]
- 17.Dodd SL, Powers SK, Vrabas IS, Eason JM. Interaction of glucocorticoids and activity patterns affect muscle function. Muscle Nerve. 1995;18:190–195. doi: 10.1002/mus.880180207. [DOI] [PubMed] [Google Scholar]
- 18.Fang CH, Li BG, Tiao G, Wang JJ, Fischer JE, Hasselgren PO. The molecular regulation of protein breakdown following burn injury is different in fast- and slow-twitch skeletal muscle. Int J Mol Med. 1998;1:163–169. doi: 10.3892/ijmm.1.1.163. [DOI] [PubMed] [Google Scholar]
- 19.Roy RR, Gardiner PF, Simpson DR, Edgerton VR. Glucocorticoid-induced atrophy in different fibre types of selected rat jaw and hind-limb muscles. Arch Oral Biol. 1983;28:639–643. doi: 10.1016/0003-9969(83)90012-2. [DOI] [PubMed] [Google Scholar]
- 20.Tiao G, Lieberman M, Fischer JE, Hasselgren PO. Intracellular regulation of protein degradation during sepsis is different in fast- and slow-twitch muscle. Am J Physiol. 1997;272:R849–856. doi: 10.1152/ajpregu.1997.272.3.R849. [DOI] [PubMed] [Google Scholar]
- 21.Dumas JF, Simard G, Roussel D, et al. Mitochondrial energy metabolism in a model of undernutrition induced by dexamethasone. Br J Nutr. 2003;90:969–977. doi: 10.1079/bjn2003980. [DOI] [PMC free article] [PubMed] [Google Scholar]
- 22.Lewis MI, Monn SA, Sieck GC. Effect of corticosteroids on diaphragm fatigue, SDH activity, and muscle fiber size. J Appl Physiol. 1992;72:293–301. doi: 10.1152/jappl.1992.72.1.293. [DOI] [PubMed] [Google Scholar]
- 23.Dekhuijzen PN, Gayan-Ramirez G, Bisschop A, De Bock V, Dom R, Decramer M. Corticosteroid treatment and nutritional deprivation cause a different pattern of atrophy in rat diaphragm. J Appl Physiol. 1995;78:629–637. doi: 10.1152/jappl.1995.78.2.629. [DOI] [PubMed] [Google Scholar]
- 24.Van Balkom RH, Zhan WZ, Prakash YS, Dekhuijzen PN, Sieck GC. Corticosteroid effects on isotonic contractile properties of rat diaphragm muscle. J Appl Physiol. 1997;83:1062–1067. doi: 10.1152/jappl.1997.83.4.1062. [DOI] [PubMed] [Google Scholar]
- 25.Adams GR. Autocrine/paracrine IGF-I and skeletal muscle adaptation. J Appl Physiol. 2002;93:1159–1167. doi: 10.1152/japplphysiol.01264.2001. [DOI] [PubMed] [Google Scholar]
- 26.Hardt SE, Sadoshima J. Glycogen synthase kinase-3beta: a novel regulator of cardiac hypertrophy and development. Circ Res. 2002;90:1055–1063. doi: 10.1161/01.res.0000018952.70505.f1. [DOI] [PubMed] [Google Scholar]
- 27.Cross DA, Alessi DR, Cohen P, Andjelkovich M, Hemmings BA. Inhibition of glycogen synthase kinase-3 by insulin mediated by protein kinase B. Nature. 1995;378:785–789. doi: 10.1038/378785a0. [DOI] [PubMed] [Google Scholar]
- 28.Rommel C, Bodine SC, Clarke BA, et al. Mediation of IGF-1-induced skeletal myotube hypertrophy by PI(3)K/Akt/mTOR and PI(3)K/Akt/GSK3 pathways. Nat Cell Biol. 2001;3:1009–1013. doi: 10.1038/ncb1101-1009. [DOI] [PubMed] [Google Scholar]
- 29.Evenson AR, Fareed MU, Menconi MJ, Mitchell JC, Hasselgren PO. GSK-3beta inhibitors reduce protein degradation in muscles from septic rats and in dexamethasone-treated myotubes. Int J Biochem Cell Biol. 2005;37:2226–2238. doi: 10.1016/j.biocel.2005.06.002. [DOI] [PubMed] [Google Scholar]
- 30.Vyas DR, Spangenburg EE, Abraha TW, Childs TE, Booth FW. GSK-3beta negatively regulates skeletal myotube hypertrophy. Am J Physiol Cell Physiol. 2002;283:C545–551. doi: 10.1152/ajpcell.00049.2002. [DOI] [PubMed] [Google Scholar]
- 31.Tisdale MJ. The ubiquitin-proteasome pathway as a therapeutic target for muscle wasting. J Support Oncol. 2005;3:209–217. [PubMed] [Google Scholar]
- 32.Bodine SC, Latres E, Baumhueter S, et al. Identification of ubiquitin ligases required for skeletal muscle atrophy. Science. 2001;294:1704–1708. doi: 10.1126/science.1065874. [DOI] [PubMed] [Google Scholar]
- 33.Gomes MD, Lecker SH, Jagoe RT, Navon A, Goldberg AL. Atrogin-1, a muscle-specific F-box protein highly expressed during muscle atrophy. Proc Natl Acad Sci U S A. 2001;98:14440–14445. doi: 10.1073/pnas.251541198. [DOI] [PMC free article] [PubMed] [Google Scholar]
- 34.Cao PR, Kim HJ, Lecker SH. Ubiquitin-protein ligases in muscle wasting. Int J Biochem Cell Biol. 2005;37:2088–2097. doi: 10.1016/j.biocel.2004.11.010. [DOI] [PubMed] [Google Scholar]
- 35.Leger B, Vergani L, Soraru G, et al. Human skeletal muscle atrophy in amyotrophic lateral sclerosis reveals a reduction in Akt and an increase in atrogin-1. Faseb J. 2006;20:583–585. doi: 10.1096/fj.05-5249fje. [DOI] [PubMed] [Google Scholar]
- 36.Dehoux M, Van Beneden R, Pasko N, et al. Role of the insulin-like growth factor I decline in the induction of atrogin-1/MAFbx during fasting and diabetes. Endocrinology. 2004;145:4806–4812. doi: 10.1210/en.2004-0406. [DOI] [PubMed] [Google Scholar]
- 37.Dehoux MJ, van Beneden RP, Fernandez-Celemin L, Lause PL, Thissen JP. Induction of MafBx and Murf ubiquitin ligase mRNAs in rat skeletal muscle after LPS injection. FEBS Lett. 2003;544:214–217. doi: 10.1016/s0014-5793(03)00505-2. [DOI] [PubMed] [Google Scholar]
- 38.Lee SW, Dai G, Hu Z, Wang X, Du J, Mitch WE. Regulation of muscle protein degradation: coordinated control of apoptotic and ubiquitin-proteasome systems by phosphatidylinositol 3 kinase. J Am Soc Nephrol. 2004;15:1537–1545. doi: 10.1097/01.asn.0000127211.86206.e1. [DOI] [PubMed] [Google Scholar]
- 39.DeRuisseau KC, Kavazis AN, Deering MA, et al. Mechanical ventilation induces alterations of the ubiquitin-proteasome pathway in the diaphragm. J Appl Physiol. 2005;98:1314–1321. doi: 10.1152/japplphysiol.00993.2004. [DOI] [PubMed] [Google Scholar]
- 40.Latres E, Amini AR, Amini AA, et al. Insulin-like growth factor-1 (IGF-1) inversely regulates atrophy-induced genes via the phosphatidylinositol 3-kinase/Akt/mammalian target of rapamycin (PI3K/Akt/mTOR) pathway. J Biol Chem. 2005;280:2737–2744. doi: 10.1074/jbc.M407517200. [DOI] [PubMed] [Google Scholar]
- 41.Li YP, Chen Y, Li AS, Reid MB. Hydrogen peroxide stimulates ubiquitin-conjugating activity and expression of genes for specific E2 and E3 proteins in skeletal muscle myotubes. Am J Physiol Cell Physiol. 2003;285:C806–812. doi: 10.1152/ajpcell.00129.2003. [DOI] [PubMed] [Google Scholar]
- 42.Sandri M, Sandri C, Gilbert A, et al. Foxo transcription factors induce the atrophy-related ubiquitin ligase atrogin-1 and cause skeletal muscle atrophy. Cell. 2004;117:399–412. doi: 10.1016/s0092-8674(04)00400-3. [DOI] [PMC free article] [PubMed] [Google Scholar]
- 43.Stitt TN, Drujan D, Clarke BA, et al. The IGF-1/PI3K/Akt pathway prevents expression of muscle atrophy-induced ubiquitin ligases by inhibiting FOXO transcription factors. Mol Cell. 2004;14:395–403. doi: 10.1016/s1097-2765(04)00211-4. [DOI] [PubMed] [Google Scholar]
- 44.Sacheck JM, Ohtsuka A, McLary SC, Goldberg AL. IGF-I stimulates muscle growth by suppressing protein breakdown and expression of atrophy-related ubiquitin ligases, atrogin-1 and MuRF1. Am J Physiol Endocrinol Metab. 2004;287:E591–601. doi: 10.1152/ajpendo.00073.2004. [DOI] [PubMed] [Google Scholar]
- 45.Wolf SE, Edelman LS, Kemalyan N, et al. Effects of oxandrolone on outcome measures in the severely burned: a multicenter prospective randomized double-blind trial. J Burn Care Res. 2006;27:131–139. doi: 10.1097/01.BCR.0000202620.55751.4F. [DOI] [PubMed] [Google Scholar]


