


Abstract
For the Library of Integrated Network-based Cellular Signatures (LINCS) project many gene expression signatures using the L1000 technology have been produced. The L1000 technology is a cost-effective method to profile gene expression in large scale. LINCS Canvas Browser (LCB) is an interactive HTML5 web-based software application that facilitates querying, browsing and interrogating many of the currently available LINCS L1000 data. LCB implements two compacted layered canvases, one to visualize clustered L1000 expression data, and the other to display enrichment analysis results using 30 different gene set libraries. Clicking on an experimental condition highlights gene-sets enriched for the differentially expressed genes from the selected experiment. A search interface allows users to input gene lists and query them against over 100 000 conditions to find the top matching experiments. The tool integrates many resources for an unprecedented potential for new discoveries in systems biology and systems pharmacology. The LCB application is available at http://www.maayanlab.net/LINCS/LCB. Customized versions will be made part of the http://lincscloud.org and http://lincs.hms.harvard.edu websites.
INTRODUCTION
Gene expression-based high-throughput screening
Gene expression-based high-throughput screening (GE-HTS) has the potential to transform biomedicine and accelerate drug discovery by linking many bioactive molecular perturbations to their cellular phenotypes through the molecular regulatory mechanisms those perturbations induce (1,2). GE-HTS was applied to identify potentially useful drugs to treat diseases such as leukemia (3) and skeletal muscle atrophy (4), to identify heat shock protein (HSP) (5) and PDGFR pathway inhibitors (6), to suggest drug repositioning strategies (7) and to assist with drug resistance strategies (8). GE-HTS data is designed for reuse. Gene expression changes in response to perturbations are distilled into a set of differentially expressed gene signatures. This enables the query of an input gene list against thousands of signatures collected by GE-HTS. The first implementation of a GE-HTS platform was reported in a seminal publication in Science in 2006 by Lamb et al. (9). The project was termed the Connectivity Map (CMAP). CMAP data was collected from four human cell lines treated with ∼1300 drugs, including many Food and Drug Administration (FDA) approved, in different concentrations. Subsequently to those treatments, genome-wide gene expression messenger ribonucleic acid (mRNA) profiling was conducted after 6 h using the then widely popular Human Affymetrix U133 microarray platform. The results are delivered through a web-based query tool where users can enter their own lists of up- and down-regulated genes and receive matched experiments. This tool and the data are available freely to registered users at https://www.broadinstitute.org/cmap/. The idea behind CMAP was well received and led to the creation of a new and more extensive version of CMAP.
LINCS and the L1000 technology
The Library of Integrated Network-based Cellular Signatures (LINCS) project is a Common Fund program administrated by the National Institutes of Health (NIH). The funds for this project enabled the generation of approximately one million gene expression profiles using the L1000 technology. The L1000 technology was developed for the new version of CMAP by the same group that developed the original CMAP at the Broad Institute. The L1000 technology is a high-throughput method to estimate genome-wide mRNA expression. The L1000 platform measures only about 1000 genes in each experiment. The rest of the transcriptome, approximately 22 000 genes, are estimated by a model built from computational processing of thousands of gene expression datasets from Gene Expression Omnibus (GEO) (10). The rationale behind this model is that gene expression data contain high degree of statistical dependencies between measured variables (mRNAs) and the selected 1000 landmark genes would capture most of the information contained within the entire transcriptome. This assertion has been benchmarked with gene expression data profiled using Affymetrix whole transcriptome microarrays including the datasets that were developed for creating the first version of CMAP (9). Such benchmarking activity is not part of the software development project described in detail here. The L1000 platform assay starts with amplifying mRNAs from crude cell lysates using ligation mediated amplification (11). Probes contain an upstream part and a downstream part. Both parts are made of gene specific sequences. Probes are annealed to reversely transcribed complementary deoxyribonucleic acid (cDNAs), created from the isolated mRNAs, and then ligated by a taq ligase. Probes are then polymerase chainreaction amplified and hybridized to barcoded Luminex beads through the probes’ gene specific barcode region. The hybridized beads are then detected and quantified using the Luminex FLEXMAP 3D® technology (12). This technology utilizes laser beams to detect the identity of the differentially-dyed beads and to measure the density of the hybridized probes on each bead. Besides landmark genes, an additional 80 invariantly expressed transcripts are measured to calibrate and normalize overall gene expression measurements in each plate. The reduced number of variables required to estimate the entire transcriptome keeps the cost low. This makes the L1000 technology suitable for GE-HTS and for fulfilling the aim of LINCS: cataloging changes in gene expression that occur when cells are exposed to many perturbing agents.
Description of the L1000 data
So far the data that has been collected and made available by the L1000 technology comprise 22 412 unique perturbations applied to 56 different cellular contexts including human primary cell lines and human cancer cell lines. 16 425 of the perturbations are chemical reagents including drugs, ligands and other small molecules applied at different time points and doses. 5806 of the perturbations are genetic perturbations including knockdowns and over-expression of single genes. The knockdown experiments utilize RNAi technology and multiple miRNAs are employed to target the same gene to reduce potential off-target effects. The total number of gene expression profiles measured to date adds up to about a million. Since all experiments were done on human cells using well defined and organized sets of perturbations, using the same platform, it is possible to develop methods that would be able to produce collective meaningful searches and visualization capabilities for this large dataset.
The challenge of data analysis and data visualization of the L1000 dataset
The L1000 dataset can be considered as a big matrix where the rows are the 22 268 genes and the columns are the million perturbations. Such a large dataset presents new challenges to computational systems biologists who aim to analyze and visualize Big Data. Standard methods such as principle component analysis (13) or hierarchical clustering (14) do not scale up well when thousands of conditions are considered. One common method for visualizing large scale data is ball-and-stick network diagrams. These diagrams are known to become meaningless once their size is >∼100 nodes and ∼200 links. For developing the LINCS Canvas Browser (LCB), we first divided the data by batch and cell-line. A batch is a collection of experiments that were processed by the L1000 in one experimental run, each batch typically contain ∼3000 expression profiles where each experimental condition is repeated typically four times. We then implemented a compact data visualization strategy using layered canvases that are made of two-dimensional projections of a continuous grid (torus). With this method we are able to cluster and visualize up to 1000 different related L1000 conditions at once on the same canvas. The canvas concept is similar to self-organizing maps (15) and was previously implemented to visualize gene and protein expression changes of mouse embryonic stem cells undergoing differentiation (16,17), and for performing gene- and drug-set enrichment analyses (18). Recently, a similar approach was implemented to visualize transcription factor co-localization from the ENCODE dataset (19).
Gene set enrichment analyses
Gene-set enrichment analysis provides a way to examine potential biological functions for lists of genes (20). It is a straightforward approach to associate an L1000 perturbation signature with the molecular mechanisms that such perturbation induced in the specific experimental context. Gene-set enrichment analysis computes the overrepresentation of a predefined gene-set for an input gene-set (21). The analysis compares the input gene-set with a library of related gene-sets sharing the same type of function (21). For example, a gene set library can be made of targets of transcription factors extracted from ChIP-seq studies (22), substrates of a protein kinase collected from kinase-substrate phosphorylation interactions from the literature (23), or members of a pathway from pathway databases such as KEGG (24), BioCarta (25), Reactome (26) or WikiPathways (27). Many web-based or desktop enrichment analysis tools have been developed including the popular tools: GSEA-P (20), DAVID (28), FatiGO (29), g:Profiler (30), INMEX (31), GeneTrail (32), WebGestalt (33), Lists2Networks (34) and Enrichr (35). With all these tools, users need to provide their own differentially expression gene sets as the input. In addition to accepting input gene lists for analysis, LCB has many lists preloaded, and enrichment analysis can be performed in one click.
There are several methods to compute enrichment when assessing the overlap between gene-sets (21,36). Some examples are the Fisher's exact test (37), Gene Set Enrichment Analysis (GSEA) (20) and Random-Sets (RS) (38). The Fisher exact test places gene sets in a 2 × 2 contingency table. The entries in this table are the differentially expressed genes, the overlapping genes with a gene-set from the gene-set library, the genes from the gene-set from the library that do not overlap and all genes from the expression platform or the gene-set library. The test then computes overrepresentation of the overlap assuming a hyper-geometric distribution. GSEA uses a Kolmogorov–Smirnov test statistic to compute the enrichment score of a gene-set for a ranked list of differentially expressed genes. GSEA employs a permutation test to calculate the P-value of the enrichment score. RS calculates the enrichment score for a gene set using a similar method to the Welch's t-test statistic. RS also uses a permutation test to computes P-values. The permutation tests required by GSEA, RS and few other methods are more difficult to implement for a light-weight web-based software application such as LCB because they take a long time to execute. Hence, we chose the Fisher's exact test for the initial implementation for computing gene-set enrichment for LCB. Since LCB computes many enriched scores for many conditions, using many gene-set libraries, the Benjamini–Hochberg method to correct the P-values for multiple hypotheses testing is also implemented (39). The LCB is made of two web pages: the search interface and the browse interface. The search interface enables users to enter lists of up and down regulated genes and search for matched perturbations presented as a list of the 50 most similar experiments with links to the browse interface (Figure 1). The browse interface visualizes LINCS L1000 experiments and enrichment analysis results using two canvas layouts, one that visualizes the clustered L1000 experiments and one that visualizes the enrichment results (Figure 2).
Figure 1.
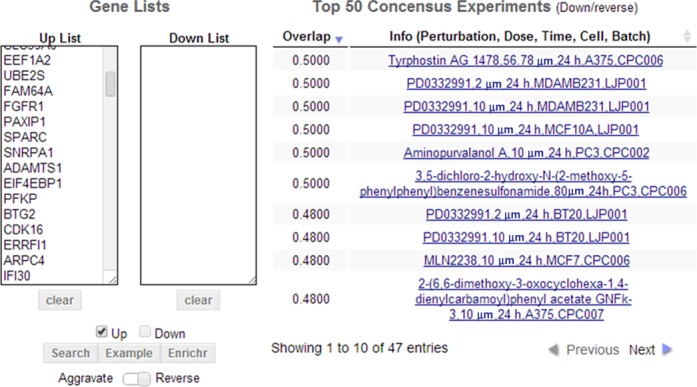
LCB search interface. Two textboxes are available to insert lists of up and down regulated genes. The search interface provides a link to the Enrichr software. Clicking this button passes the input gene lists to Enrichr for independent enrichment analysis in a new web page. The Example button fills the textboxes with sample lists. The Aggravate/Reverse slider swaps the up list with the down list so that the search is done in reverse mode. The result panel displays the top 50 matching experiments in a table where only 10 entries are displayed per page. The screenshot is from Case Study 1: searching for perturbations that could potentially reverse breast cancer progression and recurrence given a pre-compiled list of 374 breast cancer prognosis biomarker genes.
Figure 2.
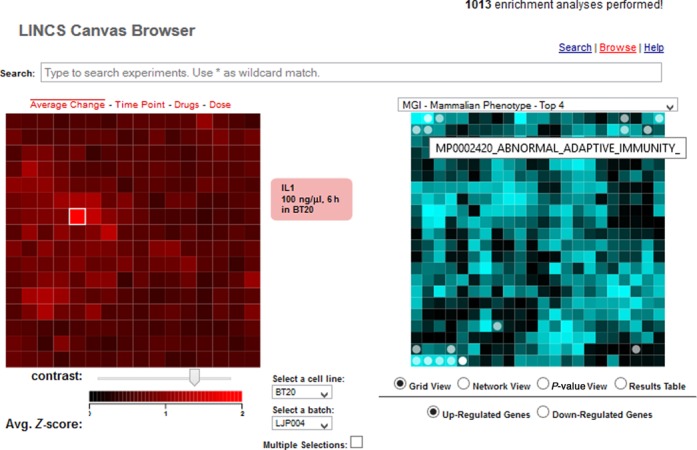
LCB browse interface. The browse interface has two types of canvases: The experiment canvases on the left and the enrichment canvases on the right. The experiment canvases are made of all experiments for a specific cell line in a specific batch. Each tile represents one condition and the tiles are arranged by gene content similarity. On the right the enrichment canvases display gene set enrichment results where each tile on these canvases represent a gene-set from a gene-set library. Gene-sets are arranged on the canvas based on their gene content similarity and enriched terms for the selected condition from the experiment canvas are highlighted in circles. Users can search for a specific condition using the search bar on the top, select a specific batch or cell type using the dropdown lists near the experiment canvases, and select a gene-set library using the dropdown menu on top of the enrichment canvases.
MATERIALS AND METHODS
The overall data-assembly workflow for the browse interface (Supplementary Figure S1) and the workflow for developing the search engine (Supplementary Figure S2) are provided as supporting figures. Detailed explanation of the methods used to create the various components of the web server software is provided below.
The experiment canvases
Each experiment canvas visualizes all experiments for a particular cell line in a specific batch. Each tile represents one experimental condition and similar experiments are placed together on the canvas. The similarity between experiments is calculated from the Z-score signatures of the 1000 measured genes using Pearson's correlation. A Z-score signature is a vector of moderated Z-scores calculated by the CMAP group at the Broad Institute from the replicates of an experimental condition as it compares with the population background. ‘Moderated’ means that the Z-scores take into account the quality of each replicate and give low weight to bad quality replicates when averaging them. Z-score signatures were downloaded using LINCS L1000 application programming interface.
The Network2Canvas algorithm (18) is applied to compute canvas layouts. This algorithm clusters experimental conditions based on their similarity using simulated annealing where each experiment is represented by a canvas tile. The canvases are then rendered by HTML SVG elements that are created and manipulated using the D3 JavaScript library (40). Four views are implemented to visualize the data from different perspectives. Within the average change view, the tiles are colored by their average change values (Figure 3A). Bright red indicates high signature strength, or in other words, more overall average change from the control. A slider below the canvas controls the contrast between the darkest and lightest colors. This feature can be used to highlight the most significant perturbations. The time point view colors the canvas by the time points and a legend beneath shows mapping between colors and time points (Figure 3B). The dose view colors canvases by dose level and has a similar legend as the time point view. The Drug view colors tiles by drugs or ligand types, and a dropdown menu beneath the canvas allows users to highlight tiles of the same drug or ligand perturbations (Figure 3C). The canvas is interactive. Mouse-hovering on a tile causes a red box to appear in the middle, displaying detailed information of the selected experimental condition. Clicking on a tile invokes gene-set enrichment analysis applied to the differentially expressed genes of the clicked tile, and the results are shown on the right panel gene-set library canvas (Figure 3D).
Figure 3.
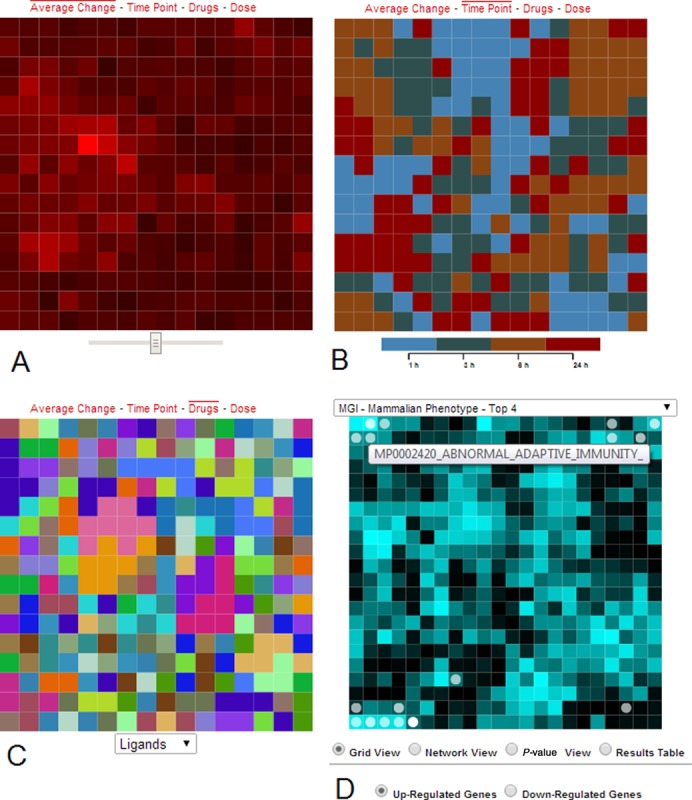
Four views of the clustered experimental data. (A) Tiles represent individual conditions and are colored by their average change where bright red indicates more change. A slider below the canvas controls contrast. (B) The time point view colors the canvas by time points. (C) The drug view colors tiles by drug or ligand types, and a dropdown menu beneath the canvas allows users to highlight tiles of the same drug or ligand perturbations. (D) Gene-set enrichment analysis results, applied to the differentially expressed genes of the clicked tile, are displayed on the MGI-MP gene-set library enrichment canvas. Each tile on this canvas represents a gene-set, and circles highlight the enriched terms. Bright tiles represent high similarity among gene sets in the local region of the bright tile. A list box on top of the canvas allows user to switch between 30 different gene set libraries. The canvases fold on themselves such that the edges are connected to opposite edges forming a torus.
The gene-set library (enrichment) canvases
A gene-set library canvas visualizes all gene-sets in a gene-set library. Each tile represents a gene-set and similar gene-sets are placed nearby on the canvas. LCB includes 30 gene-set libraries that were borrowed from the Network2Canvas and Enrichr applications (18,35). These libraries are divided into six categories: transcription, pathways, ontologies, diseases/drugs, cell-types and miscellaneous. The key information about each gene-set library is provided in Table 1. More details about the construction of each gene-set library can be found in the article that describes the software tool Enrichr (35). Canvases were created from gene-set libraries using the Sets2Networks algorithm (41) and then the Network2Canvas algorithm (42). Sets2Networks score set similarity by considering gene occurrence across the entire library of sets. The brightness is computed for each tile based on its similarity to its eight neighbors. The final brightness is adjusted for each gene set library to balance the overall brightness. The enrichment analysis in LCB implements the Fisher exact test to compute enrichment (36). To integrate the enrichment analysis canvases in LCB, a listener function listens to click events. These events are registered to each tile on the experiment canvases. When a user clicks on a tile, the listener function is invoked, and then the function passes the differentially expressed genes of that tile to the enrichment canvas. The enrichment canvas then takes the genes it just received, performs the enrichment analysis, and displays the result. Different enrichment canvases could be selected by the dropdown menu on the top of the enrichment canvases.
Table 1.
Information about the 30 gene-set libraries used in LCB
| Category | Name | Terms |
|---|---|---|
| Transcription | Chip-X Enrichment Analysis (ChEA) | Transcription factors |
| JASPAR + Transfac PWM | Transcription factors | |
| UCSC GenomeBrowser PWM | Transcription factors | |
| Histone Modifications ChIP-seq | Histone modifications | |
| Target Scan—MicroRNAs | MicroRNAs | |
| ENCODE Transcription Factors ChIP-seq | Transcription factors | |
| Pathway | KEGG Pathways | Pathways |
| WikiPathways | Pathways | |
| Reactome Pathways | Pathways | |
| Biocarta Pathways | Pathways | |
| PPI Hub Proteins | Hub proteins | |
| Kinase Enrichment Analysis (KEA) | Kinases | |
| Human Endogenous Complex | Protein complexes | |
| CORUM | Protein complexes | |
| Ontology | Gene Ontology Biological Processes | Biological processes |
| Gene Ontology Cellular Components | Cellular components | |
| Gene Ontology Molecular Function | Molecular functions | |
| MGI-Mammalian Phenotype-Top 4 | Phenotypes | |
| Disease/ drug | Up-Regulated CMAP Top 100 | Drugs |
| Down-Regulated CMAP Top 100 | Drugs | |
| GeneSigDB | Pubmed IDs | |
| OMIM Diseases | Diseases | |
| OMIM Expanded | Diseases | |
| VirusMINT—Virus–Host Interactings | Viral proteins | |
| Cell type | Human Gene Atlas | Human tissues |
| Mouse Gene Atlas | Mouse tissues | |
| Cancer Cell Line Encyclopedia | Cancer cell lines | |
| NCI-60 Cancer Cell Line | Cancer cell lines | |
| Miscellaneous | HMDB Metabolites | Chromosomal locations |
| PFAM Interpro—Protein Domains | Metabolites |
Searching for and visualizing specific perturbations
A specific perturbation could be searched for using the search bar above the canvas viewers within the browse interface. An experiment is described in the format of ‘perturbation, dose, time-point, and cell-line’. The search bar supports ‘*’ wildcards. For example, if we want to search for all experiments that use the MCF10A cell line, have a perturbation name that ends with ‘atinib’ and a time-point of 6 h we can use the search query ‘*atinib * 6 h MCF10A’. Selection of a matched experiment on the dropdown menu would visualize the experiment in the appropriate canvas and show its enrichment analysis results in a table (Figure 4).
Figure 4.

Example for a search query using LCB. The search for all experiments that use the MCF10A cell line, have a perturbation name that ends with ‘atinib’ and a time-point of 6 h is applied with the query ‘*atinib * 6 h MCF10A’. Users can then select one of the entries to see their position within their associated canvas.
Web communication protocols
LCB requests data for canvases on-the-fly using AJAX calls. LCB sends an AJAX request when a user selects a new batch. A server-side PHP script reads this request and sends back the requested JSON file that describes the canvas as plain text file. LCB interprets the file into JavaScript arrays using the eval function. Similarly, a second server-side PHP script handles the gene-set library requests and sends back the gene-set canvases data for visualization.
The search interface
LCB contains a search engine interface where users can enter their own input gene-lists to search against the differentially expressed gene lists from the L1000 dataset that was processed for LCB containing ∼150 000 experimental conditions. Three text files are created from the entire L1000 dataset for the search purpose: (i) up genes file, (ii) down genes file and (iii) up/down gene file. Each line in these files stores up or/and down genes for one experimental condition and all the experiments are included in each of these files. The organization within this file is maximized for query efficiency by preloading the file into the server side code at compile time. Once a user clicks the search button, LCB posts the user input list/s with the description tags to a server-side PHP script. The PHP script parses the gene lists and determines which text file to use based on the description tags. The parsed lists are passed to a Python script for the actual query process. The Python script compares the overlap between the input list/s and the gene lists of each experiment, and returns the top 50 matched experiments with the highest overlap. Since the up and down gene lists in the L1000 background signature dataset are equal in length, a simple overlap computation is fast and accurate. The overlap score is calculated as follows: |Dup ∩ Lup|/|Lup| for up gene set input query Dup; |Ddown ∩ Ldown|/|Ldown| for down gene set input query Ddown; and (|Dup ∩ Lup|+|Ddown ∩ Ldown|)/(|Lup|+|Ldown|) for up and down gene-set query where D is used to denote user input lists and L, L1000 lists.
The PHP script encodes the result into a JSON format and sends it back to LCB. An ‘Access-Control-Allow-Origin: *’ header was set in all PHP scripts to enable universal embedding of LCB. The search interface has two panels: an input panel on the left and the results panel on the right (Figure 1). In the input panel, there are two text boxes to fill, one for the up gene list and one for the down gene list. Clear buttons will clear all text in the input gene-list textboxes. ‘Up’ and ‘Down’ check boxes allow users to choose which L1000 gene-list files to search. The search interface also has an Enrichr button that passes the input gene lists to the Enrichr tool (43) for enrichment analysis in a new page. The ‘Example’ button fills the textboxes with sample gene lists for demonstration purpose. The ‘Aggravate/Reverse’ slider swaps the up list with the down list so that the search is done in reverse mode. Aggravate means that the matching perturbations, if applied in a similar experimental setting, would potentially push cells in the same direction of the gene expression changes that are observed by the user who submitted the query. Reverse means that the matching perturbations, if applied in the same settings, will potentially reverse the expression toward the control state. The result panel will display the top 50 matched experiments in a table. This table will display only 10 entries per page. Clicking on ‘Previous/Next’ allows navigating through these pages. Each entry is represented as a hyperlink and clicking on the link will visualize the experiment and its enrichment analysis results on the LCB browse interface (Figure 2).
Case Study 1: Searching for small molecules that could potentially be tested for inhibiting breast cancer progression
Lauss et al. (44) developed a set of 374 genes associated with breast cancer by compiling a consensus list from 44 published gene lists developed for breast cancer prognosis. This consensus list of 374 genes is also the first entry in GeneSigDB, a gene signature database created from supporting tables of research publications (45). This 374 gene list was shown to be predictive of recurrence when used as a biomarker-set to classify 1067 breast cancer patients. Since Lauss et al. (44) showed that probability of expression of these genes is associated with breast cancer recurrence, we pasted the list into the ‘Up List’ text box of the search interface of LCB, checked only the ‘Up’ checkbox, and switched the ‘Aggravate/Reverse’ slide-bar to ‘Reverse’ (Figure 1). After clicking the ‘Search’ button, the top returned experimental conditions are: Tyrphostin AG 1478 applied to A375, a skin cancer cell-line; PD0332991 applied to MDAMB231 and MCF10A breast cancer cell lines; Aminopurvalanol applied to PC3, a prostate cancer cell-line; and a benzenesulfonamide derivative also applied to PC3. Tyrphostin AG 1478 is an EGFR inhibitor, and was already reported to inhibit proliferation and progression of human breast cancer cell-lines (46). PD0332991 is a kinase inhibitor targeting CDK4/6 and was reported to suppress proliferation of ER+ human breast cancer lines (47). Aminopurvalanol is a CDK kinase inhibitor that exerts its effects on the canonical MAPK pathway by suppressing proliferation of several mammalian cell-lines including MCF7, a human breast cancer cell-line (48). The benezensulfonamide derivative is a bioactive small molecule of unknown targets and mechanisms. Among these top five matched perturbations, PD0332991 is interesting since the top matches were applied to breast cancer lines and there are three of them. Clicking on the first PD0332991 matched perturbation, the one that was applied to MDAMB231 cells at 2 µm and gene expression was measured at 24 h, we can see that the perturbation is highlighted on the experiment canvas within the average change view. The coloring of the perturbation indicates that it is not a strong perturbation relative to the other perturbations applied to the MDAMB231 cells within this same batch. The 10 µm PD0332991 perturbation, which is another top matched experiment for our query, is located left to the highlighted perturbation, suggesting that there is high similarity in gene expression changes induced signatures for these two perturbations (Figure 5A). WikiPathways (27) enrichment analysis of the down-regulated genes for this perturbation shows high enrichment for ‘DNA replication’, ‘G1 to S cell cycle control’ and ‘cell cycle’ (Figure 5B and C). This enrichment result is consistent with the knowledge that PD0332991 is a CDK inhibitor. Enrichment analysis using the MGI Mammalian Phenotype gene-set library suggests enrichment for genes that when individually knocked out in mice can cause ‘abnormal cell cycle’ and ‘abnormal cell proliferation’, confirming that PD03322991 is likely attenuating cell proliferation through inhibition of the cell cycle. For the top matched perturbation: Tyrophostin AG 1478 the perturbation appears relatively strong on the experimental canvas (Figure 5D). The WikiPathways enrichment analysis of the down genes shows enrichment for the same cell cycle related terms seen for PD0332991 as well as ‘MAPK pathway’ terms which are not present in the PD0332991 WikiPathways enrichment analysis. This observation is consistent with the notion that Tyrophostin AG 1478 inhibits EGFR. The MGI Mammalian Phenotype enrichment analysis results suggest ‘abnormal cell cycle’ and ‘abnormal tumor incidence’ as the two most highly enriched terms. This is consistent with the knowledge about the anti-tumor effects of Tyrophostin AG 1478 (Figure 5E and F).
Figure 5.
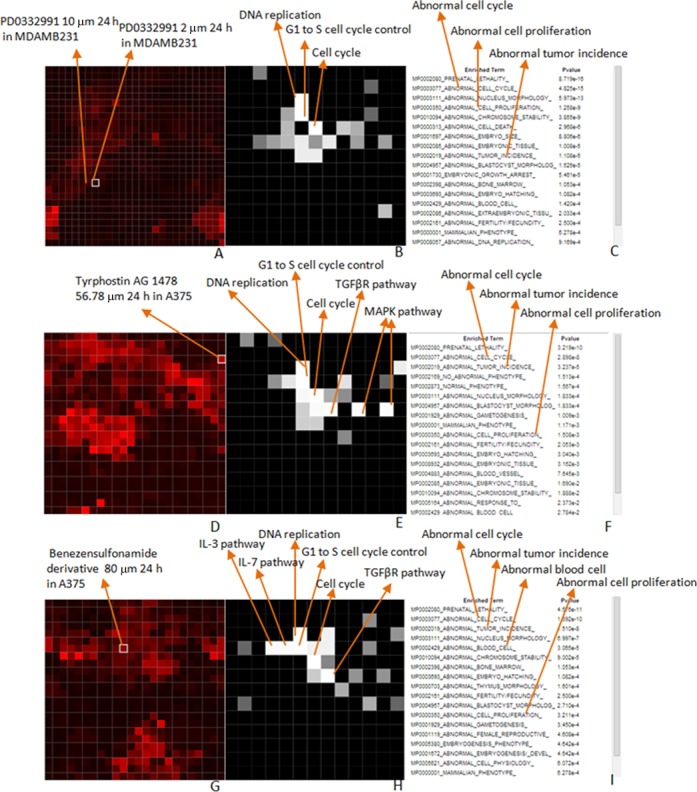
Visualization of enrichment analyses of selected perturbations from the results shown in Figure 1: (A–C) PD0332991; (D–F) Tyrophostin AG 1478 and (G–I) the Benezensulfonamide derivative.
While the analysis so far confirms known drugs and their mechanisms of action in cell-lines, LCB is useful for discovering potential mechanisms for new drugs. The benezensulfonamide derivative, the fifth drug on the list, has no known targets or mechanisms. The experimental canvas shows that this perturbation is relatively strong (Figure 5G). The WikiPathways enrichment analysis of the down genes suggest the same three cell cycle related terms shown for PD0332991 and Tyrophostin AG 1478, but also the ‘IL-3 and IL-7 pathways’. This suggests that this compound may be related to a process that inhibits the expression of genes that belong to Interleukin-related pathways. The MGI Mammalian Phenotype enrichment analysis points to tumor proliferation related terms but also contain ‘abnormal blood cell’, which adds support for a potential role for this benezensulfonamide derivative to engage with interleukin-related pathways, since interleukins are expressed in the hematopoietic system and disruption of these pathways can lead to blood cell abnormalities (Figure 5H and I).
Case Study 2: IL-1 and IL-6 Signaling in Macrophages
Jura et al. (49) profiled the transcriptional response of human monocyte-derived macrophages to IL-1 or IL-6. They concluded that IL-1 is a much stronger perturbagen of macrophages than IL-6. The genes significantly up-regulated by IL-1 were primarily cytokines, their receptors, intracellular signaling molecules, and NF-kB family transcription factors. We downloaded from the Gene Expression Omnibus the microarray data from this study (GEO Accession GDS3005), which contained five control samples, five IL-1 treatment samples and five IL-6 treatment samples. We averaged the expression values for probes that mapped to the same gene and log2-transformed the expression data. We then ranked the genes by significance of differential expression using the t-test by comparing the IL-1 and IL-6 to the control separately. Then we pasted the top 100 up-regulated genes into the ‘Up List’ textbox, clicked the ‘Up’ checkbox, set the slide-bar to ‘Aggravate’, and clicked ‘Search’. Nine of the 10 most similar perturbations were IL-1 treatments applied to various cell-lines at various concentrations and time points (Figure 6A). The other perturbation, which was ranked eighth, was a TNF-alpha treatment. The top 24 most similar perturbations were exclusively IL-1 or TNF-alpha treatments. This is consistent with the notion that IL-1 and TNF-alpha act cooperatively to mediate a similar inflammatory response and IL-1 is known to induce TNF-alpha expression (50). We performed the same search using the top 100 genes up-regulated by IL-6 and recovered only one IL-6 treatment in the list of top 10 most similar perturbations (Figure 6B). The weaker IL-6 signal from the search results is consistent with the finding of Jura et al. where they concluded that IL-1 induces a much strong transcriptional response compared with IL-6 (49). To further examine the molecular changes induces by the IL-1 treatment for the most similar perturbations we clicked on to top entry from the returned results: IL-1 applied to MCF7 cells at a concentration of 100 ng/μl for 3 h. The left canvas shows that the IL-1 perturbation clustered with similar perturbations applied in the same batch to MCF7 cells (Figure 7A). Neighboring perturbations on this canvas were other TNF-alpha and IL-1 treatments at different time points and concentrations. Color intensity indicated that the matched perturbation we selected was moderately strong relative to the other perturbations on this canvas. On the right-side enrichment canvas the results for MGI mammalian phenotype enrichment analysis show enrichment for immune related phenotypes for the up regulated genes (Figure 7B). These enriched terms are all consistent with the role of IL-1 in mediating immune system function and inflammatory responses (51,52). Enrichment analysis with ENCODE showed that the top five enriched ChIP-seq experiments were for NF-kB, which is consistent with the role of NF-kB in mediating IL-1 induced transcriptional responses (53). Enrichment analysis with the Cancer Cell Line Encyclopedia (54) gene-set library, found enrichment for cancer cell lines derived from haematopoietic and lymphoid tissue, which is expected given the role of IL-1 in the immune system. However, the most highly enriched cell line was PANC0213, a pancreatic cancer cell line. This finding supports a recent study suggesting that IL-1 plays a key role in maintaining an inflammatory microenvironment favorable for pancreatic tumor progression (55).
Figure 6.
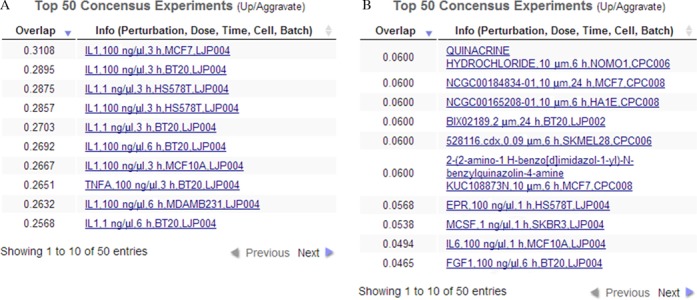
Top perturbations that match the top 100 genes significantly up-regulated by IL-1 (A) or IL-6 (B) treatment of monocyte derived macrophages.
Figure 7.
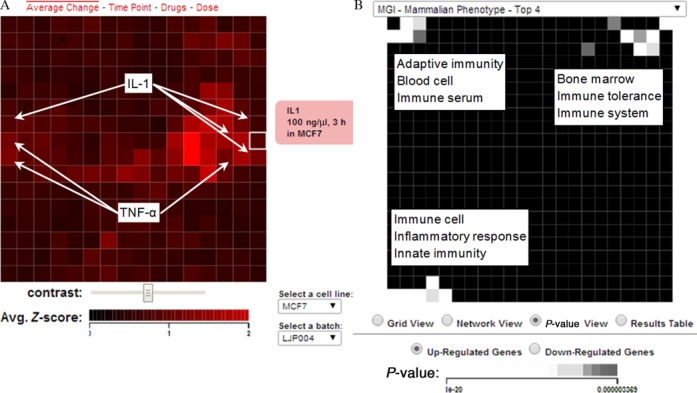
Canvases for the top ranked IL-1 perturbation: IL-1 applied to MCF7 cells at a concentration of 100 ng/μl for 3 h. (A) The selected perturbation is surrounded by similar perturbations which are either IL-1 or TNF-alpha treatments. (B) Visualization of the enriched terms using the MGI mammalian phenotypes gene set library.
DISCUSSION AND CONCLUSIONS
The LCB application is still at early stages of development. Customizable versions of the tool will be made available on the http://lincscloud.org and http://lincs.hms.harvard.edu websites. Besides adding the remaining available and newly developed L1000 experiments, more gene set libraries will be added to the enrichment analysis part. In addition, cellular phenotype data such as proliferation rate and cell viability results can be overlaid on the canvases as other layers to visualize expression changes with cellular phenotypes under various perturbations. Currently, LCB implements the Fisher exact test for enrichment but this can be improved with better and more accurate methods. With the L1000 data, enrichment analysis methods could be benchmarked by examining, for example, how knockdowns of transcription factors followed by expression can be matched with gene-set libraries of the same transcription factors created from ChIP-seq studies. Currently, LCB treats each experimental condition separately. However, it might be better for users to interact with consensus signatures that merge all experiments for a specific perturbation into one meta-signature. LCB represents an attempt to extract knowledge from the L1000 LINCS rich dataset. However, since the data and analysis methods within the LCB tool have not been extensively tested and verified, at this time the tool should be used with caution. User should use LCB to explore their data in the context of the L1000 data, without conclusive interpretation of the results.
SUPPLEMENTARY DATA
Supplementary Data are available at NAR Online.
FUNDING
NIH [U54HG006097-S1 to P.K.S. and A.M., U54HG006093 to T.R.G., U54HG006097 to P.K.S., R01GM098316-01A1, P50GM071558, R01DK088541-01A1 to A.M.] Funding for open access charge: U54HG006097-S1.
Conflict of interest statement. None declared.
REFERENCES
- 1.Jenkins S.L., Ma'ayan A. Systems pharmacology meets predictive, preventive, personalized and participatory medicine. Pharmacogenomics. 2013;14:119–122. doi: 10.2217/pgs.12.186. [DOI] [PMC free article] [PubMed] [Google Scholar]
- 2.Lamb J. The Connectivity Map: a new tool for biomedical research. Nat. Rev. Cancer. 2007;7:54–60. doi: 10.1038/nrc2044. [DOI] [PubMed] [Google Scholar]
- 3.Stegmaier K., Ross K.N., Colavito S.A., O'Malley S., Stockwell B.R., Golub T.R. Gene expression–based high-throughput screening (GE-HTS) and application to leukemia differentiation. Nat. Genet. 2004;36:257–263. doi: 10.1038/ng1305. [DOI] [PubMed] [Google Scholar]
- 4.Kunkel S.D., Elmore C.J., Bongers K.S., Ebert S.M., Fox D.K., Dyle M.C., Bullard S.A., Adams C.M. Ursolic acid increases skeletal muscle and brown fat and decreases diet-induced obesity, glucose intolerance and fatty liver disease. PLoS One. 2012;7:e39332. doi: 10.1371/journal.pone.0039332. [DOI] [PMC free article] [PubMed] [Google Scholar]
- 5.Hieronymus H., Lamb J., Ross K.N., Peng X.P., Clement C., Rodina A., Nieto M., Du J., Stegmaier K., Raj S.M. Gene expression signature-based chemical genomic prediction identifies a novel class of HSP90 pathway modulators. Cancer Cell. 2006;10:321–330. doi: 10.1016/j.ccr.2006.09.005. [DOI] [PubMed] [Google Scholar]
- 6.Antipova A.A., Stockwell B.R., Golub T.R. Gene expression-based screening for inhibitors of PDGFR signaling. Genome Biol. 2008;9:R47. doi: 10.1186/gb-2008-9-3-r47. [DOI] [PMC free article] [PubMed] [Google Scholar]
- 7.Sirota M., Dudley J.T., Kim J., Chiang A.P., Morgan A.A., Sweet-Cordero A., Sage J., Butte A.J. Discovery and preclinical validation of drug indications using compendia of public gene expression data. Sci. Transl. Med. 2011;3:96ra77. doi: 10.1126/scitranslmed.3001318. [DOI] [PMC free article] [PubMed] [Google Scholar]
- 8.Wei G., Twomey D., Lamb J., Schlis K., Agarwal J., Stam R.W., Opferman J.T., Sallan S.E., den Boer M.L., Pieters R. Gene expression-based chemical genomics identifies rapamycin as a modulator of MCL1 and glucocorticoid resistance. Cancer Cell. 2006;10:331–342. doi: 10.1016/j.ccr.2006.09.006. [DOI] [PubMed] [Google Scholar]
- 9.Lamb J., Crawford E.D., Peck D., Modell J.W., Blat I.C., Wrobel M.J., Lerner J., Brunet J.-P., Subramanian A., Ross K.N. The Connectivity Map: using gene-expression signatures to connect small molecules, genes, and disease. Science. 2006;313:1929–1935. doi: 10.1126/science.1132939. [DOI] [PubMed] [Google Scholar]
- 10.Barrett T., Troup D.B., Wilhite S.E., Ledoux P., Rudnev D., Evangelista C., Kim I.F., Soboleva A., Tomashevsky M., Edgar R. NCBI GEO: mining tens of millions of expression profiles—database and tools update. Nucleic Acids Res. 2007;35:D760–D765. doi: 10.1093/nar/gkl887. [DOI] [PMC free article] [PubMed] [Google Scholar]
- 11.Peck D., Crawford E.D., Ross K.N., Stegmaier K., Golub T.R., Lamb J. A method for high-throughput gene expression signature analysis. Genome Biol. 2006;7:R61. doi: 10.1186/gb-2006-7-7-r61. [DOI] [PMC free article] [PubMed] [Google Scholar]
- 12.Roth W.D., Wayne D. Personal flow cytometers—luminex. In: Ligler F. S., Kim J. S., editors. Singapore: Pan Stanford Publishing; 2010. pp. 37–50. [Google Scholar]
- 13.Clark N.R., Ma'ayan A. Introduction to statistical methods to analyze large data sets: principal components analysis. Sci. Signal. 2011;4:tr3. doi: 10.1126/scisignal.2001967. [DOI] [PMC free article] [PubMed] [Google Scholar]
- 14.Eisen M.B., Spellman P.T., Brown P.O., Botstein D. Cluster analysis and display of genome-wide expression patterns; 1998. pp. 14863–14868. [DOI] [PMC free article] [PubMed] [Google Scholar]
- 15.Kohonen T. Self-Organizing Maps. 3rd edn. Berlin, Heidelberg, New York: Springer; 2001. [Google Scholar]
- 16.MacArthur B.D., Lachmann A., Lemischka I.R., Ma'ayan A. GATE: software for the analysis and visualization of high-dimensional time series expression data. Bioinformatics. 2010;26:143–144. doi: 10.1093/bioinformatics/btp628. [DOI] [PMC free article] [PubMed] [Google Scholar]
- 17.Lu R., Markowetz F., Unwin R.D., Leek J.T., Airoldi E.M., MacArthur B.D., Lachmann A., Rozov R., Ma'ayan A., Boyer L.A. Systems-level dynamic analyses of fate change in murine embryonic stem cells. Nature. 2009;462:358–362. doi: 10.1038/nature08575. [DOI] [PMC free article] [PubMed] [Google Scholar]
- 18.Tan C.M., Chen E.Y., Dannenfelser R., Clark N.R., Ma'ayan A. Network2Canvas: network visualization on a canvas with enrichment analysis. 2013;29:1872–1878. doi: 10.1093/bioinformatics/btt319. [DOI] [PMC free article] [PubMed] [Google Scholar]
- 19.Xie D., Boyle Alan P., Wu L., Zhai J., Kawli T., Snyder M. Dynamic trans-acting factor colocalization in human cells. Cell. 2013;155:713–724. doi: 10.1016/j.cell.2013.09.043. [DOI] [PMC free article] [PubMed] [Google Scholar]
- 20.Subramanian A., Tamayo P., Mootha V.K., Mukherjee S., Ebert B.L., Gillette M.A., Paulovich A., Pomeroy S.L., Golub T.R., Lander E.S. Gene set enrichment analysis: a knowledge-based approach for interpreting genome-wide expression profiles; 2005. pp. 15545–15550. [DOI] [PMC free article] [PubMed] [Google Scholar]
- 21.Sherman B.T., Lempicki R.A. Bioinformatics enrichment tools: paths toward the comprehensive functional analysis of large gene lists. Nucleic Acids Res. 2009;37:1–13. doi: 10.1093/nar/gkn923. [DOI] [PMC free article] [PubMed] [Google Scholar]
- 22.Lachmann A., Xu H., Krishnan J., Berger S.I., Mazloom A.R., Ma'ayan A. ChEA: transcription factor regulation inferred from integrating genome-wide ChIP-X experiments. Bioinformatics. 2010;26:2438–2444. doi: 10.1093/bioinformatics/btq466. [DOI] [PMC free article] [PubMed] [Google Scholar]
- 23.Lachmann A., Ma'ayan A. KEA: kinase enrichment analysis. Bioinformatics. 2009;25:684–686. doi: 10.1093/bioinformatics/btp026. [DOI] [PMC free article] [PubMed] [Google Scholar]
- 24.Kanehisa M., Goto S. KEGG: kyoto encyclopedia of genes and genomes. Nucleic Acids Res. 2000;28:27–30. doi: 10.1093/nar/28.1.27. [DOI] [PMC free article] [PubMed] [Google Scholar]
- 25.Nishimura D. BioCarta. Biotech. Softw. Internet Rep.: Comput. Softw. J. Sci. 2001;2:117–120. [Google Scholar]
- 26.Joshi-Tope G., Gillespie M., Vastrik I., D'Eustachio P., Schmidt E., de Bono B., Jassal B., Gopinath G., Wu G., Matthews L. Reactome: a knowledgebase of biological pathways. Nucleic Acids Res. 2005;33:D428–D432. doi: 10.1093/nar/gki072. [DOI] [PMC free article] [PubMed] [Google Scholar]
- 27.Pico A.R., Kelder T., Van Iersel M.P., Hanspers K., Conklin B.R., Evelo C. WikiPathways: pathway editing for the people. PLoS Biol. 2008;6:e184. doi: 10.1371/journal.pbio.0060184. [DOI] [PMC free article] [PubMed] [Google Scholar]
- 28.Da Wei Huang B.T.S., Lempicki R.A. Systematic and integrative analysis of large gene lists using DAVID bioinformatics resources. Nat. Protoc. 2008;4:44–57. doi: 10.1038/nprot.2008.211. [DOI] [PubMed] [Google Scholar]
- 29.Al-Shahrour F., Díaz-Uriarte R., Dopazo J. FatiGO: a web tool for finding significant associations of Gene Ontology terms with groups of genes. Bioinformatics. 2004;20:578–580. doi: 10.1093/bioinformatics/btg455. [DOI] [PubMed] [Google Scholar]
- 30.Reimand J., Kull M., Peterson H., Hansen J., Vilo J. g: Profiler—a web-based toolset for functional profiling of gene lists from large-scale experiments. Nucleic Acids Res. 2007;35:W193–W200. doi: 10.1093/nar/gkm226. [DOI] [PMC free article] [PubMed] [Google Scholar]
- 31.Xia J., Fjell C.D., Mayer M.L., Pena O.M., Wishart D.S., Hancock R.E. INMEX—a web-based tool for integrative meta-analysis of expression data. 2013;41:W63–W70. doi: 10.1093/nar/gkt338. [DOI] [PMC free article] [PubMed] [Google Scholar]
- 32.Backes C., Keller A., Kuentzer J., Kneissl B., Comtesse N., Elnakady Y.A., Müller R., Meese E., Lenhof H.-P. GeneTrail—advanced gene set enrichment analysis. Nucleic Acids Res. 2007;35:W186–W192. doi: 10.1093/nar/gkm323. [DOI] [PMC free article] [PubMed] [Google Scholar]
- 33.Zhang B., Kirov S., Snoddy J. WebGestalt: an integrated system for exploring gene sets in various biological contexts. Nucleic Acids Res. 2005;33:W741–W748. doi: 10.1093/nar/gki475. [DOI] [PMC free article] [PubMed] [Google Scholar]
- 34.Lachmann A., Ma'ayan A. Lists2Networks: integrated analysis of gene/protein lists. BMC Bioinformatics. 2010;11:87. doi: 10.1186/1471-2105-11-87. [DOI] [PMC free article] [PubMed] [Google Scholar]
- 35.Chen E.Y., Tan C.M., Kou Y., Duan Q., Wang Z., Meirelles G.V., Clark N.R., Ma'ayan A. Enrichr: interactive and collaborative HTML5 gene list enrichment analysis tool. BMC Bioinformatics. 2013;14:128. doi: 10.1186/1471-2105-14-128. [DOI] [PMC free article] [PubMed] [Google Scholar]
- 36.Hung J.-H., Yang T.-H., Hu Z., Weng Z., DeLisi C. Gene set enrichment analysis: performance evaluation and usage guidelines. Brief. Bioinform. 2012;13:281–291. doi: 10.1093/bib/bbr049. [DOI] [PMC free article] [PubMed] [Google Scholar]
- 37.Fisher R.A. On the interpretation of χ 2 from contingency tables, and the calculation of P. J. R. Stat. Soc. 1922;85:87–94. [Google Scholar]
- 38.Newton M.A., Quintana F.A., Den Boon J.A., Sengupta S., Ahlquist P. Random-set methods identify distinct aspects of the enrichment signal in gene-set analysis. 2007;1:85–106. [Google Scholar]
- 39.Benjamini Y., Hochberg Y. Controlling the false discovery rate: a practical and powerful approach to multiple testing. 1995;57:289–300. [Google Scholar]
- 40.Bostock M., Ogievetsky V., Heer J. D3 data-driven documents.Visualization and Computer Graphics. 2011;17:2301–2309. doi: 10.1109/TVCG.2011.185. [DOI] [PubMed] [Google Scholar]
- 41.Clark N.R., Dannenfelser R., Tan C.M., Komosinski M.E., Ma'ayan A. Sets2Networks: network inference from repeated observations of sets. BMC Syst. Biol. 2012;6:89. doi: 10.1186/1752-0509-6-89. [DOI] [PMC free article] [PubMed] [Google Scholar]
- 42.Tan C.M., Chen E.Y., Dannenfelser R., Clark N.R., Ma'ayan A. Network2Canvas: network visualization on a canvas with enrichment analysis. Bioinformatics. 2013;29:1872–1878. doi: 10.1093/bioinformatics/btt319. [DOI] [PMC free article] [PubMed] [Google Scholar]
- 43.Chen E., Tan C., Kou Y., Duan Q., Wang Z., Meirelles G., Clark N., Ma'ayan A. Enrichr: interactive and collaborative HTML5 gene list enrichment analysis tool. BMC Bioinformatics. 2013;14:128. doi: 10.1186/1471-2105-14-128. [DOI] [PMC free article] [PubMed] [Google Scholar]
- 44.Lauss M., Kriegner A., Vierlinger K., Visne I., Yildiz A., Dilaveroglu E., Noehammer C. Consensus genes of the literature to predict breast cancer recurrence. Breast Cancer Res. Treat. 2008;110:235–244. doi: 10.1007/s10549-007-9716-3. [DOI] [PubMed] [Google Scholar]
- 45.Culhane A.C., Schröder M.S., Sultana R., Picard S.C., Martinelli E.N., Kelly C., Haibe-Kains B., Kapushesky M., St Pierre A.-A., Flahive W., et al. GeneSigDB: a manually curated database and resource for analysis of gene expression signatures. Nucleic Acids Res. 2012;40:D1060–D1066. doi: 10.1093/nar/gkr901. [DOI] [PMC free article] [PubMed] [Google Scholar]
- 46.Zhang Y., Du Q., Fang W., Jin M., Tian X. Tyrphostin AG1478 suppresses proliferation and invasion of human breast cancer cells. Int. J. Oncol. 2008;33:595–602. [PubMed] [Google Scholar]
- 47.Finn R., Dering J., Conklin D., Kalous O., Cohen D., Desai A., Ginther C., Atefi M., Chen I., Fowst C., et al. PD 0332991, a selective cyclin D kinase 4/6 inhibitor, preferentially inhibits proliferation of luminal estrogen receptor-positive human breast cancer cell lines in vitro. Breast Cancer Res. 2009;11:R77. doi: 10.1186/bcr2419. [DOI] [PMC free article] [PubMed] [Google Scholar]
- 48.Knockaert M., L. P., Gray N., Schultz P., Pouysségur J., Meijer L. p42/p44 MAPKs are intracellular targets of the CDK inhibitor purvalanol. Oncogene. 2002;21:6413–6424. doi: 10.1038/sj.onc.1205908. [DOI] [PubMed] [Google Scholar]
- 49.Jura J., Wegrzyn P., Korostynski M., Guzik K., Oczko-Wojciechowska M., Jarzab M., Kowalska M., Piechota M., Przewlocki R., Koj A. Identification of interleukin-1 and interleukin-6-responsive genes in human monocyte-derived macrophages using microarrays. Biochim. Biophys. Acta. 2008;1779:383–389. doi: 10.1016/j.bbagrm.2008.04.006. [DOI] [PubMed] [Google Scholar]
- 50.Ikejima T., Okusawa S., Ghezzi P., van der Meer J.W.M., Dinarello C.A. Interleukin-1 induces tumor necrosis factor in human peripheral blood mononuclear cells in vitro and a circulating tnf-like activity in rabbits. J. Infect. Dis. 1990;162:215–223. doi: 10.1093/infdis/162.1.215. [DOI] [PubMed] [Google Scholar]
- 51.Sims J.E., Smith D.E. The IL-1 family: regulators of immunity. Nat. Rev. Immunol. 2010;10:89–102. doi: 10.1038/nri2691. [DOI] [PubMed] [Google Scholar]
- 52.Dinarello C.A. Immunological and inflammatory functions of the interleukin-1 family. Annu. Rev. Immunol. 2009;27:519–550. doi: 10.1146/annurev.immunol.021908.132612. [DOI] [PubMed] [Google Scholar]
- 53.Tak P.A., Firestein G.S. NF-kB: a key role in inflammatory diseases. J. Clin. Invest. 2001;107:7–11. doi: 10.1172/JCI11830. [DOI] [PMC free article] [PubMed] [Google Scholar]
- 54.Barretina J., Caponigro G., Stransky N., Venkatesan K., Margolin A.A., Kim S., Wilson C.J., Lehár J., Kryukov G.V., Sonkin D. The cancer cell line encyclopedia enables predictive modelling of anticancer drug sensitivity. Nature. 2012;483:603–607. doi: 10.1038/nature11003. [DOI] [PMC free article] [PubMed] [Google Scholar]
- 55.Tjomsland V., Spangeus A., Valila J., Sandstrom P., Borch K., Druid J., Falkmer S., Falkmer U., Messmer D., Larsson M. Interleukin 1alpha sustains the expression of inflammatory factors in human pancreatic cancer microenvironment by targeting cancer-associated fibroblasts. Neoplasia. 2011;13:664–675. doi: 10.1593/neo.11332. [DOI] [PMC free article] [PubMed] [Google Scholar]
Associated Data
This section collects any data citations, data availability statements, or supplementary materials included in this article.