Abstract
Internal symmetry of a protein structure is the pseudo-symmetry that a single protein chain sometimes exhibits. This is in contrast to the symmetry with which monomers are arranged in many multimeric protein complexes. SymD is a program that detects proteins with internal symmetry. It proved to be useful for analyzing protein structure, function and modeling. This web-based interactive tool was developed by implementing the SymD algorithm. To the best of our knowledge, SymD webserver is the first tool of its kind with which users can easily study the symmetry of the protein they are interested in by uploading the structure or retrieving it from databases. It uses the Galaxy platform to take advantage of its extensibility and displays the symmetry properties, the symmetry axis and the sequence alignment of the structures before and after the symmetry transformation via an interactive graphical visualization environment in any modern web browser. An Example Run video displays the workflow to help users navigate. SymD webserver is publicly available at http://symd.nci.nih.gov.
INTRODUCTION
Aside from the symmetry of homomeric complexes, many protein domains are made of repeating units that are arranged in a symmetric manner. Proteins with such internal symmetry are interesting objects to study. Since gene duplication is a relatively frequent event, it is possible that proteins with repeating units were the first complex structures to arise in the evolution of protein structures. Internally symmetric proteins have a diverse array of function (1) and are probably good starting structures for a de novo design of protein structures with a desired function. The interface between the repeating units serves as a prototype of general protein–protein interaction interface. Generally, detecting internal symmetry enhances our understanding of the protein structure, folding and function. The recent study on the proton-gated urea channel from Helicobater pylori (2) is an example in which SymD was used to detect and characterize the internal symmetry of the molecule.
Many algorithms have been described for detecting the internal symmetry of a protein structure (3–7). Most of these are not, however, available through a web interface. RCSB PDB server (http://source.rcsb.org/jfatcatserver/symmetry.jsp) allows users to examine internal pseudo-symmetry from structures in PDB (8) or SCOP (9,10), but not the users’ own structural files. The GANGSTA+ server (http://agknapp.chemie.fu-berlin.de/gplus/index.php?page=symmetry) takes structures from PDB, SCOP or the local drive, but does not output the symmetry axis nor does it give the order (fold) of the symmetry. The SymD webserver is a web application we built on the Galaxy platform, which runs the SymD algorithm. A brief description of the SymD algorithm is given below and a full description can be found in our previous publication (1).
SymD algorithm works by trying many different transformations (rotation and translation) that will result in a large number of residues structurally aligned between the original and the transformed structures. The structure is judged to be symmetric if one or more of these trial transformations result in a large number of residues superimposed. More specifically, the algorithm first duplicates the structure of interest, circularly permutes the sequence numbering by k residues and generates the k-th initial sequence alignment by aligning residue i of the original structure with residue i of the permuted structure for all i or all i greater than k. This initial alignment is then fed into the RSE program (11) to obtain the optimal structure-based sequence alignment. SymD repeats this procedure for each initial shift k, from 1 to N-3, (alignment scan) where N is the number of residues of the structure. The goodness of the alignment is measured by T-score, which is a weighted number of aligned residue pairs (12):
 |
where dij is the Cα distance between the aligned residue pair i and j, which are more than s residues apart where s = 3 to avoid self-alignments. The distance cut-off d0 can be varied by the user (the default value is 2 Å) and the summation is over all aligned residue pairs. SymD reports the transformation matrix and the sequence alignment that produced the best T-score for each initial shift k. It also calculates the position and orientation of the (potential) symmetry axis, as well as the rotation angle and the translation along the symmetry axis from the calculated transformation matrix.
SymD webserver is accessed in a standard web browser and is therefore independent of any operating system and requires no installation. It allows users to upload their own structure files in PDB format as well as to retrieve structures from PDB (http://www.rcsb.org/pdb/) or domain databases such as CATH (13) or SCOP as inputs. SymD webserver uses the Galaxy (14) platform, which has been used extensively in genomics research. Here we take advantage of the tool for running a workflow and of the extensibility the Galaxy platform provides and apply it on protein symmetry studies.
SYSTEM DESCRIPTION
Hardware and software
The SymD webserver is hosted in a VMware vSphere virtualized Ubuntu 12 server with an apache webserver front-end proxy. The web application is programmed in Python 2.6. Jmol (http://www.jmol.org) is used for structure visualization and JalView (15) for sequence alignment visualization and analysis.
User interface
Similar to other Galaxy systems, the SymD webserver always has three panels: Tools on the left for selecting input, initiating a computation, and viewing instructions; Details in the middle for managing tool settings and displaying data and History on the right for a list of input and output files as well as visualization tools.
Input
Users can upload their own structures of interest in PDB format or retrieve a chain or a domain from the SCOP, CATH or PDB database, by selecting one of the options under ‘Provide Data for Computation’ in the left Tools panel. Structures that are successfully fetched will be listed in the History panel on the right. The content of the file can be displayed in the middle Detail panel by clicking on the Eye icon in the History panel. The structure can be viewed in Jmol by clicking the Jmol link in the History panel. SymD webserver can store multiple structures.
To launch SymD calculation after structures are loaded, the user can choose the option ‘Perform SymD calculation’ in the left Tools panel. The names of the stored structures are then shown in the drop-down list in the middle, Detail, panel, from which the user can choose one structure for SymD computation. Default parameters will be used unless ‘Advanced’ options are selected. Users may input different d0 cut-off (range from 0.0 to 6.0) for T-score calculation. When the Initial Shift value, which is the number of residues initially shifted for circular permutation and initial alignment, is explicitly specified, optimal alignment using only the specified initial shift will be calculated. Otherwise, SymD will perform the alignment scan and report the best shift alignment which has the highest Z-score.
The status of the calculation shows in the Detail panel. The color changes from grey to green if computation is done successfully, or red if a problem is encountered.
Output
SymD program generates three output files, which are listed in the History panel on the right when the calculation is finished. They are the alignment scan information file (X-info.txt), two superposed structures, one original and the other best (highest scoring) transformed structure, with the corresponding symmetry axis (X-trfm.pdb), and the sequence alignment file for the best transformation (X-best.fasta), where X is the name of the structure. Each of these files can be viewed directly (by clicking the Eye icon) or downloaded (by clicking the Disc icon). The output files are saved even after the user closes the browser. Users can always retrieve the data later by opening the SymD webpage and clicking the file name in the History panel.
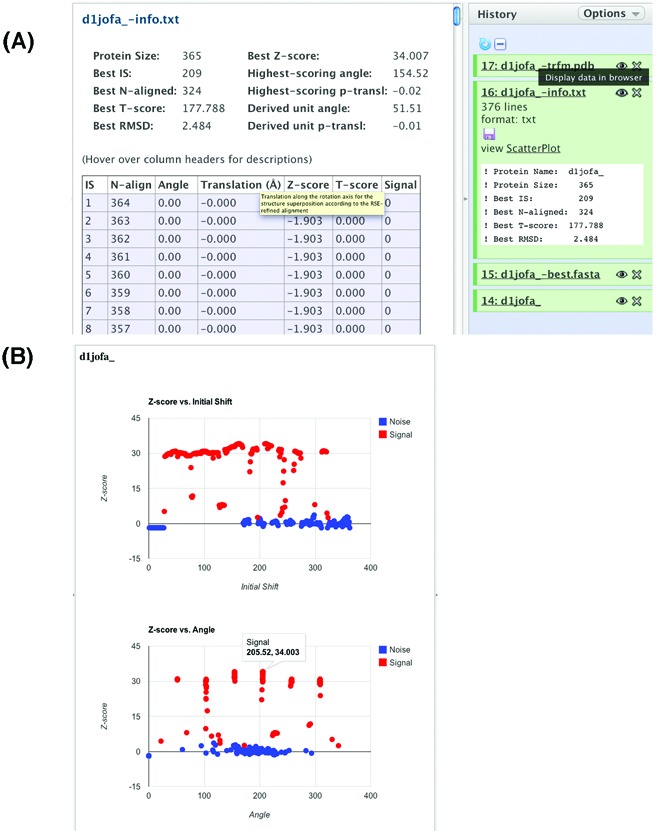
The alignment scan information file (Figure 1A) gives information on the optimal alignment obtained from each initial shift. The items included in the default output are the T-score, Z-score, the number of residues aligned, and the rotation angle and the translation along the rotation axis obtained from the optimal transformation matrix. The rotation axis of the transformation that produced the best T-score overall is considered the symmetry axis of the molecule. Transformations from all other initial shifts in the alignment scan are considered as signal or noise depending on whether the rotation axis of the transformation aligns with that of the symmetry axis within a certain tolerance (angle between the rotation axes is less than 18° = arcos(0.95)).
Figure 1.

The SymD webserver alignment scan output. (A) Clicking the Eye icon displays the file in the Detail panel. (B) Clicking the ScatterPlot hyperlink displays the Z-score versus Initial Shift and the Z-score versus Angle interactive scatter plots. The six signal peaks in the example plot indicate that the domain has a 7-fold symmetry. Hovering the cursor over a point in the scatter plot displays the x- and y-coordinates of the point.
In addition to the information in the table format, SymD webserver also displays two interactive scatter plots: Z-score versus initial shift and Z-score versus rotation angle (Figure 1B). The number of signal peaks shown in the Z-score versus rotation angle plot is equal to the number of repeating units of the symmetric protein minus one. For example, 1genA is a 4-bladed β-propeller with a 4-fold internal symmetry. Upon rotating every 90 degrees, the structure superposes to the original structure and produces a high Z-score. Therefore, the Z-score versus angle plot shows three peaks. The X and Y values of each point in the scatter plot can be displayed by hovering the cursor over the point. For proteins with open, helical symmetry, such as α−α superhelices, e.g. 1bk5A, the signal peaks show more distinctly in the Z-score versus initial shift plot.
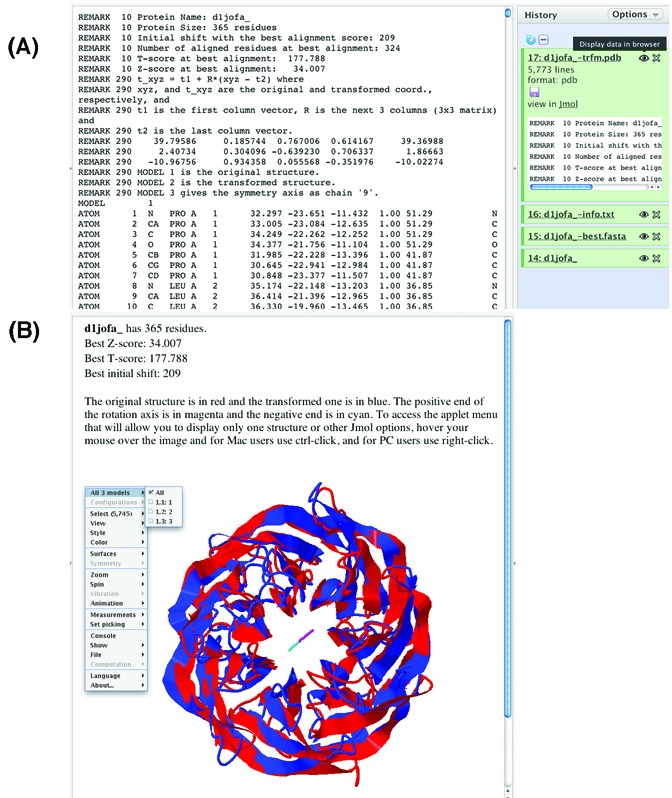
The transformed structure and the symmetry axis (Figure 2A) can be downloaded in PDB format by clicking the Disc icon in the X-trfm.pdb section in the History panel. To visualize the symmetry of the structure directly, the symmetry axis along with the original and the superposed transformed structures can be displayed in Jmol (Figure 2B).
Figure 2.

The SymD webserver transformed structure output. (A) Clicking the Eye icon displays the PDB-format file in the Detail panel. (B) Clicking the Jmol hyperlink displays the original and transformed structures and the symmetry axis in Jmol. The coordinates of the structures and the axis can also be downloaded by clicking the Disc icon.
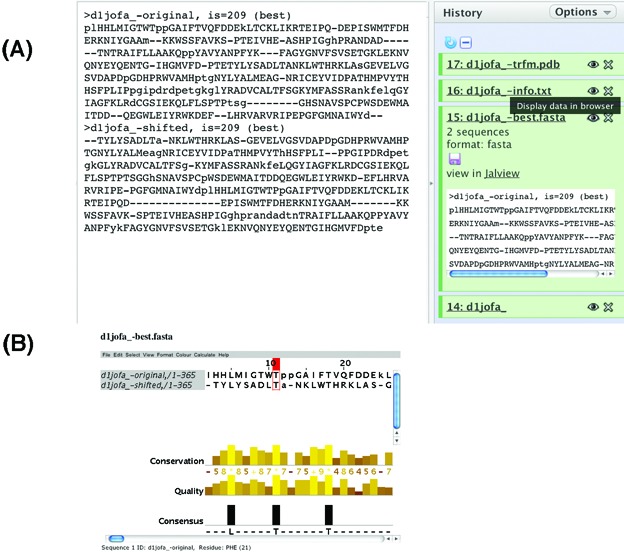
The sequence alignment generated by RSE between the original and transformed structures is displayed in JalView for examination (Figure 3B). The FASTA format alignment file can also be viewed by clicking the Eye icon under X-best.fasta section and downloaded by clicking the Disc icon (Figure 3A).
Figure 3.

The SymD webserver output of the sequence alignment. (A) Clicking the Eye icon displays the FASTA format file in the Detail panel. (B) Clicking the Jalview hyperlink displays the sequence alignment in Jalview. The FASTA format file can also be downloaded by clicking the Disc icon.
In addition to the text explanation of different parameters and different results, the Example Run video in Help section also provides interactive instruction for SymD users. The webserver also has a link where users can download the SymD executable to run off-line.
CONCLUSIONS
SymD webserver is the first web-based application allowing users to upload proteins of interest or retrieve them from various databases, and analyze the symmetry property of the protein. The calculation is fast and results are displayed immediately. The output is dynamic and rich in detail. It provides not only the numerical data in different formats but also a visual analysis of the symmetry axis in Jmol, and interactive text and video tutorials. The webserver is useful for synthetic biological design and for studying protein structure, function and evolution.
Footnotes
Present address: Dukka KC, Computational Science & Engineering, North Carolina A&T State University, Greensboro, NC, USA
FUNDING
Intramural Research Program of the NIH, National Cancer Institute, Center for Cancer Research. Funding for open access charge: U.S. National Cancer Institute.
Conflict of interest statement. None declared.
REFERENCES
- 1.Kim C., Basner J., Lee B. Detecting internally symmetric protein structures. BMC Bioinformatics. 2010;11:303. doi: 10.1186/1471-2105-11-303. [DOI] [PMC free article] [PubMed] [Google Scholar]
- 2.Strugatsky D., McNulty R., Munson K., Chen C.K., Soltis S.M., Sachs G., Luecke H. Structure of the proton-gated urea channel from the gastric pathogen Helicobacter pylori. Nature. 2013;493:255–258. doi: 10.1038/nature11684. [DOI] [PMC free article] [PubMed] [Google Scholar]
- 3.Kinoshita K., Kidera A., Go N. Diversity of functions of proteins with internal symmetry in spatial arrangement of secondary structural elements. Protein Sci. 1999;8:1210–1217. doi: 10.1110/ps.8.6.1210. [DOI] [PMC free article] [PubMed] [Google Scholar]
- 4.Abraham A.L., Pothier J., Rocha E.P. Alternative to homo-oligomerisation: the creation of local symmetry in proteins by internal amplification. J. Mol. Biol. 2009;394:522–534. doi: 10.1016/j.jmb.2009.09.031. [DOI] [PubMed] [Google Scholar]
- 5.Abraham A.L., Rocha E.P., Pothier J. Swelfe: a detector of internal repeats in sequences and structures. Bioinformatics. 2008;24:1536–1537. doi: 10.1093/bioinformatics/btn234. [DOI] [PMC free article] [PubMed] [Google Scholar]
- 6.Guerler A., Wang C., Knapp E.W. Symmetric structures in the universe of protein folds. J. Chem. Inf. Model. 2009;49:2147–2151. doi: 10.1021/ci900185z. [DOI] [PubMed] [Google Scholar]
- 7.Shih E.S., Hwang M.J. Alternative alignments from comparison of protein structures. Proteins. 2004;56:519–527. doi: 10.1002/prot.20124. [DOI] [PubMed] [Google Scholar]
- 8.Berman H.M., Westbrook J., Feng Z., Gilliland G., Bhat T.N., Weissig H., Shindyalov I.N., Bourne P.E. The Protein Data Bank. Nucleic acids research. 2000;28:235–42. doi: 10.1093/nar/28.1.235. [DOI] [PMC free article] [PubMed] [Google Scholar]
- 9.Murzin A.G., Brenner S.E., Hubbard T., Chothia C. SCOP: a structural classification of proteins database for the investigation of sequences and structures. J. Mol. Biol. 1995;247:536–540. doi: 10.1006/jmbi.1995.0159. [DOI] [PubMed] [Google Scholar]
- 10.Andreeva A., Howorth D., Chandonia J.-M., Brenner S.E., Hubbard T.J.P., Chothia C., Murzin A.G. Data growth and its impact on the SCOP database: new developments. Nucleic Acids Res. 2008;36:D419–D425. doi: 10.1093/nar/gkm993. [DOI] [PMC free article] [PubMed] [Google Scholar]
- 11.Kim C., Tai C.H., Lee B. Iterative refinement of structure-based sequence alignments by Seed Extension. BMC Bioinformatics. 2009;10:210. doi: 10.1186/1471-2105-10-210. [DOI] [PMC free article] [PubMed] [Google Scholar]
- 12.Gerstein M., Levitt M. Comprehensive assessment of automatic structural alignment against a manual standard, the scop classification of proteins. Protein Sci. 1998;7:445–456. doi: 10.1002/pro.5560070226. [DOI] [PMC free article] [PubMed] [Google Scholar]
- 13.Orengo C.A., Michie A.D., Jones S., Jones D.T., Swindells M.B., Thornton J.M. CATH–a hierarchic classification of protein domain structures. Structure. 1997;5:1093–1108. doi: 10.1016/s0969-2126(97)00260-8. [DOI] [PubMed] [Google Scholar]
- 14.Goecks J., Nekrutenko A., Taylor J. Galaxy: a comprehensive approach for supporting accessible, reproducible, and transparent computational research in the life sciences. Genome Biol. 2010;11:R86. doi: 10.1186/gb-2010-11-8-r86. [DOI] [PMC free article] [PubMed] [Google Scholar]
- 15.Waterhouse A.M., Procter J.B., Martin D.M., Clamp M., Barton G.J. Jalview Version 2–a multiple sequence alignment editor and analysis workbench. Bioinformatics. 2009;25:1189–1191. doi: 10.1093/bioinformatics/btp033. [DOI] [PMC free article] [PubMed] [Google Scholar]


