Abstract
Associations between air pollution and cardiorespiratory mortality and morbidity have been well established, but data to support biologic mechanisms underlying these associations are limited. We designed this study to examine several prominently hypothesized mechanisms by assessing Beijing residents’ biologic responses, at the biomarker level, to drastic changes in air quality brought about by unprecedented air pollution control measures implemented during the 2008 Beijing Olympics.
To test the hypothesis that changes in air pollution levels are associated with changes in biomarker levels reflecting inflammation, hemostasis, oxidative stress, and autonomic tone, we recruited and retained 125 nonsmoking adults (19 to 33 years old) free of cardiorespiratory and other chronic diseases. Using the combination of a quasi-experimental design and a panel-study approach, we measured biomarkers of autonomic dysfunction (heart rate [HR*] and heart rate variability [HRV]), of systemic inflammation and oxidative stress (plasma C-reactive protein [CRP], fibrinogen, blood cell counts and differentials, and urinary 8-hydroxy-2′-deoxyguanosine [8-OHdG]), of pulmonary inflammation and oxidative stress (fractional exhaled nitric oxide [FeNO], exhaled breath condensate [EBC] pH, EBC nitrate, EBC nitrite, EBC nitrite+nitrate [sum of the concentrations of nitrite and nitrate], and EBC 8-isoprostane), of hemostasis (platelet activation [plasma sCD62P and sCD40L], platelet aggregation, and von Willebrand factor [vWF]), and of blood pressure (systolic blood pressure [SBP] and diastolic blood pressure [DBP]). These biomarkers were measured on each subject twice before, twice during, and twice after the Beijing Olympics. For each subject, repeated measurements were separated by at least one week to avoid potential residual effects from a prior measurement. We measured a large suite of air pollutants (PM2.5 [particulate matter ≤ 2.5 μm in aerodynamic diameter] and constituents, sulfur dioxide [SO2], carbon monoxide [CO], nitrogen dioxide [NO2], and ozone [O3]) throughout the study at a central Beijing site near the residences and workplaces of the subjects on a daily basis. Total particle number (TPN) was also measured at a separate site. We used a time-series analysis to assess changes in pollutant concentration by period (pre-, during-, and post-Olympics periods). We used mixed-effects models to assess changes in biomarker levels by period and to estimate changes associated with increases in pollutant concentrations, controlling for ambient temperature, relative humidity (RH), sex, and the day of the week of the biomarker measurements. We conducted sensitivity analyses to assess the impact of potential temporal confounding and exposure misclassification.
We observed reductions in mean concentrations for all measured pollutants except O3 from the pre-Olympics period to the during-Olympics period. On average, elemental carbon (EC) changed by −36%, TPN by −22%, SO2 by −60%, CO by −48%, and NO2 by −43% (P < 0.05 for all these pollutants). Reductions were observed in mean concentrations of PM2.5 (by −27%), sulfate (SO42−) (by −13%), and organic carbon (OC) (by −23%); however, these values were not statistically significant. Both 24-hour averages and 1-hour maximums of O3 increased (by 20% and 17%, respectively) from the pre-Olympics to the during-Olympics period. In the post-Olympics period after the pollution control measures were relaxed, mean concentrations of most pollutants (with the exception of SO42− and O3) increased to levels similar to or higher than pre-Olympics levels.
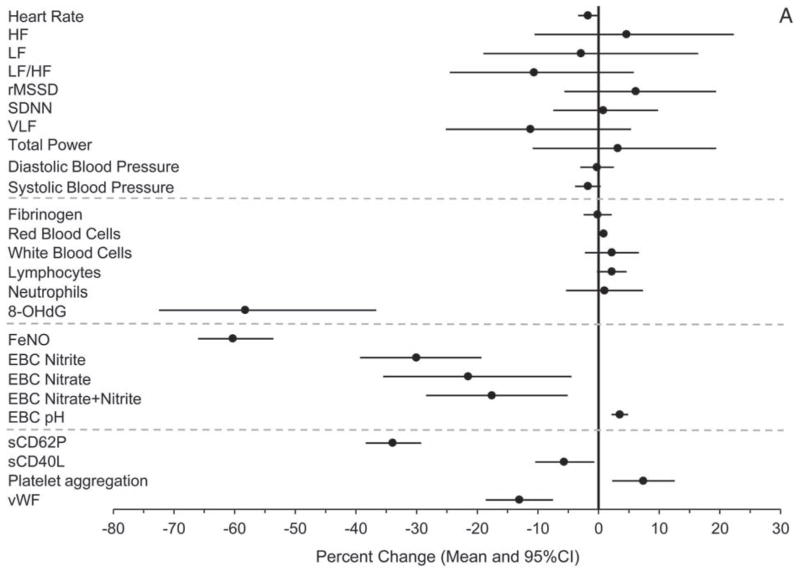
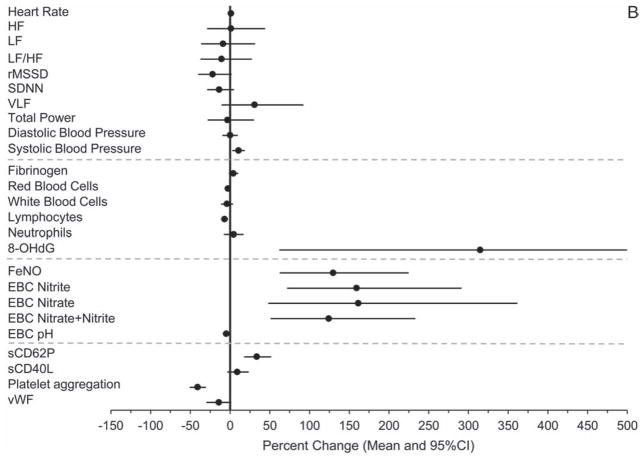
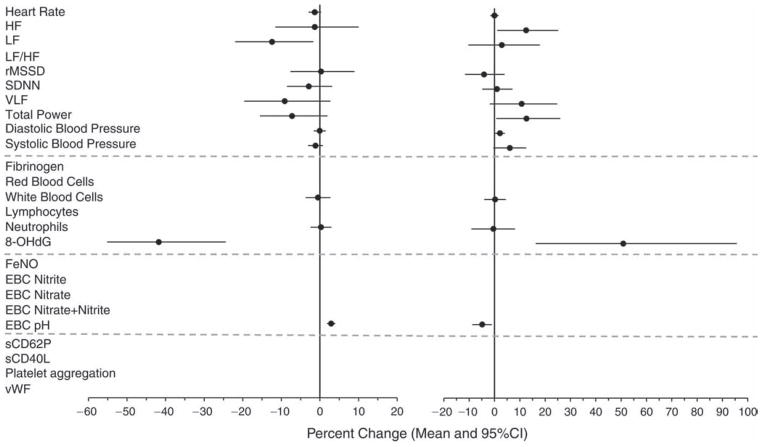
Concomitantly and consistent with the hypothesis, we observed, from the pre-Olympics to the during-Olympics period, statistically significant (P ≤ 0.05) or marginally significant (0.05 < P < 0.1) decreases in HR (−1 bpm or −1.7% [95% CI, −3.4 to −0.1]), SBP (−1.6 mmHg or − 1.8% [95% CI, −3.9 to 0.4]), 8-OHdG (−58.3% [95% CI, −72.5 to −36.7]), FeNO (−60.3% [95% CI, −66.0 to −53.6]), EBC nitrite (−30.0% [95% CI, −39.3 to −19.3]), EBC nitrate (−21.5% [95% CI, −35.5 to −4.5]), EBC nitrite+nitrate (−17.6% [95% CI, −28.4 to −5.1]), EBC hydrogen ions (−46% [calculated from EBC pH], or +3.5% in EBC pH [95% CI, 2.2 to 4.9]), sCD62P (−34% [95% CI, −38.4 to −29.2]), sCD40L (−5.7% [95% CI, −10.5 to −0.7]), and vWF (−13.1% [95% CI, −18.6 to −7.5]). Moreover, the percentages of above-detection values out of all observations were significantly lower for plasma CRP and EBC 8-isoprostane in the during-Olympics period compared with the pre-Olympics period. In the post-Olympics period, the levels of the following biomarkers reversed (increased, either with or without statistical significance) from those in the during-Olympics period: SBP (10.7% [95% CI, 2.8 to 18.6]), fibrinogen (4.3% [95% CI, −1.7 to 10.2), neutrophil count (4.7% [95% CI, −7.7 to 17.0]), 8-OHdG (315% [95% CI, 62.0 to 962]), FeNO (130% [95% CI, 62.5 to 225]), EBC nitrite (159% [95% CI, 71.8 to 292]), EBC nitrate (161% [95% CI, 48.0 to 362]), EBC nitrite+nitrate (124% [95% CI, 50.9 to 233]), EBC hydrogen ions (146% [calculated from EBC pH] or −4.8% in EBC pH [95% CI, −9.4 to −0.2]), sCD62P (33.7% [95% CI, 17.7 to 51.8]), and sCD40L (9.1% [95% CI, −3.7 to 23.5]).
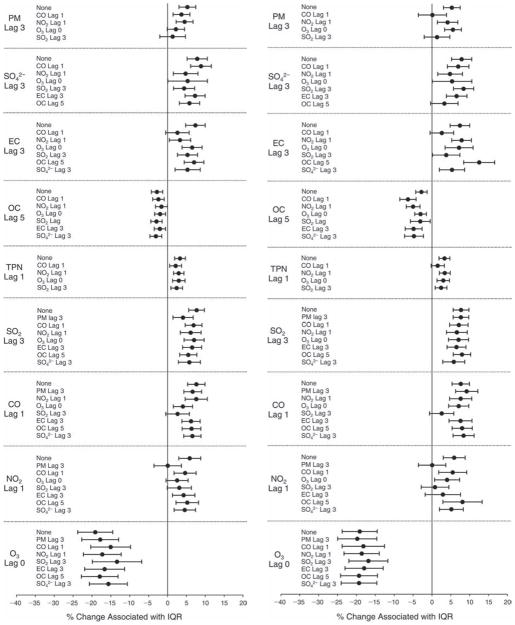
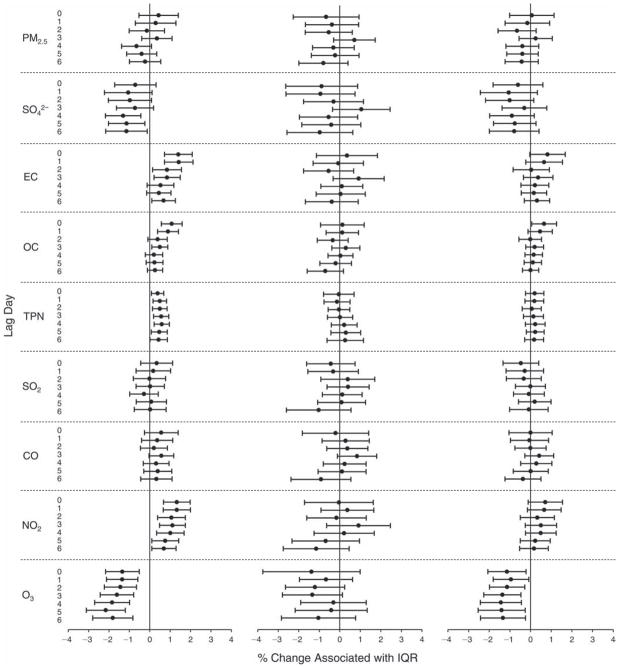
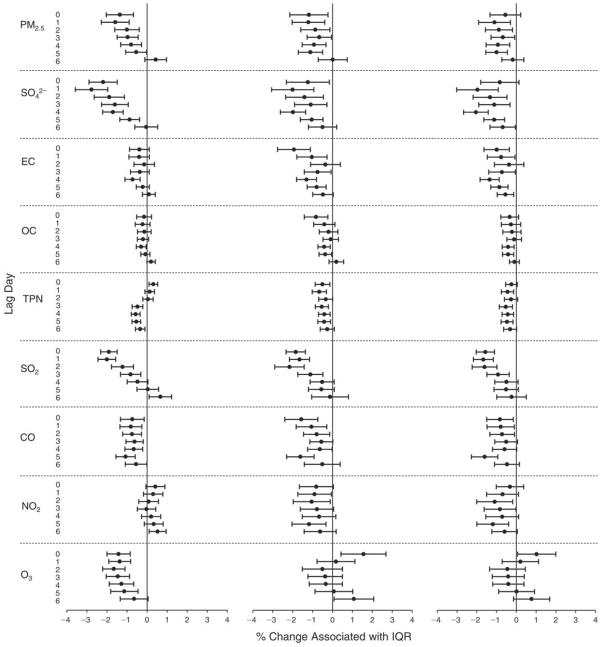
Furthermore, these biomarkers also showed statistically significant associations with multiple pollutants across different lags after adjusting for meteorologic parameters. The associations were in the directions hypothesized and were consistent with the findings from the comparisons between periods, providing further evidence that the period effects were due to changes in air quality, independent of season and meteorologic conditions or other potential confounders. Contrary to our hypothesis, however, we observed increases in platelet aggregation, red blood cells (RBCs) and white blood cells (WBCs) associated with the during-Olympics period, as well as significant negative associations of these biomarkers with pollutant concentrations. We did not observe significant changes in any of the HRV indices and DBP by period. However, we observed associations between a few HRV indices and pollutant concentrations.
Changes in air pollution levels during the Beijing Olympics were associated with acute changes in biomarkers of pulmonary and systemic inflammation, oxidative stress, and hemostasis and in measures of cardiovascular physiology (HR and SBP) in healthy, young adults. These changes support the prominently hypothesized mechanistic pathways underlying the cardiorespiratory effects of air pollution.
INTRODUCTION
Epidemiologic evidence documents that daily changes in ambient concentrations of air pollutants, particularly but not exclusively PM, are associated with variations of one to a few percent in both mortality and morbidity from cardiovascular and respiratory causes (Brook et al. 2004; Brook 2008). However, specific biologic mechanisms for these outcomes remain poorly understood. Although differences in mortality and morbidity outcomes are also observed when making spatial comparisons (i.e., comparing outcomes associated with chronic exposures between geographic regions or cities) (Chen et al. 2008; Puett et al. 2009), they are especially prominent when making temporal comparisons (changes over time within the same population or the same city). Many studies demonstrate statistically significant variation in short-term (daily) rates of cardiopulmonary outcomes such as myocardial infarction and heart failure exacerbations (Peters et al. 2004; Wellenius et al. 2006; Brook 2008). Thus, exploration of the mechanisms underlying cardiorespiratory responses that occur within an acute to subchronic time frame of air pollution exposure is clearly warranted. The present study focuses on short-term variations in air pollution concentrations in order to elucidate biologic mechanisms by which air pollution acutely triggers biochemical and physiologic events underlying clinically observed outcomes. The study was designed to examine several prominent hypotheses regarding biologic pathways linking air pollution exposure and adverse cardiorespiratory outcomes within a time window of 1 to 7 days.
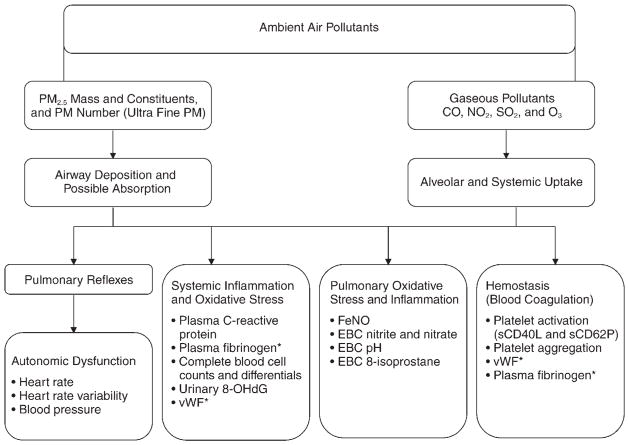
These interrelated pathways have been proposed to explain the epidemiologic phenomena of air-pollution-induced acute mortality and morbidity; for most of these hypothetical pathways, there is some corroborating, but inconclusive, evidence. A diagram that summarizes the hypothesized effects of air pollution on various pathways is shown in Figure 1, along with relevant biomarkers for each endpoint chosen for the present study. Inhalation of air pollutants, especially fine particles (PM2.5 and its constituents), is now widely considered to induce inflammation in the respiratory tract and probably systemically, as demonstrated in previous studies linking air pollution exposure with one or more of the inflammatory biomarkers used in the present study (Salvi et al. 1999; Churg and Brauer 2000; Liao et al. 2004; Chuang et al. 2007; Eilstein 2009; O’Neill et al. 2009). The biomarkers selected for the present study are either clinically validated or established within the research field. For example, FeNO, produced primarily in the lung by inducible nitric oxide synthase, is an established clinical marker of pulmonary inflammation prevalent in asthmatic patients (Artlich et al. 1996; van Amsterdam et al. 2000). EBC nitrite and nitrate result from metabolic oxidation of nitric oxide in the lung (Hunt et al. 2000). A decrease in EBC pH has been associated with asthma exacerbation (McCreanor et al. 2007) and broncho-constriction (Ricciardolo et al. 1999). In the liver, inflammatory mediators can lead to increased production of acute phase proteins in plasma such as CRP and fibrinogen (Slaughter et al. 2003). Plasma vWF, an adhesive glycoprotein produced by endothelial cells that allows platelets to attach to the sub-endothelial vessel wall, is an endothelial-derived coagulation marker and is also linked to systemic inflammation (Zezos et al. 2005). In addition, blood cell counts and differentials (e.g., WBCs, RBCs, and neutrophils) may serve as markers of cardiovascular disease risk (Seaton et al. 1995) and are often linked to inflammatory processes (Liao et al. 2005).
Figure 1. Diagram showing hypothesized pathways of the effects of air pollution on cardiorespiratory endpoints and biomarkers measured in the study.
The asterisk (*) indicates biomarkers reflecting a secondary (overlapping) pathway.
Air pollution exposure is also thought to affect autonomic tone — altering sympathetic and parasympathetic output, possibly affecting the stability of atherosclerotic plaques, and possibly decreasing HRV (Creason et al. 2001; Magari et al. 2002; Schwartz et al. 2005; Chuang et al. 2007). Decreased HRV is a suggested risk factor for arrhythmia and other causes of cardiovascular mortality (Liao et al. 1997). BP and HR are well-established risk factors for cardiovascular health (Reil and Böhm 2007). Other potential mechanisms include acute changes in vascular or endothelial function (Peretz et al. 2008) and the tendency for arterial thrombosis to develop, either due to platelet alterations (e.g., platelet aggregation) or changes in the soluble clotting system (Lucking et al. 2008). Two specific soluble markers (soluble CD40 ligand [sCD40L] and soluble P-selectin [sCD62P]) measured in the present study are released by platelets and are considered indicators of platelet activation, a precursor of blood coagulation, or hemostasis. Fibrinogen is an acute phase reactant synthesized by the liver and is vital to platelet aggregation. Like vWF, plasma fibrinogen is also related to systemic inflammation (see Figure 1).
Air pollution is likely to induce oxidative stress, which may also lead to health effects (Xia et al. 2006). Oxidative stress is hypothesized to be a primary mechanistic link between environmental or pathologic stimuli and inflammation, although the inflammatory response itself can produce oxidative stress through the release of cellular mediators. These oxidative-stress-related responses may occur in those tissues directly exposed to air pollutants (the respiratory tract) as well as systemically, presumably through inflammatory mechanisms or transport of metals and other toxicants from the alveoli (Sørensen et al. 2003; Delfino et al. 2008). In the present study, we used EBC 8-isoprostane as a primary biomarker of pulmonary oxidative stress, because it is a stable product of lipid peroxidation induced by reactive oxygen species (ROS) (Liu et al. 2009). We also considered EBC nitrite and nitrate to be pulmonary oxidative stress markers (as well as inflammatory markers) because ROS presumably affect the oxidation of nitric oxide (NO) in the lung (Kostikas et al. 2002). Finally, we selected 8-OHdG excreted in the urine as a systemic oxidative stress marker, because it is a stable compound produced by ROS oxidative reactions with DNA molecules (Kadiiska et al. 2005).
Among various types of studies examining one or more of these hypothetical biologic pathways (including in vitro studies, in vivo animal studies, and human “exposure chamber” or field studies), panel studies have been used frequently because they have a number of design advantages (Ruckerl et al. 2006; Delfino et al. 2008). The core feature of the panel-study design is the use of a smaller, but more intensively sampled, cohort. In this design, a group of individual subjects is followed longitudinally forward in time, allowing serial collection of health endpoint data, usually analyzed as a function of daily changes in ambient levels of pollution. While some panel studies collect symptom or other self-report information, most collect specimens of blood, breath, urine, or other biologic samples for laboratory analysis. Panels are typically smaller than cohort or case-control designs, using tens, rather than hundreds or thousands, of subjects. Most panel studies of the health effects of air pollution use typical day-to-day (or season-to-season) variation in ambient pollutant levels (Chuang et al. 2007), although this design has occasionally been modified to incorporate the more substantial pollution changes that accompany natural disasters (Peters et al. 1997; Tan et al. 2000). Planned interventions, on the other hand, could provide a more ideal opportunity for a prospective panel study, because air pollution changes may be predicted in advance, allowing for a more informed study design. A few epidemiologic studies of air pollution and health effects have taken advantage of “real-world experiments” resulting from a regulatory action, large-scale sporting event, or the closing and reopening of an industrial facility for an extended period that led to a substantial reduction in ambient air pollution levels (Heinrich et al. 2000; Clancy et al. 2002; Hedley et al. 2002; Pope et al. 2007; Parker et al. 2008; Peel et al. 2010). A common feature of planned air quality intervention programs is that a ban on a particular air pollution source, over a relatively short time period, results in sharp, substantial, and sustained reductions in ambient pollution. Associated declines in morbidity, such as asthma events and bronchitis, ranged up to 42%, while declines in mortality were generally more modest, on the order of 2% to 15% over longer time periods (Pope 1989; Heinrich et al. 2000; Clancy et al. 2002; Hedley et al. 2002; Lee et al. 2006; Pope et al. 2007; Parker et al. 2008; Peel et al. 2010). None of these intervention studies, however, has assessed biomarkers reflecting mechanisms for pollution-induced clinical events.
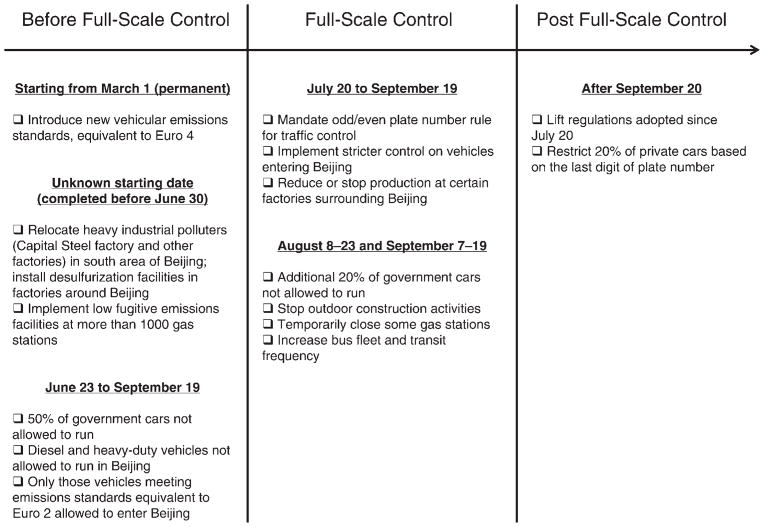
Beijing is one of the most polluted megacities in the world, with annual mean concentrations of PM2.5 exceeding 100 μg/m3 (Zhang et al. 2010) and daily mean concentrations of PM2.5 at times exceeding 200 μg/m3 (Xu and Zhang 2004). As one of its commitments to win the bid to host the 2008 Olympic and Paralympic Games, the Chinese government used its authority to control air pollution through specific actions, summarized in Figure 2, in order to ensure that the ambient air quality in Beijing during the Games would be comparable to that of previous host cities.
Figure 2. Air pollution control measures implemented to improve Beijing’s air quality during the Olympics and Paralympics.
(Data from Wang et al. 2009.)
The temporary air quality improvements resulting from the air pollution control measures shown in Figure 2 provided a rare opportunity to address critical questions regarding acute biologic mechanisms of cardiovascular effects related to ambient pollution over a uniquely broad concentration range. Such natural experiments also provide a rare opportunity for a quasi-experimental, “high-low-high” (or “A-B-A”) design where exposures and outcomes can be measured at a baseline (A), then measured after a dramatic change in pollution levels (B), and finally measured again after an expected return to baseline exposure conditions (A). Hence, in the present study, named the “Health Effects of an Air Pollution Reduction Trial” (or the HEART study), we used a combination of the quasi-experimental design and a panel-study approach to address the following specific aims.
SPECIFIC AIMS
Aim 1
To estimate the exposure of the study panel (subjects) to ambient air pollution before, during, and after the Olympics and to quantify the change in exposure to each pollutant from before to during the Olympics; additionally, to examine whether the post-Olympics pollutant concentrations would return to pre-Olympics levels.
Aim 2
To examine the reversibility of changes in biomarker levels in the study panel by comparing level changes from before to during the Olympics and from during to after the Olympics. We aimed to test the following hypothesis: Biomarkers of pulmonary inflammation, systemic inflammation, blood coagulation including platelet activation, and autonomic dysfunction, as well as biomarkers of oxidative stress, would change significantly during the Olympics air pollution reduction period, compared with the pre-Olympics period, and would revert after relaxation of the air pollution controls in the post-Olympics period.
Aim 3
To examine associations between each biomarker and each measured pollutant species across the entire study period and to estimate the unit change in biomarker level per unit concentration change in pollutant species. We aimed to test the following hypothesis: PM2.5, gaseous pollutants, and certain PM constituents would each be associated with specific biomarkers.
METHODS AND STUDY DESIGN
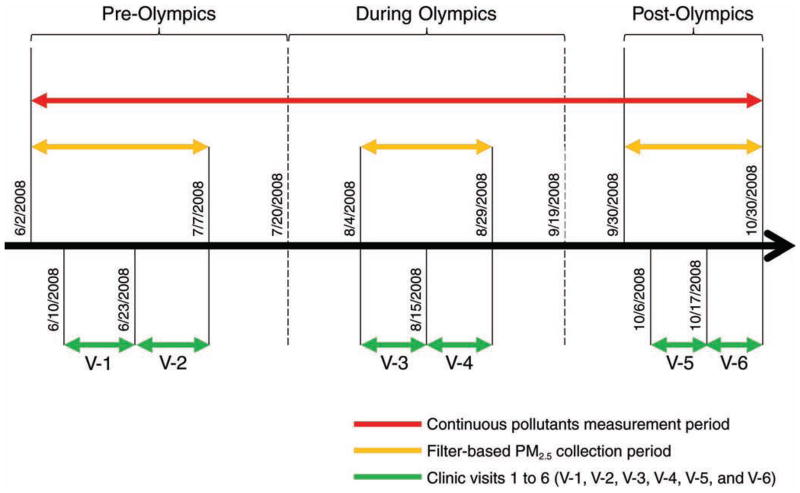
This panel study was designed taking into account the timeline of the 2008 Beijing air pollution control measures as shown in Figure 2. As shown in Figure 3, the whole study period (June 2–October 30, 2008) was divided into three subperiods, namely, the pre-Olympics period (June 2–July 20), the during-Olympics period (July 21–September 19), and the post-Olympics period (September 20–October 30). A set of biomarkers was repeatedly measured in each panel subject during his or her six scheduled clinical visits: two within each subperiod, separated by at least one week. Air pollution measurements were made on a daily basis, either continuously for the whole study period or starting 7 days before the first day of clinical visits within each of the pre- and post-Olympics periods (see Figure 3).
Figure 3.
Operational definition of pre-, during-, and post-Olympics periods in relation to the start and end dates for air pollutant measurements and clinical visits within each period.
We selected this relatively narrow time window (~5 months) for the study to minimize potential seasonal confounding of the health effects of air pollution exposure. In Beijing, the official season during which central heating is provided to most homes and residents may heat their homes (as determined by the government) is normally from November 15 to March 15, and regionally transported dust storms typically occur in early spring (before May 1), both circumstances that could effect air quality. According to our measurement scheme, visits 1 through 4 occurred in the summer months and visits 5 and 6 occurred in the early autumn season. Hence, meteorologic conditions during the two post-Olympics visits (especially those that occurred in late October) were expected to be different from those occurring during the first four visits.
This study design allowed us to compare within-subject differences in biomarker levels among the three subperiods and to assess relationships between each biomarker and each air pollutant across the study period. Moreover, a design incorporating repeated measurements within each period would help reduce the impact of the potential variability of biomarkers within periods and between individuals.
FIELD STUDY SITE
We selected Peking University First Hospital as the field site for both the air pollution measurements and the clinical visits. The hospital is located in the center of Beijing (within the 2nd Ring Road, one of the main circular roads surrounding the city), 3 km northwest of Tiananmen Square; it is surrounded by busy streets with local motor vehicle traffic, cyclists, and pedestrians. As an institution affiliated with Peking University, the hospital has multiple functions, including teaching, clinical service, research, and disease prevention. At the time of the study, the hospital had more than 300 medical residents who were, after having completed a high school degree, in an 8-year medical education program; the sixth- through eighth-year students were receiving clinical training.
STUDY SUBJECTS
Our study subjects were primarily medical residents. Some of these residents (8%) lived in dormitories located on the hospital grounds, and the rest (84%), with a few exceptions, lived in the Peking University Health Sciences Center dormitories, located about 5 km from the hospital. These medical residents had a regimented lifestyle, eating at the hospital/university dining facilities, living in dormitories (with no cooking facilities and thus without a major indoor source of air pollution), attending lectures in classrooms, studying in libraries, and working in the hospital. A few subjects (8%) lived off campus in nearby areas.
Through on-site advertisement and word of mouth, we recruited volunteers from the subject pool with the goal of having at least 100 participants (with approximately 50% each of men and women) to complete measurements at all of the six planned clinical visits. A total of 137 individuals were screened, from whom 128 nonsmoking healthy subjects (never-smokers) were enrolled in the study. The other 9 either did not meet the inclusion criteria or refused to participate. To be eligible as a study subject, at a minimum an individual must not have smoked for at least the past year and be free of any of the following diseases: chronic respiratory disease, cardiovascular disease, liver disease, renal disease, hematologic disease, diabetes mellitus, and other systemic diseases. After taking part in the first one or two visits, 3 of the 128 subjects withdrew from the study because of scheduling conflicts. These 3 subjects were excluded from the data analysis. Among the 125 subjects included in the analysis, 119 completed all of the 6 planned visits, and the remaining 6 subjects missed only 1 visit. All the subjects were ethnic Han Chinese. Basic demographic information for the 125 study subjects is summarized in Table 1.
Table 1.
Demographic Characteristics of Participants, Measured at the Screening Visits
| Female (n
= 62) |
Male (n
= 63) |
|||
|---|---|---|---|---|
| Mean ± SD | Range | Mean ± SD | Range | |
| Age (yr) | 24 ± 1 | 22–29 | 24 ± 2 | 19–33 |
| Height (m) | 1.62 ± 0.05 | 1.52–1.72 | 1.71 ± 0.06 | 1.58–1.83 |
| Weight (kg) | 53.7 ± 7.2 | 40.0–75.0 | 66.3 ± 10.7 | 51.5–101.0 |
| Body mass index (kg/m2) | 20.6 ± 2.4 | 16.2–29.3 | 22.5 ± 2.9 | 17.8–31.9 |
| SBP (mmHg) | 105 ± 8 | 90–125 | 116 ± 10 | 95–138 |
| DBP (mmHg) | 68 ± 6 | 60–85 | 74 ± 7 | 60–88 |
ETHICS AND INSTITUTIONAL REVIEW BOARD APPROVAL
The HEART study involved human subjects and was carried out at two collaborating institutions: the University of Medicine and Dentistry of New Jersey (UMDNJ) and Peking University in Beijing. The study protocol was approved by both the Institutional Review Board of UMDNJ (IRB approval number 0220070186) and the joint Ethics Committee of Peking University Health Sciences Center and Peking University First Hospital (IRB approval number [2007]069). Written informed consent was obtained from all potential subjects before screening for the study. Upon the completion of each experimental session, an honorarium was offered to each subject to compensate them for their time. The questionnaire responses and data files containing subject identifiers were securely stored using either locked filing cabinets or computers with password protection. By securing the data and ensuring that only the investigators and designated study staff members had access to records, subjects’ identities were completely protected in compliance with human subject guidelines.
CLINICAL VISITS
After recruitment and informed consent, each subject completed a medical history, physical examination, routine blood chemistry tests, spirometry, and electrocardiography (ECG) to rule out any medical conditions that would preclude participation. To maximize study personnel efficiency, we collected data from between 10 and 13 subjects on average at a time. Each clinical visit was about 60 minutes in duration and occurred at the same time of day (morning). Subjects were fasting on each test day to reduce extraneous effects on platelet activation markers. Subjects were asked not to use aspirin or nonsteroidal anti-inflammatory drugs for 2 weeks before testing. They were told that acetaminophen was acceptable as a minor analgesic and were given samples for use, if necessary. At each session check-in, subjects were asked if they had used any of the potentially confounding medicines; they were told that a positive answer would not disqualify them, but would only be taken into account in the analysis. Clinical visits proceeded as long as the subject remained otherwise medically qualified, since these medications are known to affect only platelet testing and not any other endpoints used in this study.
Subjects could not have an active upper-respiratory illness (either an infection or allergy) and were rescheduled if they had symptoms in the previous 7 days. Based on the questionnaire data, the physician determined that rescheduling due to upper-respiratory illness was needed for only two subject visits during the entire study (one visit was rescheduled for 2 days later, and the other for 6 days later). The subjects could not have used anti-inflammatory medication for allergies or other respiratory conditions for 2 weeks before a visit. Based on the questionnaire records, none of the subjects had used allergy or anti-inflammatory medications within that time frame before a visit. Indeed, only 6 subjects reported to have had seasonal allergies. Five of these subjects had allergic reactions in either the winter or spring, but not during our study in the summer and early autumn. Only 1 subject reported a history of summer allergies, with the last occurrence 5 years before the study.
Typically, all the subjects worked 8 hours a day, 5 days a week, including some night shifts. For each study subject, visits took place on the same day of the week (as much as possible) and were separated by at least 1 week. To avoid any potential impact from variations in sleeping patterns and unusual activities, visits were scheduled during routine time–activity periods and not after a night shift or travel event (vacations out of town or something similar).
On the day of a clinical visit, subjects reported for a suite of clinical procedures at Peking University First Hospital, under the supervision of the primary field-study physician. There was a quiet room for ECG testing, which was performed on subjects in the supine position. Blood pressure was recorded with sphygmomanometers (blood pressure cuffs) and with stethoscopes superior to the olecranon process on the subjects’ arms. Then blood was drawn into heparinized vacuum tubes containing EDTA and aliquoted for measurement of the selected blood markers. To minimize vascular trauma, platelet function specimens were collected using phlebotomy without employing a tourniquet. EBC and eNO samples were collected after the ECG procedure and the drawing of blood. If possible, ECG monitoring was performed first on all subjects, but otherwise the order of the other tests varied among subjects. A urine sample was collected during each clinical visit at a convenient time.
BIOMARKERS AND PHYSIOLOGIC ENDPOINTS
During each clinical visit, physiologic measurements and biologic specimens were collected for each study subject. These were used to measure a large set of biomarkers reflecting specific physiologic functions or biologic pathways, as summarized in Table 2 and described in more detail below.
Table 2.
Summary of Physiologic Endpoints and Biomarkers Measured
| Physiologic Function | Specimen Type | Biomarker/Endpoint | Measurement Principle/Equipment |
|---|---|---|---|
| Pulmonary inflammation and oxidative stress | Exhaled breath condensate | pH 8-Isoprostane Nitrite and nitrate |
pH meter ELISA HPLC-UV |
| Exhaled breath | FeNO | Chemiluminescence analyzer | |
| Autonomic tone/measure of cardiovascular physiology | N/A | HR and HRV Blood pressure |
ECG analysis
systems Sphygmomanometer |
| Hemostasis (procoagulation) | Blood | vWF Platelet aggregation Platelet activation (sCD40L, sCD62P) |
ELISA Photometric aggregometer ELISA |
| Systemic inflammation | Blood | Cell counts (WBC, RBC, neutrophils,
lymphocytes) Plasma CRP Plasma fibrinogen |
Standard automated clinical
methods ELISA Immunologic-based chemistry assay |
| Systemic oxidative stress | Urine | 8-OHdG | HPLC-ECD |
Exhaled Breath Condensate Collection and pH Measurement
We measured markers of oxidative stress and airway inflammation in collected EBC samples, including pH (hydrogen ions), 8-isoprostane, nitrite, and nitrate. EBC was collected using a Jaeger EcoScreen EBC collector (Erich Jaeger, Germany). The machine was switched on at least 30 minutes before collection to allow the cooling cuff to reach and stabilize at the operating temperature of −20°C. The sealing cap was applied to the cuff to insulate the internal cooling area and to avoid condensation of ambient moisture (which would freeze the lamellar condenser to the cuff when it was inserted). EBC was collected for 20 minutes, during which time subjects were seated, wearing a nose clip, and instructed to breathe tidally. Approximately 2 to 3 mL of condensate were obtained per collection.
After collection, the interface was removed from the cooling cuff, and the sealing cap was then replaced. With the condenser held upright, the sample collection vessel was removed, and its contents defrosted. We de-aerated samples with argon gas (350 mL/min for 10 minutes). We then measured EBC pH using an electronic pH meter, which had a resolution of 0.01 units and a working range of pH −2.00 to 16.00 and which was calibrated using standard pH buffer solutions daily before use. We then aliquoted samples in labeled CryoTubes and added an anti-oxidant mixture (butylated hydroxytoluene, 2 mM in 99% ethanol, 10 μL per mL of sample). Samples were immediately stored at −80°C for later analysis of the target biomarkers. The reusable collection interface was sterilized according to the manufacturer’s recommendation. All components were then thoroughly rinsed in double-distilled and de-ionized water to avoid sample contamination. Analyses for specific components of the condensate specimens are described in the following sections.
EBC 8-Isoprostane
We measured concentrations of 8-isoprostane in EBC using a commercially available enzyme-linked immunosorbent assay (ELISA) method (Rapidbio, West Hills, CA, USA). We prepared standards in a supplied phosphate buffer (pH 7.4) containing sodium azide (0.1 g/L), sodium chloride (0.234 g/L), ethylenediaminetetraacetic acid (EDTA) (0.37g/L), and bovine serum albumin (1 g/L). We added sample aliquots (100 μL) to a 96-well plate pre-coated with rabbit anti-human 8-isoprostane antibodies. The plate was incubated at 37°C for 120 minutes. After removal of the liquid, we added biotin-labeling murine anti-human 8-isoprostane antibody (100 μL) to the plate. After the sample was incubated at 37°C for 60 minutes and washed 3 times with a phosphate buffer solution (pH 7.4, containing 0.05% Tween 20), we added 100 μL of strepta-vidin/horseradish peroxidase (HRP) to the plate and then incubated at it 37°C for another 60 minutes. The plate was then washed five times with the same phosphate Tween 20 buffer solution and developed with tetramethyl-benzidine (TMB) reagent (90 μL per well) for 30 minutes. We stopped the reaction using 2N sulfuric acid (H2SO4) (50 μL) and measured the optical density value at 450 nm using a microplate reader. The detection limit for 8-isoprostane was 1.56 pg/mL. This method has been used in previous studies (Montuschi et al. 1999).
EBC Nitrite and Nitrate
We analyzed EBC nitrite and nitrate using a high-performance liquid chromatography (HPLC) system with a UV detector (Waters model 2695 and 2996, respectively; Waters Corp., Milford, MA, USA). The column used for separation of nitrite and nitrate was IC-Pak Anion HC (4.6 × 150 mm) from Waters. We injected aliquots of EBC samples (20 μL) into the HPLC system running with 10 mM borate/boric buffer at 0.8 mL/min as the mobile phase. The wavelength of the UV detector was set at 214 nm. We prepared external standards using high-purity potassium nitrite and potassium nitrate in deionized water. The detection limits were 7.22 ng/mL for nitrite and 4.43 ng/mL for nitrate. Repeated analyses of samples (n = 8) showed high reproducibility, with a relative standard deviation of 4.0% for nitrite and 2.6% for nitrate.
Fractional Exhaled Nitric Oxide
We measured FeNO using an offline sampling method following the recommendations of the American Thoracic Society/European Respiratory Society (ATS/ERS 2005) and described in an earlier publication (Lin et al. 2011). Subjects were trained in the use of the apparatus before beginning the study. Before sampling, each subject was asked to put the mouthpiece of the device tightly in his or her mouth, inhale deeply, and then exhale to wash the “dead space” from the device. This procedure was repeated twice. All measurements were made with the subjects seated, following 3 to 5 minutes of rest. They inhaled from the functional residual capacity through a mouthpiece with a NO-scrubber attached, thereby inhaling NO-free air, followed by a controlled expiration through the mouthpiece. (Tests confirmed that subjects inhaled ambient air with NO concentration below the detection limit of 0.4 ppb.) A rotameter was used to provide visual guidance to aid subjects and the field technician in maintaining a subject-controlled steady expiratory flow at 150 L/hr, thus improving reproducibility. (The field technician discarded the air sample if the subject’s flow rate did not reach the 150 L/hr target.) A resistive pressure of 13 cm H20 was applied to the exhaled air flow to ensure the closure of the nasopharyngeal vellum, thus preventing contamination by NO from the nose and sinuses. Hence, we collected the exhaled air containing only NO released from epithelial cells into a NO-impermeable aluminum foil bag (Huayuan Gas Center, China). We collected at least 1.5 L of exhaled air, which was more than adequate for the subsequent FeNO analysis using a NO/NO2/NOx (nitrogen oxides) chemiluminescence analyzer (model 42i; ThermoScientific, Rockford, IL, USA) within 3 hours of collection. The analyzer had a detection level of 0.40 ppb NO, an accuracy of ± 0.40 ppb, and a detection range of 0 to 100 ppb. The analyzer was calibrated every day using five different concentrations of NO (0–80 ppb) in ultrapure nitrogen (Beijing Haikeyuanchang Practical Gas Co., Ltd., China).
Heart Rate and Heart Rate Variability
We measured HR and HRV using a 12-lead 3-channel MGY-S2 ECG Analysis System (ECG Lab 3.0, Meigaoyi Co., Beijing, China) for 10 minutes per visit. The ECG system software (ECG Lab 3.0, DM Software, Stateline, NV, USA) automatically sorts information into unique morphologic categories (normal, ventricular, paced, artifact, etc.) and then labels each abnormality in a diagnostic strip with its classification, time of occurrence, the corresponding HR, and beat annotations. The software program also allows for the screening and editing of isolated ectopic beats or runs of sustained arrhythmia, and automatically performs data trending in both time and frequency domains. We performed time- and frequency-domain HRV analysis with a fast Fourier transform on the artifact-free and ectopy-free normal R-to-R intervals (the interval between adjacent R-wave peaks indicating the cycle length of a heart beat) according to the currently recommended practice (Task Force of the European Society of Cardiology and the North American Society of Pacing and Electrophysiology 1996). The time-domain parameters we assessed included standard deviation of normal-to-normal (SDNN) R–R intervals and root mean square of successive differences (rMSSD) between adjacent normal cycles. We categorized the frequency spectrum into low-frequency (LF) power (0.04–0.15 Hz) and high-frequency (HF) power (0.15–0.40 Hz). We also computed the ratio of LF to HF. Other HRV parameters assessed using the ECG included very low frequency (VLF) power (0.003–0.04 Hz) and total power (total spectral power of all intervals up to 0.4 Hz).
von Willebrand Factor
An adhesive glycoprotein that is produced by endothelial cells and allows platelets to attach to the subendothelial vessel wall, vWF may serve as an endothelial-derived hemostasis marker of exposure to PM (Pope 1989; Pope et al. 2006). Using 2.7 mL venous blood, we measured vWF protein levels in the plasma using a commercially available ELISA kit (Hushang Biotechnology, Shanghai, China). In this immunologic method using anti-vWF antibodies (rabbit polyclonal), vWF was measured as vWF antigen in subjects’ plasma compared with that in a standard species-specific plasma pool (Genc et al. 2011). Hence the vWF levels were reported as a percentage (%).
Platelet Aggregation
We determined with a photometric aggregometer (model LBY-NJ4, Beijing Precil Instrument Co., China) the percentage of total platelets aggregated. We centrifuged fresh blood samples (in 2.7 mL aliquots, within 3 hours of collection) at 500 to 800 rpm for 10 minutes to obtain platelet-rich plasma (PRP) in the supernatant. An aliquot of the PRP supernatant was then centrifuged at 4000 rpm for 10 minutes to obtain platelet-poor plasma (PPP). We adjusted (standardized) the platelet count in PRP to 200 × 109/L by dilution with PPP. We then incubated 300 μL of the standardized PRP at 37°C and continuously stirred (at 1000 rpm) for 5 minutes before adding a platelet aggregation inducer (epinephrine) to make a final concentration of 4.5 μM PRP. At least 3 minutes after adding the inducer, the percentage of platelets aggregated was determined.
sCD62P and sCD40L
We used soluble sCD62P and sCD40L as biomarkers of platelet activation (Blann et al. 2003; Heeschen et al. 2003; Genc et al. 2011) and measured their concentrations in plasma using commercially available ELISA kits (Rapid-bio). For sCD62P, we prepared the standards in a supplied phosphate buffer (pH 7.4) containing sodium azide (0.1 g/L), sodium chloride (0.234 g/L), EDTA (0.37 g/L), and bovine serum albumin (1 g/L). Aliquots of plasma samples (100 μL) were added into a 96-well plate (pre-coated with rabbit anti-human sCD62P antibodies). The plate was incubated at 37°C for 120 minutes. After removal of the liquid, we added enzyme-labeling murine anti-human sCD62P antibody (100 μL) to the plate. After incubating at 37°C for 60 minutes, the plate was then washed five times with the phosphate buffer solution (pH 7.4, containing 0.05% Tween 20) and developed with o-phenylenediamine reagent (100 μL per well) for 15 minutes. We stopped the reaction with 2N H2SO4 (50 μL) and measured the optical density value at 490 nm using a microplate reader. The detection limit of sCD62P in plasma was 1 ng/mL.
For sCD40L, we prepared the standards in a supplied phosphate buffer (pH 7.4) containing sodium azide (0.1 g/L), sodium chloride (0.234 g/L), EDTA (0.37 g/L), and bovine serum albumin (1 g/L). Plasma sample aliquots (100 μL) were added to a 96-well plate (precoated with rabbit anti-human sCD40L antibodies). The plate was incubated at 37°C for 120 minutes. After removal of the liquid, we added biotin-labeling murine anti-human sCD40L antibody (100 μL) to the plate. After the plate was incubated at 37°C for 60 minutes and washed carefully three times with the phosphate buffer solution (pH 7.4, containing 0.05% Tween 20), we added streptavidin/HRP (100 μL) to the plate before incubating at 37°C for 60 minutes. The plate was then washed five times with the phosphate buffer solution (pH 7.4, containing 0.05% Tween 20) and developed with TMB reagent (100 μL per well) for 20 minutes. We stopped the reaction with 2N H2SO4 (50 μL) and measured the optical density value at 450 nm using a microplate reader. The detection limit of sCD40L in plasma was 1 ng/mL.
Blood Cell Counts, Plasma Fibrinogen, and C-Reactive Protein
We measured complete blood cell counts and differential leukocyte counts using standard, automated clinical methods in the hematology laboratory of the First Hospital. WBC and RBC counts per unit volume were reported and analyzed in this study, as these blood indices may reflect systemic inflammation associated with PM exposure (Seaton et al. 1999; Symons et al. 2006).
Plasma fibrinogen and CRP are acute phase proteins that are produced by inflammatory mediators acting on the liver, and thus may serve as biomarkers of systemic inflammation (van Eeden et al. 2001; van Eeden and Hogg 2002; Shishehbor et al. 2003). Both biomarkers were analyzed in the local hospital’s hematology laboratory using standard procedures. Plasma fibrinogen was analyzed within 4 hours of venous blood collection using an automated analyzer, ACL9000 (Beckman Coulter Co., Beijing Branch, China). CRP concentrations were measured in EDTA (anticoagulant)–treated plasma using a clinical immunonephelometric assay with an automated nephelometer. The detection limit for CRP was 0.3 mg/mL. However, because of the low accuracy of the actual CRP values reported, these values were used cautiously in the statistical analysis and interpretation of results.
Urinary 8-Hydroxy-2′-Deoxyguanosine
We diluted an aliquot of each urine sample (1.5 mL) with 1.5 mL of potassium dihydrogen phosphate buffer (0.1 M, pH 6) and then forced it through a solid phase extraction cartridge previously conditioned with 5 mL methanol, 5 mL deionized water, and 5 mL potassium dihydrogen phosphate buffer (0.1 M, pH 6). After washing the cartridge with 3 mL deionized water and 1.5 mL of the same buffer solution, we dried it with a vacuum system for 10 minutes and then eluted it with a 2 mL solution of 30% methanol in deionized water. We analyzed the eluted solution (with a sample injection volume of 20 μL) using a HPLC system coupled with an electrochemical detection (ECD) system under the following conditions. We used a μBondapak C18 analytical column (Waters Corp.). The mobile phase program involved the use of two solutions: Solution A consisted of 93.5% deionized water and 6.5% methanol with citric acid (2.4 g/L), sodium acetate (2.05 g/L), acetic acid (0.6 g/L), sodium hydrate (1.2 g/L), and EDTA (20 mg/L); and Solution B consisted of 90% deionized water and 10% methanol with citric acid (2.4 g/L), sodium acetate (2.05 g/L), acetic acid (0.6 g/L), sodium hydrate (1.2 g/L), and EDTA (20 mg/L). The mobile phase was run under a gradient program at a 1 mL/min flow rate. It consisted of 100% Solution A for the first 12 minutes, switched linearly (after 2 minutes) to 100% B, which was maintained for 17 minutes, and then switched (after 1 minute) to 100% A, which was maintained for 8 minutes until the end (total run time was 40 minutes). We used an ECD detector (model WA2465, Waters Corp.) with the electrode potential set at +0.6 V, the range at 50 nA, and the time constant at 1.0 second (De Martinis and Bianchi 2002). The method detection limit was 0.5 ng/mL. Concentrations of urinary 8-OHdG, normalized by urinary creatinine concentrations, were reported in milligrams per mole.
MEASUREMENTS OF AIR POLLUTANTS AND WEATHER PARAMETERS
We conducted a comprehensive characterization of air pollution, covering the entire time window of the panel study (June 2, 2008, to October 30, 2008; see Figure 3). All the air samplers and monitors were collocated at a secured spot (the rooftop of a seven-story building located in the center of the hospital campus). All the real-time monitors were operated continuously throughout the entire measurement period (from June 2 to October 30). PM2.5 mass and constituent measurements were made on a 24-hour basis, starting from approximately 10 AM. The pollutant species and their measurement time resolutions are summarized in Table 3. The span of time used to calculate the daily average for all the pollutants and the weather parameters was from 10 AM to the time of the last data point before 10 AM on the next day.
Table 3.
Summary of Pollutant Species, Measurement Time Resolution, and Measurement Techniques
| Time Resolution | Sampling Equipment / Measurement Principle or Equipment | |
|---|---|---|
| Particulate Matter | ||
| Particle number (13–764.7 nm) | Continuous (10 min) | TDMPS |
| PM2.5 mass | 24 hr | Cyclone with Teflon filter/gravimetry |
| PM2.5 mass | Continuous (1 hr) | TEOM |
| EC/OC in PM2.5 | 24 hr | Cyclone with quartz-fiber filter/thermal-optical EC/OC analyzer |
| PAHs in PM2.5 | 24 hr | Cyclone with quartz-fiber filter/GC–MS |
| Ions in PM2.5 | 24 hr | Cyclone with Teflon filter/IC |
| Elements in PM2.5 | 24 hr | Cyclone with Teflon filter/ICP–MS |
| Gases | ||
| O3 | Continuous (1 hr) | UV spectrometer |
| NO, NO2, NOx | Continuous (1 hr) | Chemiluminescence analyzer |
| CO | Continuous (1 hr) | Non-dispersive infrared detector |
| SO2 | Continuous (1 hr) | Fluorescence detector |
| Meteorologic Parameters | ||
| Temperature | Continuous (1 hr) | Met One meteorology system |
| RH | Continuous (1 hr) | |
We selected the PM2.5 constituents based on the following rationale: SO42− is a major component of PM2.5 mass and is formed through photochemistry-driven oxidation of SO2 in the atmosphere; hence SO42− is often regarded as an indicator of regional sources of fossil fuel combustion. In contrast, EC reflects local emissions especially from the combustion of diesel fuel and/or coal. Given this, we chose EC and SO42− as crude indicators of local (pre-dominantly traffic) and regional sources, respectively. Both local emissions and regional transport contribute to OC levels. In addition, EC, OC, and SO4 have distinct chemical properties (e.g., solubility and surface reactivity), implying potential differences in their toxicity (Siegel et al. 2004; Zielinska et al. 2010).
Particle Number Concentrations
Our plan was to measure the number concentrations of particles with various size ranges using a scanning mobility particle sizer (SMPS) (TSI model 3080, TSI Inc., St. Paul, MN, USA), which was collocated with other air samplers and monitors at the HEART study site (Peking University First Hospital). The SMPS was assembled with a long differential mobility analyzer (TSI model 3081) and a condensational particle sizer (TSI model 3025A) to measure particle number size distributions from 14.1 nm to 736.5 nm with a time resolution of 5 minutes.
Because of technical problems with the SMPS system, we failed to measure particle number concentrations for the pre- and during-Olympics periods. However, at the main campus of Peking University, about 7 km from the hospital, there was a twin differential mobility particle sizer (TDMPS), consisting of two Hauketype differential mobility analyzers (TSI model 3010) and two condensation particle counters (TSI model 3025), which functioned normally and collected data covering the pre-, during, and post-Olympics periods as defined in this study. The TDMPS measured particle number concentrations in 26 size bins (ranges) between 13 nm and 764.7 nm at 10-minute intervals. Hence we were able to use particle number concentrations measured at this site in our data analysis. We analyzed size-resolved concentration data to determine particle size distributions by period. Because of time and resource constraints, we analyzed only TPN in relation to biomarkers in this report.
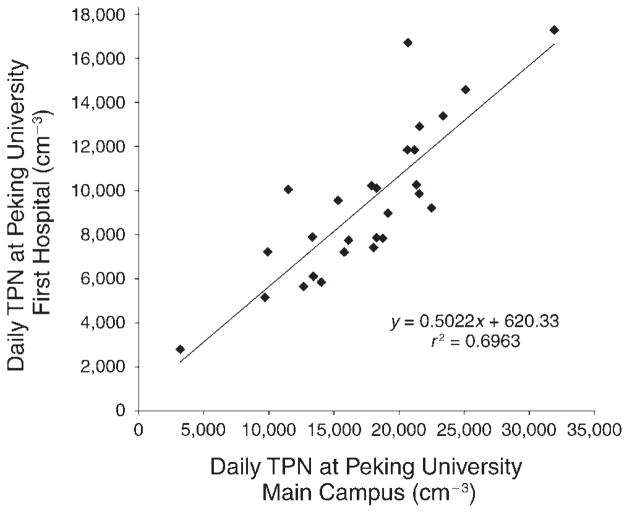
On 27 days during the post-Olympics period, both the SMPS system located at the hospital and the TDMPS system located on the main campus worked normally, allowing us to compare the concentrations of TPN measured in the same 24-hour periods at the two sites. As shown in Figure 4, the linear regression coefficient (r 2) was 0.6963; and the concentrations measured at the hospital grounds appeared to be systematically lower than those measured at the main campus. Because the total particle size range (14.1 nm–736.5 nm) measured with the SMPS system at the First Hospital was slightly smaller than the total particle size range (13 nm–764.7 nm) measured by the TDMPS at the main campus, it was reasonable to expect that the SMPS would measure lower concentrations. However, the slope of the regression line was 0.5022, meaning that the SMPS concentrations were about half the TDMPS concentrations. This large difference may be due to other reasons, including the inherent difference between the two systems and/or actual spatial differences between the two sites. Because of practical limitations, we did not compare the two systems side by side to assess any inherent difference between them. Nonetheless, it is still useful to use TPN concentrations measured at the main campus site given the relatively high correlation between the measurements made at the two sites.
Figure 4. Concentrations of TPN measured at the Peking University First Hospital site (by SMPS; 14.1–736.5 nm) vs. those measured at the Peking University main campus site (by TDMPS; 13–764.7 nm).
All data points (n = 27) were 24-hour means, averaging from 10 AM to 10 AM the next day.
PM2.5 Mass Concentration
We used two techniques to determine PM2.5 concentrations: gravimetric analysis and the tapered-element oscillating microbalance (TEOM) method.
Gravimetric Measurement
We collected PM2.5 on Teflon filters using a Quad Channel Ambient Particulate Sampler equipped with a 2.5 μm impactor (TH-16A, Tianhong Inc., China) and operating at a flow rate of 16.7 L/min. We weighed the Teflon filters before and after the sampling using an analytical balance (Mettler Toledo AX105DR) with a sensitivity of 10 μg after preconditioning for 24 hours at constant humidity (RH = 40% ± 3%) and temperature (20° ± 1°C). We determined PM2.5 mass concentrations by dividing PM mass collected on the filter by the total sampling volume.
TEOM Method
We used a TEOM 1400a Ambient Particulate Monitor (Thermo Electron Corp., NY, USA) to measure PM2.5 real-time mass concentrations. The TEOM method has been designated by the U.S. Environmental Protection Agency (EPA) as equivalent to the gravimetric method (EPA Designation No. EQPM-1090-079). This is an inertial measurement technique that operates by measuring changes in the resonant frequency of an oscillating element as a function of increases in particle mass collected on a filter attached to the element. Changes in the element’s resonant frequency are sampled electronically in quasi real time, providing both continuous and time-averaged measures of mass accumulation that are directly proportional to instantaneously measured and time-averaged PM2.5 mass concentrations in the air, respectively. We collected both hourly and 24-hour averages of PM2.5 concentrations using the TEOM method with the sampling inlet temperature set at 50°C.
Comparison Between TEOM and Gravimetric PM2.5 Data
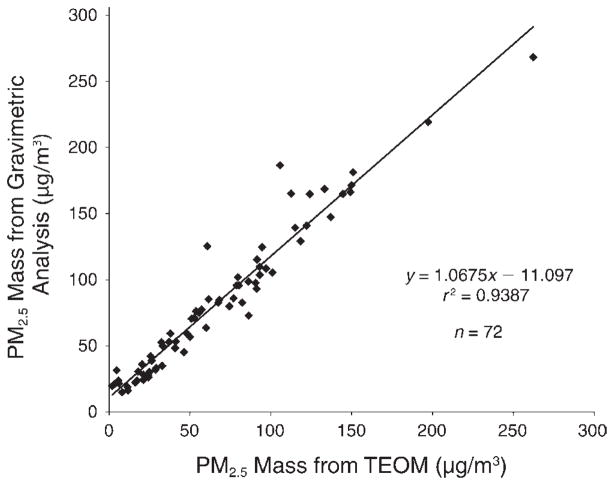
We ran a linear regression analysis to compare PM2.5 mass concentrations measured by the two methods. As shown in Figure 5, the two methods agreed highly with an r 2 of 0.9387 and a near-unity slope. However, the TEOM method appears to underestimate PM2.5 mass concentration by approximately 11 μg/m3 (intercept = 11.097 μg/m3). In this report, we used the gravimetrically derived data as the primary data for all analyses, except for the few dates (n = 6) (before the start of visit 3 in the during-Olympics period) when gravimetric data were missing; to derive data for those dates, we used the equation shown in Figure 5 to normalize TEOM data to make them comparable to the gravimetric data.
Figure 5. PM2.5 concentrations measured using the gravimetric method vs. those measured using the TEOM method.
The two types of measurements were made at the same site and the same time. All data points were 24-hour means, averaging from 10 AM to 10 AM the next day.
Species and Total PM2.5 Mass
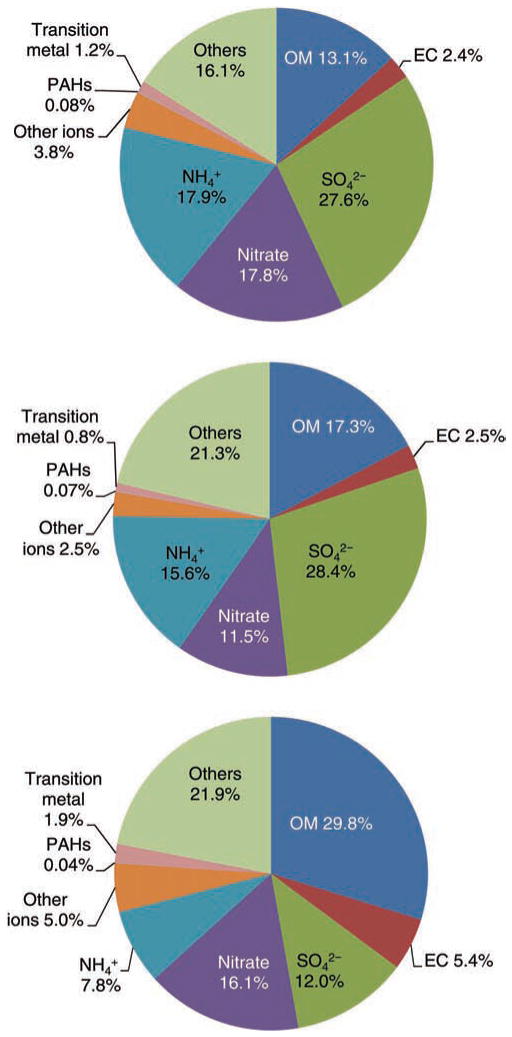
We also assessed the relative contributions of the species to the total PM2.5 mass. To do that, we grouped the measured species into the following categories: (1) organic matter (OM), defined as 1.4 times the OC concentration, based on previous studies of PM in Beijing (Zheng et al. 2005); (2) EC; (3) SO42−; (4) NO3−; (5) NH4+; (6) other ions (sum of Na+, K+, Mg2+, Ca2+, F−, and Cl−); (7) PAHs (sum of the 14 individual PAHs); (8) transition metals (sum of the following 13 elements: Ti, V, Cr, Mn, Fe, Co, Ni, Cu, Zn, Mo, Cd, Th, and U); and (9) other unknown species representing the difference between PM2.5 mass and the sum of all the species specified in the eight categories.
Elemental Carbon and Organic Carbon
We precleaned quartz-fiber filters to remove carbonaceous contaminants by firing them at 500°C for 5.5 hours and then stored them in petri dishes in the freezer at −4°C until use. After PM2.5 was collected, we punched out a 1.45 cm × 1 cm section from each quartz filter and used it to determine OC and EC with an OC/EC analyzer (Sunset Laboratory, Tigard, OR, USA) following the standard protocol of the National Institute for Occupational Safety and Health Reference Method #5040 (Birch 1999).
Polycyclic Aromatic Hydrocarbons
We collected particle-phase polycyclic aromatic hydrocarbons (PAHs) on quartz-fiber filters at a sampling flow rate of 16.7 L/min. PAHs collected on filters were extracted by dichloromethane using a Dionex ASE300 Extractor (Dionex, Sunnyvale, CA, USA). Resulting extracts were concentrated to 1 mL using a gentle nitrogen flow through the extract solution. Aliquots of the final extracts were analyzed for PAHs employing a gas chromatography–mass spectroscopy (GC–MS) system (Agilent GC model 6890 and MS model 5973N, Agilent Technologies, Inc., Santa Clara, CA, USA). Both external and internal standards (National Institute of Standards and Technology [U.S.]) were used to quantify the following 15 PAHs: naphthalene, acenaphthylene, fluorine, phenanthrene, fluoranthene, pyrene, benzo[a]anthracene, chrysene, benzo[b]fluoranthene, benzo[k]fluoranthene, benzo[e]pyrene, benzo[a]-pyrene, indeno[1,2,3-cd]pyrene, dibenzo[a,h]anthracene, and benzo[g,h,i]perylene. (Because we had some internal standard problems with naphthalene, along with the well-recognized difficulty [Gundel et al. 1995] in measuring this relatively volatile compound in the particulate phase, we removed it from our PAH list.) The column used for separation was a 30 m × 0.25 mm inner-diameter-fused silica capillary column, coated with a cross-linked phenyl methyl silicone. The carrier gas was helium with a constant flow rate of 1.20 mL/min. The initial oven temperature was 40°C for the first 2 minutes, and then was increased at a ramping rate of 10°C/min to the final temperature of 300°C, which was maintained for 10 minutes. The mass spectrum operation conditions were as follows: source temperature, 250°C; gas chromatography interface temperature, 300°C; the emission current, 350 μA; the electron energy, 70.0 V (nominal); and the detector voltage, 350.0 V (He et al. 2006; Huang et al. 2006).
Inorganic Ions
We designated filters used in one of the four channels in the PM2.5 sampler for analysis of the following nine water-soluble anions and cations: fluoride (F−), chloride (Cl−), nitrate (NO3−), SO42−, ammonium (NH4+), calcium (Ca2+), sodium (Na+), magnesium (Mg2+), and potassium (K+). Samples were extracted using 10 mL deionized water in an ultrasonic bath for 30 minutes at room temperature, and the analysis was performed using ion chromatography (IC) (Dionex ICS-2500, Dionex). We used an AS11 column (4 mm) with an AG11-HC (4 × 50 mm) guard column and an anion trap column (ATC-3, 9 × 24 mm, for 4 mm) for anion detection with an eluant of 0.4 to 6 mM/L sodium hydroxide (1.2 mL/min, gradient). We analyzed cations using a CG-12A (4 × 50 mm) guard column and CSRS-I suppressor. The eluant was 20 mM/L methylsulfonic acid with a flow rate of 1.0 mL/min. Field and laboratory blanks were analyzed using the same method, and the concentrations on these controls were all below the detection limits. More detailed information about the method can be found in previous papers (Hu et al. 2005; Guo et al. 2010).
Elements
We used Teflon filters installed in another channel of the PM2.5 sampler for analysis of the following 24 trace elements: sodium (Na), magnesium (Mg), aluminum (Al), phosphorus (P), potassium (K), calcium (Ca), titanium (Ti), vanadium (V), chromium (Cr), manganese (Mn), iron (Fe), cobalt (Co), nickel (Ni), copper (Cu), zinc (Zn), arsenic (As), selenium (Se), molybdenum (Mo), cadmium (Cd), barium (Ba), thallium (Tl), lead (Pb), thorium (Th), and uranium (U). This analysis was done in a commercial laboratory using a common inductively coupled plasma mass spectrometer facility with a plasma forward power of 1350 W (Agilent 7500C ICP–MS). Instrument calibration was achieved using multi-element standards made up in a 5% nitric acid solution prepared by Agilent Technologies (part # 518324682).
Gaseous Pollutants and Weather Parameters
We measured gaseous pollutants (O3, CO, SO2, NO, NO2, and NOx) using instruments from Ecotech Pty. Ltd. (Knoxfield, VIC, Australia), including an EC9810B O3 analyzer with a detection limit of 0.5 ppb, an EC9830 CO analyzer with a detection limit of 0.5 ppb, an EC9841B NO/NO2/Nox analyzer with a detection limit of 0.4 ppb, and an EC9850B SO2 analyzer with a detection limit of 0.3 ppb. These automated monitors were maintained and calibrated following the manufacturer’s protocols. We monitored ambient temperature and RH at the same site using a Met One meteorology system (Grants Pass, OR, USA). We extracted precipitation data from a publicly available Web site that reported rainfall for Beijing (Weather Underground, www.wunderground.com/weatherstation/WXDailyHistory.asp?ID=IBEIJING13).
We obtained hourly measurements for all these gaseous species using real-time monitors (see Table 3). To maintain consistency with filter-based PM2.5 measurements, we computed daily means for these species using the same start time (~10:00 AM) and end time (the last data point before 10 AM) in each 24-hour period. Because O3 had particularly large diurnal variations, we also computed maximum 1-hour average concentration within a 24-hour period (referred to as “O3 max”).
STATISTICAL METHODS AND DATA ANALYSIS
Descriptive Statistics
We performed descriptive statistics for each air pollutant measured and for each health endpoint (biomarker). We calculated means, standard deviations, and quartiles, as well as minimums and maximums, for each visit and/ or each period (i.e., pre-, during-, and post-Olympics periods), as described below. We also calculated the proportion above the minimum detectable level (data not shown). When calculating means and standard deviations, values that were below the detectable limit were set to half of the detectable limit.
All biomarkers, except CRP and 8-isoprostane, were evaluated as continuous responses using linear modeling techniques, as described below. CRP and 8-isoprostane concentrations were dichotomized before statistical analysis because of the large number of nondetectable values as well as a skewed distribution of the remaining values. Further, they were evaluated using hierarchical logistic regression models, also described below.
Comparison of Pollutant Concentrations by Period
We used graphs and box plots illustrating descriptive statistics for pollutant levels and meteorologic variables to examine the distributions and correlations of pollutant levels across periods. To compare air pollutant concentrations in the pre-, during-, and post-Olympics periods, we employed time-series regression models to assess the between-period differences for significance. We used the following model structure:
where t represents the date of measurement, Yt denotes the pollutant concentration at date t, α0 denotes the mean for the pre-Olympics period, α1 denotes the mean difference between the during- and pre-Olympics concentrations, α2 denotes the mean difference between the post- and pre-Olympics concentrations, and εt denotes random error, which was modeled via an auto-regressive and moving average of order 1. This autoregressive moving-average model (1,1) structure was determined by the autocorrelation function (ACF) plot, partial ACF plot, and Akaike Information Criterion (AIC) values. (The term I(x) is an indicator function with a value of 1 if condition x holds, and a value of 0 if otherwise.) Linear contrasts were made to compare between-period differences for each pollutant. We conducted the time-series regression analyses using the function “gls” from the R software nlme package. The “gls” function allowed gaps between periods. We compared the unadjusted period-specific means of air pollutant concentrations estimated by the autoregressive moving-average models with the observed period-specific averages (sample means) and found that they were close. We also used the Durbin–Watson statistic to examine the residual auto-correlations and found that it was small (<2), indicating minimal residual auto-correlations.
Analyses of Biomarkers with Continuous Values
We used mixed-model analyses to examine period (pre-, during-, and post-Olympics) effects as well as, separately, associations between pollutant and biomarker levels, controlling for temperature, RH, sex, and day of the week. In order to account for correlation within subjects, we compared alternative correlation structures using AIC. The model that was consistently chosen as the best across biomarkers was the simplest model in which a random effect for subject induced equicorrelation between all observations within subject. Next, we adjusted for temperature and RH using natural splines with the degrees of freedom chosen to minimize AIC; same-day temperature and RH were included in each model. We also accounted for additional seasonal differences by including the cumulative averages of temperature and RH of up to 7 days, using natural splines if these terms resulted in lower AICs. Because partial regression plots suggested that allowing more than 3 degrees of freedom (df) resulted in overfitting, we allowed only up to 3 df for all splines. We used the final models to examine period effects and pollutant–biomarker associations as follows.
Comparison of Biomarker Levels by Period
Our study design has a unique quasi-experimental “A-B-A” structure enabling the comparison of biomarker changes by period (pre-, during-, and post-Olympics), as distinct from previous studies that have assessed biomarker change as a function of day-to-day fluctuations in ambient pollutant levels (Adamkiewicz et al. 2004; Chuang et al. 2007; Barraza-Villarreal et al. 2008; Delfino et al. 2009). Both the adjusted and unadjusted effects of the period (pre-, during- and post-Olympics) were examined by adding indicator variables for period into the random effects model with and without the adjustment for temperature, RH, and day of the week (as discussed above). We used contrasts and related F-tests to examine the pairwise comparisons between periods.
Relationships Between Pollutants and Biomarkers
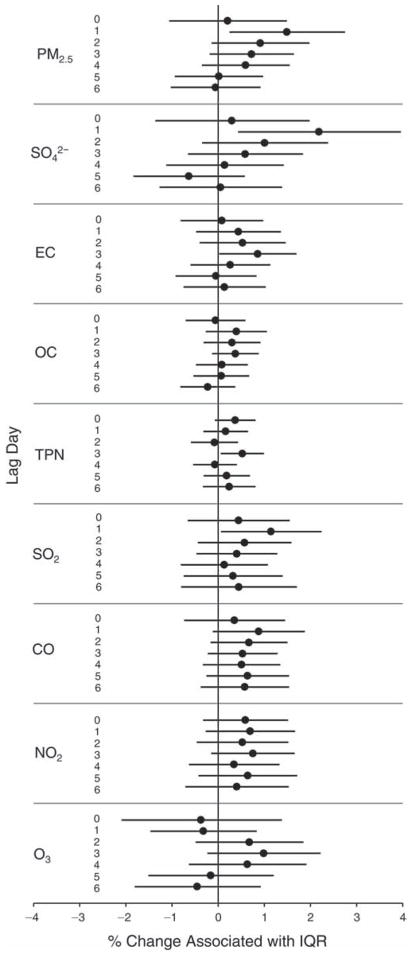
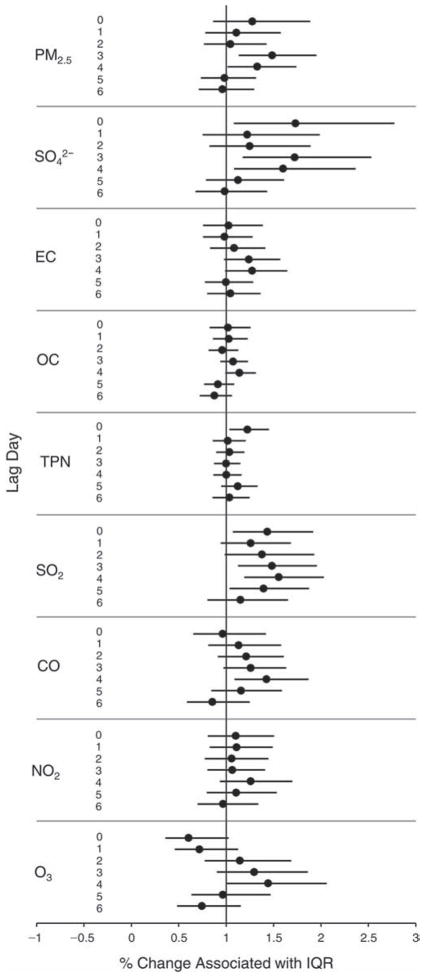
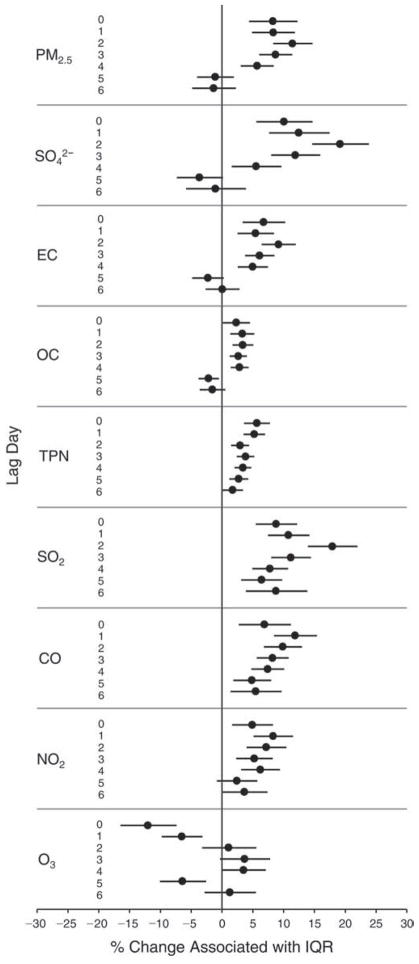
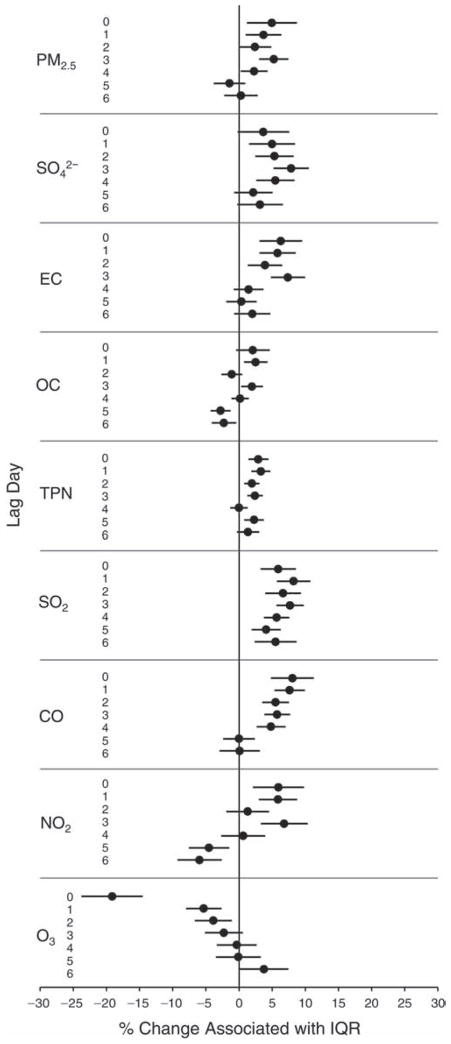
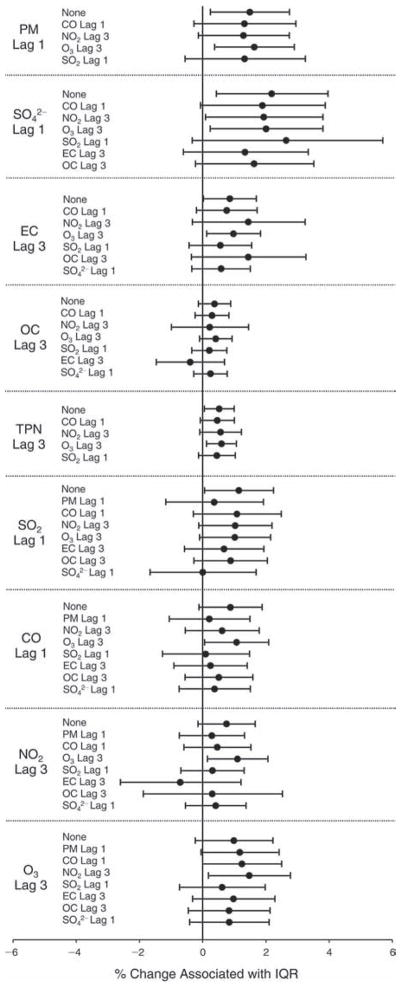
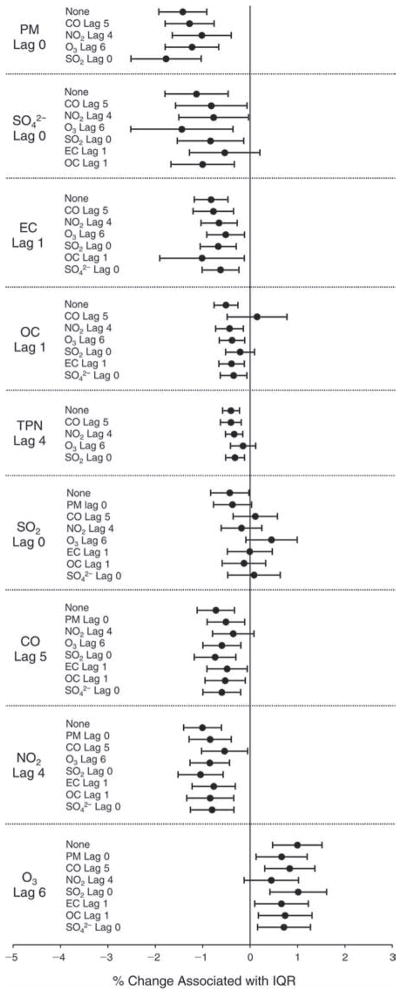
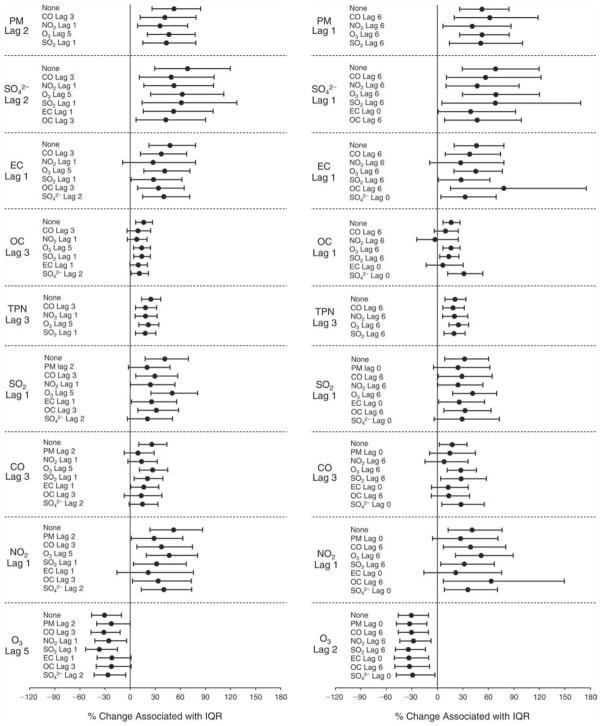
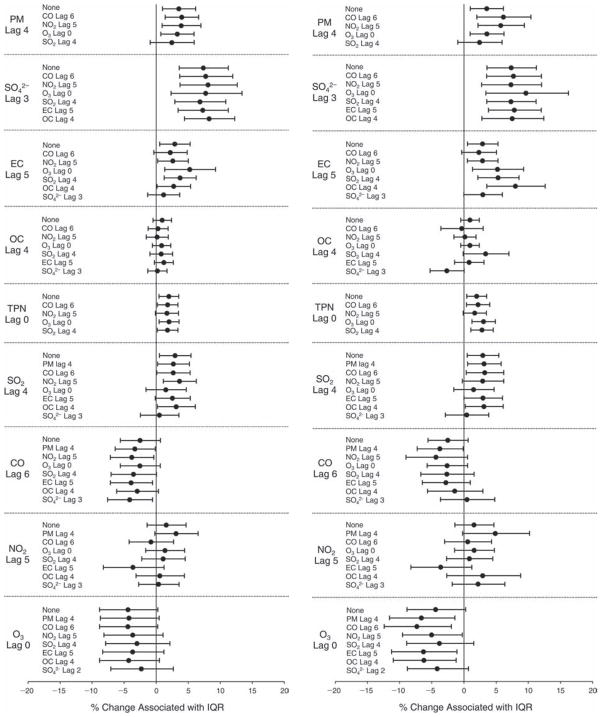
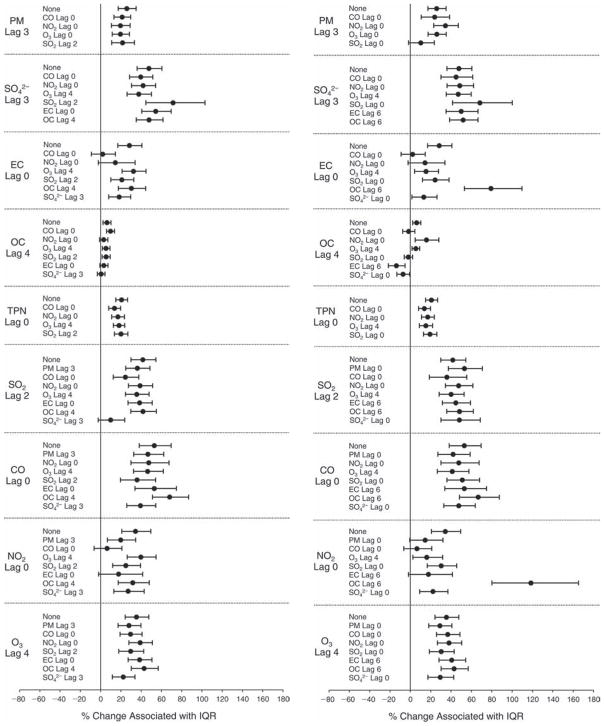
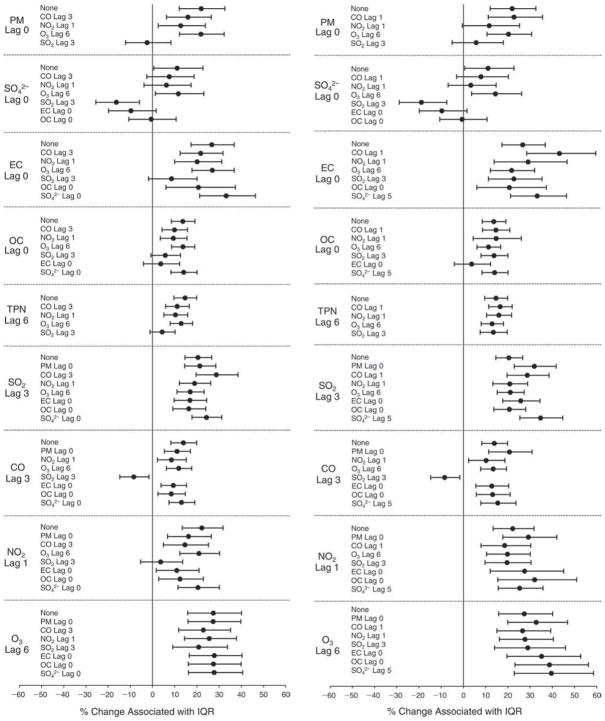
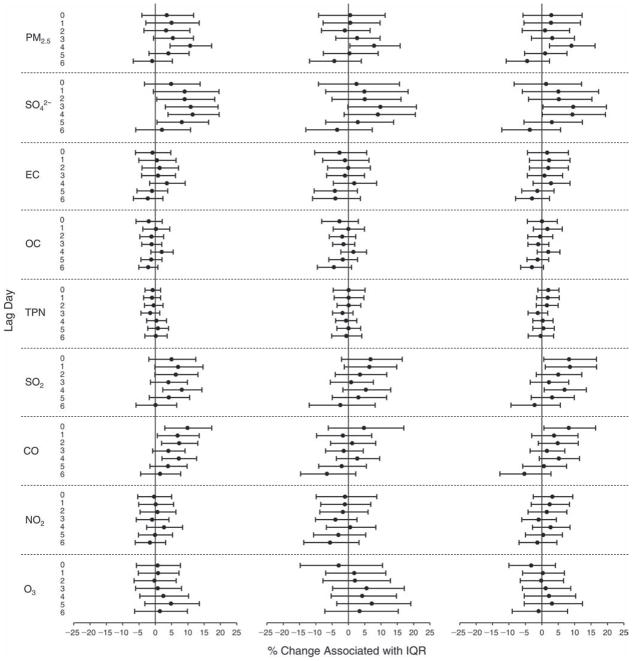
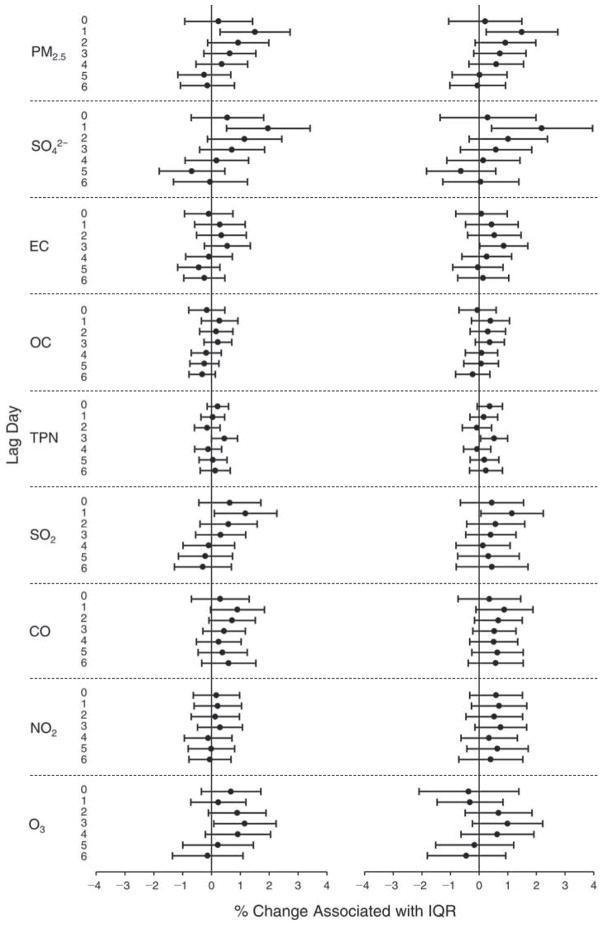
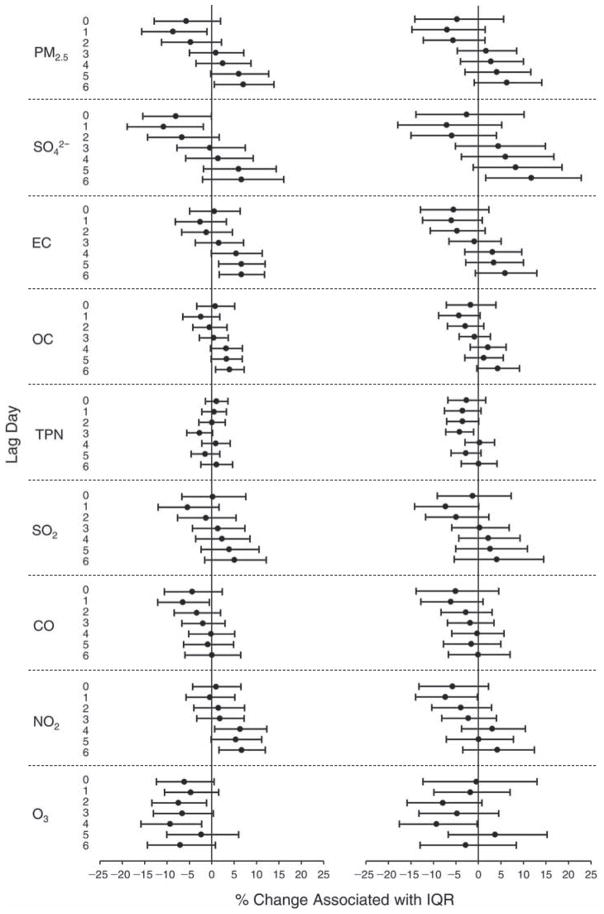
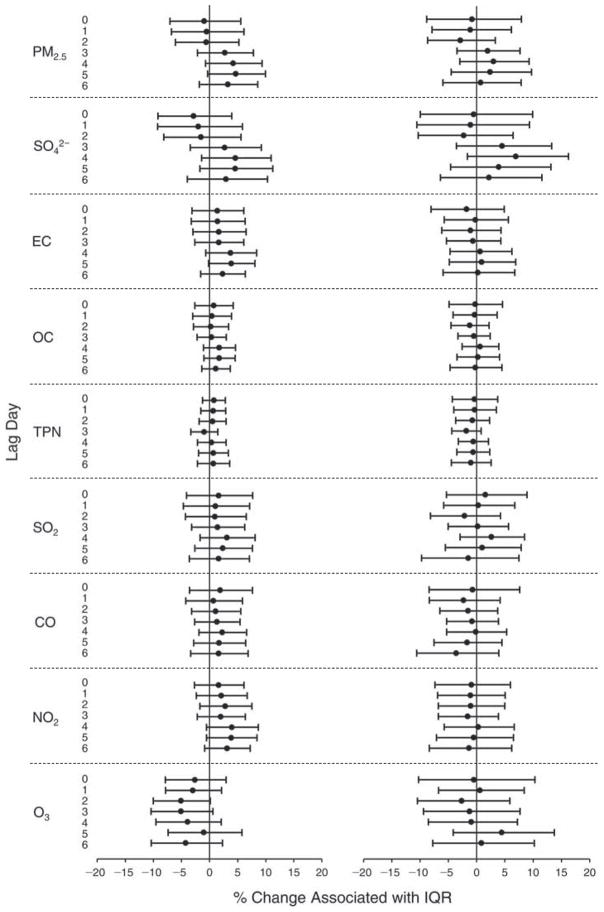
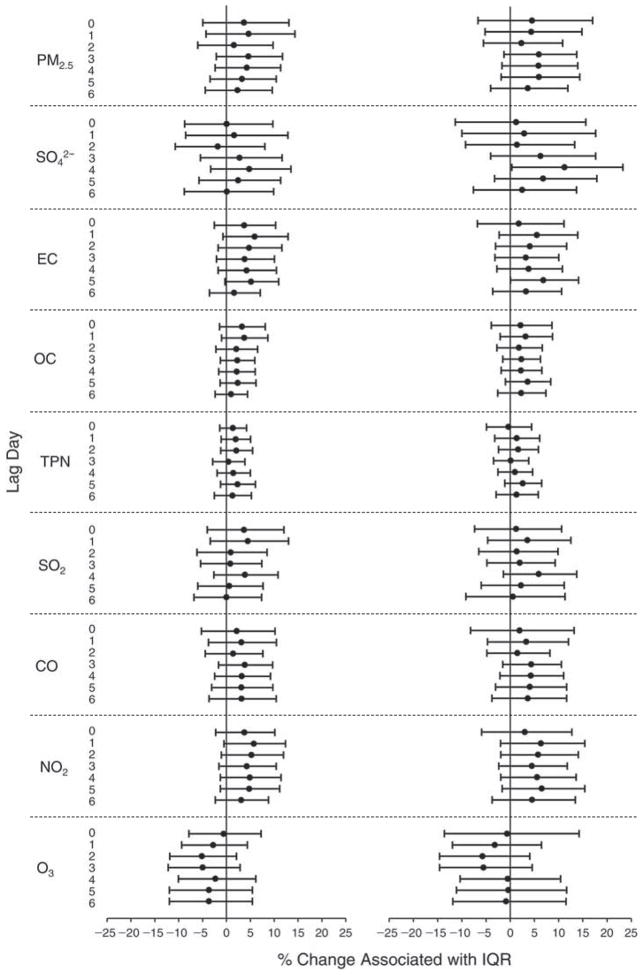
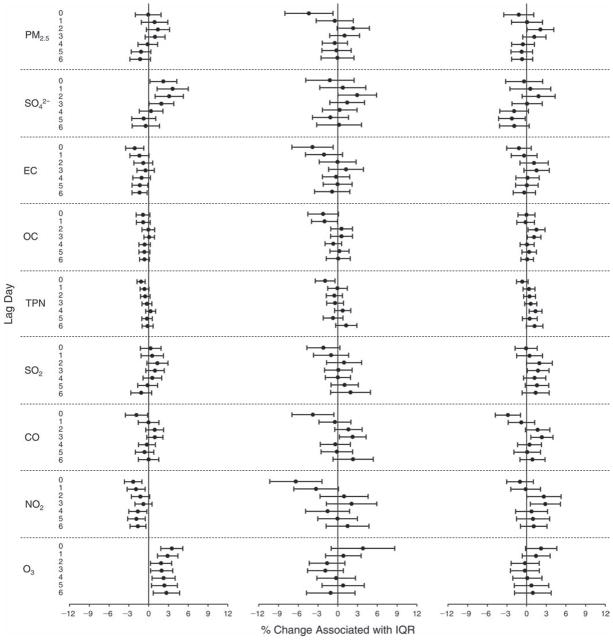
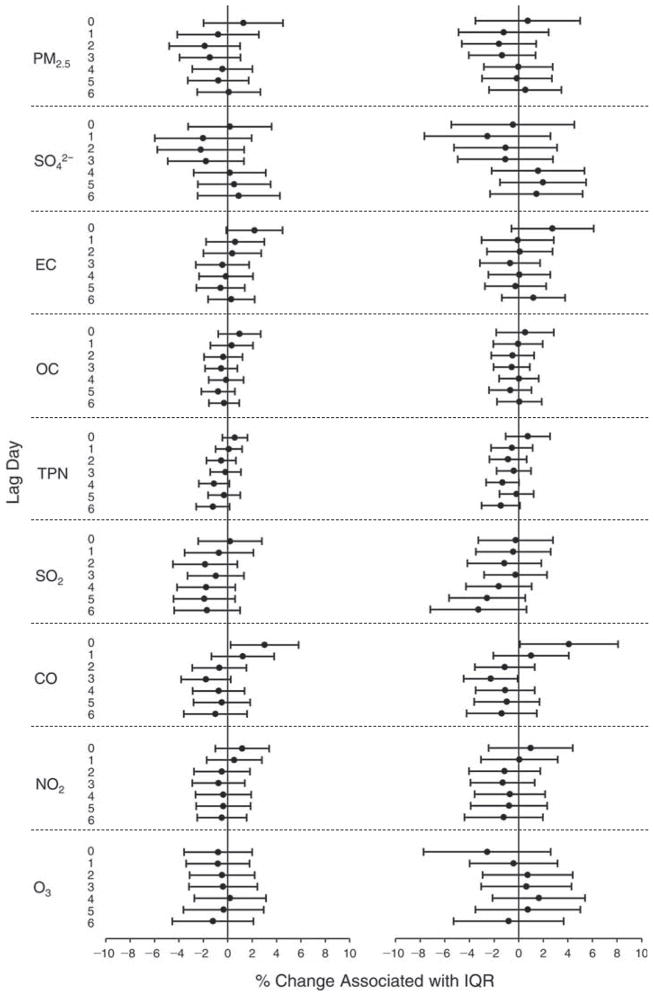
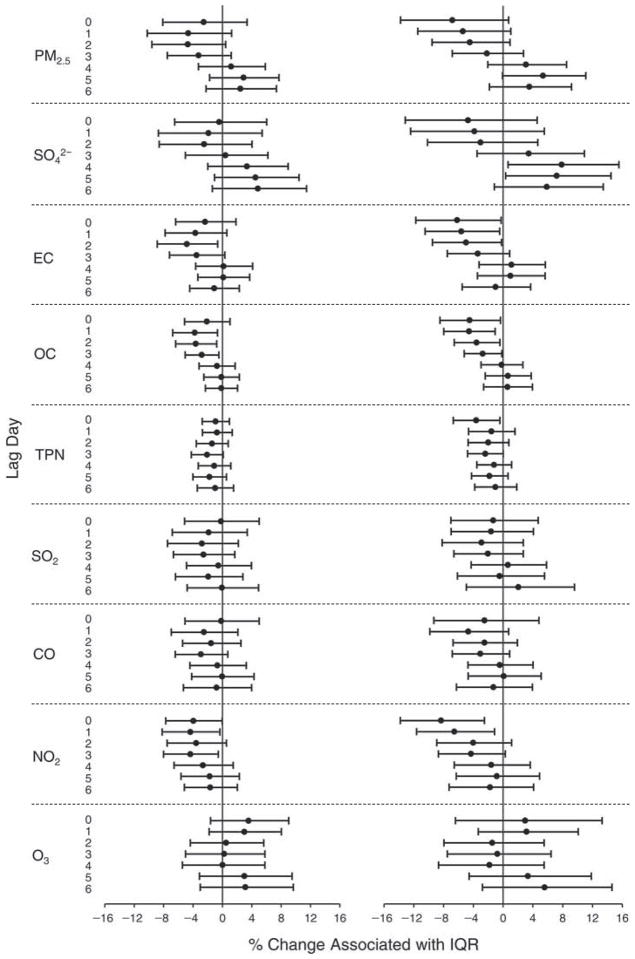
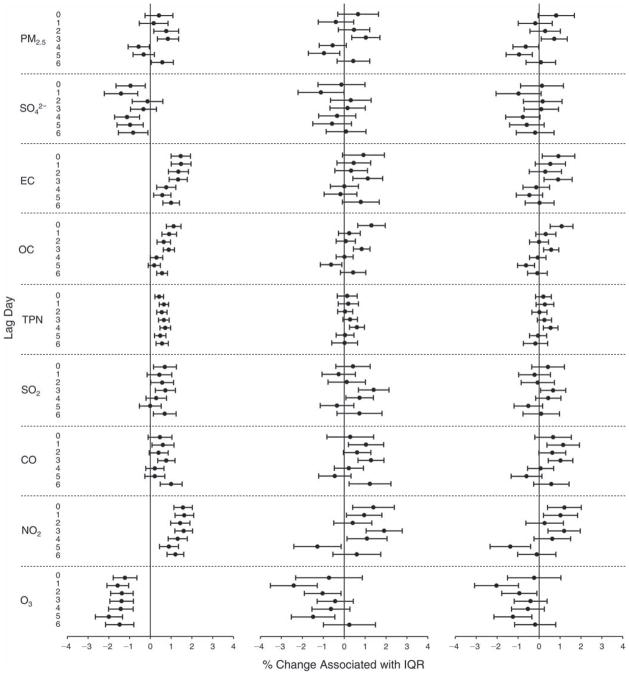
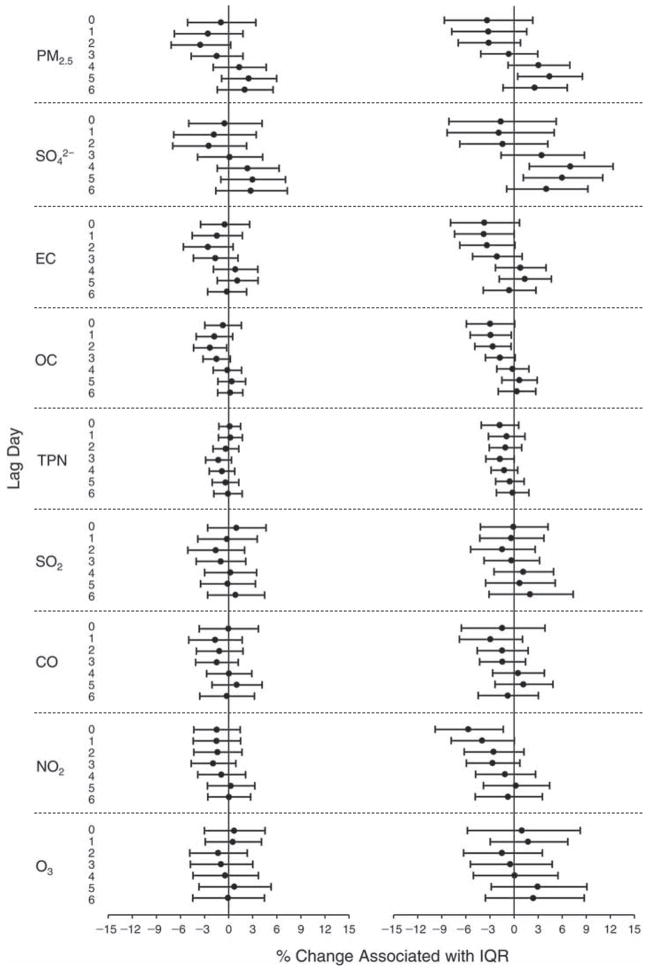
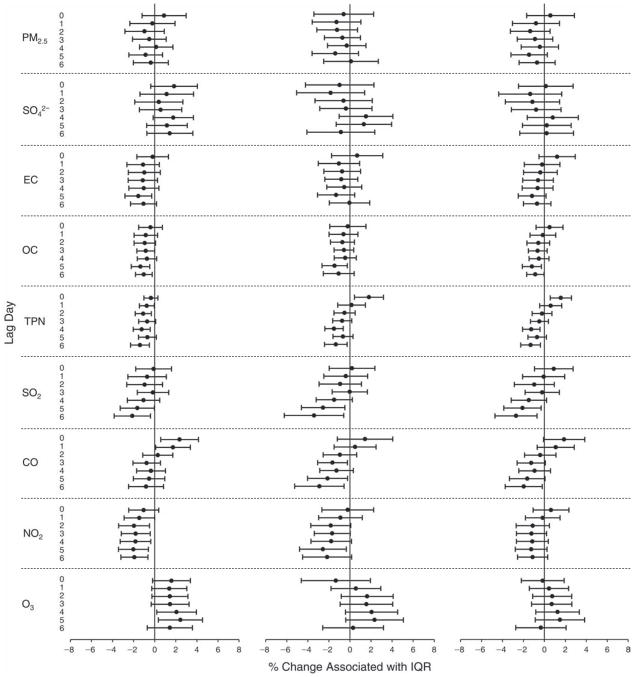
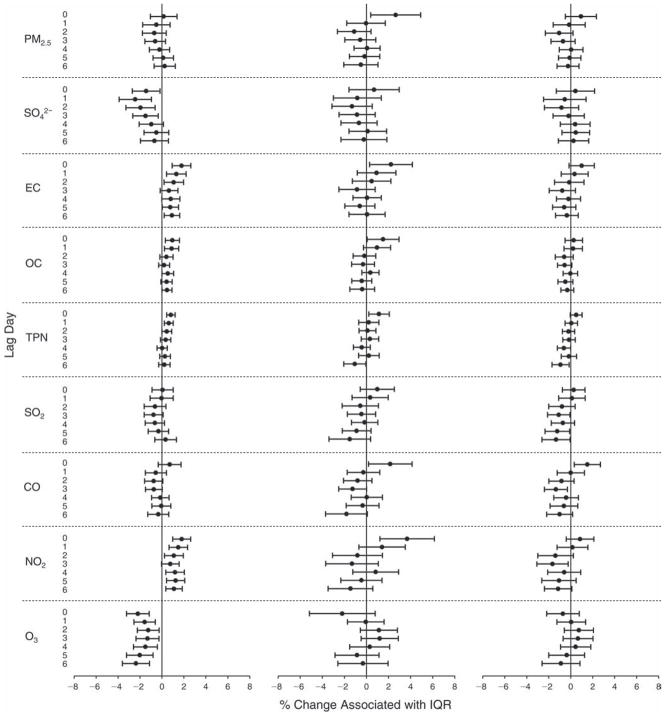
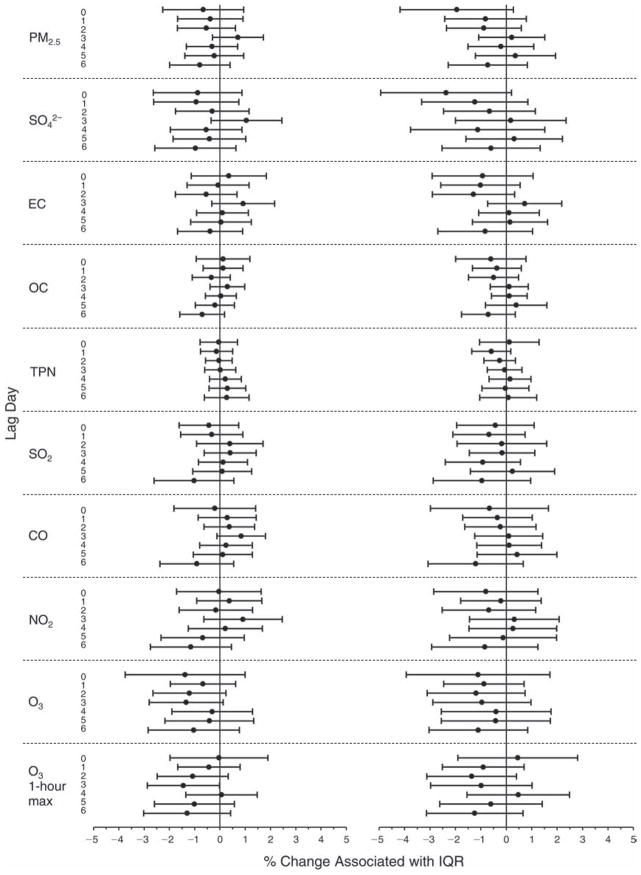
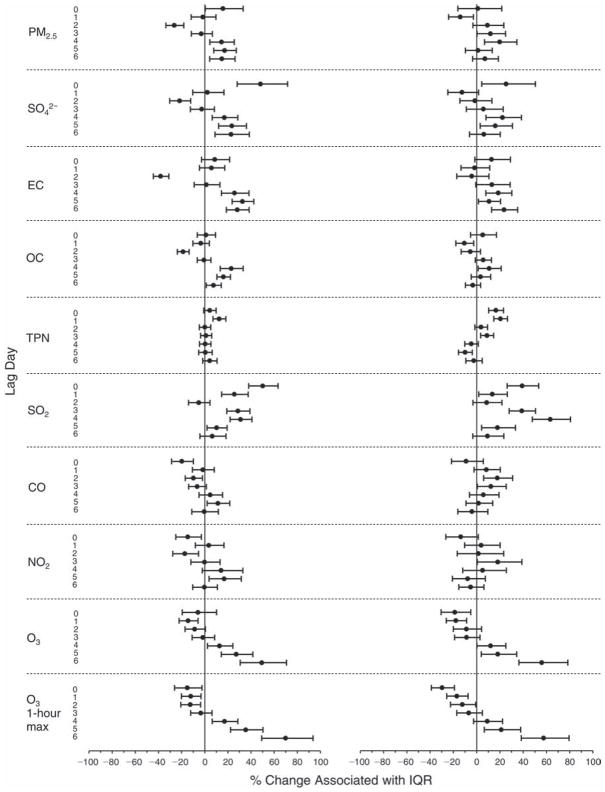
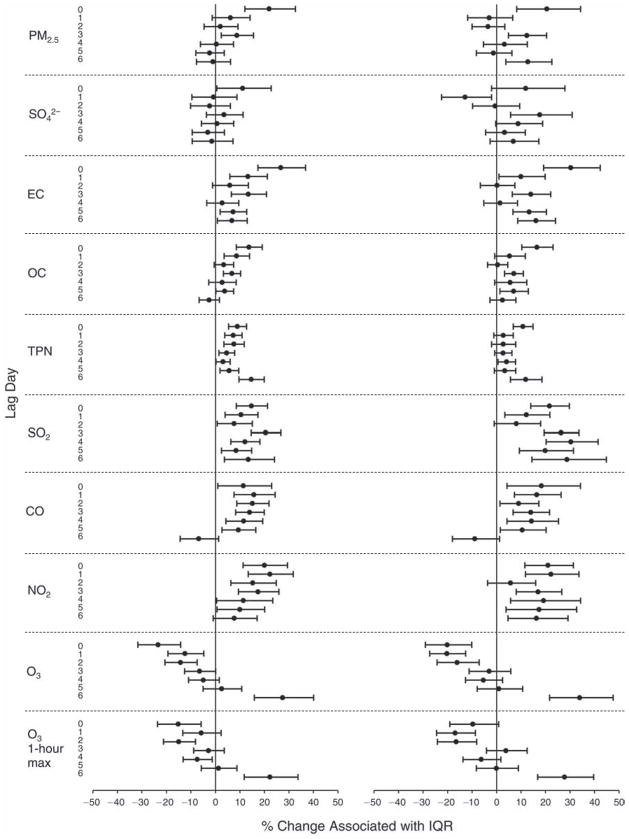
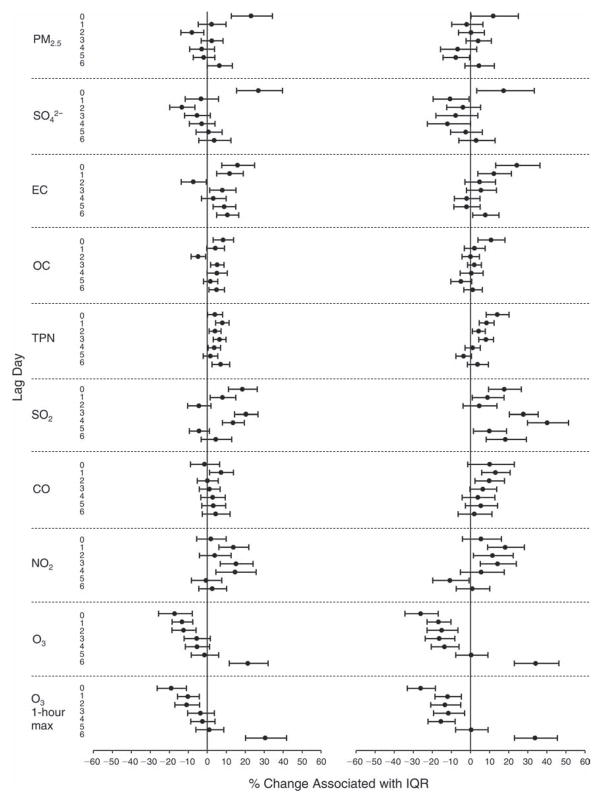
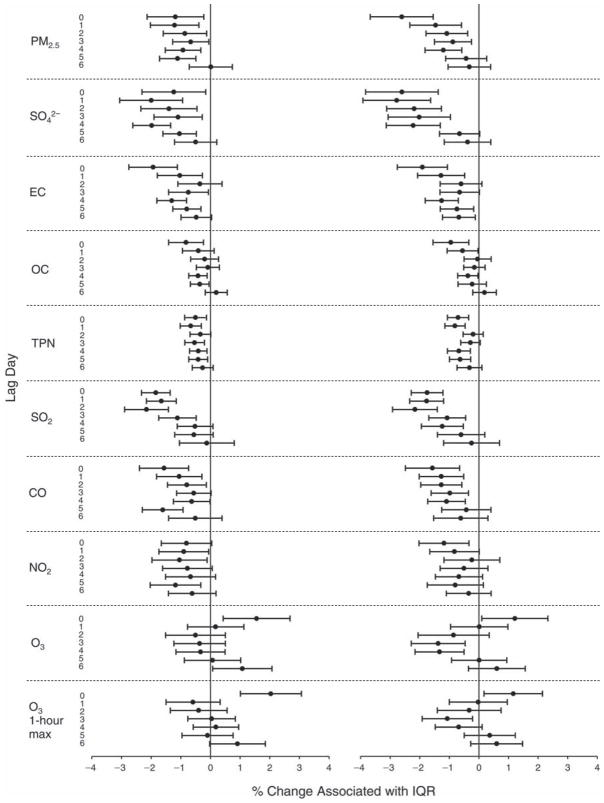
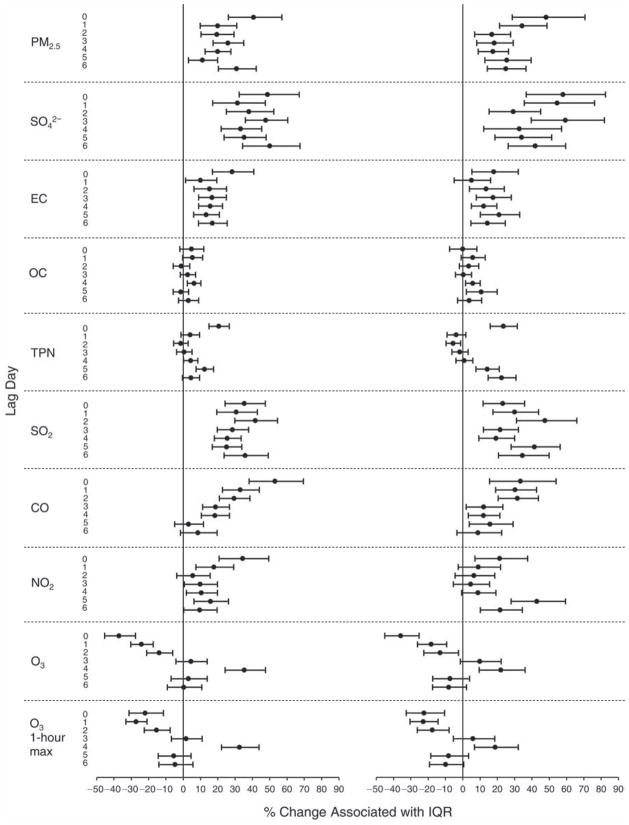
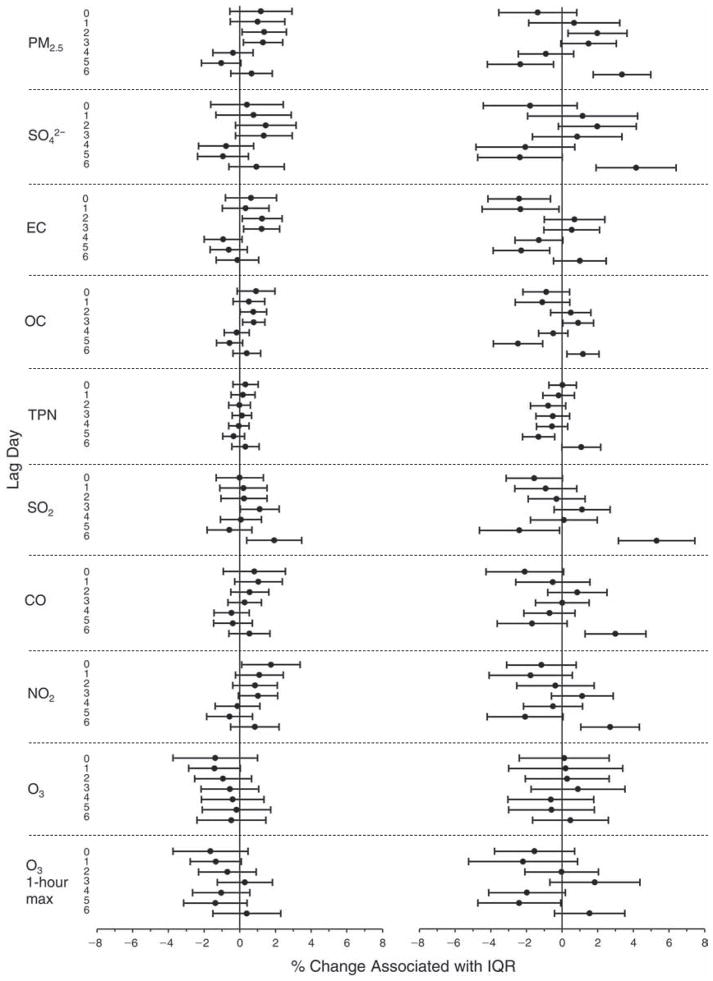
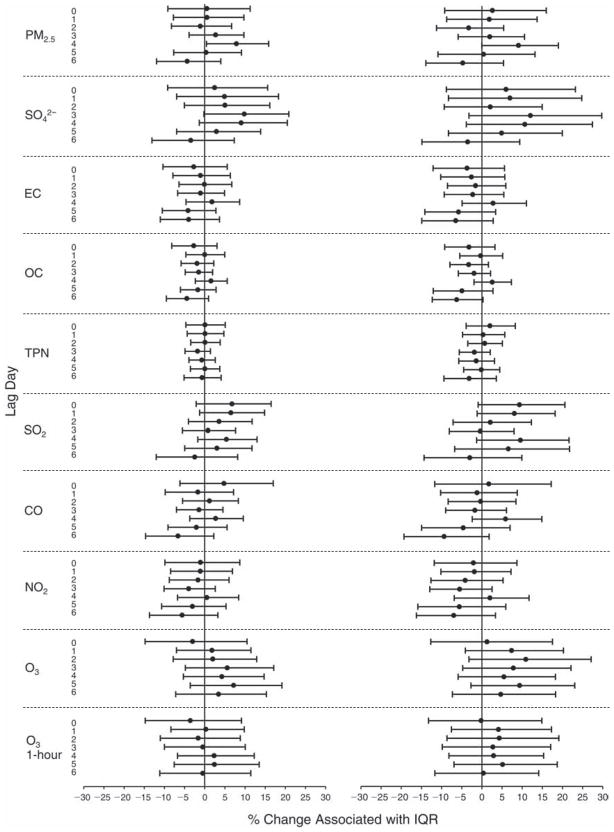
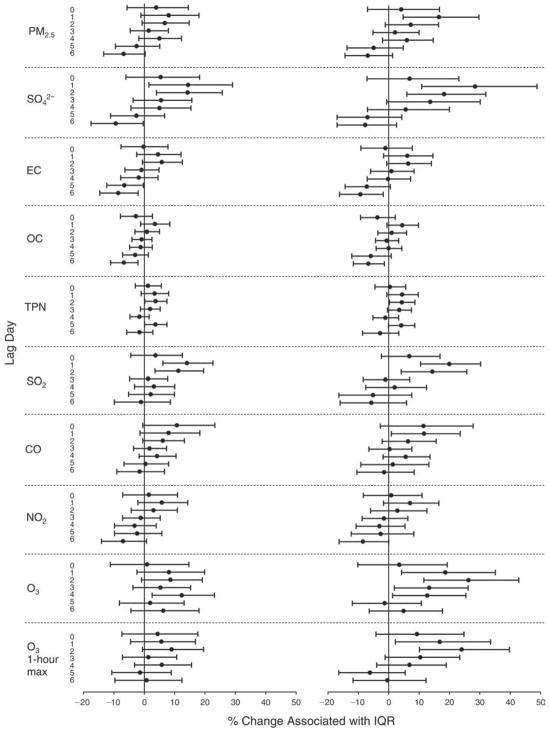
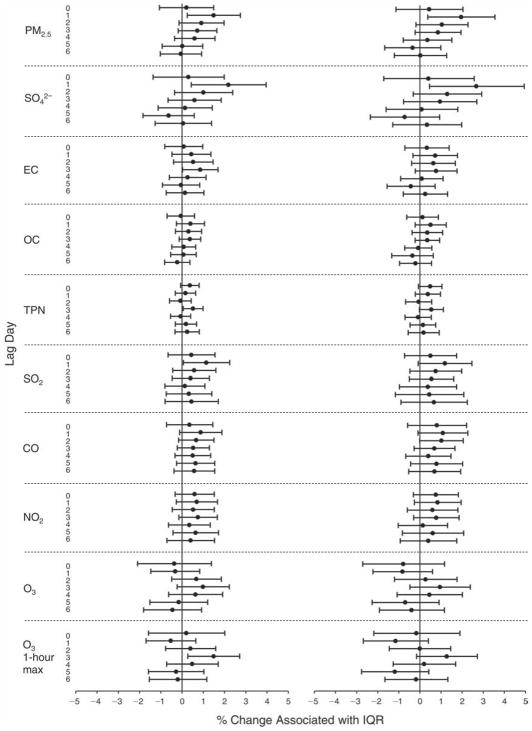
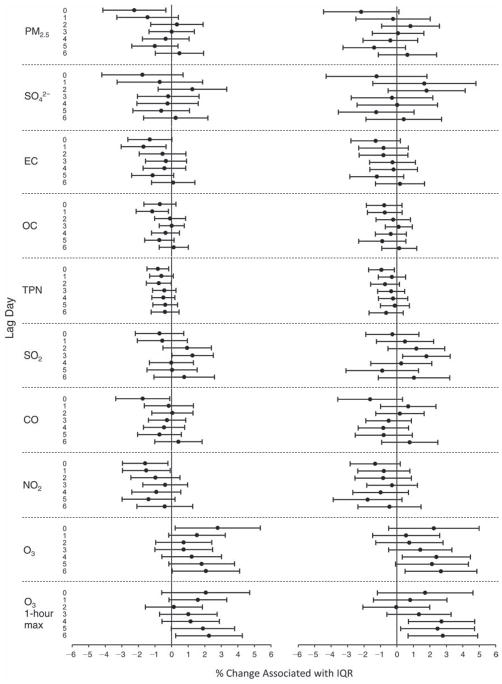
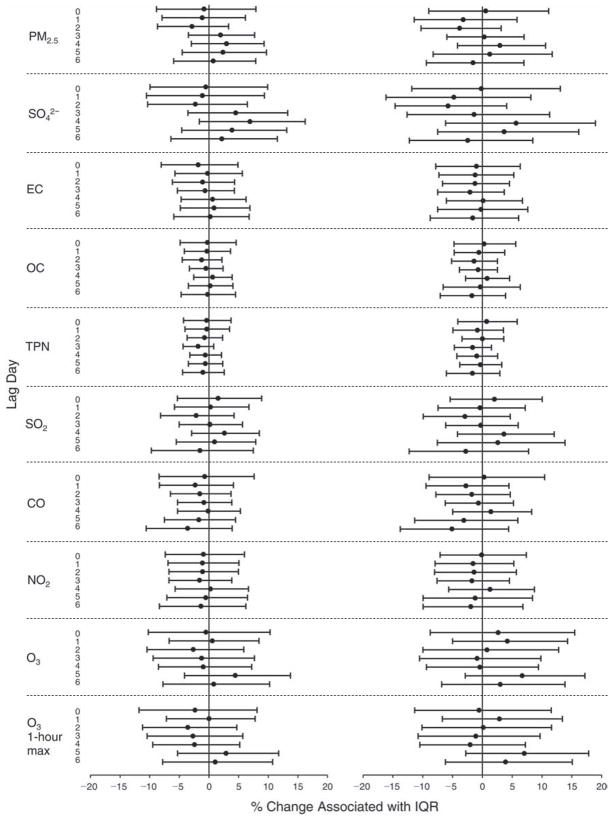
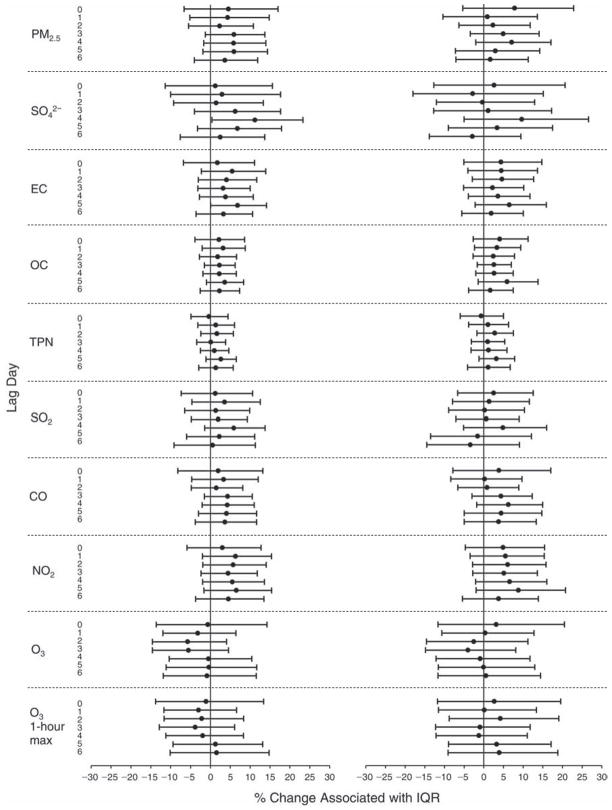
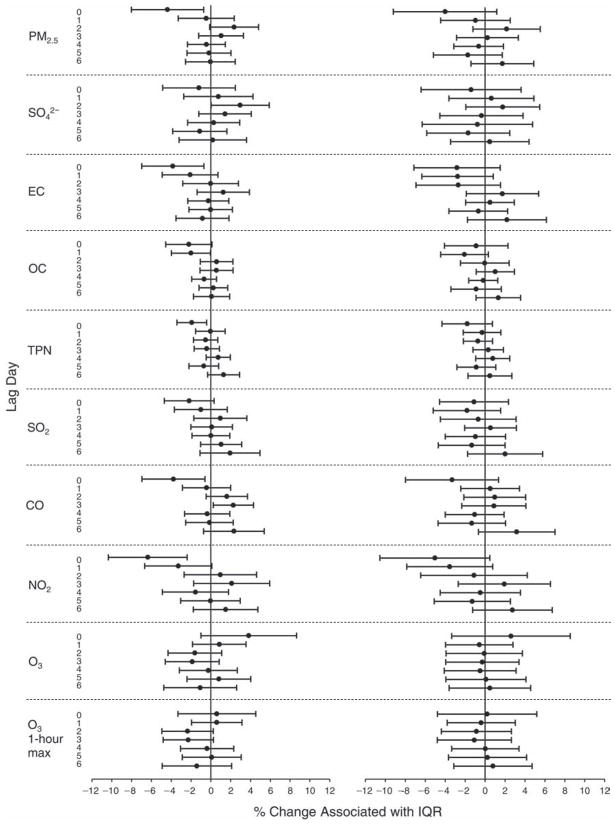
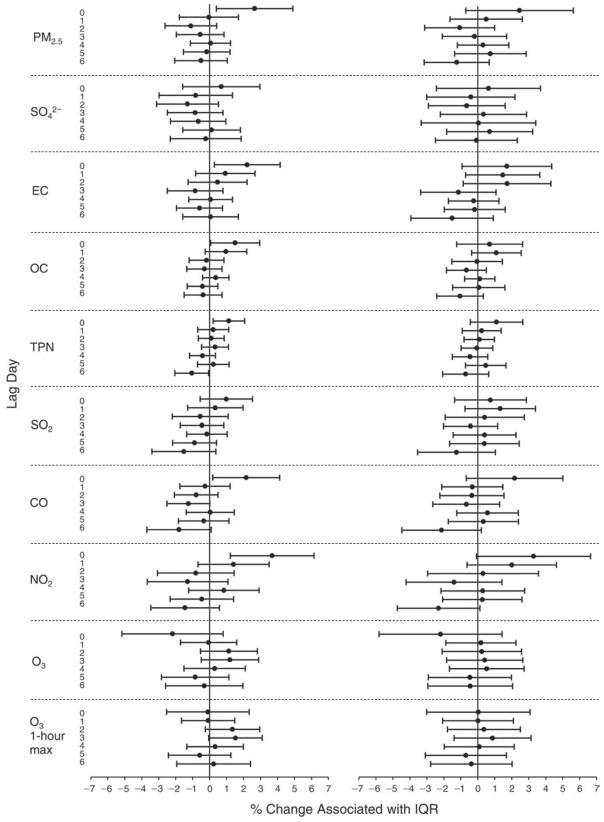
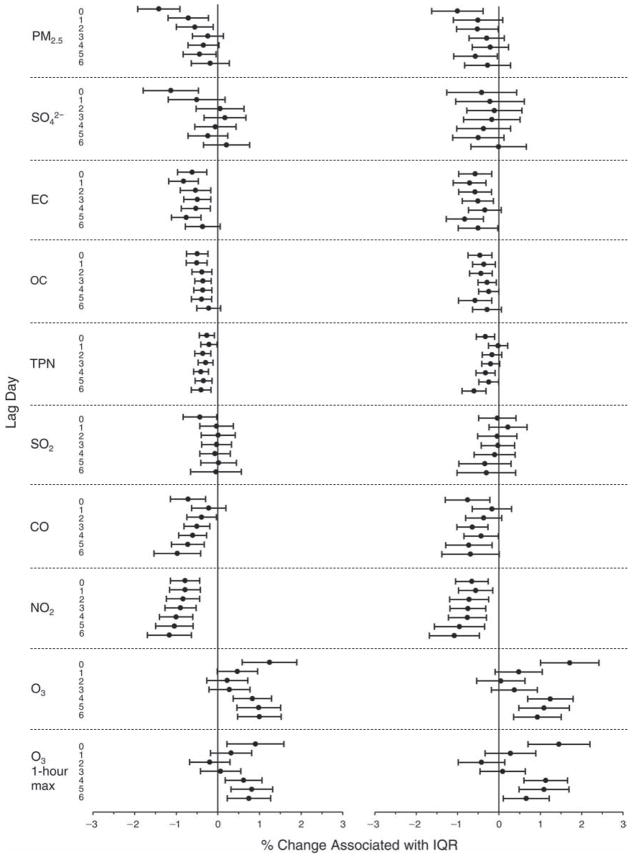
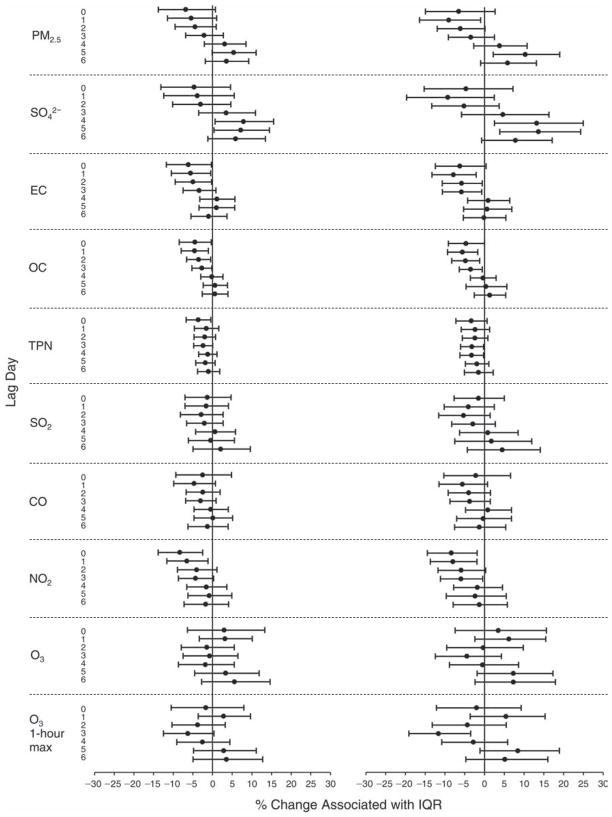
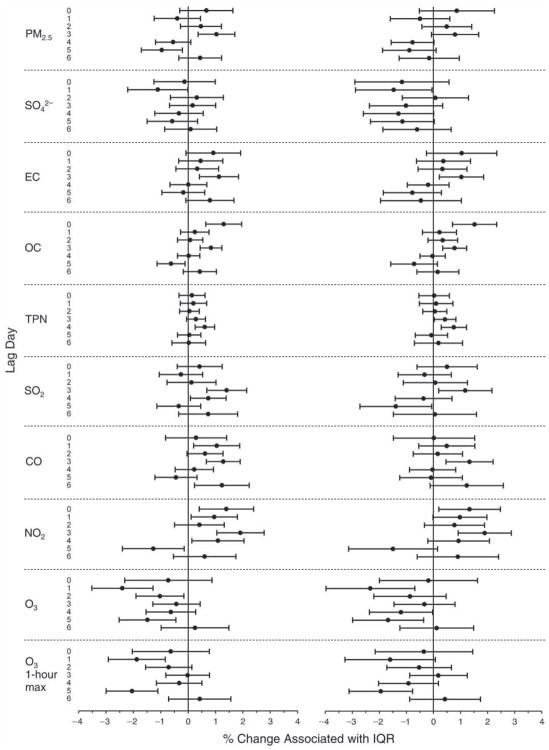
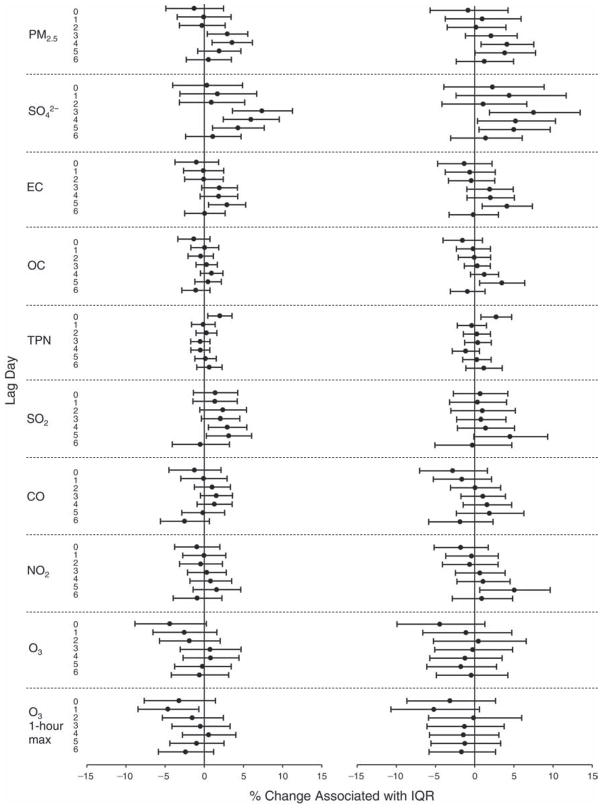
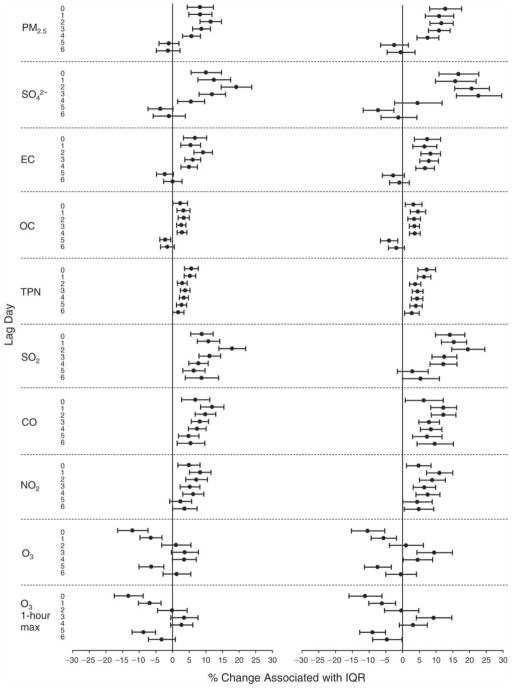
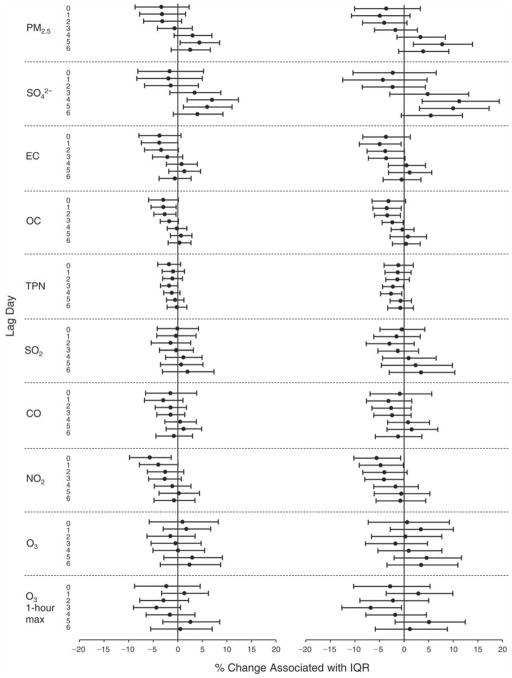
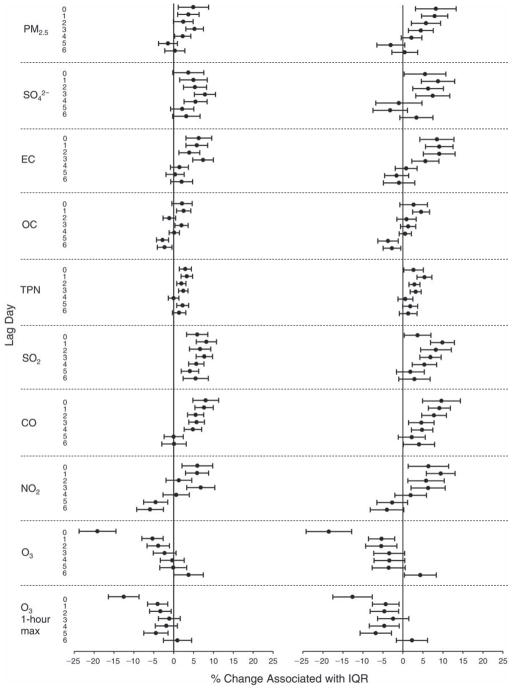
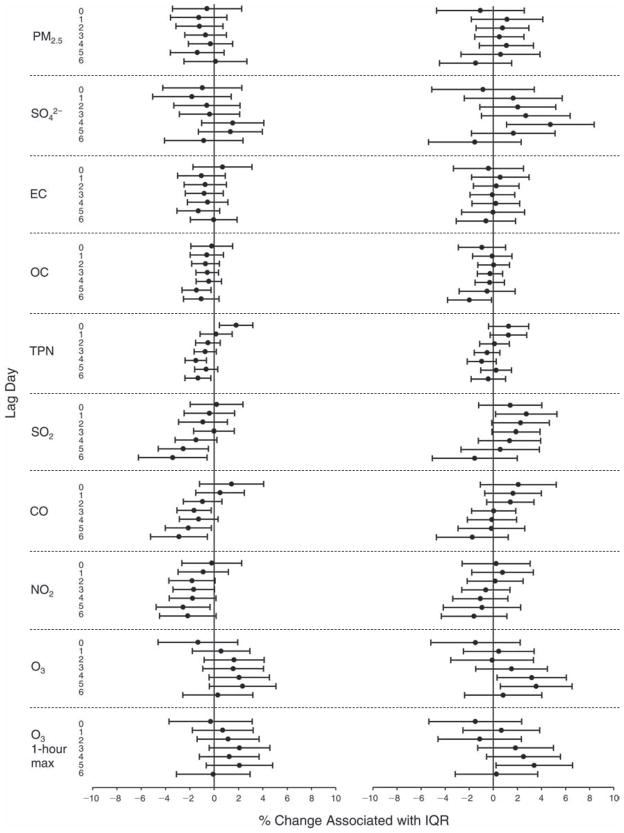
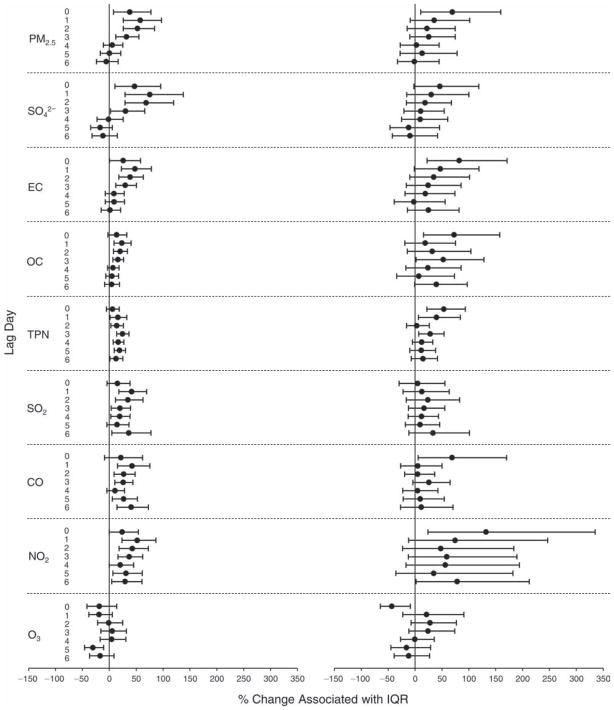
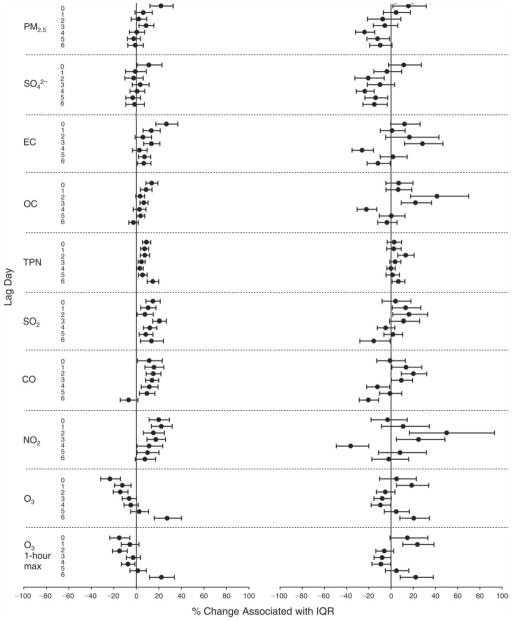
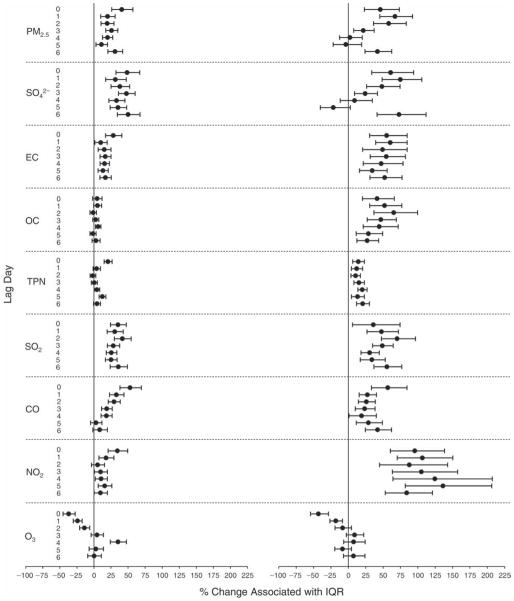
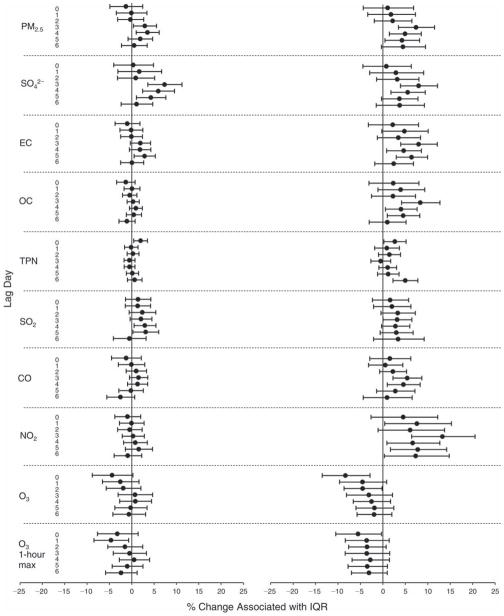
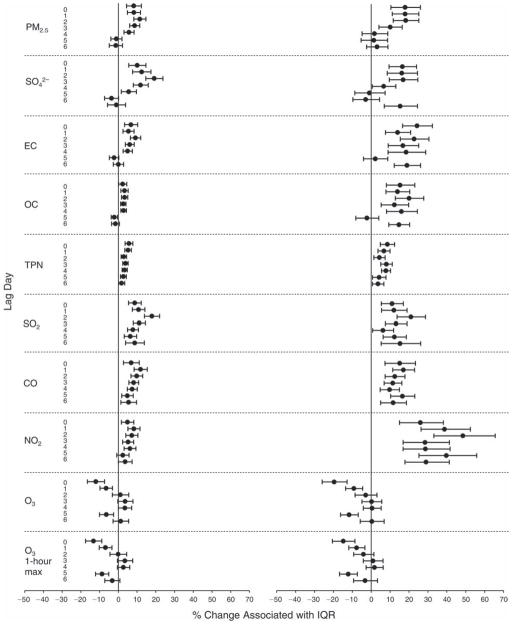
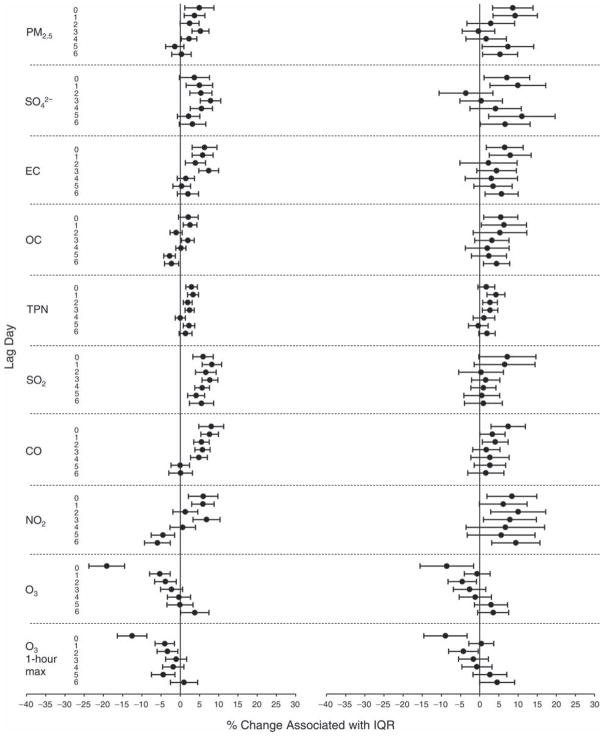
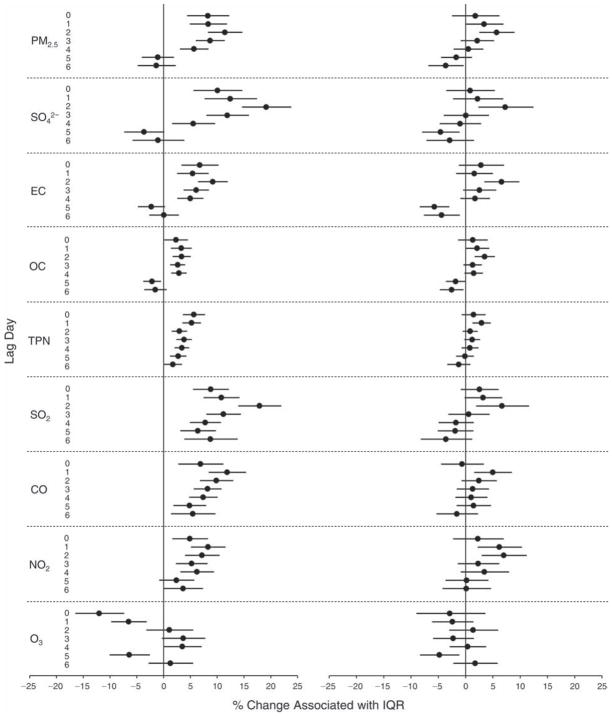
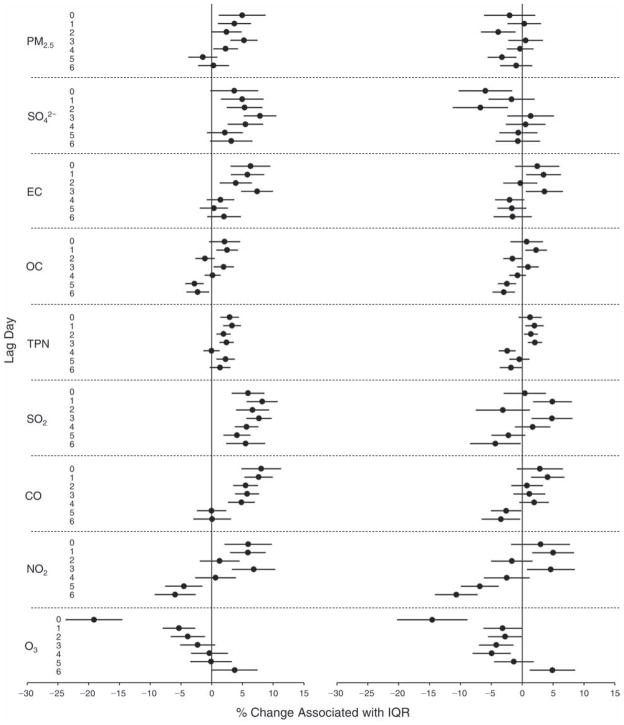
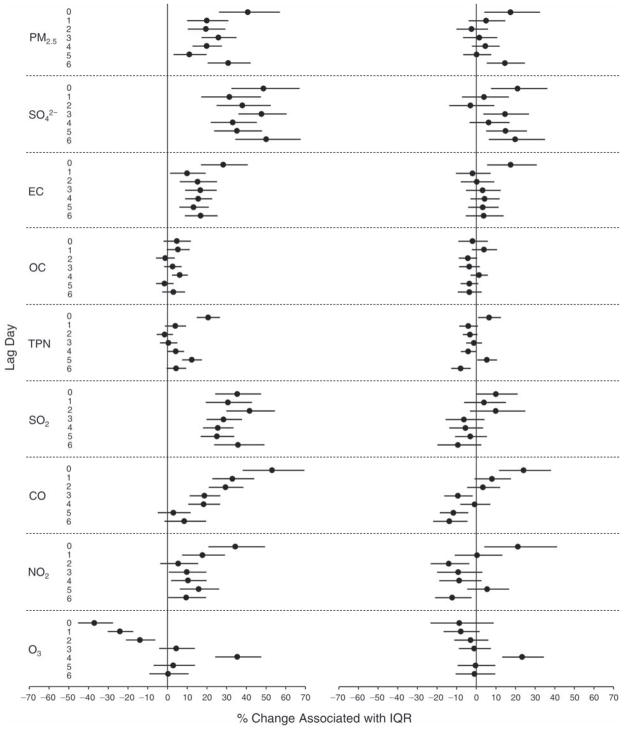
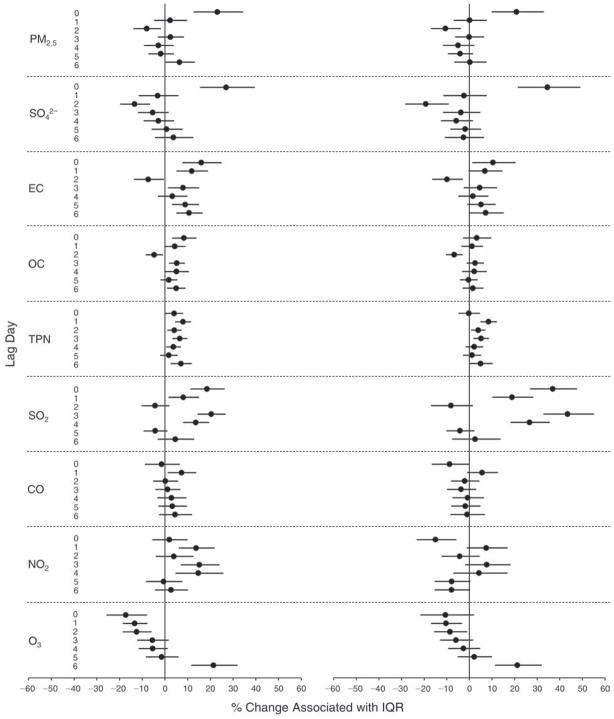
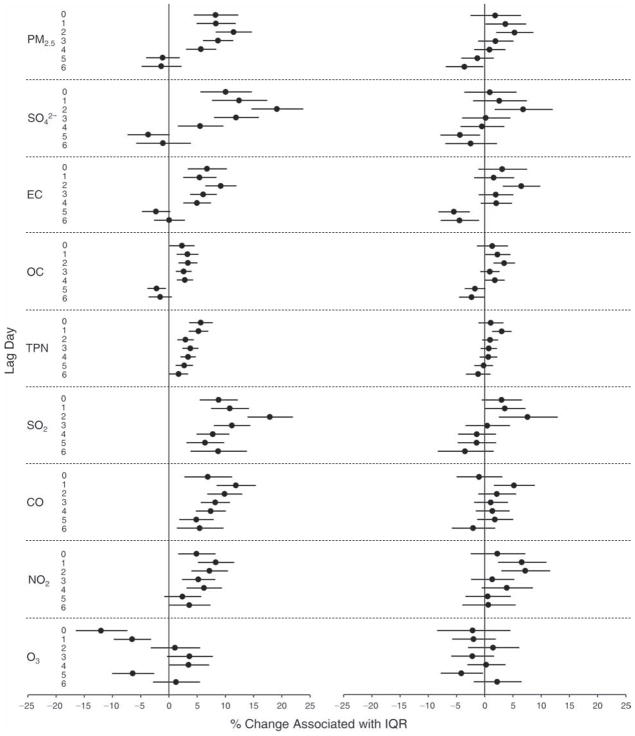
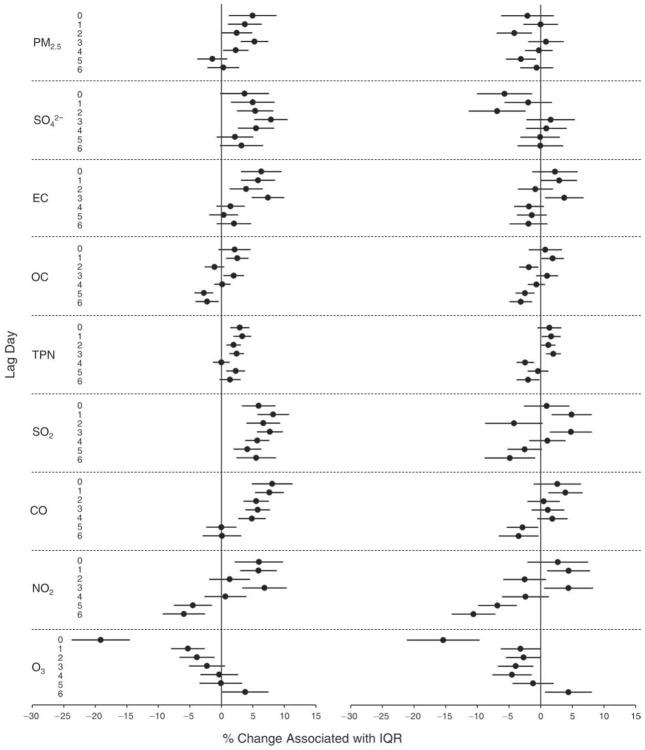
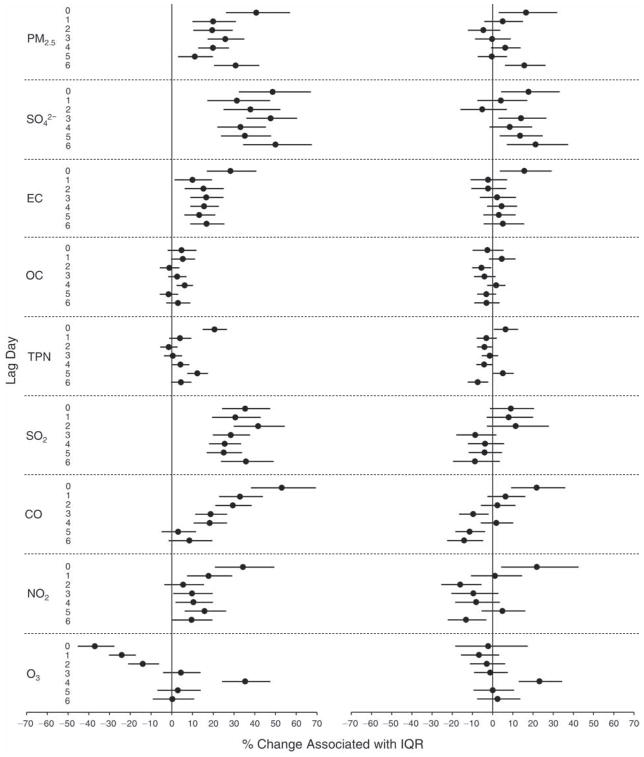
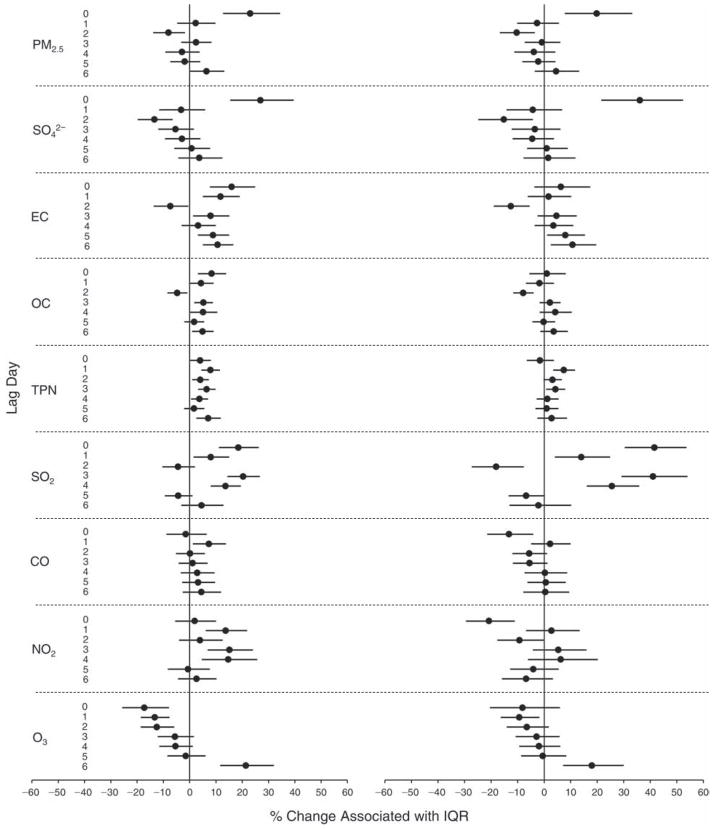
We evaluated the relationship between a biomarker and a pollutant across the entire study period (including the pre-, during-, and post-Olympics periods). Pollutant concentrations were measured 1 to 7 days before biomarker measurements were taken (referred to as lag day 0 to lag day 6). We examined the associations, while controlling for temperature, RH, and day of the week for biomarker measurement, by adding the pollutant concentrations to the mixed linear models described above (but without period indicators). Specifically, analyses examined adjusted associations between average biomarker levels and pollutant concentrations averaged over the last 24 hours (lag 0), 24 to 48 hours (lag 1), 48 to 72 hours (lag 2), and so on, up to a 7-day lag (lag 6). For all pollutant–biomarker combinations, we created “lag plots” representing the change in biomarker level associated with one interquartile range (IQR) increase in pollutant for lags 0 through 6. These lag plots were a series of single-lag models. Because some pollutants were correlated with others, we used two-pollutant models to examine whether the pollutant–biomarker associations from the single-pollutant analyses were consistent with the effects of that pollutant when controlling for another pollutant. These double-pollutant models included only one lag for each pollutant — the lag demonstrating the strongest statistical significance.
Measurements of EBC nitrite, EBC nitrate, FeNO, and all the HRV variables were log-transformed before being analyzed in the linear models, because the values of these biomarkers were right-skewed. In all analyses, biomarker outliers (identified as those at least 3 standard deviations away from the mean) were eliminated from the modeling. The identification of outliers was done after the biomarker values were log-transformed. Only a very small number of data points were removed for only a few biomarkers. For example, out of a total of 748 observations, 1 RBC value (0.1%) and 9 fibrinogen values (1.2%) were identified as outliers. None of the log-transformed biomarkers had outliers.
Dichotomized Analyses
The distributions of CRP and EBC 8-isoprostane concentrations were highly skewed with a large percentage of nondetectable values. Hence, analyses for these biomarkers should be considered exploratory and differ somewhat from those described above. Specifically, we dichotomized the biomarker levels based on data distribution into detectable or nondetectable categories, or into the first 75th percentile of the entire data set and the last quarter.
We tested period and pollutant effects for these dichotomized biomarkers using hierarchical logistic regression (with random effects for subject), controlling for temperature and RH via natural splines, as described above, for the mixed linear models as well as sex and day of the week. In the period comparison (e.g., pre-Olympics period vs. during-Olympics period), we assessed the fraction of the samples above the detection limit for both biomarkers. However, we assessed pollutant–biomarker associations only for EBC 8-isoprostane, because the low “clinic-grade” quality of the CRP data meant they were not useful for any further exploration in sophisticated models. We created lag plots to display the percent change in odds ratios for getting a “higher” (above the 75th percentile) value of 8-isoprostane associated with one IQR increase in pollutant level.
Additional details of the statistical models and sample programming codes are provided in Appendix G.
Sensitivity Analyses
We conducted sensitivity analyses to evaluate the robustness of our models to the adjustments for meteorologic parameters (temperature, RH, and rainfall). In one set of sensitivity analyses, we removed temperature and/ or RH if they were not statistically significant predictors of a change in biomarker level, as well as their moving averages, from multivariate analyses examining the effect of single pollutants on the biomarkers. We plotted the effect estimates from these analyses and compared them with the results from the models including both variables. Next, when using the single-pollutant models, we excluded observations made on days that had greater than 1 mm of precipitation. Finally, while the pre- and during-Olympics periods were during the summer, the post-Olympics period occurred during the autumn, which could have led to some differences in biomarker levels as well as possible residual confounding by unmeasured factors, other than meteorologic factors, that varied across periods. Although subjects whose lifestyles remained relatively stable across the time periods were deliberately chosen, many factors may have varied between periods. For example, there may have been different levels of infections and allergens in circulation or changes in overall behavior, such as time spent outdoors, between periods. While the inclusion of the moving averages of temperature and RH was meant to capture some of this variation, it is possible that we did not catch all of the residual confounding by season. Thus, we conducted two additional sets of analyses to further account for possible confounding by season or period. First, we reanalyzed the pollutant–biomarker relationships while excluding all post-Olympics period observations. Second, we studied within-period effects of the single pollutants by including period indicators as covariates. These sets of analyses were conducted for several biomarkers that showed statistically significant and consistent effects in the main (original) analyses.
We also conducted sensitivity analyses on the two-pollutant models, which were designed to assess the robustness of the estimates associating individual pollutants with the biomarkers. As described above, in the main analysis, we chose the lags with the lowest P values for each pollutant to include in the double-pollutant analysis in order to maximize the amount of variation in the biomarkers that would be accounted for by the added secondary pollutant. However, because pollutant levels on the same day tended to be more correlated and hence might pose more of a confounding problem, we conducted copollutant models in which the lag for the second pollutant was the same as the selected lag for the main pollutant of interest.
Finally, the use of random rather than fixed subject effects (or conditioning on the subject’s overall mean outcome) is debatable, because it requires drawing some information from between (rather than only within) subjects, which is open to confounding by individual time-invariant risk factors. For this reason, we conducted another set of sensitivity analyses for selected biomarkers in which we included fixed rather than random subject effects.
RESULTS
CHARACTERISTICS OF AIR POLLUTION
Concentrations of Air Pollutants Before, During, and After the Olympics
We measured concentrations of PM2.5 and a large number of PM2.5 chemical constituents (as shown in Tables A.1–A.3). Because of time and resource constraints, we focused on selected pollutants in our analysis of relations between biomarkers and pollutants.
Concentrations for these selected pollutants are summarized in Table 4. The table includes results for PM2.5 mass, SO42−, EC, and OC, as well as results for TPN (i.e., number concentrations of all particles in the size range between 13 nm–764.7 nm) and the gaseous pollutants SO2, CO, NO2, and O3.
Table 4.
Air Pollutant Statistics by Period Based on Time-Series Modela
| Air Pollutants | Pre-Olympics |
During Olympics |
Post-Olympics |
Period Difference |
||||
|---|---|---|---|---|---|---|---|---|
| n | Mean ± SE | n | Mean ± SE | n | Mean ± SE | During – Pre Mean (95%CI) | Post – During Mean (95%CI) | |
| SO2 (ppb) | 35 | 7.45 ± 1.17 | 24 | 2.97 ± 1.33 | 32 | 6.81 ± 1.22 | −4.48 (−7.94 to −1.02)b | 3.84 (0.31 to 7.37)b |
| NO2 (ppb) | 35 | 25.60 ± 3.66 | 33 | 14.61 ± 3.76 | 32 | 41.39 ± 3.81 | −10.99 (−21.26 to −0.71)b | 26.78 (16.29 to 37.26)c |
| O3 (ppb) | 35 | 31.84 ± 3.75 | 33 | 39.60 ± 3.85 | 32 | 15.12 ± 3.91 | 7.75 (−2.78 to 18.29) | −24.48 (−35.24 to −13.72)c |
| O3 max (ppb) | 35 | 66.47 ± 7.10 | 33 | 80.23 ± 7.30 | 32 | 42.20 ± 7.41 | 13.76 (−6.19 to 33.71) | −38.03 (−58.42 to −17.65)c |
| CO (ppm) | 35 | 1.23 ± 0.13 | 33 | 0.64 ± 0.14 | 32 | 0.81 ± 0.14 | −0.59 (−0.97 to −0.22)b | 0.17 (−0.21 to 0.56) |
| PM2.5 (μg/m3) | 35 | 98.9 ± 14.7 | 33 | 71.9 ± 15.1 | 32 | 85.3 ± 15.3 | −27.0 (−68.3 to 14.3) | 13.3 (−28.8 to 55.5) |
| EC (μg/m3) | 35 | 2.2 ± 0.3 | 28 | 1.4 ± 0.3 | 31 | 3.4 ± 0.3 | −0.80 (−1.7 to 0.1) | 1.9 (1.0 to 2.8)c |
| OC (μg/m3) | 35 | 8.8 ± 1.6 | 28 | 6.8 ± 1.7 | 31 | 15.0 ± 1.7 | −1.97 (−6.6 to 2.6) | 8.2 (3.5 to 12.9)c |
| SO42− (μg/m3) | 35 | 26.5 ± 5.8 | 28 | 23.0 ± 6.4 | 29 | 13.7 ± 6.2 | −3.5 (−20.4 to 13.5) | −9.3 (−26.7 to 8.1) |
| TPN (/m3) | 35 | 16,480 ± 1276 | 30 | 12,853 ± 1389 | 30 | 19,477 ± 1367 | −3627 (−7323 to 70) | 6624 (2804 to 10443) |
TPN indicates total particle number ranging from 13 nm to 764.7 nm; O3 max is the maximum 1-hr average concentration within a 24-hr period. All samples were above the detection limit.
P < 0.05.
P < 0.01.
Mean and median concentrations of PM2.5 mass and constituents in the during-Olympics period decreased markedly from their respective pre-Olympics levels (see Table 4 for mean concentrations and Table P.1 in Appendix P for median concentrations using raw data). Similar findings were observed for the gaseous pollutants except for O3 (see Tables 4 and P.2). Both the 24-hour average and the 1-hour maximum for O3 had higher mean and median concentrations in the during-Olympics period than in the pre-Olympics period. The mean concentrations were associated with large standard deviations (SDs) and IQRs even within a single period (data not shown), indicating large day-to-day variations both within each period and across the three periods.
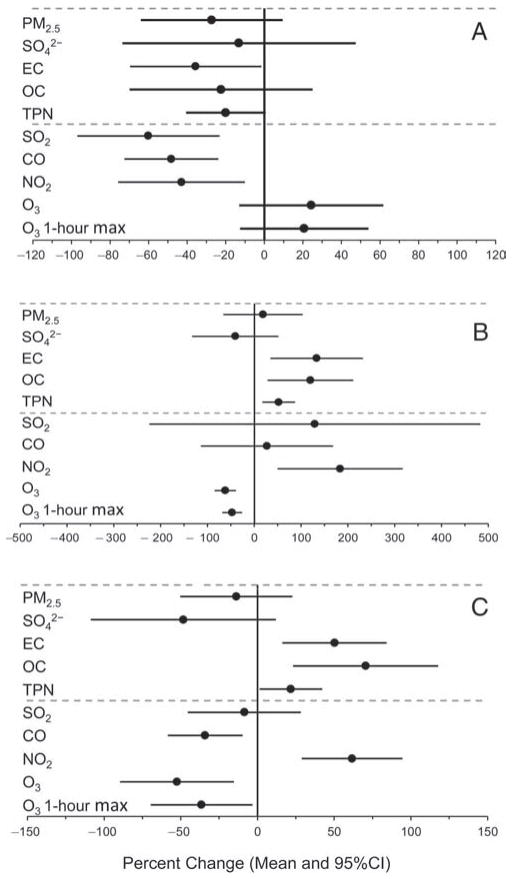
Using a time-series regression approach described in the previous section, “Statistical Methods and Data Analysis,” we computed the means and 95% confidence intervals for between-period percent changes in pollutant concentrations, plotted in Figure 6. As shown in Figure 6A, mean concentrations of the following pollutants were significantly reduced in the during-Olympics period compared with those in the pre-Olympics period: EC, 36% reduction; TPN, 22% reduction; SO2, 60% reduction; CO, 48% reduction; and NO2, 43% reduction. Mean PM2.5 concentration was reduced by 27%, but the upper limit of the 95% CI was a 9% increase. Two constituents of PM2.5 —SO42− and OC — each had a reduction in mean concentration but a wide 95% CI crossing zero. Both 24-hour average and 1-hour maximum concentrations of O3 increased from pre- to during-Olympics periods, as did ambient temperature (data not shown).
Figure 6. Estimated means and 95% confidence intervals for percent changes in air pollution levels.
A: from the pre-Olympics to the during-Olympics period; B: from the during-Olympics to the post-Olympics period; and C: from the pre-Olympics to the post-Olympics period. The estimates were based on time-series regression models.
The post-Olympics period encompassed early autumn in Beijing; thus mean temperature for this period (16.8°C) was lower than that for the pre-Olympics period (25.1°C) and the during-Olympics period (27.7°C), and mean RH was lower for the post-Olympics period (48.6%) compared with the pre-Olympics period (66.6%) and the during-Olympics period (64.8%) (data not shown). In the post-Olympics period, we observed increases in mean concentrations for all the pollutants except SO42− and O3 (Figure 6B) relative to the during-Olympics mean concentrations, although the changes were not statistically significant for PM2.5, SO2, and CO.
There were no significant differences between post-Olympics and pre-Olympics mean concentrations for PM2.5 and SO2. Mean concentrations of SO42−, CO, and O3 were lower in the post-Olympics period, whereas mean concentrations of EC, OC, TPN, and NO2 were higher in the post-Olympics period (Figure 6C).
Particle Size Distribution
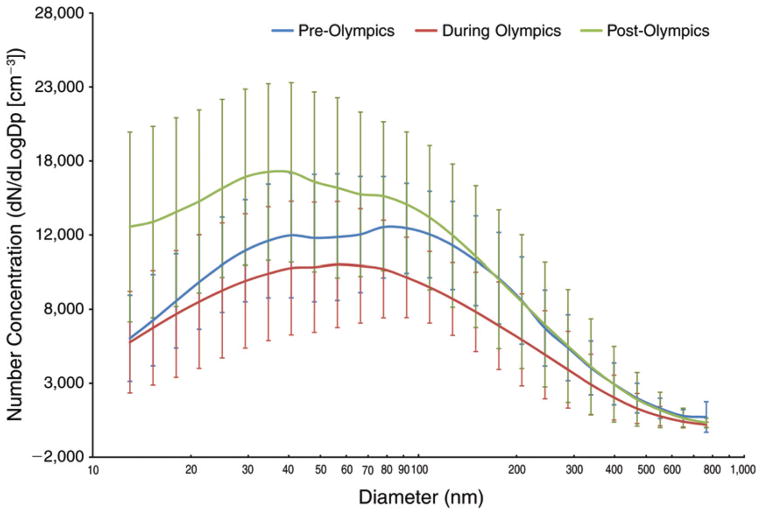
Using 26 bins spanning from 13 nm to 764.7 nm in size, the TDMPS measured particle number concentrations, which can be used to determine particle number size distribution. We used the common plotting technique to present particle size distributions, specifically, comparing log-transformed number concentrations normalized by particle diameter to particle diameters (on a log scale) within a specific size bin. As shown in Figure 7, we compared particle size distributions by period (pre-, during-, and post-Olympics) using the period means based on daily concentrations of particles in each of the 26 size bins. We observed the following: (1) the during-Olympics period had the lowest mean particle concentrations in all size bins; (2) the post-Olympics period had the highest number concentration for particles with a diameter <56 nm compared with the other two periods; (3) differences in particle mean concentration between the pre- and the during-Olympics period were largest when the diameters were in the range of 108 nm to 127 nm; (4) the highest particle number concentrations were for particles in the 66.4–78.1 nm size bins in the pre-Olympics period, 47.9–56.4 nm bins in the during-Olympics period, and 29.4–34.6 nm bins in the post-Olympics period; and (5) overall, as expected, larger-size particles (closer to 764.7 nm) had substantially lower number concentrations.
Figure 7. Number-based particle size distribution by period, showing means and standard deviation bars, based on 24-hour average data (10 AM to ~10 AM next day).
Particle number concentrations were measured using a TDMPS system with 26 size bins within the overall size range from 13 nm to 764.7 nm.
Because particle mass concentrations have been commonly used in previous PM health effects studies and are currently used in health-based regulatory standards, it is useful to understand particle size distribution by mass (in addition to distribution by number). For this reason, we estimated the mass median particle diameter for each of the three periods, by calculating volume concentrations with the assumption that all particles in a size bin were spheres with the diameter equal to the lower end of the size bin range. Then we obtained mass concentrations by assuming all particles had a density of 1 g/cm3. We then plotted the cumulative percentage of mass concentrations as a function of particle diameter (using the lower end of each size bin, on a log scale) (see Figure 8). Based on these plots derived from period-specific means, the estimated mass median particle diameters were 423 nm for the pre-Olympics period, 363 nm for the during-Olympics period, and 381 nm for the post-Olympics period.
Figure 8. PM size distribution plot used to calculate the mass median particle diameter for each of the three periods.
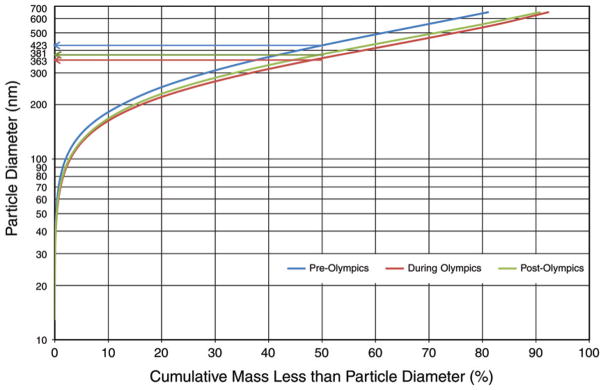
The mass concentrations of the 26 size bins were calculated for each of the three Olympic periods (the particle density was assumed to be 1 g/cm−3). The cumulative percent mass less than the diameter on the lower side of each size bin was calculated and then plotted versus the diameter.
PM2.5 Composition
We measured the following PM2.5 species: 9 water-soluble ions (NH4+, Na+, K+, Mg2+, Ca2+, SO42−, NO3−, F−, and Cl−), 14 PAHs (acenaphthylene, fluorine, phe-nanthrene, fluoranthene, pyrene, benzo[a]anthracene, chrysene, benzo[b]fluoranthene, benzo[k]fluoranthene, benzo[e]pyrene, benzo[a]pyrene, indeno[1,2,3-cd]pyrene, dibenzo[a,h]anthracene, and benzo[ghi]perylene), and 24 elements (Na, Mg, Al, P, K, Ca, Ti, V, Cr, Mn, Fe, Co, Ni, Cu, Zn, As, Se, Mo, Cd, Ba, Tl, Pb, Th, and U). Concentrations of these species (mass per cubic meter of air) are summarized by period in Appendix A.
Fractional contributions (%) of these species to total PM2.5 mass are presented by period in Figure 9. The OM fraction in PM2.5 increased from 13.1% in the pre-Olympics period to 17.3% in the during-Olympics period and further increased to 29.8% in the post-Olympics period. The EC fraction was similar in the pre-Olympics period (2.4%) and the during-Olympics period (2.5%) but was substantially higher in the post-Olympics period (5.4%). The SO42− fraction was similar in the pre-Olympics period (27.6%) and the during-Olympics period (28.4%) but was substantially lower in the post-Olympics period (12.0%). The pattern for NH4+ was the same as for SO42−: the pre-Olympics NH4+ fraction (17.9%) was similar to the during-Olympics fraction (15.6%) and higher than the post-Olympics value (7.8%). The NO3− fraction was similar in the pre-Olympics (17.8%) and the post-Olympics period (16.1%) and was lower in the during-Olympics period (11.5%). Other ions contributed a relatively small fraction to PM2.5 mass: 3.8%, 2.5%, and 5.0% in the pre-, during-, and post-Olympics periods, respectively. The PAH fraction in the pre-Olympics period (0.08%) was similar to that in the during-Olympics period (0.07%); the post-Olympics PAH fraction (0.04%) was lower. The fraction of transition metals was lowest in the during-Olympics period (0.8%) compared with the pre-Olympics (1.2%) and post-Olympics (1.9%) periods.
Figure 9. Mean fractional contributions (%) of species or species category to PM2.5 mass: (top) the pre-Olympics period; (middle) the during-Olympics period; (bottom) the post-Olympics period.
In the diagrams, OM equals 1.4 × OC; transition metals include Ti, V, Cr, Mn, Fe, Co, Ni, Cu, Zn, Mo, Cd, Th, and U; PAHs include acenaphthylene, fluorene, phenanthrene, fluoranthene, pyrene, benz[a]anthracene, chrysene, benzo[b]fluoranthene, benzo[k]fluoranthene, benzo[e]pyrene, benzo[a]pyrene, indeno[1,2,3-cd] pyrene, dibenzo[a,h]anthracene, and benzo[g,h,i]perylene; other ions include Na+, K+, Mg2+, Ca2+, F−, and Cl−.
Relationships Among Pollutants, Temperature, and Relative Humidity
We assessed relationships among the pollutants, ambient temperature, and RH using Spearman correlation coefficients (see Table 5). As expected, the correlations between PM2.5 mass and some of its constituents (SO42−, EC, and OC) were high (r ranging from 0.67 to 0.90), as were the correlations between PM2.5 mass and SO2 (r = 0.74) and between PM2.5 mass and CO (r = 0.69). In contrast, the correlations of PM2.5 mass to the following were relatively weaker: NO2 (r = 0.42), TPN (r = 0.11), O3 (r = 0.12), O3 max (r = 0.22), temperature (r = 0.18), and RH (r = 0.33).
Table 5.
Spearman Correlation Coefficients for Selected Air Pollutants, Ambient Temperature, and RHa
| PM2.5 mass (n = 100) | SO42− (n = 92) | EC (n = 94) | OC (n = 94) | TPN (n = 93) | SO2 (n = 91) | CO (n = 100) | NO2 (n = 100) | O3 (n = 100) | O3 max (n = 100) | TEMPb (n = 99) | RH (n = 99) | |
|---|---|---|---|---|---|---|---|---|---|---|---|---|
| PM2.5 mass | 1 | |||||||||||
| SO42− | 0.90c | 1 | ||||||||||
| EC | 0.67c | 0.40c | 1 | |||||||||
| OC | 0.69c | 0.44c | 0.92c | 1 | ||||||||
| TPN | 0.11 | −0.21 | 0.56c | 0.53c | 1 | |||||||
| SO2 | 0.74c | 0.63c | 0.71c | 0.72c | 0.40c | 1 | ||||||
| CO | 0.69c | 0.57c | 0.58c | 0.55c | 0.27c | 0.58c | 1 | |||||
| NO2 | 0.42c | 0.12 | 0.80c | 0.75c | 0.63c | 0.64c | 0.53c | 1 | ||||
| O3 | 0.12 | 0.35c | −0.30d | −0.22d | −0.33c | 0.02 | −0.13 | −0.58c | 1 | |||
| O3 max | 0.22d | 0.37c | −0.12 | −0.02 | −0.15 | 0.13 | 0.01 | −0.40c | 0.91c | 1 | ||
| TEMP | 0.18 | 0.47c | −0.27c | −0.16 | −0.34c | −0.07 | 0.03 | −0.59c | 0.72c | 0.71c | 1 | |
| RH | 0.33c | 0.50c | −0.14 | −0.11 | −0.54c | −0.06 | 0.33c | −0.11 | −0.12 | −0.15 | 0.19 | 1 |
All measured on a 24-hr basis except O3 max, which is the maximum 1-hr average concentration within a 24-hr period.
TEMP indicates ambient temperature.
P < 0.01.
P < 0.05.
Ambient temperature had relatively higher correlations with NO2 (r = −0.59, inversely), O3 (r = 0.72), O3 max (r = 0.71), and SO42− (r = 0.47), whereas RH had relatively higher correlations with SO42− (r = 0.50) and TPN inversely (r = −0.54). Among the gaseous pollutants, SO2 was positively correlated with CO (r = 0.58) and with NO2 (r = 0.64); CO was positively correlated with NO2 (r = 0.53); NO2 was negatively correlated with O3 (r = −0.58) and O3 max (r = −0.40); and O3 was highly positively correlated with O3 max (r = 0.91).
BIOMARKER LEVELS BEFORE, DURING, AND AFTER THE OLYMPICS
Period-specific means and standard errors (SEs), accounting for the repeated measures using mixed-effects models with adjustments for covariates, are shown in Table 6. In the 125 young participants, who were free of any chronic diseases, we observed decreases, from the pre-Olympics to the during-Olympics period, in mean concentrations or the fraction of above-detection values for all pulmonary biomarkers of respiratory inflammation and oxidative stress (FeNO, EBC nitrate, nitrite, nitrite+ nitrate, and 8-isoprostane) except for an increase in EBC pH (corresponding to a decrease in hydrogen ion concentration) (Table 6). A decrease was also seen in HR, some HRV indices (LF, LF/HF, and VLF), and both diastolic and systolic BP. For systemic inflammation and oxidative stress biomarkers, we observed a decrease in the number of CRP values above the detection limit and in urinary 8-OHdG concentration from the pre- to the during-Olympics period. For hemostasis biomarkers, we observed decreases in concentrations of sCD62P, sCD40L, and vWF. These changes were all salutary based on the hypothesized mechanisms of PM action. Most of the biomarkers increased in the post-Olympics period over the during-Olympics mean levels, with the exception of EBC hydrogen ion, LF, LF/HF, rMSSD, SDNN, total power, CRP, RBCs, WBCs, lymphocytes, platelet aggregation, and vWF.
Table 6.
Period-Specific Means and Percent Changes for Biomarker Measurements Based on Period Estimates from Mixed-Effects Models, Accounting for Repeated Measures and Controlling for Temperature and RH
| Biomarker | Pre-Olympics Mean ± SE | During Olympics Mean ± SE | Post-Olympics Mean ± SE | Pre–During Olympics Percent Change (95% CI) | During–Post-Olympics Percent Change (95% CI) |
|---|---|---|---|---|---|
| Autonomic Dysfunction | |||||
| HR (bpm)a | 66.5 ± 1.0 | 65.4 ± 1.0 | 66.1 ± 1.0 | −1.7 (−3.4 to −0.1) | 1.1 (−2.5 to 4.9) |
| HF (ms2)a | 557.9 ± 1.1 | 583.5 ± 1.1 | 590.8 ± 1.1 | 4.6 (−10.5 to 22.3) | 1.2 (−28.9 to 44.2) |
| LF (ms2)a | 459.6 ± 1.1 | 446.3 ± 1.1 | 407.6 ± 1.1 | −2.9 (−19.0 to 16.4) | −8.7 (−36.6 to 31.6) |
| LF/HFa | 0.87 ± 1.1 | 0.78 ± 1.1 | 0.69 ± 1.1 | −10.6 (−24.5 to 5.8) | −10.7 (−37.3 to 27.3) |
| rMSSD (ms)a | 56 ± 1.1 | 59 ± 1.1 | 46 ± 1.1 | 6.14 (−5.6 to 19.4) | −22.0 (−40.2 to 1.9) |
| SDNN (ms)a | 62 ± 1.0 | 63 ± 1.1 | 54 ± 1.0 | 0.8 (−7.5 to 9.8) | −13.6 (−28.9 to 4.9) |
| VLF (ms2)a | 623.9 ± 1.1 | 553.9 ± 1.1 | 725.4 ± 1.1 | −11.2 (−25.2 to 5.4) | 31.0 (−10.8 to 92.3) |
| Total power (ms2)a | 1883.4 ± 1.1 | 1943.1 ± 1.1 | 1878.2 ± 1.1 | 3.2 (−10.8 to 19.4) | −3.3 (−28.2 to 30.2) |
| DBP (mmHg) | 60.2 ± 1.2 | 60.1 ± 1.6 | 60.1 ± 2.0 | −0.3 (−3.0 to 2.5) | 0.1 (−9.7 to 9.9) |
| SBP (mmHg) | 102.5 ± 1.4 | 100.9 ± 1.8 | 110.5 ± 2.3 | −1.8 (−3.9 to 0.4) | 10.7 (2.8 to 18.6) |
| Systemic Inflammation and Oxidative Stress | |||||
| Fibrinogen (g/L) | 2.50 ± 0.04 | 2.50 ± 0.05 | 2.61 ± 0.06 | −0.1 (−2.5 to 2.2) | 4.3 (−1.7 to 10.2) |
| CRP (% ≥ 0.3 mg/L) | 55 | 46 | 36 | — | — |
| RBCs (×1012/L) | 4.57 ± 0.03 | 4.61 ± 0.03 | 4.48 ± 0.03 | 0.9 (0.3 to 1.5) | −2.7 (−3.8 to −1.6) |
| WBCs (×109/L) | 5.29 ± 0.13 | 5.40 ± 0.15 | 5.21 ± 0.16 | 2.2 (−2.3 to 6.6) | −3.9 (−11.5 to 3.6) |
| Lymphocytes (×109/L) | 1.66 ± 0.03 | 1.70 ± 0.04 | 1.59 ± 0.04 | 2.2 (−0.3 to 4.7) | −6.9 (−11.4 to −2.5) |
| Neutrophils (×109/L) | 3.03 ± 0.09 | 3.06 ± 0.12 | 3.19 ± 0.14 | 1.0 (−5.4 to 7.3) | 4.7 (−7.7 to 17.0) |
| Urinary 8-OHdG (mg/mol creatinine)a | 2.16 ± 1.81 | 0.90 ± 1.95 | 3.74 ± 1.46 | −58.3 (−72.5 to −36.7) | 315 (62.0 to 962) |
| Pulmonary Oxidative Stress and Inflammation | |||||
| FeNO (ppb)a | 11.53 ± 1.07 | 4.58 ± 1.10 | 10.52 ± 1.13 | −60.3 (−66.0 to −53.6) | 130 (62.5 to 225) |
| EBC | |||||
| Nitrite (μM)a | 6.30 ± 1.06 | 4.41 ± 1.09 | 11.43 ± 1.15 | −30.0 (−39.3 to −19.3) | 159 (71.8 to 292) |
| Nitrate (μM)a | 2.84 ± 1.08 | 2.23 ± 1.13 | 5.82 ± 1.22 | −21.5 (−35.5 to −4.5) | 161 (48.0 to 362) |
| Nitrite+nitrate (μM)a | 10.11 ± 1.06 | 8.34 ± 1.09 | 18.70 ± 1.14 | −17.6 (−28.4 to −5.1) | 124 (50.9 to 233) |
| pH | 7.41 ± 0.07 | 7.68 ± 0.10 | 7.29 ± 0.14 | 3.5 (2.2 to 4.9) | −4.8 (−9.4 to −0.2) |
| 8-Isoprostane (% ≥ 1.56 pg/mL) | 68 | 44 | 74 | — | — |
| Hemostasis | |||||
| sCD62P (ng/mL)a | 6.29 ± 1.03 | 4.16 ± 1.04 | 5.56 ± 1.04 | −34.0 (−38.4 to −29.2) | 33.7 (17.7 to 51.8) |
| sCD40L (ng/mL)a | 1.86 ± 1.02 | 1.76 ± 1.03 | 1.92 ± 1.04 | −5.7 (−10.5 to −0.7) | 9.1 (−3.7 to 23.5) |
| Platelet aggregation (%) | 69.29 ± 3.45 | 76.93 ± 4.74 | 31.65 ± 6.32 | 7.4 (2.2 to 12.5) | −40.8 (−51.0 to −30.6) |
| vWF (%) | 106.4 ± 4.0 | 92.6 ± 5.1 | 79.5 ± 6.4 | −13.1 (−18.6 to −7.5) | −14.2 (−29.9 to 1.6) |
Biomarker had skewed data distributions, for which geometric means were reported. Dash indicates no calculations for percent changes between periods were done due to insufficient detection levels.
After adjustment for ambient temperature, RH, sex, and day of the week, the pre-Olympics to during-Olympics changes (%) are shown in Figure 10A. For the biomarkers of autonomic dysfunction, we observed a statistically significant change in HR (−1.7% [95% CI, −3.4 to −0.1]) and marginally significant change in SBP (−1.6 mmHg, or −1.8% [95% CI, −3.9 to 0.4]). For the biomarkers of systemic inflammation and oxidative stress, we observed a nonsignificant increase in WBC count (2.2% [95% CI, −2.3 to 6.6]), a marginally significant increase in lymphocytes (2.2% [95% CI, −0.3 to 4.7]), and a large and statistically significant decrease in 8-OHdG (−58.3% [95% CI, −72.5 to −36.7]). For the biomarkers of pulmonary inflammation and oxidative stress, we observed large and statistically significant decreases in FeNO (−60.3% [95% CI, −66.0 to −53.6]), EBC nitrite (−30.0% [95% CI, −39.3 to −19.3]), EBC nitrate (−21.5% [95% CI, −35.5 to −4.5]), and EBC nitrite+nitrate (−17.6% [95% CI, −28.4 to −5.1]) and a statistically significant increase in EBC pH (3.5% [95% CI, 2.2 to 4.9]), corresponding to a large decrease (−46%) in hydrogen ions. For the biomarkers of hemostasis, we observed a large and statistically significant decrease in sCD62P (−34% [95% CI, −38.4 to −29.2]), a smaller but significant decrease in sCD40L (−5.7% [95% CI, −10.5 to −0.7]), a moderate and significant decrease in vWF (−13.1% [95% CI, −18.6 to −7.5]), and a significant increase in platelet aggregation (7.4% [95% CI, 2.2 to 12.5]). The biomarkers not listed here exhibited either a highly nonsignificant (with a large 95% CI) change or a near-zero change.
Figure 10. Estimated means and 95% confidence intervals for percent changes in biomarker levels, adjusted for ambient temperature, RH, sex, and day of the week: (A) from the pre-Olympics to the during-Olympics period; (B) from the during-Olympics to the post-Olympics period.
(Note different scales for A and B.)
The during-Olympics to post-Olympics covariate-adjusted changes (%) are shown in Figure 10B. For the biomarkers of autonomic dysfunction, we observed statistically nonsignificant reductions in LF (−8.7% [95% CI, −36.6 to 31.6]), LF/HF (−10.7% [95% CI, −37.3 to 27.3]), and SDNN (−13.6% [95% CI, −28.9 to 4.9]); a marginally significant decrease in rMSSD (−22.0 [95% CI, −40.2 to 1.9]); a nonsignificant increase in VLF (31.0% [95% CI, −10.8 to 92.3]); and a significant increase in SBP (10.7% [95% CI, 2.8 to 18.6]). For the biomarkers of systemic inflammation and oxidative stress, we observed nonsignificant increases in fibrinogen (4.3% [95% CI, −1.7 to 10.2]) and neutrophil count (4.7% [95% CI, −7.7 to 17.0]), a nonsignificant decrease in WBC count (−3.9% [95% CI, −11.53 to 3.6]), a significant decrease in lymphocytes (−6.9% [95% CI, −11.4 to −2.5]), and a very large and significant increase in 8-OHdG (315% [95% CI, 62.0 to 962]). For the biomarkers of pulmonary inflammation and oxidative stress, we observed large and significant increases in FeNO (130% [95% CI, 62.5 to 225]), EBC nitrite (159% [95% CI, 71.8 to 292]), EBC nitrate (161% [95% CI, 48.0 to 362]), and EBC nitrite+nitrate (124% [95% CI, 50.9 to 233]); and a significant decrease in EBC pH (−4.8% [95% CI, −9.4 to −0.2]), corresponding to a large increase (146%) in hydrogen ions. For the biomarkers of hemostasis, we observed a large and significant increase in sCD62P (33.7% [95% CI, 17.7 to 51.8]), a smaller and marginally significant increase in sCD40L (9.1% [95% CI, −3.7 to 23.5]), a marginally significant decrease in vWF (−14.2% [95% CI, −29.9 to 1.6]), and a significant decrease in platelet aggregation (−40.8% [95% CI, −51.0 to −30.6]).
Biomarker levels, unadjusted for covariates and for the repeated-measure structure using raw data, are summarized by period in Appendix B. Intra-class correlations for each biomarker are presented by period in Appendix I. Among all the measured biomarkers, the following had skewed data distributions: FeNO, nitrite, nitrate, nitrite+nitrate, all HRV indices (SDNN, rMSSD, LF, HF, and total power), and sCD40L. About 13% of all urinary samples had 8-OHdG concentrations below the detection limit, and the data distribution was highly skewed. EBC 8-isoprostane and CRP each had a large percentage of nondetectable values.
Biomarker–Pollutant Relationships
For each biomarker, we plotted the point estimates and 95% confidence intervals of the percent changes in bio-marker per IQR increase in pollutant concentration. The IQR values used for estimating pollutant-specific effects are shown in Table 7.
Table 7.
Interquartile Range Values Used for Estimating Pollutant-Specific Effects
| PM2.5 (μg/m3) | SO42− (μg/m3) | EC (μg/m3) | OC (μg/m3) | TPN (/cm3) | SO2 (ppb) | CO (ppm) | NO2 (ppb) | O3 (ppb) | |
|---|---|---|---|---|---|---|---|---|---|
| IQR | 76.8 | 28.0 | 1.4 | 5.1 | 6572 | 5.4 | 0.65 | 18.7 | 25.4 |
Biomarkers of Autonomic Dysfunction
Heart Rate
As shown in Figure 11, we observed positive associations of HR with all pollutants except O3 for most lag days, although statistical significance was observed only for PM2.5, SO42−, and SO2, all at lag day 1, and for EC and TPN at lag day 3. The largest effect estimates corresponding to these lag days were 1.5% for PM2.5, 2.2% for SO42−, 0.9% for EC, 0.5% for TPN, and 1.1% for SO2. These findings are, in general, consistent with the hypothesis that air pollution can lead to increased HR.
Figure 11.
Estimated means and 95% CIs for the percent change in HR associated with one IQR increase in pollutant concentration, controlling for temperature (df in natural spline = 1), RH (df = 1), sex, and day of the week for biomarker measurements.
Heart Rate Variability
Similar to the HR observations, VLF appeared to increase as pollutant concentration increased for most lag days and for all pollutants except O3; statistical significance was seen for SO42− at lag 4 and EC at lag 5 (see Figure 12). The pattern was less clear for SDNN (see Figure 13), as associations bounced back and forth between the negative and positive, with statistical significance observed only for PM2.5 (at lag day 5, positive), SO42−(at lag days 4 and 5, positive), OC (at lag days 1 and 2, negative), and NO2 (at lags 0 and 1, negative). The pattern for rMSSD (see Figure 14) was even more complex, as we observed significant positive associations with PM2.5 at lag day 5 and with SO42− at lag days 4 and 5, while seeing significant negative associations with EC and OC at lag days 0 to 2, with OC at lag day 3, with TPN at lag days 0 and 3, and with NO2 at lag days 0 and 1. We did not observe a clear pattern of pollutant response with LF, HF, LF/HF, or total power of the HRV indices (plots not shown).
Figure 12.
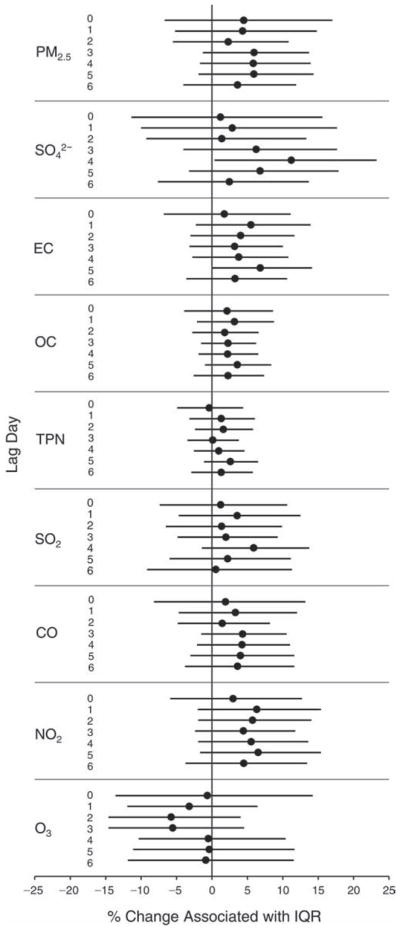
Estimated means and 95% CIs for the percent change in VLF (HRV) associated with one IQR increase in pollutant concentration, controlling for temperature (df in natural spline = 1), RH (df = 1), 7-day moving average of temperature (df = 1), sex, and day of the week for biomarker measurements.
Figure 13.
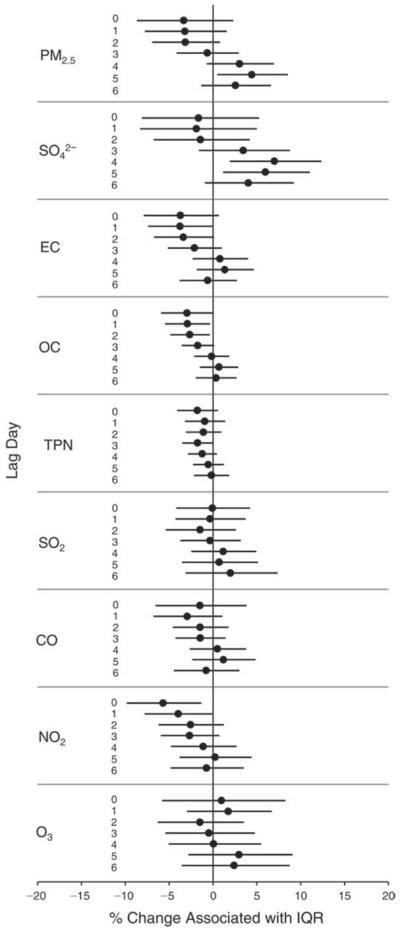
Estimated means and 95% CIs for the percent change in SDNN (HRV) associated with one IQR increase in pollutant concentration, controlling for temperature (df in natural spline = 1), RH (df = 1), 7-day moving average of temperature (df = 1), sex, and day of the week for biomarker measurements.
Figure 14.
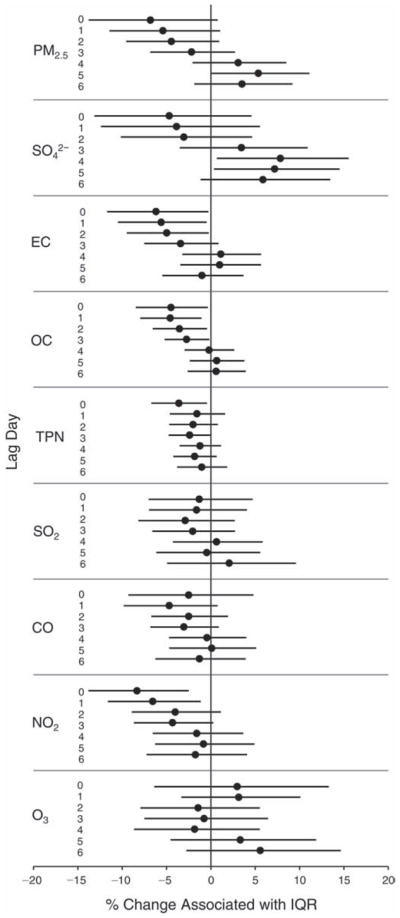
Estimated means and 95% CIs for the percent change in rMSSD (HRV) associated with one IQR increase in pollutant concentration, controlling for temperature (df in natural spline = 1), RH (df = 1), 7-day moving average of temperature (df = 1), sex, and day of the week for biomarker measurements.
Blood Pressure
The relation between SBP and pollutant concentrations (see Figure 15) had a pattern somewhat similar to that for SDNN, as we observed both significant positive and negative associations bouncing back and forth across lag days. We did not observe a clear pattern for DBP (plot not shown).
Figure 15.
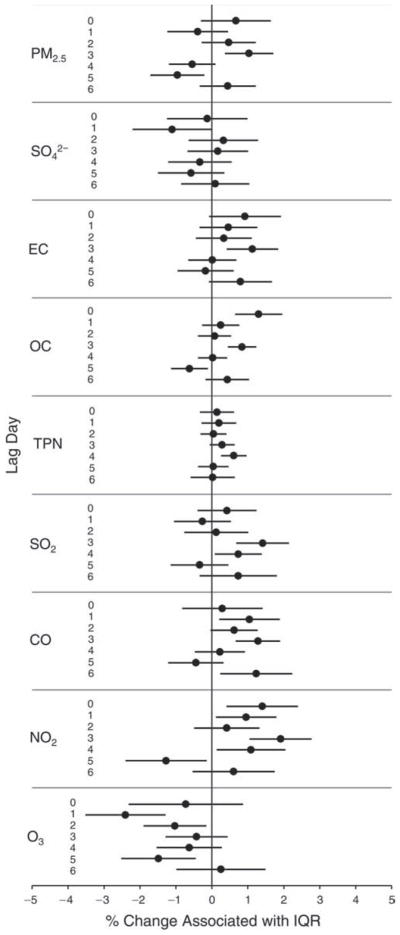
Estimated means and 95% CIs for the percent change in SBP associated with one IQR increase in pollutant concentration, controlling for temperature (df in natural spline = 3), RH (df = 2), 7-day moving average of temperature (df = 3), 2-day moving average of RH (df = 3), sex, and day of the week for biomarker measurements.
Biomarkers of Systemic Inflammation and Oxidative Stress
Fibrinogen
Consistent with the hypothesis that air pollution exposure increases plasma fibrinogen via systemic inflammation, we observed significant increases (ranging 0.8%–1.9%) in fibrinogen (Figure 16) associated with IQR increases in PM2.5, EC, and OC (all at lags 2 and 3), SO2 (at lags 3 and 6), and NO2 (at lag day 0). We also observed similarly sized nonsignificant increases associated with IQR increases in SO42− and CO at multiple lag days. However, O3 appeared to have negative, nonsignificant associations with fibrinogen at multiple lag days.
Figure 16.
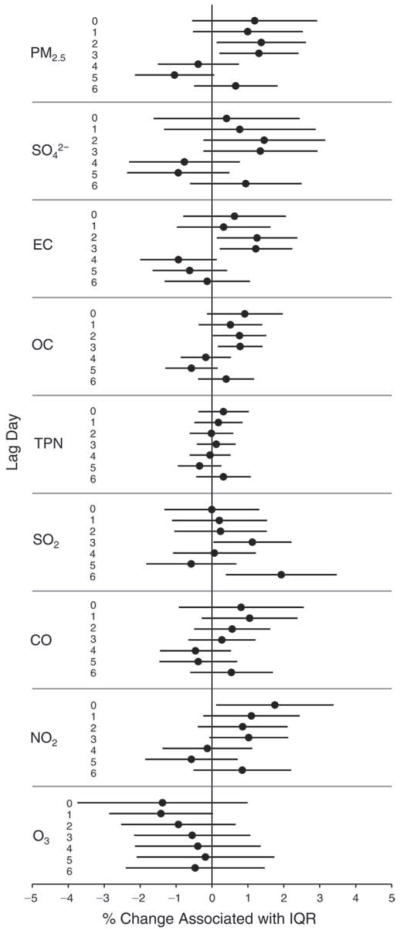
Estimated means and 95% CIs for the percent change in fibrinogen level associated with one IQR increase in pollutant concentration, controlling for temperature (df in natural spline = 3), RH (df = 1), 6-day moving average of temperature (df = 1), sex, and day of the week for biomarker measurements.
Red Blood Cell Counts
As shown in Figure 17, we observed significant negative associations between RBC count and all pollutants except O3. The largest reductions per IQR increase in pollutant concentration (ranging from 0.4%–1.4%) were observed at earlier lag days (0 and/or 1) for PM2.5, SO42−, EC, OC, and SO2, and at later lag days for CO and NO2. These negative associations are contrary to the hypothesis that increased air pollutant concentrations are associated with increases in RBCs through inflammation. In contrast, for O3 we observed significant increases in RBC counts (0.8%–1.2%) associated with each IQR increase at multiple lag days.
Figure 17.
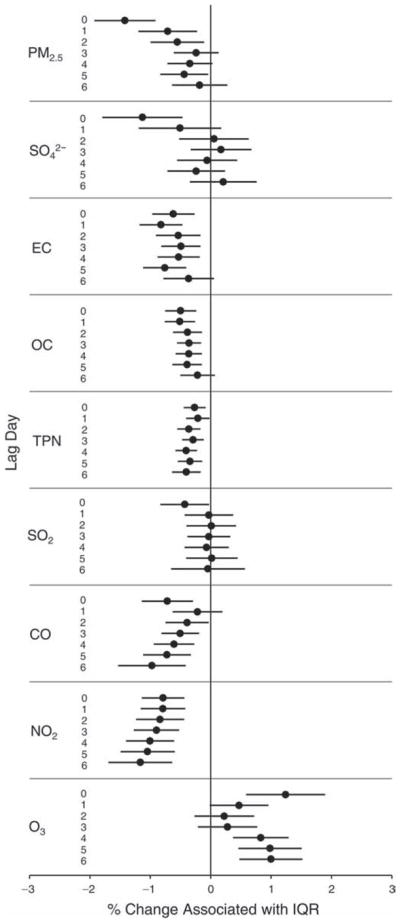
Estimated means and 95% CIs for the percent change in RBC count associated with one IQR increase in pollutant concentration, controlling for temperature (df in natural spline = 1), RH (df = 1), 4-day moving average of RH (df = 1), sex, and day of the week for biomarker measurements.
White Blood Cell Counts
As shown in Figure 18 and contrary to the hypothesis, we observed statistically significant decreases of 1.5% to 3.4% in WBCs associated with IQR increases in OC, TPN, SO2, CO, and NO2, at lag days 4 to 6. In addition, TPN was positively and significantly associated with WBC count at lag 0, while O3 was positively and nonsignificantly associated with WBC count at lags 1 to 6.
Figure 18.
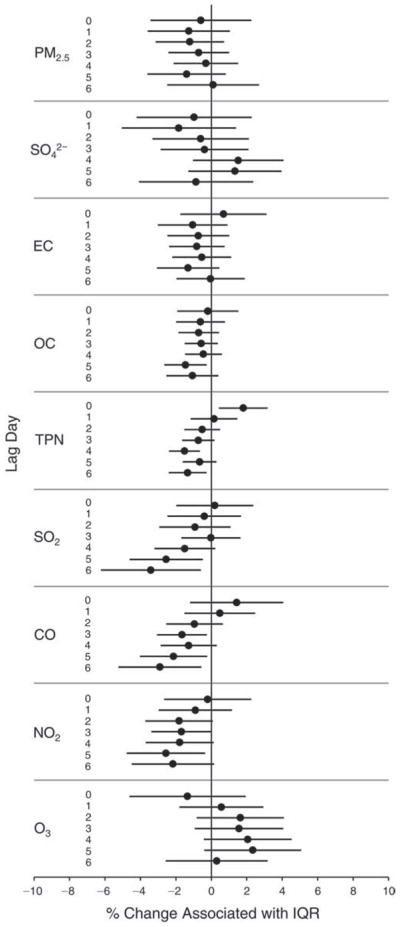
Estimated means and 95% CIs for the percent change in WBC count associated with one IQR increase in pollutant concentration, controlling for temperature (df in natural spline = 1), RH (df = 1), 7-day moving average of temperature (df = 3), 6-day moving average of RH (df = 3), sex, and day of the week for biomarker measurements.
Urinary 8-OHdG
As shown in Figure 19, we observed mostly positive and significant associations between 8-OHdG levels and all pollutants except O3 across lag days, which is consistent with the hypothesis that air pollution exposure leads to increased urinary 8-OHdG concentration, reflecting the increased body burden from oxidative stress. Across lag days, the largest effect estimates per IQR increase in pollutant concentrations were 57.6% for PM2.5, 75.4% for SO42−, 47.7% for EC, 23.6% for OC, 41.4% for SO2, 42.2% for CO, and 51.9% for NO2, all at lag 1, and 24.7% for TPN at lag 3. The largest O3 negative effect estimate was −30.5% at lag 5.
Figure 19.
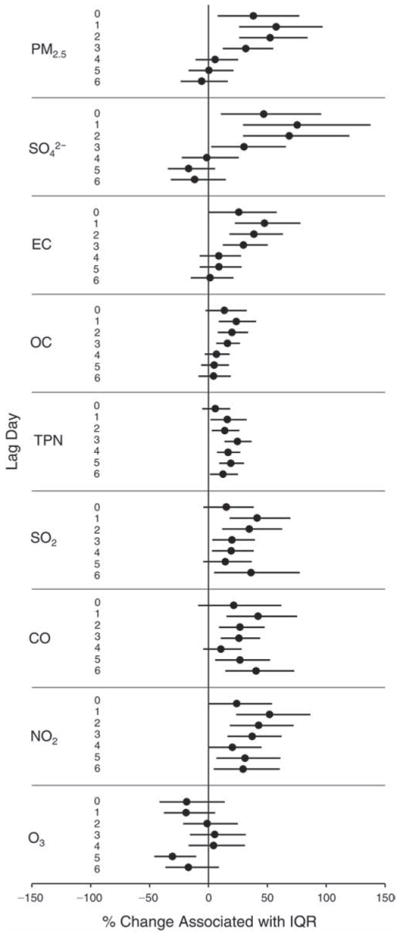
Estimated means and 95% CIs for the percent change in urinary 8-OHdG (creatinine corrected) associated with one IQR increase in pollutant concentration, controlling for temperature (df in natural spline = 1), RH (df = 1), 7-day moving average of temperature (df = 1), 2-day moving average of RH (df = 3), sex, and day of the week for biomarker measurements.
Lymphocytes and Neutrophils
As shown in Figure 20, we observed significant negative associations of lymphocyte concentration (absolute count) with PM2.5 at lag day 0, EC at lag days 0 and 1, OC at lag day 1, TPN at lag days 0 and 2, CO at lag day 0, and NO2 at lag days 0 and 1. In contrast, lymphocyte count was significantly and positively associated with O3 at lag days 0 and 6. In addition, we observed both nonsignificant increases and decreases associated with increases in pollutant concentration across multiple lag days for each pollutant except NO2 and TPN (which showed decreases at all lags) and O3 (which showed increases at all lags). We did not observe a clear pattern for neutrophils in relation to the pollutants across lag days (i.e., nothing showed significance and the associations went in different directions) (plot not shown).
Figure 20.
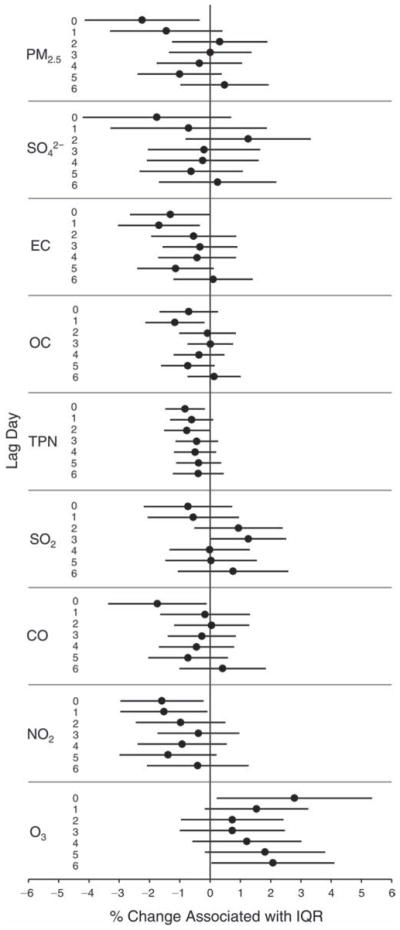
Estimated means and 95% CIs for the percent change in lymphocyte count associated with one IQR increase in pollutant concentration, controlling for temperature (df in natural spline = 1), RH (df = 1), sex, and day of the week for biomarker measurements.
Biomarkers of Pulmonary Inflammation and Oxidative Stress
FeNO
As shown in Figure 21, FeNO was significantly and positively associated with PM2.5, SO42−, EC, and SO2 at all lag days and with TPN, CO, and NO2 at most lag days. The effect estimates for most of the pollutants appear to be largest at lag day 0 (except SO2, which had the largest effect estimate at lag 3). It is generally the case that effect estimates gradually decreased as the lag days increased, at least for the first several lag days. This is even true for O3, although the direction of the association was negative at lags 0 to 2. However, OC appeared to be a lone exception, as a significant, positive, and small association was observed only at lag day 4, despite the fact that overall the FeNO effect estimates for each IQR increase in pollutant concentration were large compared with the effect estimates for most biomarkers measured in this study. The largest effect estimates across the 7 lag days were 40.7% for PM2.5, 50.0% for SO42−, 28.3% for EC, 20.6% for TPN, 41.7% for SO2, 53.0% for CO, 34.4% for NO2, and −37.1% for O3 (in addition, a large positive effect estimate of 35.4% for O3 was observed at lag 4). The positive FeNO–pollutant associations were in agreement with the hypothesis that pollutant exposure leads to increased FeNO, reflecting increased pulmonary inflammation.
Figure 21.
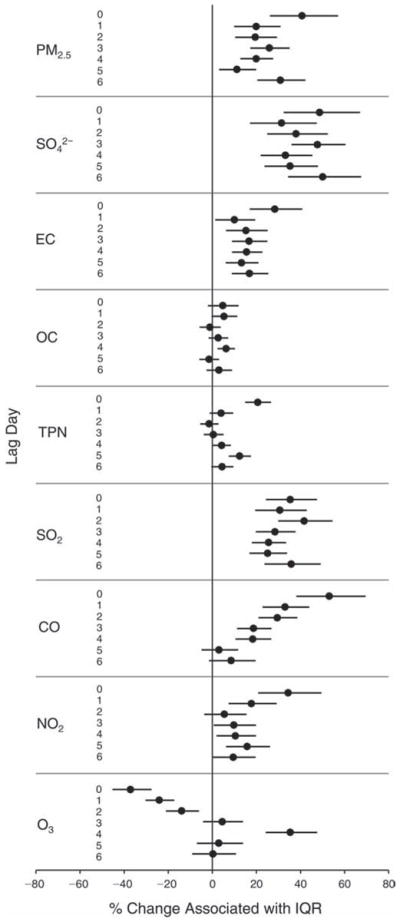
Estimated means and 95% CIs for the percent change in FeNO level associated with one IQR increase in pollutant concentration, controlling for temperature (df in natural spline = 2), RH (df = 3), 7-day moving average of temperature (df = 2), 7-day moving average of RH (df = 3), sex, and day of the week for biomarker measurements.
EBC Nitrite, Nitrate, and Nitrite+Nitrate
Consistent with the hypothesis, EBC nitrite was positively associated with all pollutants except O3 at one or more lag days (Figure 22). The effect estimates for PM2.5 and its constituents SO42−, EC, and OC were largest at lag day 0 and decreased as the lag days increased. This was also the case for TPN for the first 5 lag days, but effect estimates increased from lag 5 to lag 6, when it was the largest. Significant and positive associations were seen for SO2 at all lag days with the largest effect estimate at lag 3; for both CO and NO2 significant and positive associations were seen at the first 6 lag days, with the largest effect estimate at lag 1. The association between EBC nitrite and O3 was significant and negative for the first 4 lag days and significant but positive at lag 6. Across the 7 lag days, the largest effect estimates per IQR increase in pollutant concentration were 21.9% for PM2.5, 11.1% for SO42−, 26.7% for EC, 13.7% for OC, 14.6% for TPN, 20.5% for SO2, 15.7% for CO, and 22.2% for NO2. Associations between EBC nitrate and an increase in pollutants varied more substantially across lag days than those of EBC nitrite, both in terms of direction (positive vs. negative) and effect size (see Figure 23). As expected (see Figure 24), the pattern for nitrite+nitrate demonstrated an intermediate response that was in between that of EBC nitrite and EBC nitrate. The largest positive and significant effect estimates were at lag day 0 for PM2.5, SO42−, EC, and OC, at lag day 1 for TPN and CO, and at lag day 3 for NO2 and SO2. The association with O3 was significant and negative at lag days 0 through 2 and significant and positive at lag day 6.
Figure 22.
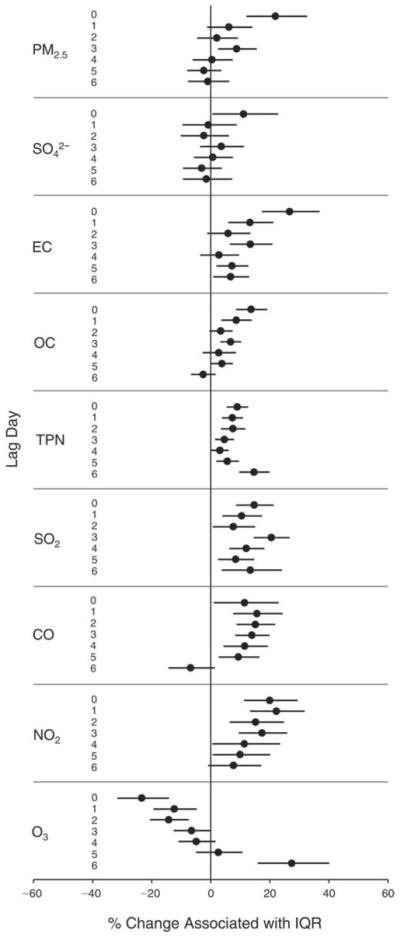
Estimated means and 95% CIs for the percent change in EBC nitrite level associated with one IQR increase in pollutant concentration, controlling for temperature (df in natural spline = 2), RH (df = 1), 7-day moving average of temperature (df = 3), 3-day moving average of RH (df = 3), sex, and day of the week for biomarker measurements.
Figure 23.
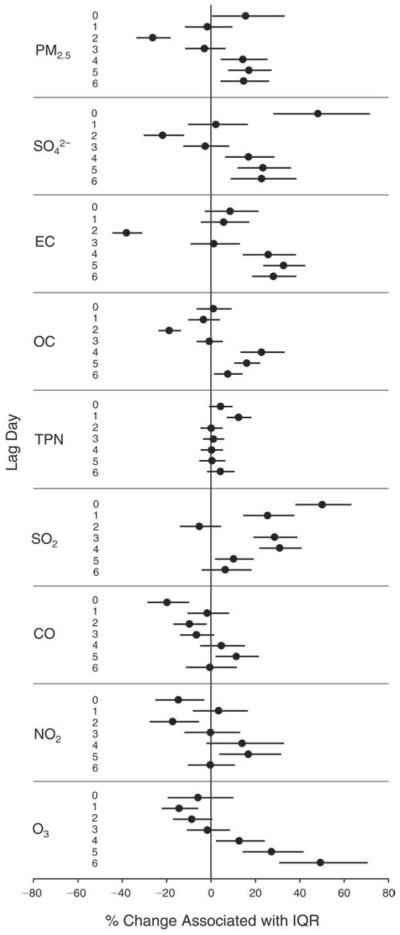
Estimated means and 95% CIs for the percent change in EBC nitrate level associated with one IQR increase in pollutant concentration, controlling for temperature (df in natural spline = 2), RH (df = 1), 7-day moving average of temperature (df = 3), 7-day moving average of RH (df = 3), sex, and day of the week for biomarker measurements.
Figure 24.
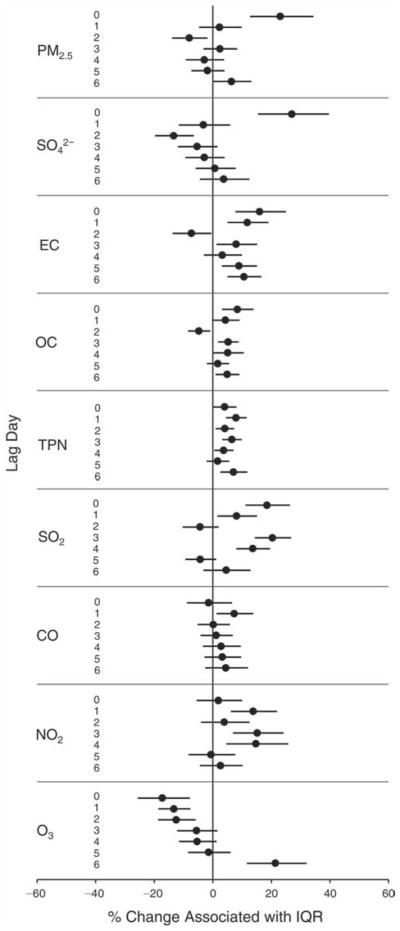
Estimated means and 95% CIs for the percent change in EBC nitrite+nitrate level associated with one IQR increase in pollutant concentration, controlling for temperature (df in natural spline = 1), RH (df = 3), 7-day moving average of temperature (df = 3), 5-day moving average of RH (df = 3), sex, and day of the week for biomarker measurements.
EBC pH
Consistent with the hypothesis that air pollution exposure leads to airway acidification (decreased EBC pH), we observed negative and significant associations of EBC pH with all the pollutants except O3 at multiple lags (Figure 25). The largest effect estimates were observed at lags 0 and 1 for PM2.5, lags 1 and 4 for SO42−, lag 0 for EC and OC, lag 1 for TPN, lag 2 for SO2, lags 0 and 5 for CO, lag 5 for NO2, and (inversely) lag 0 for O3.
Figure 25.
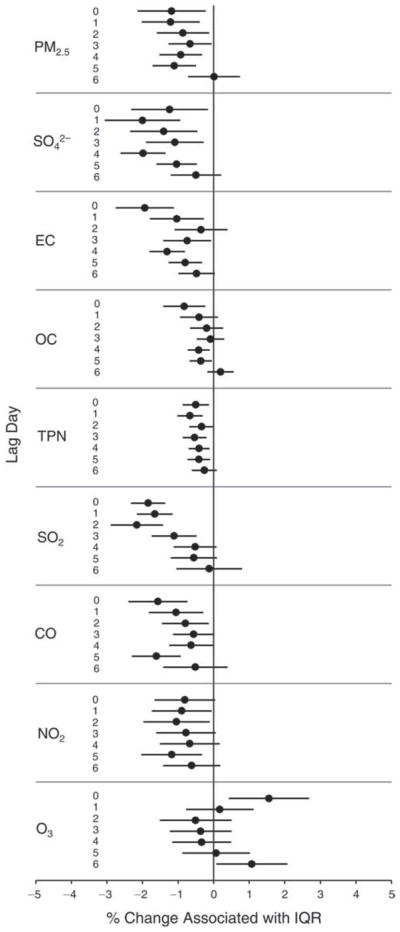
Estimated means and 95% CIs for the percent change in EBC pH level associated with one IQR increase in pollutant concentration, controlling for temperature (df in natural spline = 1), RH (df = 1), 6-day moving average of temperature (df = 3), 3-day moving average of RH (df = 1), sex, and day of the week for biomarker measurements.
EBC 8-Isoprostane
Consistent with the hypothesis that air pollution exposure leads to increased oxidative stress in the airways, we observed positive associations between EBC 8-isoprostane (in log odds of having a value >75th percentile) and all the pollutants except O3 at various lag days (Figure 26). The associations were statistically significant for PM2.5 at lags 3 and 4; SO42− at lag days 0, 3, and 4; EC at lag day 4; OC at lag 4; TPN at lag day 0; SO2 at lags 0, 3, 4, and 5; CO at lag 4; and O3 at lag 4 (positive association) and at lag 0 (negative marginally significant association).
Figure 26.
Odds ratios comparing the odds of a greater-than-75th-percentile value of EBC 8-isoprostane to the odds of a smaller-than-75th-percentile value associated with one IQR increase in pollutant concentration, controlling for temperature (df in natural spline = 1), RH (df = 1), 7-day moving average of temperature (df = 2), 2-day moving average of RH (df = 1), sex, and day of the week for biomarker measurements.
Biomarkers of Hemostasis
sCD62P and sCD40L
We observed significant increases in sCD62P associated with IQR increases in all pollutants but O3, with the largest increases per pollutant (ranging 3.4%–19.1%) at lags 1 to 3 (Figure 27). In contrast, we observed a 12% decrease in sCD62P associated with each IQR increase in O3 concentration at lag 0. The lag-day association patterns were quite consistent across pollutants. In comparison, sCD40L increases were smaller (ranging 2.9%–7.4%), but still significantly associated with IQR increases in PM2.5, SO42−, EC, and SO2 concentrations at lags 3 to 5 (Figure 28).
Figure 27.
Estimated means and 95% CIs for the percent change in sCD62P level associated with one IQR increase in pollutant concentration, controlling for temperature (df in natural spline = 1), RH (df = 3), 7-day moving average of temperature (df = 2), 4-day moving average of RH (df = 2), sex, and day of the week for biomarker measurements.
Figure 28.
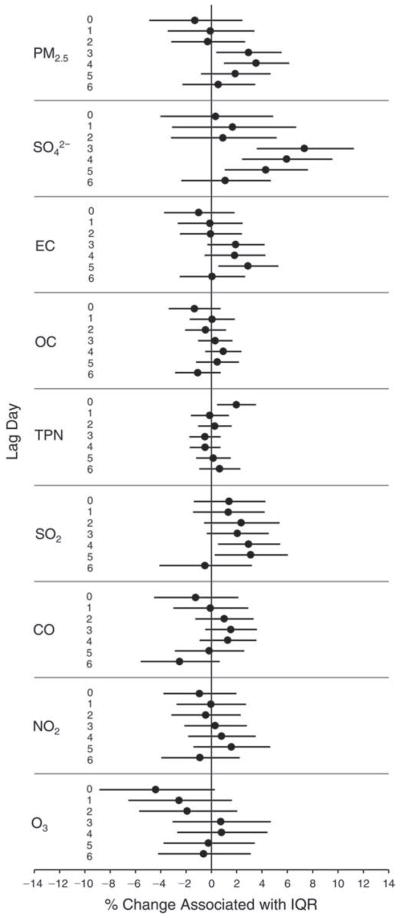
Estimated means and 95% CIs for the percent change in sCD40L level associated with one IQR increase in pollutant concentration, controlling for temperature (df in natural spline = 1), RH (df = 1), 5-day moving average of temperature (df = 1), 2-day moving average of RH (df = 1), sex, and day of the week for biomarker measurements.
Platelet Aggregation
Contrary to the hypothesis that air pollution leads to increased platelet aggregation, we observed significant decreases in the fraction of platelets aggregated with increases in all pollutants but O3 at least for the first several lag days (Figure 29). At later lag days, increases in platelet aggregation were associated with increases in concentrations of PM2.5, SO42−, OC, and SO2. In contrast, increases in platelet aggregation were significantly associated with increased O3 concentrations at earlier lag days (0 and 1).
Figure 29.
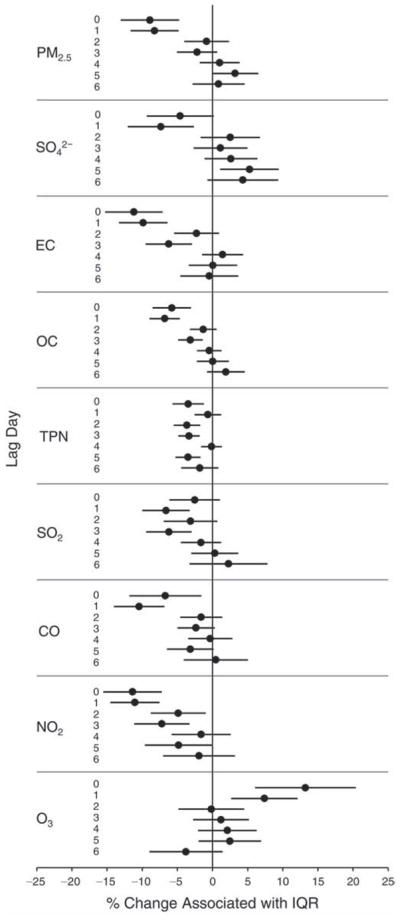
Estimated means and 95% CIs for the percent change in platelet aggregation level associated with one IQR increase in pollutant concentration, controlling for temperature (df in natural spline = 3), RH (df = 3), 7-day moving average of temperature (df = 3), 3-day moving average of RH (df = 3), sex, and day of the week for biomarker measurements.
vWF
As shown in Figure 30, we observed significant increases (2.5%–8.2%) in vWF associated with IQR increases in most pollutants at various lags, with the largest effects associated with PM2.5, SO42−, NO2 and EC (all at lag 3), SO2 (at lags 1–3), and TPN, OC, and CO (at lags 0 and 1). In contrast, we observed a significant decrease (19.1%) in vWF associated with each IQR increase in O3 at lag day 0.
Figure 30.
Estimated means and 95% CIs for the percent change in vWF level associated with one IQR increase in pollutant concentration, controlling for temperature (df in natural spline = 3), RH (df = 3), 7-day moving average of temperature (df = 3), 6-day moving average of RH (df = 3), sex, and day of the week for biomarker measurements.
DISCUSSION
AIR QUALITY CHANGES
We observed substantial decreases in air pollutant concentrations (except for O3) in an unprecedented eight-week air pollution intervention, consistent with measurements previously reported (Wang and Xie 2009; Wang et al. 2009; Zhou et al. 2010; Lin et al. 2011). Mean during-Olympics concentrations were reduced by up to 60% compared with pre-Olympics levels (Figure 6). The largest reductions were for SO2, CO, and NO2 measured at our central Beijing monitoring site at which local motor vehicle traffic emissions were expected to be the dominant pollution source. Similarly, the other two pollutants that were expected to have been emitted by local traffic—EC and TPN—were also significantly reduced. We observed slight increases in O3 (both 24-hour averages and 1-hour maximums) from the pre-Olympics to during-Olympics period. These were likely largely driven by large reductions in NO2 (and more specifically NO) brought on by the aggressive traffic controls implemented during the Olympics, leading to the well known “titration” of O3 by NO (Seinfeld and Pandis 1998). In the post-Olympics period, O3 concentrations declined likely substantially due to limited photochemical activity in the early autumn season in Beijing. Another secondary product of photochemical reactions, SO42−, also had the lowest mean concentration during the post-Olympics period. Because PM2.5 emissions came from sources other than just traffic, the changes in PM2.5 concentrations across the three periods were relatively smaller than the changes in the pollutants more closely related to traffic emissions (see Figure 6).
In the pre-Olympics period, none of the concentrations for CO, NO2, and SO2 exceeded health-based standards or guidelines for air pollutants (WHO 2005). On 2 out of 35 pre-Olympics measurement days, 1-hour maximum O3 exceeded 120 ppb (the 1-hour-based standard set by the U.S. EPA). In large contrast, PM2.5 exceeded the 35 μg/m3 U.S. EPA 24-hour-based standard on 34 out of 35 days and reached a maximum daily average of 219 μg/m3. Even with substantial reductions, during-Olympics concentrations of PM2.5 and some of its constituents (e.g., EC and OC) in Beijing were still higher than concentrations observed in Western cities. The high “baseline” concentration (e.g., a pre-Olympics PM2.5 mean concentration of 100.9 μg/m3), along with large changes across periods (e.g., a 31.5 μg/m3 difference between pre- and during-Olympics means for PM2.5), may partly explain why we observed significant changes in outcomes (biomarkers) even in young and healthy adults.
Air quality is affected not only by source emissions but also by meteorology. Although the unprecedented source controls resulted in remarkable reductions in mean concentrations, meteorologic conditions unfavorable for pollution dispersion led to high pollutant concentrations on several days within the during-Olympics period (see Tables P.1 and P.2 in Appendix P), as also reported in previous publications (Wang S et al. 2010). The relative contributions of the air pollution control measures and meteorology to air quality changes have been assessed in previous studies (Wang et al. 2009; Wang S et al. 2010; Wang T et al. 2010). This is, however, out of the main scope of this study, as we were principally interested in examining the impact of changes in pollutant concentrations on health endpoints. The day-to-day variability in meteorology may explain the large IQR values for each subperiod and for the whole period (Tables P.1 and P.2). On the other hand, this variability could have contributed to inaccuracy in estimating exposures in our quasi-experimental “A-B-A” design, as clearly not all the days within the during-Olympics period had lower pollutant concentrations than the pre- and post-Olympics days.
In terms of PM2.5 compositional changes, we first assessed the largest contributing constituents: SO42−, nitrate, NH4+, and OM. The pre- and during-Olympics fractions of SO42− in PM2.5 were similar (27.6% vs. 28.4%), but the post-Olympics fraction was substantially lower (12.0%) (Figure 9). This was expected because SO42− is formed through photo-oxidation of SO2, and the intensity of solar irradiation in the atmosphere during the post-Olympics period (autumn season) was substantially reduced. Although we measured substantially reduced SO2 concentrations in the center of Beijing, regional sources of SO2 may have contributed to the increase of SO42− measured at the study site. Nitrate fractions, in contrast, were similar in the pre- and post-Olympics period (17.8% vs. 16.1%) but lower in the during-Olympics period (11.5%). This may reflect the substantial reduction in NOx emissions during the Olympics. Higher fractions of both EC and OM during the post-Olympics period may reflect increased combustion activities in the early autumn season compared with the summer months of the pre- and during-Olympics periods.
We then assessed several categories of “trace-level” constituents that are more biologically reactive than PM2.5, EC, OC, and SO42−. Transition metals, capable of producing ROS in vitro and in vivo (Bondy et al. 1998; Sørensen et al. 2005), were reduced by 33% from the pre-Olympics fraction of 1.2% to the during-Olympics fraction of 0.8% and then increased to the post-Olympics fraction of 1.9%. PAHs, with a wide variety of toxic effects, were reduced by 13%, from the pre-Olympics fraction of 0.08% to the during-Olympics fraction of 0.07% and then further decreased to the post-Olympics fraction of 0.04%. This simple analysis of PM compositional changes by period further suggests the complexity of biomarker changes by period, which may reflect changes in overall air quality including PM compositional changes. Future analyses examining the relations between pathway-specific bio-markers and individual PM species or clusters of PM species may generate insights about the relative importance of different PM species in the mechanistic pathways being addressed in this study.
PERIOD COMPARISONS OF BIOMARKERS
Along with substantial reductions in air pollutant concentrations during the Olympics air pollution control period, we observed concomitant statistically significant changes in most, but not all, biomarkers that reflect postulated mechanisms of cardiorespiratory events induced by air pollution (see Table 6 and Figure 10A). Moreover, many of these biomarker changes reverted after the end of the air quality intervention (see Table 6 and Figure 10B). The biomarker changes were mostly in the directions hypothesized for the mechanisms of PM action in relation to air pollution increases or decreases (Kipen et al. 2010) —specifically, that the concentrations of the biomarkers except EBC pH were expected to be lower when air pollution concentrations were lower but the EBC pH level was expected to be higher when air pollution levels were low. In observational studies of air pollution health effects, findings from a “one-direction” intervention (e.g., high levels of pollution becoming low levels) generally increase the certainty of causal relationships compared with those from “pure” correlation analyses. The observed reversibility of biomarker changes in this “two-directional” intervention study (i.e., high levels of pollution going to low and then back to high), therefore, further enhances certainty about the hypothesized mechanisms that may underlie acute cardiorespiratory effects of air pollution, as discussed below.
Autonomic Mechanism
Decreases in HRV, thought to reflect cardiac autonomic imbalance and worsened cardiovascular prognosis (Greiser et al. 2009), have been associated with short-term increases in ambient PM2.5, but mostly in the elderly with or without preexisting cardiovascular diseases (Sullivan et al. 2005; de Hartog et al. 2009; Folino et al. 2009; Zanobetti et al. 2010). Studies of young participants found somewhat inconsistent results regarding the relation between HRV and PM2.5, in terms of which HRV indices showed statistically significant effects over varying periods (i.e., lag times) of PM2.5 measurements (Vallejo et al. 2006; Chuang et al. 2007; Wu et al. 2009; Lin et al. 2011). Our analysis did not find statistically significant changes in HRV indices from one period to another (Figure 10), despite significant and substantial changes over the three periods in air quality and in the many other biomarkers shown in the figure.
A number of previous studies reported statistically significant positive associations between ambient air pollution and BP (mostly SBP) in the elderly with or without cardiorespiratory disease (Mar et al. 2005b; Bartoli et al. 2009). In young and healthy adults, we observed a marginally significant decrease (~1.6 mmHg) in SBP during the Olympics air pollution control period compared with the pre-Olympics period, and a significant increase (~10 mmHg) in SBP from the during- to the post-Olympics period (see Table 6). We also observed a small but significant decrease (~1 bpm) in HR from the pre- to the during-Olympics period (but a nonsignificant and near-zero change from the during- to the post-Olympics period), somewhat in agreement with the positive HR–PM associations observed in two previous studies (Magari et al. 2002; Schneider et al. 2010). When the positive findings on SBP and partially positive findings on HR but null findings on HRV are considered all together, our period comparisons provide limited evidence to support the hypothesis that air pollution leads to autonomic dysfunction in young and healthy adults.
Inflammatory Mechanism
The most prominent hypothesis on the mechanism relating air pollution to cardiorespiratory mortality and morbidity has been that air pollutants, especially fine and ultrafine particles, provoke pulmonary inflammation, largely by induction of oxidative stress. This oxidative stress then may lead to increased blood coagulability and systemic inflammation over a matter of hours to days (Seaton et al. 1995, 1999). Numerous epidemiologic and experimental studies have demonstrated increased levels of pulmonary inflammation (e.g., indicated by FeNO and other inflammatory markers in airway fluids) associated with air pollution exposure (Ghio et al. 2000; Nemmar et al. 2003a; Koenig et al. 2005; Adar et al. 2007). Epidemiologic studies have also demonstrated associations between air pollution and clinical markers of systemic inflammation including increased WBCs, fibrinogen, vWF, and CRP (Peters et al. 1997; Danesh et al. 1998; Seaton et al. 1999; Pekkanen et al. 2000; Peters et al. 2001a, 2001b; van Eeden et al. 2001; van Eeden and Hogg 2002; Shishehbor et al. 2003; Riediker et al. 2004; Ruckerl et al. 2006; Zuurbier et al. 2011). Despite some initial positive human studies (Jansen et al. 2005), acute experimental data are not as consistent in demonstrating a clear relationship between particulate air pollution exposure and systemic inflammatory markers (Ghio et al. 2000; Beckett et al. 2005).
An increase in FeNO, a sensitive biomarker of airway inflammation, has been associated with increases in air pollution in asthmatics and children as well as healthy adults (Nightingale et al. 1999; van Amsterdam et al. 1999; Steerenberg et al. 2001; Koenig et al. 2003; Koenig et al. 2005; Mar et al. 2005a; Delfi no et al. 2006). In healthy young adults, we observed a statistically significant decrease of 60.3% in FeNO associated with the air quality improvement (i.e., from the pre-Olympics period to the during-Olympics period) and then a statistically significant increase of 130% associated with the relaxation of the pollution control (i.e., from the during-Olympics to the post-Olympics period).
Our study is perhaps the first in which EBC pH was measured in healthy young adults. Studies of diseased adults or the elderly have reported that decreases in airway pH causes bronchoconstriction and impairs ciliary motility (Ricciardolo et al. 1999), increases airway mucus viscosity (Holma 1989), and induces damage to the airway epithelium (Holma et al. 1977). One panel study that measured EBC pH in asthmatic patients suggested that acute asthma exacerbations may be accompanied by airway acidification that reflects the inhibition of local epithelial proton pumps during airway inflammation (Antus et al. 2010). Statistically significant decreases in EBC pH were reportedly associated with exposure to diesel traffic in adults with asthma (McCreanor et al. 2007) and with exposure to O3 in children with asthma (Barraza-Villarreal et al. 2008). However, the limited research on the association of EBC pH with ambient pollution has generated inconsistent findings (McCreanor et al. 2007; Epton et al. 2008; Ferdinands et al. 2008; Romieu et al. 2008). In this study, we observed a statistically significant increase in EBC pH (exhibited by a 46% decrease in EBC hydrogen ion concentration) associated with the air pollution intervention and a significant increase (146%) in EBC hydrogen ion concentration associated with the relaxation of the pollution controls.
Our findings in pulmonary inflammatory markers are consistent with the hypothesis that inhaled PM induces the release of pro-inflammatory mediators leading to a local inflammatory response (Danesh et al. 2000). Inflammatory mediators can leave the lung and enter the circulation, inducing systemic effects (van Eeden et al. 2001; van Eeden and Hogg 2002; Shishehbor et al. 2003). In the liver, these mediators initiate an acute phase response, characterized by increased production of acute phase proteins, including fibrinogen and CRP, which previous studies have suggested are associated with exposure to PM (Zanobetti et al. 2000; Atkinson et al. 2001; Peters et al. 2001a). In the present study, we found no change in plasma fibrinogen level from the pre- to the during-Olympics period but a marginally significant increase of 4.3% from the during- to post-Olympics period (Figure 10). A crude analysis of our CRP data (with a large fraction of below-detection values due to the low sensitivity of the assay) found that about 10% more samples (data not shown) were below detection in the during-Olympics period compared with the pre-Olympics period, suggesting improved air quality was associated with lower concentrations of CRP.
Elevation of WBC count even within the normal range is a marker for increased cardiovascular disease risk. For each 1.0 × 10⁹/L increment in WBCs, cardiovascular disease risk increased by 32% in nonsmokers (Seaton et al. 1995). WBC increases have also been shown to occur acutely following exposure to fresh diesel exhaust (Seaton et al. 1999). In the present study, however, we observed small and nonsignificant increases in WBCs from the pre-Olympics period to the during-Olympics period and small and nonsignificant decreases in WBC from the during-Olympics to the post-Olympics periods (see Figure 10). Our findings on the directions of WBC changes in relation to the changes in overall air quality appear to be contrary to the hypothesis. However, the changes in this biomarker were not statistically significant and were relatively small. Our findings were in agreement with the null results (nonsignificant effects) from two short-term, experimental (chamber) studies with concentrated ambient particles or fresh diesel exhaust (Ghio et al. 2000, 2003) but were in contrast to another chamber study that showed that diesel exhaust exposure led to increased WBC counts (Salvi et al. 1999). In addition, our findings were in contrast to two observational studies that showed significant associations between WBC counts and air pollution (Seaton et al. 1999; Ruckerl et al. 2007).
We observed a marginally significant increase in lymphocyte counts from the pre-Olympics to the during-Olympics period and a significant reverse change from the during- to the post-Olympics period. As the change in lymphocyte counts associated with the change in air pollution exposure has not been previously reported, its biologic relevance cannot be readily determined.
Hemostasis Mechanism
Increased blood coagulation is another prominently hypothesized mechanism to explain the increased cardiorespiratory (especially cardiovascular) morbidity and mortality associated with air pollution (Brook et al. 2010). Platelet activation leading to thrombosis is now widely recognized to underlie acute complications of atherosclerosis such as unstable angina and myocardial infarction (Davi and Patrono 2007). While inflammation is acknowledged to be a key pathophysiologic mechanism for the initiation of acute thrombosis, direct activation of platelets by exposure to particulate air pollution may also occur (Trenga et al. 2006). Platelets normally circulate in the blood for 3 to 4 days in a resting state and form thrombi only after they are activated by exposure to an agonist such as the lipid core of arterial plaques or alpha-thrombin, or to some type of environmental stimuli such as exercise (Gold et al. 2000) or apneic sleep (Creason et al. 2001). Limited research has suggested that air pollution exposure (especially to PM) leads to increased platelet activation and platelet aggregation. For example, rodent and in vitro studies have demonstrated rapid platelet aggregation and thrombosis with intratracheal instillation of various ultrafine particles (Nemmar et al. 2002, 2003a, 2003b; Radomski et al. 2005). One observational study in older diabetics found a significant association between acute PM exposure and an increase in ex vivo measurement of platelet activation (Jacobs et al. 2010), while an experimental study with laboratory-controlled diesel exposure showed an increase in thrombus formation (Lucking et al. 2008). Positive associations between sCD62P and PM exposure have been reported in one observational study (Delfino et al. 2009) and one experimental study (Stewart et al. 2010), and sCD40L has been reported to increase in association with PM exposure (Ruckerl et al. 2006).
In the present study, we found a significant 34% reduction in sCD62P and a significant 5.7% reduction in sCD40L in the during-Olympics period compared with levels in the pre-Olympics period. Further, we found a significant 33.7% increase in sCD62P and a significant 9.1% increase in sCD40L from the during-Olympics to the post-Olympics period. Our findings on these two biomarkers, consistent with the previous findings described above, support the hypothesis that platelet activation is an important mechanism in mediating acute air pollution effects on cardiovascular risk and provide an attractive explanation for the previously reported triggering of myocardial infarction by exposure to ambient PM (Peters et al. 2001b, 2004; D’Ippoliti et al. 2003; Zanobetti and Schwartz 2005; Pope et al. 2006; Rich et al. 2010).
Elevated plasma vWF levels, reflecting endothelial dysfunction, have been linked to hemostasis as well as systemic inflammation (Zezos et al. 2005). Levels of vWF in the circulation were reported to increase 24 hours after exposure onset in an occupational study of police officers (Symons et al. 2006), although a controlled study reported no change in vWF after 1 hour of exposure to 300 μg/m3 diesel exhaust (Rich et al. 2004). In the present study, we found a significant decrease of 13% in vWF level from the pre- to the during-Olympics period but did not see a reverse change (increase) in this biomarker from the during- to the post-Olympics period. In contrast, for platelet aggregation, we found a significant 7.4% increase from the pre- to the during-Olympics period and a significant 41% reverse change (decrease) from the during-Olympics period to the post-Olympics period. The soluble platelet activation and platelet aggregation marker results appear to be in conflict, findings that will be discussed later in the section “Pollutant-Specific Effects.”
Oxidative Stress Mechanism
Much of the effort to identify a biochemical basis to explain both the acute and chronic effects of air pollution has been focused on the role of ROS (e.g., free radicals and peroxides) induced from exposure to air pollution, especially to certain constituents of PM (Nel 2005). The presence of ROS may lead to the generation of oxidative stress, and then proinflammatory effects, both local to (e.g., in the respiratory tract) and distant from (e.g., in the systemic circulation) the site of injury (Gilliland et al. 1999; Becker et al. 2005; Donaldson et al. 2005; Nel 2005).
Both EBC nitrite and EBC nitrate (or the sum of nitrite and nitrate) are products of the metabolic oxidation of NO, produced primarily in the lung by inducible nitric oxide synthase, reflecting levels of pulmonary oxidative and nitrosative stress (Hunt et al. 2000; Kostikas et al. 2002). ROS can react with lipids to form stable compounds such as 8-isoprostane. Increased levels of EBC nitrite and/ or nitrate and 8-isoprostane have been associated with asthma, chronic obstructive pulmonary disease, and cystic fibrosis (Corradi et al. 2003b; Kostikas et al. 2003; Robroeks et al. 2007; Barreto et al. 2009; Rihak et al. 2010). However, to the best of our knowledge, there have been no published studies reporting EBC nitrite and/or nitrate in relation to air pollution exposure and only one study reporting increases in EBC 8-isoprostane concentration associated with air pollution exposure in children with asthma (Liu et al. 2009).
In healthy adults, we found statistically significant reductions ranging from 17.6% to 30% in EBC nitrite, nitrate, and nitrate+nitrite during the Olympics air pollution intervention period compared with pre-Olympics levels (Figure 10). We also observed large and significant reverse changes (increases of 124% to 161%) for all three of these biomarkers in the post-Olympics period compared with during-Olympics levels. These changes are not likely due to changes in room NOx concentrations, based on a simple calculation, as follows. Even if all the NO2 molecules in the ambient air were absorbed in the airway when they were inhaled by the subject and were converted to nitrite and nitrate, the steady-state EBC concentration of nitrite+nitrate resulting from this source would account for only <0.1% of the nitrite+nitrate concentrations measured in the study. The fraction of above-detection samples for EBC 8-isoprostane was the lowest (44%) during the Olympics period compared with 68% in the pre-Olympics period and 74% in the post-Olympics period (Table 6). Our findings on all these EBC biomarkers support the hypothesis that air pollution exposure leads to an increased burden of oxidative stress in the respiratory tract.
ROS can oxidize DNA molecules to form stable products such as 8-OHdG. Increased 8-OHdG levels have been positively associated with premature mortality due to coronary heart disease (Collins et al. 1998) but negatively associated with total serum antioxidant capacity (Vassalle et al. 2004; Demirbag et al. 2005). Measurement of 8-OHdG in urine has been used to assess whole-body oxidative DNA damage and has been suggested by the National Institute of Environmental Health Sciences’s Biomarkers of Oxidative Stress Study to be a useful biomarker of systemic oxidative stress (Kadiiska et al. 2005). Previous studies have demonstrated an association between urinary 8-OHdG and exposure to ambient PM, especially ROS-inducing constituents of PM (e.g., transition metals and PAHs) (Ren et al. 2010; Wei et al. 2010). In the present study, we observed a large (58%) and statistically significant reduction in urinary 8-OHdG concentration from the pre- to the during-Olympics period and a very large (315%) reverse change (increase) from the during- to the post-Olympics period (Figure 10). This finding supports an association between lowered whole-body oxidative stress and improved air quality.
Although there is a considerable literature reporting associations between exposure to ambient PM and oxidative stress in children and adults with asthma or other cardiorespiratory diseases (Baraldi et al. 2003; Corradi et al. 2003a; Koenig et al. 2003; Adamkiewicz et al. 2004; Romieu et al. 2008), this study is the first to provide multi-biomarker evidence for PM acting through oxidative stress mechanisms in young and healthy adults both in the respiratory tract and systemically.
POLLUTANT-SPECIFIC EFFECTS
The findings from our “A-B-A” design, as discussed earlier, may reflect the effects of air pollution as a whole mixture, rather than the action of one or more isolated individual pollutants. It is also possible that the observed biomarker changes by period were due to factors other than air pollution. Hence, our panel analysis results on pollutant–biomarker relationships provide complementary and confirmatory evidence that the biomarker changes across the three periods were most likely attributable to air quality changes. We indeed observed a remarkable consistency in findings between the pollutant–biomarker association panel analysis and the period analysis, although this is not surprising from a statistical analysis perspective, because the period analysis and the pollutant–biomarker analysis were not independent (i.e., differences in pollutant concentrations between periods were correlated with daily pollutant concentrations). The biomarkers that showed large and significant period effects also showed strong and significant associations with all or most of the pollutants for multiple lag days. These included all the respiratory biomarkers (FeNO, EBC pH, nitrate, nitrite, and nitrite+nitrate), urinary 8-OHdG, both platelet activation markers (sCD62P and sCD40L), vWF, and platelet aggregation. When the period analysis showed a small and/or nonsignificant change for a particular biomarker, the pollutant–biomarker associations were usually either small or inconsistent across pollutants. For example, HRV indices did not change across periods and were associated with only a few pollutants (e.g., LF with PM2.5 only [data not shown]; HF with SO42− and NO2 [data not shown]; VLF with EC and SO42−; and SDNN with PM2.5, SO42−, OC, and NO2) at a few lag days. For those biomarkers that showed significant associations with some of the measured pollutants, a more in-depth analysis of PM composition and/or pollution sources may generate additional insights about source-specific or composition-specific effects. This may be done in future analyses of the PM composition data collected in this study (Appendix A), perhaps along with additional data on source profiles.
It has been of great interest, both from a scientific standpoint and from a regulatory perspective, which components of the air pollution mixture (e.g., gases vs. PM) and which constituents of PM are more toxic than others. We attempted to address this question through our pollutant–biomarker association analysis, but correlations among pollutants, due in part to the simultaneous shutting down of multiple pollutant sources during the Olympics and the subsequent relaxation of pollution controls, made it difficult to differentiate effects of specific pollutants. In particular, although we found statistically significant associations for most of the pollutants, including O3, with specific biomarkers, the associations with O3 were typically in the opposite direction. The seemingly “beneficial” effect of O3 on several biomarkers is likely due to the fact that O3 concentrations were increased while the other pollutants were substantially reduced during the Olympics air pollution intervention period and that O3 was negatively correlated with NO2 and other pollutants (e.g., CO, TPN, and EC). A similar, seemingly protective effect of O3 has also been observed in previous studies (Anderson et al. 1998; Hajat et al. 1999) probably for the same reason.
Potential Confounding from Copollutants
Given that many of the pollutants were correlated (see Table 5), we examined whether significant pollutant–biomarker associations from the single-pollutant models were independent of other pollutants. We ran two-pollutant models by including the second pollutant concentration at the lag of maximum effect from the significant single-pollutant model finding. We plotted the results, as shown in Appendix C. When adjusting for a second pollutant in the same model, we observed small changes in effect estimates for most of the pollutant–biomarker pairs, although the adjustment resulted in the loss of statistical significance for most of the pollutant–biomarker relationships. As shown in Appendix C, adjusting for a second pollutant did not change the statistical significance of the PM2.5 effects for the following five biomarkers: RBC, 8-OHdG, FeNO, nitrate, and sCD62P. This adjustment also left SO42− effects statistically significant for the following eight biomarkers: 8-OHdG, FeNO, EBC pH, 8-isoprostane, sCD62P, sCD40L, vWF, and SDNN. In contrast, adjusting for a second pollutant resulted in the loss of statistical significance for EC and OC effects for most biomarkers; EC effects remained significant only for RBC, EBC nitrate, and sCD62P, while OC effects remained significant only for vWF. After adjusting for a second pollutant, the TPN effects remained significant for the following six biomarkers: WBCs, 8-OHdG, FeNO, EBC nitrite+ nitrate, sCD62P, and vWF. Among the gaseous pollutants, the second-pollutant adjustment had the largest impact on the statistical significance of NO2 effects; however, only the effects of NO2 on RBC remained significant. In contrast, the statistical significance of the SO2 effects was sustained for the following nine biomarkers: LF/HF ratio, fibrinogen, lymphocytes, EBC nitrite, EBC nitrate, nitrite+ nitrate, EBC pH, sCD62P, and vWF. The CO effects remained statistically significant for the following three biomarkers: FeNO, sCD62P, and platelet aggregation. Interestingly, after adjusting for a second pollutant, the adverse effects of O3 (shown as a positive association between the pollutant and biomarker) remained statistically significant for FeNO, EBC nitrite, nitrate, and nitrite+nitrate (all bio-markers of pulmonary inflammation and oxidative stress), while the seemingly “protective” effects remained statistically significant for three cardiovascular-related biomarkers (SBP, sCD62P, and vWF). Although small changes were observed in the overall pattern of the associations and in the effect estimates, the loss of statistical significance by adjusting copollutants was substantial. It is intriguing to speculate on the reasons for these findings, and any interpretation needs to be augmented with additional insights from further data analyses (e.g., analyses relating source-specific pollutants or specific PM2.5 species, such as transition metals and PAHs, to specific biomarkers).
For the six biomarkers 8-OHdG, sCD62P, sCD40L, FeNO, EBC nitrite, and vWF, alternative two-pollutant models in which the lag for both pollutants was the same were compared with the two-pollutant models discussed above. The results are shown in Appendix F. We observed little or no difference in the results from these two different two-pollutant models.
Associations Contrary to Hypotheses
For a few biomarkers, we observed statistically significant associations with pollutants but in the direction opposite to that hypothesized. These include RBC, WBC, and platelet aggregation, each of which was negatively associated on multiple lag days with most of the pollutants except O3 (see Figures 17, 18, and 29, respectively). As discussed earlier, previous findings on associations between WBC or RBC with air pollution exposure are inconsistent (Seaton et al. 1999; Ghio et al. 2000, 2003; Ruckerl et al. 2007; Lucking et al. 2008), and our results add further complexity to this limited literature and may suggest that mechanisms other than inflammation and hemostasis are involved in the response to air pollution. For example, one controlled human exposure study has shown concentration–response reductions in blood hemoglobin in response to NO2 exposure with intermittent exercise (Frampton et al. 2002). High concentrations of NO2 are known to cause hemolysis (Frampton et al. 2002), and the negative association between RBC count and NO2 observed in the present study was particularly large in effect estimates, strong on statistical significance, and consistent across lag days (Figure 17). This finding, along with previous findings (Seaton et al. 1999; Frampton et al. 2002), suggests hemolysis as a potential mechanism by which air pollution may exert cardiovascular effects. Since this mechanism was not among the ones this study aimed to examine, we did not collect blood specimens that would allow us to investigate this further. Future studies of hemolysis as a possible mechanism underlying cardiovascular effects of air pollution are warranted.
Strikingly, our findings on the two soluble platelet activation markers (sCD40L and sCD62P) and on platelet aggregation appear to be in conflict. One experimental study (which measured both thrombosis and sCD62P) and one observational study demonstrated a rapid tendency toward increased coagulation following exposure to increased concentrations of PM (Lucking et al. 2008; Jacobs et al. 2010). Thus, some kind of compensatory mechanism to explain the contradiction does not seem likely. In our study, the aggregation with epinephrine was not done using the concentration of epinephrine most recently recommended for use in studies seeking hyperreactive (procoagulant) rather than bleeding tendency outcomes (Yee et al. 2005). However, we do not think this methodologic discrepancy is likely to lead to the paradoxical result we report in this study. We explored the possibility of pollutant-mediated platelet activation leading to fewer (inactivated) platelets available for aggregation (i.e., more prior platelet-activation aggregation leading to fewer resting platelets available to be aggregated). We re-ran our analytic models for PM2.5 and platelet aggregation with and without adjustment for sCD62P and sCD40L, but these adjustments made no appreciable difference in the results, not lending support to this explanation. We also explored whether there was increased platelet aggregation associated with pollutant concentrations in the few hours before the clinic visits for biomarker measurements (i.e., lag 0–2 or 0–5 hours), with compensatory aggregation reductions in the later hours in the first day (i.e., lags 6–23 hour), leading to an overall decreased aggregation response to pollution on lag day 0 (i.e., lags 0–23 hour). To assess this, we considered whether our 24-hour averages of pollutants might miss possible rapid effects on platelet aggregation that occurred over a few hours. Analyses of hourly pollution data, however, did not support this as an explanation, as there were no increased platelet aggregation effects observed for any 3-hour block of PM2.5 concentrations.
LAG PATTERNS AND TIMING OF ACTIONS
The present study focused on the acute effects of air pollution exposure. However, the meaning of “acute” (e.g., within hours, a day, or several days) is imprecise for any of the mechanistic pathways addressed in the present study. We used 24-hour average concentrations, measured from 1 to 7 days before biomarker measurement (lag days 0 to 6, respectively). (Because we used the real-time monitor to measure the gaseous pollutants and PM2.5, resulting in hourly measurement data, it is possible to evaluate their effects within a shorter time frame if such analyses are deemed necessary in the future.)
To help gain an overall picture about the timing of effects, we simplified most of the information presented in the figures and summarized it in Table 8. In the table, we just showed the lag day, among all the lag days, at which a pollutant was significantly associated with a biomarker in the hypothesized direction and had the largest effect estimate. As shown in Table 8, most of the biomarkers of pulmonary inflammation and oxidative stress (FeNO, EBC pH, EBC nitrite, and EBC nitrite+nitrate) showed the largest effect at early lag days (lag 0 and 1) for most of the pollutants. EBC nitrate, in contrast, usually showed the largest effect at later lag days (lags 4 or 5). The difference in the lag-day effects between EBC nitrite and nitrate suggests that the change from nitrite to nitrate in the respiratory tract through oxidation may take a few days. The bio-markers of systemic inflammation and hemostasis (i.e., fibrinogen, sCD62P, sCD40L, and vWF) showed the largest effect estimates at lag days 2 to 4 for PM2.5 and most PM species. Based on this overall lag-day pattern for local (respiratory tract) and systemic events, it is reasonable to hypothesize that inhaled PM2.5 deposits in the lung and rapidly triggers local inflammation and oxidative stress; these respiratory effects then induce systemic effects within a few days. However, it is important to note that a previous study found an effect of PM on platelet activation within 24 hours of exposure (Lucking et al. 2008).
Table 8.
Pollutant-Biomarker Associations That Had Largest Effect Estimates, Were Statistically Significant, and Moved in the Hypothesized Direction at Specified Lag Days
| Pollutant/Lag Day | Biomarker |
|---|---|
| PM2.5 | |
| 0 | FeNO, EBC pH, EBC nitrite, EBC nitrite+nitrate |
| 1 | Heart rate, 8-OHdG |
| 2 | Fibrinogen, sCD62P |
| 3 | SBP, 8-isoprostane, vWF |
| 4 | sCD40L |
| 5 | EBC nitrate |
| 6 | — |
| SO42− | |
| 0 | FeNO, EBC nitrite, EBC nitrite+nitrate, 8-isoprostane |
| 1 | EBC pH, 8-OHdG, Heart rate |
| 2 | sCD62P |
| 3 | vWF, sCD40L |
| 4 | — |
| 5 | — |
| 6 | — |
| EC | |
| 0 | FeNO, EBC pH, EBC nitrite, EBC nitrite+nitrate |
| 1 | 8-OHdG |
| 2 | Fibrinogen, sCD62P |
| 3 | SBP, vWF, Heart Rate |
| 4 | sCD40L |
| 5 | EBC nitrate |
| 6 | — |
| OC | |
| 0 | EBC pH, EBC nitrite, EBC nitrite+nitrate, SBP |
| 1 | vWF, 8-OHdG, sCD62P |
| 2 | Fibrinogen, sCD62P |
| 3 | Fibrinogen |
| 4 | FeNO, EBC nitrate |
| 5 | — |
| 6 | — |
| TPN | |
| 0 | FeNO, 8-isoprostane, sCD40L, sCD62P |
| 1 | EBC nitrate, EBC nitrite+nitrate, EBC pH, vWF |
| 2 | — |
| 3 | 8-OHdG, Heart rate |
| 4 | SBP |
| 5 | — |
| 6 | EBC nitrite |
| SO2 | |
| 0 | EBC nitrate |
| 1 | vWF, 8-OHdG, Heart rate |
| 2 | FeNO, sCD62P, EBC pH |
| 3 | EBC nitrite, EBC nitrite+nitrate, SBP |
| 4 | 8-isoprostane |
| 5 | sCD40L |
| 6 | Fibrinogen |
| CO | |
| 0 | FeNO, vWF |
| 1 | EBC nitrite, EBC nitrite+nitrate, sCD62P, SBP, 8-OHdG |
| 2 | — |
| 3 | — |
| 4 | 8-isoprostane |
| 5 | EBC pH, EBC nitrate |
| 6 | — |
| NO2 | |
| 0 | FeNO |
| 1 | EBC nitrite, sCD62P, 8-OHdG, EBC nitrite+nitrate |
| 2 | — |
| 3 | SBP, vWF |
| 4 | — |
| 5 | EBC pH, EBC nitrate |
| 6 | — |
The timing of systemic effects for TPN appears to be different from that for PM2.5, with most of the systemic inflammatory and hemostasis biomarkers showing the largest effects at lag days 0 and 1. This can be explained by the difference in particle size between PM2.5 and TPN. As shown in Figure 8, the period-average mass median particle diameters were between 363 nm to 423 nm, indicating that more than 50% of PM2.5 mass concentration resulted from particles larger than 363 nm. In contrast, TPN concentrations were dominated by ultrafine particles (i.e., particles smaller than 100 nm), which may be able to enter the circulation system directly. This makes it biologically plausible that ultrafine particles directly exert systemic effects without prior mediation through pulmonary events. For the three gaseous pollutants (SO2, CO, and NO2), we did not observe a clear distinction in timing (lag days) between the respiratory-effect biomarkers and the systemic-effect biomarkers (see Table 8), suggesting that gaseous pollutants, unlike PM2.5 mass, may not necessarily need to initiate pulmonary biochemical effects first before inducing systemic effects.
Some of the lag-day patterns are intriguing. For most biomarkers, there was a gradual increase in effect estimates in the early lag periods (lags 0–2), followed by a gradual decline in effect estimates to often negative effects (i.e., an increased pollutant concentration associated with decreased biomarker levels) in later lag periods. These negative effects could be due to compensatory mechanisms responding to the increases in the biomarker triggered by pollution at early lags. In the case of SBP (Figure 15), fibrinogen (Figure 16), and EBC nitrate (Figure 23), the direction of its association with pollutants appeared to bounce back and forth across lag days, suggesting this was simply reflecting random noise or perhaps a more complicated dynamic response. To have a better understanding of the timing, more sophisticated methods (e.g., physiologically based biokinetic modeling) are needed. Our initial observations, reported here, are intended to provide some insights that may lead to further understanding of the timing of biochemical events that underlie the adverse cardiorespiratory effects of air pollution through the mechanisms being examined in our study.
STRENGTHS, LIMITATIONS, AND SENSITIVITY ANALYSES
This study has several strengths including the combined use of a unique quasi-experimental “A-B-A” design and a panel-study approach and a large range of pollutant concentration measurements enabling enhanced power for detecting significant pollutant effects on biomarker levels. The vast majority of our subjects lived in dormitories where there were no cooking facilities, thus eliminating a major source of indoor air pollution. However, although our design ideally required that all study subjects reside and work on the Peking University First Hospital campus, in reality, although all the subjects indeed worked at the Hospital, only 8% (10 out of 125) lived in dormitories located on the hospital grounds. Most (105 out of 125, or 84%) of the subjects lived in the dormitories of Peking University Health Sciences Center, about 5 km away from the hospital; and the remaining 10 subjects (8%) lived in off-campus apartments that were not immediately adjacent to the hospital. Therefore, traffic exposure to air pollution during the commute for those who lived outside hospital grounds may not be captured accurately by pollutant concentrations measured at the fixed site in the center of the hospital campus. However, a sensitivity analysis including only the 105 subjects living on hospital grounds showed few changes in the results.
We did not measure pollutant concentrations at locations other than the hospital grounds, thereby possibly missing important exposures. However, this omission should result only in nondifferential exposure error and underestimates of pollutant-mediated biomarker changes, because the study design was based on within-person comparisons. In addition, we collected detailed time–activity data for each subject (see Appendix D), which will allow an assessment in the future of the potential impact of exposures associated with differential time–activities.
Our period-comparison (“A-B-A”) approach may raise the question of whether unmeasured factors other than air pollutants contributed to the observed changes in bio-markers. For this reason, we selected medical students undergoing clinical training who had no lifestyle changes during the Olympics. We selected a relatively narrow time window to minimize potential seasonal confounding on the effects of air pollution. Our pre-Olympics and during-Olympics measurements all occurred in the summer months, but the post-Olympics measurements fell in the early autumn season. For this reason, we included moving averages (up to 7 days) of temperature and RH as indicators of season. We also conducted a set of sensitivity analyses to examine the potential impact of temperature, RH, and rainfall on the period-effect results as well as on the pollutant–biomarker associations, as discussed below.
We defined pre-, during-, and post-Olympics periods based on the timeline of the pollution control measures for the Olympics. Due to temporal variations in meteorology, there existed days within the during-Olympics period on which pollutant concentrations were higher than in the pre- and post-Olympics periods. This may have increased the width of the confidence intervals for our period estimates. Excluding these during-Olympics “high-pollution” days from the analysis, however, had little impact on our overall findings.
Regarding our sensitivity analyses related to meteorology, Appendix E summarizes the degrees of freedom selected for each meteorologic parameter, as well as the P values showing whether temperature and RH and their moving averages were significantly associated with each biomarker. For biomarkers for which these meteorologic parameters were not statistically significant, we used unadjusted single-pollutant models (without controlling for temperature and RH). For the biomarkers for which not all adjustments for temperature and RH were nonsignificant, we re-ran the models, controlling for only the significant meteorologic parameters (including moving averages). The results are summarized in Appendix J for the period analysis and Appendix K for the pollutant–biomarker analysis, with the significance given in Appendix E. When temperature and RH results that had no significant effect on biomarkers were deleted from the models, the overall pollutant–biomarker pattern of results remained very similar for most of these biomarkers with a few notable exceptions (e.g., DBP and SBP). For the period analysis, a comparison of Figure 10 and Appendix J shows a change only in statistical significance but not in direction for LF (HRV) from the pre-Olympics to the during-Olympics period and increases in estimated changes for some HRV indices (HF, LF, SDNN, and total power) from the during- to the post-Olympics period. As expected, when temperature or RH itself had a statistically significant effect on a biomarker, the effect estimates from temperature- and RH-adjusted analyses were typically smaller and/or less likely to be statistically significant compared with the effect estimates from nonadjusted analyses. For this reason, we report all of our main results based on the adjusted analyses to avoid attributing temperature or RH effects to pollutant effects.
Results from sensitivity analyses excluding rainy days are summarized in Appendix L. As was expected, given that only 8% of the days had >1 mm precipitation, the results did not change substantially. And, as expected, the standard errors of the estimates were in general larger due to the reduction in sample size.
In our primary analyses, we accounted for unexplained sources of residual confounding by seasonal differences through the inclusion of moving averages of temperature and RH. It was expected that these moving averages would serve as proxies for things such as changes in social behavior due to changes in season as well as longer-term physiologic changes due to season. In addition, sensitivity analyses were conducted by excluding the post-Olympics period, because it represented the largest difference in seasonality. Both the pre- and during-Olympics periods occurred during the summer, and hence, we did not expect many seasonal differences between these two periods. Results from the single-pollutant models for the selected biomarkers when excluding the post-Olympics observations are summarized in Appendix M. Compared with the results from the analyses including all three periods, the biomarker that changed most notably was perhaps EBC nitrite, but this change was still not large enough to alter the overall finding on this biomarker. As expected, the reduced sample size in the two-period-only analysis resulted in wider confidence intervals for the effect estimates; however, it did not substantially change the main findings, confirming that it was unlikely that those findings were due to unmeasured factors associated with seasonal changes.
In an attempt to assess within-period effects of individual pollutants, we included the “period” indicator as a covariate in the single-pollutant models. Results from this set of analyses are shown in Appendix N for selected biomarkers. We observed, in general, reduced “within-period” effect estimates compared with the effect estimates when the “period” was not adjusted for, except for EBC nitrite+ nitrate for which this difference was less notable. The substantial attenuation, with little change in the confidence intervals, of the analyses with “period” indicator (Appendix N) was expected, given that changes in pollution levels were associated with period changes in this real-world quasi-experimental design. In the present study, we were mainly interested in finding pollutant–biomarker associations across a wide range of pollutant concentrations. In this regard, it is not necessary to adjust for the time period in the analyses. However, it may be interesting to explore the relative contributions of within-period versus between-period estimates to the overall effect estimates in future analyses.
Finally, the non-meteorologic sensitivity analysis using subject identification as a fixed effect showed attenuated effects of pollutants on biomarkers, but the trend remained largely the same as that seen with the effects estimated from the primary models using subject identification as a random effect (see Appendix O). This confirms the robustness of our primary models.
In summary, findings from these sensitivity analyses confirm that the statistical models used in our main analyses were robust. Changes in biomarker levels observed by period and in association with changes in pollutant concentrations were most likely driven by the air quality changes rather than seasonal differences in other unmeasured factors.
In this study, we measured a comprehensive battery of biomarkers reflecting multiple pathways. Many of these biomarkers (e.g., urinary 8-OHdG and EBC nitrite and nitrate) were measured using state-of-the-art analytical chemistry techniques. However, because of field resource constraints, some biomarkers (e.g., CRP, platelet aggregation, and EBC 8-isoprostane) were measured using “clinical-grade” methods, which were less sensitive or less accurate than “research-grade” analytical methods. Measurements of HRV over 10-minute periods are known to be far less sensitive than measurements taken over 24 hours (using a Holter ECG monitor), which would include measurements during all kinds of activities. However, requiring subjects to wear a monitor would have resulted in substantial recruiting difficulties.
In this study, we also measured a large suite of air pollutants including PM2.5, many PM2.5 constituents, size-resolved particle number concentrations, and commonly measured gases (SO2, CO, and NO2). However, particle number concentrations were measured from a separate site about 7 km away. Spatial variability in particle number may depend on specific particle size; and particle size may determine how far and how efficiently particles travel within and beyond the respiratory tract. Hence, future analyses should consider use of size-specific concentrations rather than the TPN measurements used in the current analysis.
Another obvious limitation of this report is the lack of more in-depth analysis of some important PM2.5 constituents, such as transition metals and PAHs, in relation to biomarkers, due to time and resource constraints. It would be interesting to investigate in future analysis whether changes in PM2.5 composition modify PM2.5 effects.
We examined the effects of various pollutants over a range of time windows (lag days 0 to 6). These analyses have generated some initial insights about whether and how different pollutants may affect different biomarkers within different time periods, which may lead to further understanding of the mechanisms involved. Future analyses of hourly data and PM speciation data may produce additional insights.
Unlike many previous studies of more susceptible subjects, such as children and older adults with or without preexisting cardiorespiratory disease, the present study used a homogeneous group of young adults who were free of any cardiorespiratory or other chronic diseases, had similar lifestyles, and were all ethnic Han Chinese. We observed statistically significant biomarker changes, in these young and healthy individuals, in response both to the air quality intervention (in our period comparisons) and to day-to-day changes in pollutant concentrations (in our pollutant–biomarker association analyses). Aside from blood pressure, these biomarker changes have not previously been shown to be cardiorespiratory risk factors and are not presently recognized as mediating or initiating clinical events. As such, our findings greatly increase understanding of the mechanisms by which air pollution enhances cardiorespiratory risk.
Compared with the “average” population, the medical residents measured in this study may have spent less time outdoors and more time in an indoor air-conditioned environment during work hours. This would have tended to lessen exposure to ambient air pollution and consequently lessen the impact of the changes in pollution concentrations during the Olympics.
The four mechanisms (autonomic dysfunction, oxidative stress, inflammation, and hemostasis) that were investigated in our study may be interrelated. For example, ROS characterizing oxidative stress may induce inflammation, and inflammatory mediators may engage in biochemical reactions that produce ROS. Inflammation contributes to the instability of pre-existing atherosclerotic plaques, and thrombosis, which is dependent on platelet activation, is responsible for arterial obstruction on top of any such ruptured plaques (hemostasis). Multiple biomarkers, such as were measured in this study, for each of these mechanisms may facilitate future investigations of any relationships among the mechanistic pathways related to the air pollution effects. As a starting point, we performed a simple analysis to examine correlations among the biomarkers measured in this study (see Appendix H). Since it is clear that HRV indices were moderately to highly correlated with each other, interpretation of the relations between the other biomarkers, even within the same mechanistic pathway, is not straightforward. There exist statistical and methodologic challenges at the present time to better addressing this issue. Statistical models incorporating biokinetics and/or biodynamics may help us better understand the complicated physiologic and biochemical processes involving the biomarkers measured in the current study.
APPENDIX H.
Spearman Correlation Coefficients Between Biomarker Pairs
| HR | HF | LF | LF/HF | rMSSD | SDNN | VLF | Total power |
DBP | SBP | CRP | Fibrinogen | RBCs | WBCs | Lymphocytes | Neutrophils | Urinary 8-OHdG | FeNO | EBC nitrite |
EBC nitrate |
EBC nitrite+nitrate |
EBC pH |
EBC 8-isoprostane |
sCD62P | sCD40L | Platelet aggregation |
|
|---|---|---|---|---|---|---|---|---|---|---|---|---|---|---|---|---|---|---|---|---|---|---|---|---|---|---|
| HF | −0.527 | 1 | ||||||||||||||||||||||||
| LF | −0.296 | 0.504 | 1 | |||||||||||||||||||||||
| LF/HF | 0.349 | −0.635 | 0.285 | 1 | ||||||||||||||||||||||
| rMSSD | −0.571 | 0.764 | 0.451 | −0.420 | 1 | |||||||||||||||||||||
| SDNN | −0.514 | 0.652 | 0.623 | −0.170 | 0.873 | 1 | ||||||||||||||||||||
| VLF | −0.205 | 0.182 | 0.396 | 0.136 | 0.241 | 0.462 | 1 | |||||||||||||||||||
| Total power | −0.465 | 0.768 | 0.764 | −0.176 | 0.662 | 0.783 | 0.652 | 1 | ||||||||||||||||||
| DBP | 0.184 | −0.214 | −0.001 | 0.243 | −0.211 | −0.121 | 0.015 | −0.095 | 1 | |||||||||||||||||
| SBP | 0.047 | −0.268 | 0.099 | 0.385 | −0.173 | −0.003 | 0.145 | −0.026 | 0.619 | 1 | ||||||||||||||||
| CRP | 0.065 | −0.107 | −0.015 | 0.110 | −0.091 | −0.066 | 0.034 | −0.052 | 0.230 | 0.237 | 1 | |||||||||||||||
| Fibrinogen | 0.150 | 0.001 | −0.121 | −0.119 | −0.082 | −0.125 | −0.068 | −0.071 | 0.042 | −0.087 | 0.336 | 1 | ||||||||||||||
| RBC | −0.015 | −0.218 | 0.117 | 0.357 | −0.045 | 0.111 | 0.220 | 0.018 | 0.284 | 0.510 | 0.183 | −0.195 | 1 | |||||||||||||
| WBC | 0.086 | 0.061 | 0.080 | −0.002 | −0.011 | −0.012 | −0.004 | 0.053 | 0.101 | 0.090 | 0.193 | 0.125 | 0.053 | 1 | ||||||||||||
| Lymphocytes | −0.034 | 0.032 | 0.054 | −0.011 | −0.009 | −0.025 | −0.028 | 0.015 | 0.076 | 0.007 | 0.087 | −0.037 | 0.082 | 0.519 | 1 | |||||||||||
| Neutrophils | 0.129 | 0.059 | 0.067 | −0.006 | −0.011 | −0.005 | −0.010 | 0.048 | 0.111 | 0.108 | 0.173 | 0.177 | 0.022 | 0.921 | 0.202 | 1 | ||||||||||
| Urine 8-OHdG | 0.041 | −0.043 | −0.017 | 0.032 | −0.015 | −0.045 | 0.071 | −0.018 | −0.012 | −0.030 | −0.023 | 0.043 | −0.100 | −0.007 | 0.027 | −0.038 | 1 | |||||||||
| FeNO | −0.049 | −0.017 | 0.020 | 0.023 | 0.008 | 0.059 | 0.077 | 0.042 | 0.048 | 0.153 | −0.013 | 0.044 | 0.095 | 0.007 | −0.141 | 0.058 | −0.015 | 1 | ||||||||
| EBC nitrite | −0.032 | 0.045 | 0.117 | 0.053 | 0.071 | 0.077 | 0.085 | 0.095 | −0.019 | 0.008 | 0.060 | −0.080 | 0.041 | 0.013 | −0.010 | 0.005 | 0.003 | 0.087 | 1 | |||||||
| EBC nitrate | −0.027 | 0.014 | −0.008 | −0.031 | −0.003 | 0.007 | 0.029 | 0.027 | −0.001 | 0.044 | 0.029 | 0.105 | 0.006 | −0.018 | 0.026 | −0.030 | 0.024 | 0.077 | 0.004 | 1 | ||||||
| EBC nitrite+nitrate | −0.062 | 0.074 | 0.067 | −0.023 | 0.057 | 0.068 | 0.096 | 0.101 | −0.015 | 0.041 | 0.073 | 0.073 | 0.015 | −0.005 | −0.013 | −0.010 | 0.028 | 0.142 | 0.666 | 0.648 | 1 | |||||
| EBC pH | −0.044 | −0.006 | 0.013 | 0.013 | 0.005 | 0.047 | 0.060 | 0.050 | 0.020 | 0.026 | −0.057 | 0.024 | 0.090 | −0.045 | −0.057 | −0.021 | −0.069 | 0.005 | 0.023 | −0.003 | 0.079 | 1 | ||||
| EBC 8-isoprostane | 0.004 | 0.034 | 0.009 | −0.025 | −0.012 | −0.007 | −0.001 | 0.036 | 0.026 | −0.011 | 0.005 | 0.063 | −0.054 | −0.031 | −0.026 | −0.043 | 0.023 | 0.115 | 0.040 | 0.081 | 0.118 | 0.055 | 1 | |||
| sCD62P | 0.010 | 0.015 | 0.033 | 0.022 | 0.014 | 0.015 | 0.029 | 0.028 | −0.011 | −0.021 | −0.100 | −0.047 | 0.019 | −0.008 | 0.022 | −0.030 | 0.117 | 0.184 | 0.125 | 0.088 | 0.102 | −0.068 | 0.100 | 1 | ||
| sCD40L | 0.000 | 0.011 | 0.018 | 0.010 | 0.021 | 0.027 | −0.024 | 0.021 | 0.048 | 0.031 | 0.050 | 0.033 | −0.014 | −0.012 | −0.054 | 0.001 | 0.055 | 0.094 | −0.047 | 0.113 | 0.047 | −0.029 | 0.051 | 0.072 | 1 | |
| Platelet aggregation | 0.026 | 0.050 | −0.058 | −0.100 | 0.044 | 0.004 | −0.087 | −0.042 | −0.125 | −0.264 | 0.015 | 0.095 | −0.199 | −0.042 | −0.037 | −0.045 | −0.033 | −0.117 | −0.072 | −0.009 | −0.035 | 0.021 | 0.064 | −0.080 | −0.007 | 1 |
| vWF | 0.101 | −0.137 | −0.049 | 0.122 | −0.123 | −0.104 | 0.034 | −0.079 | −0.023 | −0.075 | 0.173 | 0.084 | 0.069 | −0.049 | −0.062 | −0.070 | 0.066 | 0.043 | 0.145 | −0.033 | 0.089 | −0.008 | 0.010 | 0.073 | −0.047 | 0.062 |
CONCLUSIONS
Taking advantage of a unique opportunity during which the Chinese government mandated temporary closures or relocations of industry and reductions in motor vehicle use during the 2008 Beijing Olympics, we examined whether there were reductions in pollutant concentrations and improvements in biomarkers reflecting pathophysiologic pathways hypothesized to underlie epidemiologic associations between ambient air pollution and cardio-respiratory morbidity and mortality. We observed large (up to 60%) reductions in pollutants (except O3) during the Olympics pollution intervention period compared with the pre-Olympics period. Concomitantly, in a panel of healthy, young, and nonsmoking adults, we observed salutary changes, many of them statistically significant, in measures of cardiovascular physiology (HR and SBP), biomarkers of pulmonary inflammation and oxidative stress (FeNO; EBC nitrite, nitrate, nitrite+nitrate, and pH; and 8-isoprostane), biomarkers of systemic inflammation and oxidative stress (fibrinogen, vWF, and urinary 8-OHdG), and biomarkers of hemostasis (including biomarkers of platelet activation [sCD40L and sCD62P] and vWF). In the post-Olympics period, when the pollution control measures were relaxed, mean concentrations for most of the pollutants (except O3 and SO42− in PM2.5) increased, and the improvement of most biomarkers reversed. Consistent with these findings from the period comparisons, the biomarkers that showed significant period changes also showed significant associations with multiple pollutants after we adjusted for meteorologic parameters and after we considered other potential confounders in the sensitivity analyses. For most of the biomarkers the associations were in the direction (an increase or decrease with increases in pollutant concentration) hypothesized, providing further evidence that the period effects were due to changes in air quality, independent of season and meteorologic conditions.
These findings suggest that air pollution acutely and adversely affects cardiorespiratory health via pulmonary and systemic inflammation, oxidative stress, and hemostasis, and by increasing HR and blood pressure, in healthy young adults. These findings are of uncertain clinical significance at the present time.
IMPLICATION OF FINDINGS
Epidemiologic studies showing associations between air pollution and cardiorespiratory mortality and morbidity have been largely conducted in the elderly and those with cardiorespiratory diseases, but we observed biomarker changes linking air pollution with disease pathways in a homogeneous group of healthy young adults who had similar lifestyles and no known indoor exposures. This, along with the fact that our findings are supported by both a quasi-experimental analysis (period comparison) and a panel-study analysis (pollutant–biomarker associations), greatly increases the certainty in the mechanisms or pathways by which air pollution affects cardiorespiratory health, independent of commonly recognized risk factors (e.g., age and predisposing diseases).
Our findings have broad public health implications, suggesting that improvements in air quality not only benefit susceptible populations as shown in previous studies, but also can reduce the body burden of oxidative stress, inflammation, and blood coagulation, as well as lower HR and SBP, in healthy young people. Because the pathways under study are thought to play a role in many other diseases, even natural aging, our findings provide mechanistic data to possibly support a previous assessment that air quality improvement over the last decades, thanks to air pollution regulations, accounts for as much as a 15% overall increase in life expectancy (some 5 to 10 months) in U.S. metropolitan areas (Pope et al. 2009). Given that current air pollution levels in many megacities, such as Beijing, are similar to those measured in U.S. cities before air quality regulations were enacted (HEI 2010), aggressive interventions are likely to have public health benefits. Salutary changes in biomarkers, including two well-established cardiovascular risk factors (HR and BP) observed in this study, support confidence in the immediate efficacy of actions to improve air quality. On the other hand, the reversed biomarker changes after the Olympics suggest that sustained air pollution interventions will be necessary to continue public health benefits.
Acknowledgments
Although this document was produced with partial funding by the United States Environmental Protection Agency under Assistance Award CR–83467701 to the Health Effects Institute, it has not been subjected to the Agency’s peer and administrative review and therefore may not necessarily reflect the views of the Agency, and no official endorsement by it should be inferred.
We are very grateful to those volunteers who took part in this study and to Dr. Shuo Xing, Dr. Liwen Zhang, Ms. Jessica Small, Ms. Jing Fu, Mr. Hong Cheng, Dr. Weiwei Lin, Dr. Lin Zhang, Ms. Prethibha George, Mr. Henock Solomon, Mr. Qingfeng Guo, Mr. Yiqun Han, and other staff and students who helped with the sample collection or data analysis. This study was also partially supported by the National Institute of Environmental Health Sciences (1R01 ES015864, P30ES005022, and 5P30ES007048), the Beijing Environment Protection Bureau (OITC-G08026056), and the Beijing Council of Science and Technology (HB 200504-6 and HB200504-2).
ABBREVIATIONS AND OTHER TERMS
- 8-OHdG
8-hydroxy-2′-deoxyguanosine
- ACF
autocorrelation function
- ADR
adrenaline
- AIC
Akaike Information Criterion
- ATS/ERS
American Thoracic Society/European Respiratory Society
- BP
blood pressure
- CRP
C-reactive protein
- DBP
diastolic blood pressure
- EBC
exhaled breath condensate
- EC
elemental carbon
- ECD
electrochemical detection
- ECG
electrocardiography
- EDTA
ethylenediaminetetraacetic acid
- ELISA
enzyme-linked immunosorbent assay
- eNO
exhaled nitric oxide
- FeNO
fractional exhaled nitric oxide
- GC–MS
gas chromatography–mass spectroscopy
- HEART
Health Effects of an Air Pollution Reduction Trial
- HF
high frequency power (0.15–0.40Hz)
- HPLC
high performance liquid chromatography
- HR
heart rate
- HRP
horseradish peroxidase
- HRV
heart rate variability
- IC
ion chromatography
- ICP–MS
inductively coupled plasma mass spectrometer
- IQR
inter-quartile range
- IRB
institutional review board
- LF
low frequency power (0.04–0.15 Hz)
- OC
organic carbon
- OM
organic matter
- PAH
polycyclic aromatic hydrocarbon
- PM
particulate matter
- PM1
particulate matter ≤ 1 μm in aerodynamic diameter, or ultrafine particles
- PM2.5
PM ≤ 2.5 μm in aerodynamic diameter
- PM10
particulate matter ≤ 10 μm in aerodynamic diameter
- PPP
platelet-poor plasma
- PRP
platelet-rich plasma
- RBC
red blood cell
- RFPA
request for preliminary applications
- RH
relative humidity
- rMSSD
root mean square of successive differences between adjacent normal cycles (successive NN intervals)
- ROS
reactive oxygen species
- SBP
systolic blood pressure
- sCD40L
soluble CD40 ligand
- sCD62P
P-selectin
- SDNN
standard deviation of normal to normal (R–R intervals)
- SMPS
scanning mobility particle sizer
- TDMPS
twin differential mobility particle sizer
- TEOM
tapered element oscillating microbalance
- TMB
tetramethylbenzidine
- TPN
total particle number
- UMDNJ
University of Medicine and Dentistry of New Jersey
- U.S. EPA
U.S. Environmental Protection Agency
- VLF
very low frequency power (0.003–0.04 Hz)
- vWF
von Willebrand factor
- WBC
white blood cell
COMPOUNDS, IONS, AND ELEMENTS
- Al
aluminum
- As
arsenic
- Ba
barium
- Ca/Ca2+
calcium/calcium ion
- Cd
cadmium
- Cl−
chloride
- CO
carbon monoxide
- Co
cobalt
- Cr
chromium
- Cu
copper
- F−
fluoride
- Fe
iron
- H2SO4
sulfuric acid
- K/K+
potassium/potassium ion
- Mg/Mg2+
magnesium/magnesium ion
- Mn
manganese
- Mo
molybdenum
- Na/Na+
sodium/sodium ion
- NH4+
ammonium
- Ni
nickel
- NO
nitric oxide
- NO2
nitrogen dioxide
- NOx
nitrogen oxides
- O3
ozone
- O3 max
maximum 1-hour average O3 concentration within a 24-hour period
- P
phosphorus
- Pb
lead
- Se
selenium
- SO2
sulfur dioxide
- SO42−
sulfate
- Th
thorium
- Ti
titanium
- Tl
thallium
- TPN
total particle number
- U
uranium
- V
vanadium
- Zn
zinc
Biographies
Junfeng (Jim) Zhang, Ph.D., was a professor in the Department of Environmental and Occupational Health at the University of Medicine and Dentistry of New Jersey–School of Public Health while this research was conducted. He is currently a professor of environmental and global health in the Department of Preventive Medicine, and director of the Environmental and Biomarkers Analysis Laboratory (EBAL) in the Keck School of Medicine at the University of Southern California, Los Angeles, Calif., U.S.A.
Tong Zhu, Ph.D., is Cheung Kong Scholar Program chair professor at the State Key Laboratory of Environmental Simulation and Pollution Control, College of Environmental Sciences and Engineering, at Peking University, Beijing, China.
Howard Kipen, M.D., M.P.H., is professor of environmental and occupational medicine, and chief of the Clinical Research and Occupational Medicine Division at the Environmental and Occupational Health Sciences Institute, University of Medicine and Dentistry of New Jersey–Robert Wood Johnson Medical School and Rutgers University, Piscataway, N.J., U.S.A.
Guangfa Wang, M.D., Ph.D., F.C.C.P., is professor at the Department of Pulmonary Medicine, Peking University First Hospital, Beijing, China.
Wei Huang, Ph.D., is an associate professor at the Center for Environment and Health, College of Environmental Sciences and Engineering, Peking University, Beijing, China.
David Rich, Sc.D., is an assistant professor of Epidemiology in the Department of Community and Preventive Medicine, Division of Epidemiology, University of Rochester–School of Medicine and Dentistry, Rochester, N.Y., U.S.A.
Ping Zhu, M.D., is a professor and director of the Clinical Genetics Center, and Laboratory of Hematology, Peking University First Hospital, Beijing, China.
Yuedan Wang, M.D., is an associate professor and vice chair of the Department of Immunology, Peking University Health Science Center, Beijing, China.
Shou-En Lu, Ph.D., is an associate professor of biostatistics at the University of Medicine and Dentistry of New Jersey–School of Public Health, Piscataway, N.J., U.S.A.
Pamela Ohman-Strickland, Ph.D., is an associate professor of biostatistics at the University of Medicine and Dentistry of New Jersey–School of Public Health, Piscataway, N.J., U.S.A.
Scott Diehl, Ph.D., is professor in the Department of Oral Biology, and director of the Center for Pharmacogenomics and Complex Disease Research at the University of Medicine and Dentistry of New Jersey–New Jersey Dental School, Newark, N.J., U.S.A.
Min Hu, Ph.D., is professor and director of the State Key Laboratory of Environmental Simulation and Pollution Control, College of Environmental Sciences and Engineering, Peking University, Beijing, China.
Jian Tong, M.S., is a research analyst at the Center for State Health Policy, Rutgers University, Piscataway, N.J., U.S.A.
Jicheng Gong, Ph.D., is a postdoctoral fellow at the Keck School of Medicine, University of Southern California, Los Angeles, Calif., U.S.A.
Duncan Thomas, Ph.D., is a professor of biostatistics in the Department of Preventive Medicine, Keck School of Medicine, University of Southern California, Los Angeles, Calif., U.S.A.
APPENDIX A. PM2.5 Constituent Concentration Summary Statistics
Table A.1.
Ions in PM2.5a
| Pollutant/Period | n | Mean | SD | Min | Median | Max | IQR |
|---|---|---|---|---|---|---|---|
| Na+ (μg/m3) | |||||||
| Whole period | 92 | 2.5 × 10⁻¹ | 1.6 × 10⁻¹ | 2.0 × 10⁻² | 2.3 × 10⁻¹ | 7.7 × 10⁻¹ | 1.7 × 10⁻¹ |
| Pre-Olympics | 35 | 2.8 × 10⁻¹ | 1.2 × 10⁻¹ | 8.0 × 10⁻² | 2.7 × 10⁻¹ | 6.5 × 10⁻¹ | 1.3 × 10⁻¹ |
| During-Olympics | 28 | 1.8 × 10⁻¹ | 1.2 × 10⁻¹ | 2.0 × 10⁻² | 1.4 × 10⁻¹ | 5.0 × 10⁻¹ | 1.8 × 10⁻¹ |
| Post-Olympics | 29 | 2.8 × 10⁻¹ | 2.1 × 10⁻¹ | 4.0 × 10⁻² | 2.2 × 10⁻¹ | 7.7 × 10⁻¹ | 3.4 × 10⁻¹ |
| NH4+ (μg/m3) | |||||||
| Whole period | 92 | 1.4 × 101 | 1.1 × 101 | 2.0 × 10⁻¹ | 1.3 × 101 | 4.8 × 101 | 1.9 × 101 |
| Pre-Olympics | 35 | 1.9 × 101 | 9.8 × 100 | 2.3 × 100 | 1.8 × 101 | 4.8 × 101 | 1.1 × 101 |
| During-Olympics | 28 | 1.3 × 101 | 1.1 × 101 | 7.8 × 10⁻¹ | 1.1 × 101 | 4.2 × 101 | 1.8 × 101 |
| Post-Olympics | 29 | 8.3 × 100 | 1.0 × 101 | 2.0 × 10⁻¹ | 2.5 × 100 | 3.4 × 101 | 1.2 × 101 |
| K+ (μg/m3) | |||||||
| Whole period | 92 | 1.2 × 100 | 9.5 × 10⁻¹ | 9.0 × 10⁻² | 9.0 × 10⁻¹ | 4.8 × 100 | 1.4 × 100 |
| Pre-Olympics | 35 | 1.7 × 100 | 1.1 × 100 | 3.7 × 10⁻¹ | 1.6 × 100 | 4.8 × 100 | 1.3 × 100 |
| During-Olympics | 28 | 7.0 × 10⁻¹ | 4.5 × 10⁻¹ | 9.0 × 10⁻² | 6.6 × 10⁻¹ | 2.0 × 100 | 6.5 × 10⁻¹ |
| Post-Olympics | 29 | 1.1 × 100 | 8.5 × 10⁻¹ | 1.4 × 10⁻¹ | 8.2 × 10⁻¹ | 2.8 × 100 | 1.5 × 100 |
| Mg2+ (μg/m3) | |||||||
| Whole period | 92 | 5.0 × 10⁻² | 6.0 × 10⁻² | 1.0 × 10⁻² | 4.0 × 10⁻² | 3.8 × 10⁻¹ | 3.0 × 10⁻² |
| Pre-Olympics | 35 | 4.0 × 10⁻² | 2.0 × 10⁻² | 1.0 × 10⁻² | 4.0 × 10⁻² | 1.1 × 10⁻¹ | 2.0 × 10⁻² |
| During-Olympics | 28 | 4.0 × 10⁻² | 2.0 × 10⁻² | 1.0 × 10⁻² | 3.0 × 10⁻² | 9.0 × 10⁻² | 2.0 × 10⁻² |
| Post-Olympics | 29 | 9.0 × 10⁻² | 9.0 × 10⁻² | 2.0 × 10⁻² | 6.0 × 10⁻² | 3.8 × 10⁻¹ | 4.0 × 10⁻² |
| Ca2+ (μg/m3) | |||||||
| Whole period | 92 | 6.0 × 10⁻¹ | 8.9 × 10⁻¹ | 1.0 × 10⁻¹ | 4.2 × 10⁻¹ | 6.0 × 100 | 3.0 × 10⁻¹ |
| Pre-Olympics | 35 | 4.3 × 10⁻¹ | 2.8 × 10⁻¹ | 1.2 × 10⁻¹ | 3.8 × 10⁻¹ | 1.7 × 100 | 2.7 × 10⁻¹ |
| During-Olympics | 28 | 3.5 × 10⁻¹ | 1.5 × 10⁻¹ | 1.0 × 10⁻¹ | 3.3 × 10⁻¹ | 6.7 × 10⁻¹ | 2.0 × 10⁻¹ |
| Post-Olympics | 29 | 1.1 × 100 | 1.5 × 100 | 1.2 × 10⁻¹ | 6.3 × 10⁻¹ | 6.0 × 100 | 3.6 × 10⁻¹ |
| F− (μg/m3) | |||||||
| Whole period | 92 | 2.0 × 10⁻² | 3.0 × 10⁻² | 0.0 × 100 | 1.0 × 10⁻² | 2.2 × 10⁻¹ | 2.0 × 10⁻² |
| Pre-Olympics | 35 | 2.0 × 10⁻² | 1.0 × 10⁻² | 0.0 × 100 | 1.0 × 10⁻² | 8.0 × 10⁻² | 1.0 × 10⁻² |
| During-Olympics | 28 | 1.0 × 10⁻² | 1.0 × 10⁻² | 0.0 × 100 | 1.0 × 10⁻² | 3.0 × 10⁻² | 1.0 × 10⁻² |
| Post-Olympics | 29 | 4.0 × 10⁻² | 5.0 × 10⁻² | 0.0 × 100 | 3.0 × 10⁻² | 2.2 × 10⁻¹ | 2.0 × 10⁻² |
| Cl− (μg/m3) | |||||||
| Whole period | 92 | 9.3 × 10⁻¹ | 8.8 × 10⁻¹ | 2.0 × 10⁻² | 7.0 × 10⁻¹ | 3.5 × 100 | 1.1 × 100 |
| Pre-Olympics | 35 | 1.3 × 100 | 9.9 × 10⁻¹ | 8.0 × 10⁻² | 1.2 × 100 | 3.5 × 100 | 9.8 × 10⁻¹ |
| During-Olympics | 28 | 4.5 × 10⁻¹ | 5.1 × 10⁻¹ | 2.0 × 10⁻² | 2.3 × 10⁻¹ | 2.3 × 100 | 6.1 × 10⁻¹ |
| Post-Olympics | 29 | 8.9 × 10⁻¹ | 8.1 × 10⁻¹ | 5.0 × 10⁻² | 6.9 × 10⁻¹ | 2.5 × 100 | 1.1 × 100 |
| NO3− (μg/m3) | |||||||
| Whole period | 92 | 1.5 × 101 | 1.3 × 101 | 1.8 × 10⁻¹ | 1.2 × 101 | 5.5 × 101 | 1.8 × 101 |
| Pre-Olympics | 35 | 1.9 × 101 | 1.0 × 101 | 1.7 × 100 | 1.8 × 101 | 4.0 × 101 | 1.6 × 101 |
| During-Olympics | 28 | 9.1 × 100 | 7.2 × 100 | 1.8 × 10⁻¹ | 7.4 × 100 | 2.3 × 101 | 1.1 × 101 |
| Post-Olympics | 29 | 1.7 × 101 | 1.9 × 101 | 3.7 × 10⁻¹ | 6.1 × 100 | 5.5 × 101 | 2.7 × 101 |
| SO42− (μg/m3) | |||||||
| Whole period | 92 | 2.2 × 101 | 1.7 × 101 | 9.5 × 10⁻¹ | 2.1 × 101 | 7.4 × 101 | 2.8 × 101 |
| Pre-Olympics | 35 | 2.8 × 101 | 1.3 × 101 | 5.4 × 100 | 3.0 × 101 | 6.5 × 101 | 1.7 × 101 |
| During-Olympics | 28 | 2.3 × 101 | 1.9 × 101 | 2.0 × 100 | 2.1 × 101 | 7.4 × 101 | 3.2 × 101 |
| Post-Olympics | 29 | 1.2 × 101 | 1.5 × 101 | 9.5 × 10⁻¹ | 4.8 × 100 | 4.8 × 101 | 1.6 × 101 |
All samples were above detection limit. Summary statistics are based on 24-hour averages (from ~10 AM to ~10 AM next day).
Table A.2.
PAHs in PM2.5a
| Pollutant/Period | n | %b | Mean | SD | Min | Median | Max | IQR |
|---|---|---|---|---|---|---|---|---|
| Acenaphthylene (ng/m3) | ||||||||
| Whole period | 94 | 94 | 3.4 | 3.0 | 0.0 | 2.3 | 15.3 | 3.3 |
| Pre-Olympics | 35 | 83 | 4.9 | 3.7 | 0.0 | 4.8 | 15.3 | 4.7 |
| During-Olympics | 28 | 100 | 3.6 | 2.6 | 1.0 | 2.7 | 11.7 | 2.6 |
| Post-Olympics | 31 | 100 | 1.6 | 0.9 | 0.5 | 1.5 | 5.7 | 1.0 |
| Fluorene (ng/m3) | ||||||||
| Whole period | 94 | 89 | 0.6 | 0.6 | 0.0 | 0.7 | 2.3 | 1.0 |
| Pre-Olympics | 35 | 74 | 1.0 | 0.7 | 0.0 | 1.3 | 2.3 | 1.3 |
| During-Olympics | 28 | 96 | 0.8 | 0.3 | 0.0 | 0.8 | 1.2 | 0.4 |
| Post-Olympics | 31 | 100 | 0.1 | 0.0 | 0.1 | 0.1 | 0.3 | 0.0 |
| Phenanthrene (ng/m3) | ||||||||
| Whole period | 94 | 100 | 1.6 | 1.1 | 0.2 | 1.5 | 4.8 | 1.9 |
| Pre-Olympics | 35 | 100 | 2.5 | 0.8 | 1.0 | 2.4 | 4.8 | 0.8 |
| During-Olympics | 28 | 100 | 1.7 | 0.5 | 1.0 | 1.6 | 2.5 | 0.8 |
| Post-Olympics | 31 | 100 | 0.4 | 0.1 | 0.2 | 0.3 | 0.6 | 0.2 |
| Fluoranthene (ng/m3) | ||||||||
| Whole period | 94 | 100 | 4.8 | 3.7 | 0.5 | 3.4 | 17.6 | 4.7 |
| Pre-Olympics | 35 | 100 | 7.8 | 3.7 | 2.1 | 7.0 | 17.6 | 3.5 |
| During-Olympics | 28 | 100 | 4.3 | 2.4 | 1.2 | 3.6 | 11.1 | 3.1 |
| Post-Olympics | 31 | 100 | 1.8 | 0.9 | 0.5 | 1.8 | 3.5 | 1.5 |
| Pyrene (ng/m3) | ||||||||
| Whole period | 94 | 98 | 2.0 | 1.5 | 0.0 | 1.7 | 6.7 | 1.9 |
| Pre-Olympics | 35 | 100 | 3.2 | 1.5 | 1.0 | 2.9 | 6.7 | 1.6 |
| During-Olympics | 28 | 93 | 1.8 | 1.1 | 0.0 | 1.7 | 4.8 | 1.4 |
| Post-Olympics | 31 | 100 | 0.8 | 0.4 | 0.2 | 0.8 | 1.5 | 0.6 |
| Benzo[a]anthracene (ng/m3) | ||||||||
| Whole period | 94 | 97 | 1.4 | 1.0 | 0.0 | 1.2 | 4.8 | 1.1 |
| Pre-Olympics | 35 | 91 | 1.9 | 1.2 | 0.0 | 1.7 | 4.8 | 1.3 |
| During-Olympics | 28 | 100 | 1.1 | 0.8 | 0.2 | 0.9 | 3.3 | 1.0 |
| Post-Olympics | 31 | 100 | 1.1 | 0.6 | 0.2 | 1.0 | 2.6 | 0.9 |
| Chrysene (ng/m3) | ||||||||
| Whole period | 94 | 100 | 2.6 | 2.0 | 0.2 | 2.0 | 8.8 | 2.4 |
| Pre-Olympics | 35 | 100 | 4.2 | 2.0 | 1.1 | 3.8 | 8.8 | 2.1 |
| During-Olympics | 28 | 100 | 2.4 | 1.8 | 0.3 | 2.0 | 6.9 | 1.7 |
| Post-Olympics | 31 | 100 | 1.2 | 0.6 | 0.2 | 1.2 | 2.7 | 0.9 |
| Benzo[b]fluoranthene (ng/m3) | ||||||||
| Whole period | 94 | 100 | 13.2 | 9.9 | 0.7 | 10.0 | 45.6 | 10.5 |
| Pre-Olympics | 35 | 100 | 20.0 | 10.2 | 4.2 | 17.4 | 45.6 | 10.1 |
| During-Olympics | 28 | 100 | 12.1 | 8.9 | 2.8 | 10.4 | 37.3 | 10.6 |
| Post-Olympics | 31 | 100 | 6.5 | 3.5 | 0.7 | 7.4 | 17.2 | 4.8 |
| Benzo[k]fluoranthene (ng/m3) | ||||||||
| Whole period | 94 | 99 | 1.5 | 0.9 | 0.0 | 1.4 | 4.5 | 1.1 |
| Pre-Olympics | 35 | 97 | 1.9 | 1.0 | 0.0 | 1.8 | 4.5 | 1.1 |
| During-Olympics | 28 | 100 | 1.1 | 0.8 | 0.3 | 1.0 | 3.4 | 0.8 |
| Post-Olympics | 31 | 100 | 1.4 | 0.7 | 0.2 | 1.5 | 3.5 | 1.0 |
| Benzo[e]pyrene (ng/m3) | ||||||||
| Whole period | 94 | 100 | 5.5 | 4.9 | 0.1 | 4.3 | 20.9 | 6.3 |
| Pre-Olympics | 35 | 100 | 9.0 | 4.6 | 1.7 | 7.8 | 20.9 | 4.6 |
| During-Olympics | 28 | 100 | 5.8 | 4.4 | 1.4 | 4.9 | 19.4 | 5.0 |
| Post-Olympics | 31 | 100 | 1.2 | 0.7 | 0.1 | 1.2 | 3.0 | 0.9 |
| Benzo[a]pyrene (ng/m3) | ||||||||
| Whole period | 94 | 100 | 2.7 | 1.6 | 0.3 | 2.6 | 7.5 | 2.2 |
| Pre-Olympics | 35 | 100 | 3.0 | 1.6 | 0.6 | 2.6 | 6.7 | 1.7 |
| During-Olympics | 28 | 100 | 1.9 | 1.4 | 0.3 | 1.6 | 6.4 | 1.9 |
| Post-Olympics | 31 | 100 | 3.1 | 1.5 | 0.4 | 3.5 | 7.5 | 2.0 |
| Indeno[1,2,3-cd]pyrene (ng/m3) | ||||||||
| Whole period | 94 | 100 | 4.2 | 2.8 | 0.2 | 3.5 | 13.8 | 3.6 |
| Pre-Olympics | 35 | 100 | 5.6 | 3.0 | 1.1 | 5.7 | 13.8 | 3.2 |
| During-Olympics | 28 | 100 | 3.7 | 2.7 | 0.9 | 3.2 | 12.9 | 3.5 |
| Post-Olympics | 31 | 100 | 2.9 | 1.8 | 0.2 | 2.8 | 8.7 | 2.2 |
| Dibenzo[a,h]anthracene (ng/m3) | ||||||||
| Whole period | 94 | 91 | 0.6 | 1.1 | 0.0 | 0.3 | 8.8 | 0.5 |
| Pre-Olympics | 35 | 77 | 1.2 | 1.7 | 0.0 | 1.2 | 8.8 | 1.6 |
| During-Olympics | 28 | 100 | 0.2 | 0.2 | 0.0 | 0.1 | 0.9 | 0.2 |
| Post-Olympics | 31 | 100 | 0.4 | 0.3 | 0.0 | 0.4 | 1.3 | 0.3 |
| Benzo[g,h,i]perylene (μg/m3) | ||||||||
| Whole period | 94 | 99 | 6.2 | 4.4 | 0.0 | 5.2 | 21.6 | 5.8 |
| Pre-Olympics | 35 | 97 | 8.7 | 4.8 | 0.0 | 9.1 | 21.6 | 5.2 |
| During-Olympics | 28 | 100 | 5.9 | 4.2 | 1.5 | 5.0 | 20.0 | 5.2 |
| Post-Olympics | 31 | 100 | 3.8 | 2.1 | 0.2 | 3.6 | 10.1 | 2.4 |
Summary statistics are based on 24-hour averages (from ~10 AM to ~10 AM next day).
Percent of observations above detection limit.
Table A.3.
Elements in PM2.5a
| Pollutant/Period | n | % | Mean | SD | Min | Median | Max | IQR |
|---|---|---|---|---|---|---|---|---|
| Na (μg/m3) | ||||||||
| Whole period | 94 | 100 | 3.8 × 10⁻¹ | 2.1 × 10⁻¹ | 9.0 × 10⁻² | 3.4 × 10⁻¹ | 1.1 × 100 | 2.5 × 10⁻¹ |
| Pre-Olympics | 35 | 100 | 3.8 × 10⁻¹ | 1.3 × 10⁻¹ | 1.1 × 10⁻¹ | 3.6 × 10⁻¹ | 6.7 × 10⁻¹ | 1.4 × 10⁻¹ |
| During-Olympics | 28 | 100 | 3.1 × 10⁻¹ | 1.7 × 10⁻¹ | 9.0 × 10⁻² | 2.7 × 10⁻¹ | 7.3 × 10⁻¹ | 2.2 × 10⁻¹ |
| Post-Olympics | 31 | 100 | 4.5 × 10⁻¹ | 2.9 × 10⁻¹ | 9.1 × 10⁻² | 3.1 × 10⁻¹ | 1.1 × 100 | 4.5 × 10⁻¹ |
| Mg (μg/m3) | ||||||||
| Whole period | 94 | 100 | 2.2 × 10⁻¹ | 1.7 × 10⁻¹ | 3.1 × 10⁻² | 2.0 × 10⁻¹ | 1.2 × 100 | 1.4 × 10⁻¹ |
| Pre-Olympics | 35 | 100 | 2.2 × 10⁻¹ | 1.4 × 10⁻¹ | 3.1 × 10⁻² | 2.1 × 10⁻¹ | 7.4 × 10⁻¹ | 1.1 × 10⁻¹ |
| During-Olympics | 28 | 100 | 1.7 × 10⁻¹ | 7.7 × 10⁻² | 4.1 × 10⁻² | 1.6 × 10⁻¹ | 3.1 × 10⁻¹ | 1.1 × 10⁻¹ |
| Post-Olympics | 31 | 100 | 2.6 × 10⁻¹ | 2.4 × 10⁻¹ | 6.4 × 10⁻² | 2.0 × 10⁻¹ | 1.2 × 100 | 1.5 × 10⁻¹ |
| Al (μg/m3) | ||||||||
| Whole period | 94 | 100 | 3.2 × 10⁻¹ | 4.0 × 10⁻¹ | 1.8 × 10⁻² | 2.3 × 10⁻¹ | 2.8 × 100 | 2.6 × 10⁻¹ |
| Pre-Olympics | 35 | 100 | 3.1 × 10⁻¹ | 2.5 × 10⁻¹ | 6.5 × 10⁻² | 2.5 × 10⁻¹ | 1.6 × 100 | 1.2 × 10⁻¹ |
| During-Olympics | 28 | 100 | 8.1 × 10⁻² | 7.3 × 10⁻² | 1.8 × 10⁻² | 5.6 × 10⁻² | 4.0 × 10⁻¹ | 6.7 × 10⁻² |
| Post-Olympics | 31 | 100 | 5.6 × 10⁻¹ | 5.6 × 10⁻¹ | 1.1 × 10⁻¹ | 4.0 × 10⁻¹ | 2.8 × 100 | 3.1 × 10⁻¹ |
| P (μg/m3) | ||||||||
| Whole period | 94 | 90 | 4.6 × 10⁻² | 3.6 × 10⁻² | 7.9 × 10⁻⁵ | 4.6 × 10⁻² | 1.5 × 10⁻¹ | 4.7 × 10⁻² |
| Pre-Olympics | 35 | 74 | 2.3 × 10⁻² | 2.6 × 10⁻² | 7.9 × 10⁻⁵ | 2.1 × 10⁻² | 9.2 × 10⁻² | 3.6 × 10⁻² |
| During-Olympics | 28 | 100 | 6.4 × 10⁻² | 3.5 × 10⁻² | 1.7 × 10⁻² | 5.1 × 10⁻² | 1.4 × 10⁻¹ | 4.3 × 10⁻² |
| Post-Olympics | 31 | 100 | 5.6 × 10⁻² | 3.2 × 10⁻² | 1.0 × 10⁻² | 4.8 × 10⁻² | 1.5 × 10⁻¹ | 4.7 × 10⁻² |
| K (μg/m3) | ||||||||
| Whole period | 94 | 100 | 1.3 × 100 | 9.5 × 10⁻¹ | 1.3 × 10⁻¹ | 1.0 × 100 | 5.0 × 100 | 1.2 × 100 |
| Pre-Olympics | 35 | 100 | 1.7 × 100 | 1.1 × 100 | 3.4 × 10⁻¹ | 1.7 × 100 | 5.0 × 100 | 1.4 × 100 |
| During-Olympics | 28 | 100 | 7.6 × 10⁻¹ | 4.1 × 10⁻¹ | 1.3 × 10⁻¹ | 7.4 × 10⁻¹ | 1.6 × 100 | 5.6 × 10⁻¹ |
| Post-Olympics | 31 | 100 | 1.4 × 100 | 9.2 × 10⁻¹ | 2.6 × 10⁻¹ | 1.2 × 100 | 3.7 × 100 | 1.4 × 100 |
| Ca (μg/m3) | ||||||||
| Whole period | 94 | 100 | 6.7 × 10⁻¹ | 6.1 × 10⁻¹ | 1.0 × 10⁻¹ | 5.7 × 10⁻¹ | 4.9 × 100 | 3.6 × 10⁻¹ |
| Pre-Olympics | 35 | 100 | 5.8 × 10⁻¹ | 3.0 × 10⁻¹ | 1.0 × 10⁻¹ | 5.6 × 10⁻¹ | 1.8 × 100 | 2.1 × 10⁻¹ |
| During-Olympics | 28 | 100 | 4.7 × 10⁻¹ | 2.2 × 10⁻¹ | 1.0 × 10⁻¹ | 4.5 × 10⁻¹ | 9.4 × 10⁻¹ | 2.8 × 10⁻¹ |
| Post-Olympics | 31 | 100 | 9.5 × 10⁻¹ | 9.4 × 10⁻¹ | 2.6 × 10⁻¹ | 6.6 × 10⁻¹ | 4.9 × 100 | 4.9 × 10⁻¹ |
| Ti (μg/m3) | ||||||||
| Whole period | 94 | 100 | 3.8 × 10⁻² | 3.1 × 10⁻² | 7.3 × 10⁻³ | 3.0 × 10⁻² | 2.3 × 10⁻¹ | 1.8 × 10⁻² |
| Pre-Olympics | 35 | 100 | 3.1 × 10⁻² | 2.1 × 10⁻² | 7.3 × 10⁻³ | 2.7 × 10⁻² | 1.2 × 10⁻¹ | 1.3 × 10⁻² |
| During-Olympics | 28 | 100 | 3.1 × 10⁻² | 1.4 × 10⁻² | 1.1 × 10⁻² | 2.8 × 10⁻² | 6.2 × 10⁻² | 1.8 × 10⁻² |
| Post-Olympics | 31 | 100 | 5.2 × 10⁻² | 4.6 × 10⁻² | 1.6 × 10⁻² | 3.8 × 10⁻² | 2.3 × 10⁻¹ | 2.8 × 10⁻² |
| V (μg/m3) | ||||||||
| Whole period | 94 | 99 | 2.9 × 10⁻³ | 3.0 × 10⁻³ | 5.2 × 10⁻⁷ | 2.0 × 10⁻³ | 2.4 × 10⁻² | 2.6 × 10⁻³ |
| Pre-Olympics | 35 | 100 | 4.6 × 10⁻³ | 4.1 × 10⁻³ | 8.9 × 10⁻⁴ | 3.6 × 10⁻³ | 2.4 × 10⁻² | 3.3 × 10⁻³ |
| During-Olympics | 28 | 100 | 2.0 × 10⁻³ | 1.2 × 10⁻³ | 2.3 × 10⁻⁴ | 1.6 × 10⁻³ | 4.9 × 10⁻³ | 1.9 × 10⁻³ |
| Post-Olympics | 31 | 97 | 1.9 × 10⁻³ | 1.6 × 10⁻³ | 5.2 × 10⁻⁷ | 1.3 × 10⁻³ | 6.7 × 10⁻³ | 1.4 × 10⁻³ |
| Cr (μg/m3) | ||||||||
| Whole period | 94 | 100 | 5.1 × 10⁻³ | 3.7 × 10⁻³ | 6.6 × 10⁻⁴ | 4.0 × 10⁻³ | 2.2 × 10⁻² | 3.3 × 10⁻³ |
| Pre-Olympics | 35 | 100 | 3.1 × 10⁻³ | 1.3 × 10⁻³ | 6.6 × 10⁻⁴ | 2.9 × 10⁻³ | 5.6 × 10⁻³ | 1.6 × 10⁻³ |
| During-Olympics | 28 | 100 | 5.0 × 10⁻³ | 2.4 × 10⁻³ | 1.5 × 10⁻³ | 4.5 × 10⁻³ | 1.2 × 10⁻² | 3.4 × 10⁻³ |
| Post-Olympics | 31 | 100 | 7.4 × 10⁻³ | 5.1 × 10⁻³ | 2.0 × 10⁻³ | 5.9 × 10⁻³ | 2.2 × 10⁻² | 7.7 × 10⁻³ |
| Mn (μg/m3) | ||||||||
| Whole period | 94 | 100 | 4.3 × 10⁻² | 2.6 × 10⁻² | 9.4 × 10⁻³ | 3.5 × 10⁻² | 1.6 × 10⁻¹ | 2.4 × 10⁻² |
| Pre-Olympics | 35 | 100 | 4.6 × 10⁻² | 2.5 × 10⁻² | 1.4 × 10⁻² | 4.1 × 10⁻² | 1.6 × 10⁻¹ | 2.0 × 10⁻² |
| During-Olympics | 28 | 100 | 2.8 × 10⁻² | 1.2 × 10⁻² | 9.4 × 10⁻³ | 2.9 × 10⁻² | 5.6 × 10⁻² | 1.5 × 10⁻² |
| Post-Olympics | 31 | 100 | 5.3 × 10⁻² | 3.0 × 10⁻² | 1.2 × 10⁻² | 4.5 × 10⁻² | 1.2 × 10⁻¹ | 3.6 × 10⁻² |
| Fe (μg/m3) | ||||||||
| Whole period | 94 | 99 | 6.1 × 10⁻¹ | 4.5 × 10⁻¹ | 1.7 × 10⁻⁶ | 5.1 × 10⁻¹ | 2.8 × 100 | 3.8 × 10⁻¹ |
| Pre-Olympics | 35 | 100 | 6.3 × 10⁻¹ | 3.5 × 10⁻¹ | 1.5 × 10⁻¹ | 5.3 × 10⁻¹ | 1.8 × 100 | 3.7 × 10⁻¹ |
| During-Olympics | 28 | 96 | 3.5 × 10⁻¹ | 2.8 × 10⁻¹ | 1.7 × 10⁻⁶ | 3.1 × 10⁻¹ | 1.3 × 100 | 3.2 × 10⁻¹ |
| Post-Olympics | 31 | 100 | 8.1 × 10⁻¹ | 5.7 × 10⁻¹ | 3.0 × 10⁻¹ | 6.2 × 10⁻¹ | 2.8 × 100 | 4.9 × 10⁻¹ |
| Co (μg/m3) | ||||||||
| Whole period | 94 | 94 | 1.4 × 10⁻³ | 2.3 × 10⁻³ | 1.7 × 10⁻⁷ | 7.1 × 10⁻⁴ | 1.4 × 10⁻² | 1.2 × 10⁻³ |
| Pre-Olympics | 35 | 100 | 1.4 × 10⁻³ | 2.0 × 10⁻³ | 1.8 × 10⁻⁴ | 7.2 × 10⁻⁴ | 9.1 × 10⁻³ | 8.4 × 10⁻⁴ |
| During-Olympics | 28 | 79 | 4.3 × 10⁻⁴ | 9.9 × 10⁻⁴ | 1.7 × 10⁻⁷ | 1.4 × 10⁻⁴ | 4.2 × 10⁻³ | 3.0 × 10⁻⁴ |
| Post-Olympics | 31 | 100 | 2.4 × 10⁻³ | 3.0 × 10⁻³ | 2.5 × 10⁻⁴ | 1.2 × 10⁻³ | 1.4 × 10⁻² | 1.9 × 10⁻³ |
| Ni (μg/m3) | ||||||||
| Whole period | 94 | 83 | 2.2 × 10⁻³ | 2.2 × 10⁻³ | 4.7 × 10⁻⁷ | 1.9 × 10⁻³ | 1.3 × 10⁻² | 2.6 × 10⁻³ |
| Pre-Olympics | 35 | 100 | 2.9 × 10⁻³ | 2.4 × 10⁻³ | 2.2 × 10⁻⁴ | 2.2 × 10⁻³ | 1.3 × 10⁻² | 2.1 × 10⁻³ |
| During-Olympics | 28 | 43 | 3.5 × 10⁻⁴ | 8.1 × 10⁻⁴ | 4.7 × 10⁻⁷ | 3.4 × 10⁻⁴ | 3.2 × 10⁻³ | 2.7 × 10⁻⁴ |
| Post-Olympics | 31 | 100 | 3.0 × 10⁻³ | 2.1 × 10⁻³ | 1.0 × 10⁻³ | 2.1 × 10⁻³ | 8.4 × 10⁻³ | 2.3 × 10⁻³ |
| Cu (μg/m3) | ||||||||
| Whole period | 94 | 99 | 3.4 × 10⁻² | 2.6 × 10⁻² | 3.9 × 10⁻⁷ | 2.8 × 10⁻² | 1.4 × 10⁻¹ | 3.3 × 10⁻² |
| Pre-Olympics | 35 | 100 | 3.7 × 10⁻² | 1.4 × 10⁻² | 7.3 × 10⁻³ | 3.5 × 10⁻² | 5.9 × 10⁻² | 2.2 × 10⁻² |
| During-Olympics | 28 | 96 | 2.7 × 10⁻² | 2.1 × 10⁻² | 3.9 × 10⁻⁷ | 2.3 × 10⁻² | 7.5 × 10⁻² | 2.7 × 10⁻² |
| Post-Olympics | 31 | 100 | 3.7 × 10⁻² | 3.7 × 10⁻² | 5.3 × 10⁻³ | 2.2 × 10⁻² | 1.4 × 10⁻¹ | 4.2 × 10⁻² |
| Zn (μg/m3) | ||||||||
| Whole period | 94 | 100 | 2.3 × 10⁻¹ | 2.0 × 10⁻¹ | 5.6 × 10⁻³ | 1.8 × 10⁻¹ | 1.1 × 100 | 2.8 × 10⁻¹ |
| Pre-Olympics | 35 | 100 | 3.4 × 10⁻¹ | 1.8 × 10⁻¹ | 5.8 × 10⁻² | 3.2 × 10⁻¹ | 1.1 × 100 | 2.0 × 10⁻¹ |
| During-Olympics | 28 | 100 | 4.1 × 10⁻² | 4.9 × 10⁻² | 5.6 × 10⁻³ | 2.5 × 10⁻² | 2.6 × 10⁻¹ | 3.6 × 10⁻² |
| Post-Olympics | 31 | 100 | 2.7 × 10⁻¹ | 1.9 × 10⁻¹ | 4.7 × 10⁻² | 1.8 × 10⁻¹ | 8.4 × 10⁻¹ | 2.5 × 10⁻¹ |
| As (μg/m3) | ||||||||
| Whole period | 94 | 100 | 9.7 × 10⁻³ | 9.5 × 10⁻³ | 3.3 × 10⁻⁴ | 7.9 × 10⁻³ | 4.7 × 10⁻² | 1.1 × 10⁻² |
| Pre-Olympics | 35 | 100 | 1.2 × 10⁻² | 5.8 × 10⁻³ | 2.4 × 10⁻³ | 1.2 × 10⁻² | 2.9 × 10⁻² | 5.7 × 10⁻³ |
| During-Olympics | 28 | 100 | 1.9 × 10⁻³ | 2.1 × 10⁻³ | 3.3 × 10⁻⁴ | 1.1 × 10⁻³ | 1.0 × 10⁻² | 1.6 × 10⁻³ |
| Post-Olympics | 31 | 100 | 1.4 × 10⁻² | 1.2 × 10⁻² | 8.5 × 10⁻⁴ | 1.0 × 10⁻² | 4.7 × 10⁻² | 1.6 × 10⁻² |
| Se (μg/m3) | ||||||||
| Whole period | 94 | 100 | 6.6 × 10⁻³ | 4.7 × 10⁻³ | 4.4 × 10⁻⁴ | 6.5 × 10⁻³ | 2.1 × 10⁻² | 6.6 × 10⁻³ |
| Pre-Olympics | 35 | 100 | 8.8 × 10⁻³ | 2.9 × 10⁻³ | 3.5 × 10⁻³ | 8.2 × 10⁻³ | 1.5 × 10⁻² | 3.4 × 10⁻³ |
| During-Olympics | 28 | 100 | 2.2 × 10⁻³ | 1.9 × 10⁻³ | 4.4 × 10⁻⁴ | 1.7 × 10⁻³ | 1.1 × 10⁻² | 1.3 × 10⁻³ |
| Post-Olympics | 31 | 100 | 8.2 × 10⁻³ | 5.4 × 10⁻³ | 2.0 × 10⁻³ | 6.8 × 10⁻³ | 2.1 × 10⁻² | 6.4 × 10⁻³ |
| Mo (μg/m3) | ||||||||
| Whole period | 94 | 99 | 1.1 × 10⁻³ | 1.1 × 10⁻³ | 3.5 × 10⁻⁷ | 8.9 × 10⁻⁴ | 1.0 × 10⁻² | 7.9 × 10⁻⁴ |
| Pre-Olympics | 35 | 100 | 9.4 × 10⁻⁴ | 4.2 × 10⁻⁴ | 2.7 × 10⁻⁴ | 8.8 × 10⁻⁴ | 2.2 × 10⁻³ | 3.3 × 10⁻⁴ |
| During-Olympics | 28 | 96 | 8.5 × 10⁻⁴ | 6.5 × 10⁻⁴ | 3.5 × 10⁻⁷ | 7.8 × 10⁻⁴ | 3.2 × 10⁻³ | 7.3 × 10⁻⁴ |
| Post-Olympics | 31 | 100 | 1.5 × 10⁻³ | 1.7 × 10⁻³ | 2.0 × 10⁻⁴ | 1.1 × 10⁻³ | 1.0 × 10⁻² | 1.4 × 10⁻³ |
| Cd (μg/m3) | ||||||||
| Whole period | 94 | 100 | 1.8 × 10⁻³ | 1.5 × 10⁻³ | 1.7 × 10⁻⁴ | 1.5 × 10⁻³ | 1.0 × 10⁻² | 1.5 × 10⁻³ |
| Pre-Olympics | 35 | 100 | 1.7 × 10⁻³ | 8.0 × 10⁻⁴ | 2.5 × 10⁻⁴ | 1.6 × 10⁻³ | 4.1 × 10⁻³ | 9.4 × 10⁻⁴ |
| During-Olympics | 28 | 100 | 1.3 × 10⁻³ | 8.6 × 10⁻⁴ | 2.1 × 10⁻⁴ | 1.0 × 10⁻³ | 3.1 × 10⁻³ | 1.4 × 10⁻³ |
| Post-Olympics | 31 | 100 | 2.4 × 10⁻³ | 2.2 × 10⁻³ | 1.7 × 10⁻⁴ | 1.8 × 10⁻³ | 1.0 × 10⁻² | 2.0 × 10⁻³ |
| Ba (μg/m3) | ||||||||
| Whole period | 94 | 100 | 1.4 × 10⁻² | 1.3 × 10⁻² | 7.7 × 10⁻⁴ | 9.1 × 10⁻³ | 7.6 × 10⁻² | 8.5 × 10⁻³ |
| Pre-Olympics | 35 | 100 | 9.9 × 10⁻³ | 9.0 × 10⁻³ | 1.9 × 10⁻³ | 8.4 × 10⁻³ | 5.5 × 10⁻² | 3.7 × 10⁻³ |
| During-Olympics | 28 | 100 | 1.3 × 10⁻² | 1.4 × 10⁻² | 7.7 × 10⁻⁴ | 8.9 × 10⁻³ | 7.6 × 10⁻² | 1.1 × 10⁻² |
| Post-Olympics | 31 | 100 | 1.8 × 10⁻² | 1.5 × 10⁻² | 4.9 × 10⁻³ | 1.4 × 10⁻² | 7.5 × 10⁻² | 1.4 × 10⁻² |
| Tl (μg/m3) | ||||||||
| Whole period | 94 | 100 | 1.3 × 10⁻³ | 9.1 × 10⁻⁴ | 1.5 × 10⁻⁴ | 1.1 × 10⁻³ | 5.4 × 10⁻³ | 9.2 × 10⁻⁴ |
| Pre-Olympics | 35 | 100 | 1.3 × 10⁻³ | 5.6 × 10⁻⁴ | 1.8 × 10⁻⁴ | 1.3 × 10⁻³ | 2.5 × 10⁻³ | 6.7 × 10⁻⁴ |
| During-Olympics | 28 | 100 | 1.0 × 10⁻³ | 6.7 × 10⁻⁴ | 1.8 × 10⁻⁴ | 7.8 × 10⁻⁴ | 2.7 × 10⁻³ | 7.7 × 10⁻⁴ |
| Post-Olympics | 31 | 100 | 1.5 × 10⁻³ | 1.3 × 10⁻³ | 1.5 × 10⁻⁴ | 1.1 × 10⁻³ | 5.4 × 10⁻³ | 1.2 × 10⁻³ |
| Pb (μg/m3) | ||||||||
| Whole period | 94 | 100 | 9.9 × 10⁻² | 7.1 × 10⁻² | 1.0 × 10⁻² | 8.3 × 10⁻² | 3.2 × 10⁻¹ | 8.8 × 10⁻² |
| Pre-Olympics | 35 | 100 | 1.3 × 10⁻¹ | 7.1 × 10⁻² | 2.3 × 10⁻² | 1.2 × 10⁻¹ | 3.2 × 10⁻¹ | 8.2 × 10⁻² |
| During-Olympics | 28 | 100 | 6.1 × 10⁻² | 4.0 × 10⁻² | 1.0 × 10⁻² | 5.1 × 10⁻² | 1.5 × 10⁻¹ | 5.7 × 10⁻² |
| Post-Olympics | 31 | 100 | 9.9 × 10⁻² | 7.8 × 10⁻² | 1.2 × 10⁻² | 7.6 × 10⁻² | 2.8 × 10⁻¹ | 9.4 × 10⁻² |
| Th (μg/m3) | ||||||||
| Whole period | 94 | 98 | 7.8 × 10⁻⁵ | 9.0 × 10⁻⁵ | 8.3 × 10⁻⁹ | 5.3 × 10⁻⁵ | 5.0 × 10⁻⁴ | 6.3 × 10⁻⁵ |
| Pre-Olympics | 35 | 100 | 4.6 × 10⁻⁵ | 5.9 × 10⁻⁵ | 1.6 × 10⁻⁶ | 3.3 × 10⁻⁵ | 3.0 × 10⁻⁴ | 3.3 × 10⁻⁵ |
| During-Olympics | 28 | 93 | 7.1 × 10⁻⁵ | 8.9 × 10⁻⁵ | 8.3 × 10⁻⁹ | 4.9 × 10⁻⁵ | 4.7 × 10⁻⁴ | 6.8 × 10⁻⁵ |
| Post-Olympics | 31 | 100 | 1.2 × 10⁻⁴ | 1.0 × 10⁻⁴ | 2.9 × 10⁻⁵ | 8.1 × 10⁻⁵ | 5.0 × 10⁻⁴ | 7.3 × 10⁻⁵ |
| U (μg/m3) | ||||||||
| Whole period | 94 | 100 | 4.8 × 10⁻⁵ | 3.3 × 10⁻⁵ | 6.5 × 10⁻⁶ | 3.8 × 10⁻⁵ | 2.0 × 10⁻⁴ | 3.0 × 10⁻⁵ |
| Pre-Olympics | 35 | 100 | 3.9 × 10⁻⁵ | 1.6 × 10⁻⁵ | 6.5 × 10⁻⁶ | 3.7 × 10⁻⁵ | 8.7 × 10⁻⁵ | 1.7 × 10⁻⁵ |
| During-Olympics | 28 | 100 | 4.3 × 10⁻⁵ | 2.5 × 10⁻⁵ | 9.0 × 10⁻⁶ | 3.6 × 10⁻⁵ | 9.7 × 10⁻⁵ | 3.3 × 10⁻⁵ |
| Post-Olympics | 31 | 100 | 6.2 × 10⁻⁵ | 4.6 × 10⁻⁵ | 1.5 × 10⁻⁵ | 4.5 × 10⁻⁵ | 2.0 × 10⁻⁴ | 6.7 × 10⁻⁵ |
Summary statistics are based on 24-hour averages (from ~10 AM to ~10 AM next day).
APPENDIX B. Biomarker Level Summary Statistics Based on Simple Algebraic Calculations
Table B.1.
Biomarkers of Autonomic Dysfunctiona
| Index/Periodb | n | Mean | SD | Min | Median | Max | % BDLc |
|---|---|---|---|---|---|---|---|
| HR (bpm) | |||||||
| Pre-Olympics | 239 | 67 | 10 | 47 | 66 | 106 | 0.00 |
| During-Olympics | 234 | 66 | 9 | 44 | 66 | 93 | 0.00 |
| Post-Olympics | 247 | 66 | 9 | 45 | 65 | 97 | 0.00 |
| HR Variability | |||||||
| HF (ms2) | |||||||
| Pre-Olympics | 235 | 859.8 | 789.6 | 8.1 | 611.8 | 4082.5 | 0.00 |
| During-Olympics | 233 | 805.2 | 695.3 | 28.3 | 574.2 | 4069.5 | 0.00 |
| Post-Olympics | 246 | 880.2 | 736.5 | 14.7 | 693.4 | 4617.9 | 0.00 |
| LF (ms2) | |||||||
| Pre-Olympics | 235 | 613.2 | 498.8 | 62.0 | 500.0 | 3476.4 | 0.00 |
| During-Olympics | 233 | 518.2 | 389.6 | 61.2 | 405.8 | 2590.1 | 0.00 |
| Post-Olympics | 246 | 529.8 | 430.5 | 7.3 | 414.5 | 3965.4 | 0.00 |
| LF/HF | |||||||
| Pre-Olympics | 235 | 1.2 | 1.2 | 0.1 | 0.8 | 8.8 | 0.00 |
| During-Olympics | 233 | 1.0 | 0.9 | 0.1 | 0.7 | 6.5 | 0.00 |
| Post-Olympics | 245 | 0.9 | 1.0 | 0.1 | 0.6 | 7.2 | 0.00 |
| rMSSD (ms) | |||||||
| Pre-Olympics | 239 | 70 | 66 | 6 | 53 | 568 | 0.00 |
| During-Olympics | 235 | 68 | 65 | 7 | 52 | 658 | 0.00 |
| Post-Olympics | 247 | 63 | 58 | 16 | 50 | 651 | 0.00 |
| SDNN (ms) | |||||||
| Pre-Olympics | 239 | 68 | 40 | 21 | 58 | 311 | 0.00 |
| During-Olympics | 235 | 68 | 52 | 22 | 56 | 542 | 0.00 |
| Post-Olympics | 247 | 65 | 38 | 20 | 54 | 349 | 0.00 |
| VLF (ms2) | |||||||
| Pre-Olympics | 235 | 841.9 | 637.3 | 73.4 | 699.8 | 5324.1 | 0.00 |
| During-Olympics | 233 | 764.5 | 630.1 | 84.2 | 591.9 | 4908.3 | 0.00 |
| Post-Olympics | 246 | 874.5 | 730.7 | 28.5 | 664.6 | 4910.8 | 0.00 |
| Total power (ms2) | |||||||
| Pre-Olympics | 235 | 2383.5 | 1390.6 | 206.8 | 2123.6 | 6845.4 | 0.00 |
| During-Olympics | 233 | 2155.0 | 1250.3 | 440.1 | 1835.6 | 6755.4 | 0.00 |
| Post-Olympics | 246 | 2343.7 | 1369.1 | 52.0 | 2014.0 | 8335.6 | 0.00 |
| Blood Pressure | |||||||
| DBP (mmHg) | |||||||
| Pre-Olympics | 248 | 61 | 6.6 | 44 | 60 | 80 | 0.00 |
| During-Olympics | 249 | 60 | 6.8 | 39 | 59 | 81 | 0.00 |
| Post-Olympics | 247 | 62 | 7.8 | 42 | 61 | 88 | 0.00 |
| SBP (mmHg) | |||||||
| Pre-Olympics | 248 | 105 | 10.0 | 79 | 105 | 134 | 0.00 |
| During-Olympics | 249 | 103 | 10.2 | 75 | 103 | 136 | 0.00 |
| Post-Olympics | 247 | 107 | 10.8 | 82 | 105 | 140 | 0.00 |
Data were not adjusted for repeated-measure structure or covariates.
Pre-Olympic period: 06/10 to 07/07/2008; during-Olympic period: 08/04 to 08/29/2008; and post-Olympic period: 10/06 to 10/30/2008.
BDL indicates below detection limit.
Table B.2.
Biomarkers of Systemic Inflammation and Oxidative Stressa
| Biomarker/Periodb | n | Mean | SD | Min | Median | Max | % BDLc |
|---|---|---|---|---|---|---|---|
| Plasma | |||||||
| CRP | |||||||
| Pre-Olympics | 247 | 0.73 | 1.58 | 0.15 | 0.30 | 11.90 | 46.15 |
| During-Olympics | 243 | 0.58 | 1.13 | 0.15 | 0.15 | 12.40 | 51.85 |
| Post-Olympics | 241 | 0.63 | 1.38 | 0.15 | 0.15 | 12.40 | 58.51 |
| Fibrinogen | |||||||
| Pre-Olympics | 248 | 2.48 | 0.44 | 1.17 | 2.44 | 4.95 | 0.00 |
| During-Olympics | 249 | 2.41 | 0.37 | 1.13 | 2.38 | 3.46 | 0.00 |
| Post-Olympics | 247 | 2.86 | 0.56 | 1.05 | 2.80 | 5.15 | 0.00 |
| Cell Counts | |||||||
| RBCs (× 1012/L) | |||||||
| Pre-Olympics | 248 | 4.59 | 0.51 | 3.51 | 4.53 | 6.55 | 0.00 |
| During-Olympics | 249 | 4.60 | 0.50 | 3.53 | 4.56 | 6.01 | 0.00 |
| Post-Olympics | 247 | 4.48 | 0.50 | 3.44 | 4.40 | 5.92 | 0.00 |
| WBCs (× 109/L) | |||||||
| Pre-Olympics | 248 | 5.30 | 1.40 | 2.70 | 5.10 | 11.60 | 0.00 |
| During-Olympics | 249 | 5.32 | 1.29 | 2.60 | 5.20 | 10.90 | 0.00 |
| Post-Olympics | 247 | 5.13 | 1.31 | 2.80 | 4.90 | 10.20 | 0.00 |
| Lymphocytes (× 109/L) | |||||||
| Pre-Olympics | 248 | 1.67 | 0.41 | 0.80 | 1.60 | 2.86 | 0.00 |
| During-Olympics | 249 | 1.72 | 0.44 | 0.60 | 1.70 | 3.50 | 0.00 |
| Post-Olympics | 247 | 1.57 | 0.38 | 0.70 | 1.50 | 3.30 | 0.00 |
| Lymphocytes (%) | |||||||
| Pre-Olympics | 248 | 32.46 | 7.71 | 12.00 | 32.75 | 54.30 | 0.00 |
| During-Olympics | 249 | 33.07 | 7.20 | 9.90 | 33.50 | 52.00 | 0.00 |
| Post-Olympics | 247 | 31.38 | 6.90 | 11.80 | 31.50 | 50.70 | 0.00 |
| Neutrophils (× 109/L) | |||||||
| Pre-Olympics | 248 | 3.13 | 1.22 | 1.04 | 2.88 | 9.44 | 0.00 |
| During-Olympics | 249 | 3.12 | 1.06 | 1.13 | 2.88 | 6.84 | 0.00 |
| Post-Olympics | 247 | 3.13 | 1.10 | 1.31 | 2.85 | 7.00 | 0.00 |
| Neutrophils (%) | |||||||
| Pre-Olympics | 248 | 57.89 | 8.62 | 36.80 | 57.60 | 81.40 | 0.00 |
| During-Olympics | 249 | 57.69 | 8.16 | 37.20 | 57.70 | 82.10 | 0.00 |
| Post-Olympics | 247 | 59.94 | 7.54 | 40.40 | 59.70 | 81.20 | 0.00 |
| Urine | |||||||
| 8-OHdG (mg/mol creatinine) | |||||||
| Pre-Olympics | 248 | 9.6 | 21.8 | 0.02 | 4.1 | 292.7 | 8.87 |
| During-Olympics | 244 | 7.7 | 18.5 | 0.02 | 3.1 | 237.2 | 18.44 |
| Post-Olympics | 247 | 8.2 | 14.9 | 0.01 | 3.9 | 145.5 | 10.93 |
Data were not adjusted for repeated-measure structure or covariates.
Pre-Olympic period: 06/10 to 07/07/2008; during-Olympic period: 08/04 to 08/29/2008; and post-Olympic period: 10/06 to 10/30/2008.
Concentrations below the detection limit (BDL) were designated as half of the detection limit in the calculations.
Table B.3.
Biomarkers of Pulmonary Inflammation and Oxidative Stressa
| Biomarker/Periodb | n | Mean | SD | Min | Median | Max | % BDLc |
|---|---|---|---|---|---|---|---|
| FeNO (ppb) | |||||||
| Pre-Olympics | 248 | 13.14 | 6.40 | 0.60 | 11.65 | 44.90 | 0.00 |
| During-Olympics | 249 | 7.26 | 5.24 | 0.17 | 6.04 | 38.04 | 0.00 |
| Post-Olympics | 246 | 14.22 | 8.12 | 3.00 | 12.45 | 54.80 | 0.00 |
| EBC nitrite (μM) | |||||||
| Pre-Olympics | 248 | 8.51 | 5.42 | 1.84 | 6.96 | 36.47 | 0.00 |
| During-Olympics | 248 | 5.33 | 3.10 | 0.08 | 4.29 | 19.69 | 2.02 |
| Post-Olympics | 198 | 5.11 | 2.40 | 1.86 | 4.71 | 23.61 | 0.00 |
| EBC nitrate (μM) | |||||||
| Pre-Olympics | 248 | 3.05 | 1.43 | 1.13 | 2.67 | 11.07 | 0.00 |
| During-Olympics | 248 | 2.92 | 1.67 | 0.91 | 2.54 | 12.74 | 0.00 |
| Post-Olympics | 198 | 6.63 | 5.78 | 0.36 | 5.20 | 32.13 | 0.00 |
| EBC nitrate+nitrite (μM) | |||||||
| Pre-Olympics | 248 | 11.56 | 5.84 | 4.18 | 9.74 | 41.60 | 0.00 |
| During-Olympics | 248 | 8.24 | 3.35 | 3.06 | 7.56 | 23.67 | 0.00 |
| Post-Olympics | 198 | 11.74 | 5.96 | 3.33 | 11.06 | 37.18 | 0.00 |
| EBC pH | |||||||
| Pre-Olympics | 247 | 7.43 | 0.38 | 5.85 | 7.52 | 8.11 | 0.00 |
| During-Olympics | 249 | 7.46 | 0.55 | 4.50 | 7.55 | 8.21 | 0.00 |
| Post-Olympics | 247 | 7.61 | 0.29 | 6.57 | 7.64 | 8.23 | 0.00 |
| EBC 8-isoprostane (pg/mL) | |||||||
| Pre-Olympics | 246 | 4.33 | 3.25 | 0.78 | 4.02 | 11.64 | 31.71 |
| During-Olympics | 246 | 2.54 | 2.97 | 0.78 | 0.78 | 15.40 | 55.69 |
| Post-Olympics | 244 | 4.66 | 3.53 | 0.78 | 4.65 | 16.03 | 26.23 |
Data were not adjusted for repeated-measure structure or covariates.
Pre-Olympic period: 06/10 to 07/07/2008; during-Olympic period: 08/04 to 08/29/2008; and post-Olympic period: 10/06 to 10/30/2008.
Concentrations below the detection limit (BDL) were designated as half of the detection limit in the calculations.
Table B.4.
Biomarkers of Hemostasisa
| Biomarker/Periodb | n | Mean | SD | Min | Median | Max | % BDL |
|---|---|---|---|---|---|---|---|
| sCD40L (ng/mL) | |||||||
| Pre-Olympics | 246 | 1.93 | 0.49 | 0.61 | 1.89 | 3.10 | 0.00 |
| During-Olympics | 246 | 1.80 | 0.47 | 0.72 | 1.79 | 4.01 | 0.00 |
| Post-Olympics | 244 | 2.00 | 0.67 | 0.65 | 1.99 | 7.54 | 0.00 |
| sCD62p (ng/mL) | |||||||
| Pre-Olympics | 246 | 6.68 | 1.58 | 3.02 | 6.50 | 10.53 | 0.00 |
| During-Olympics | 246 | 5.20 | 1.54 | 3.09 | 4.83 | 11.63 | 0.00 |
| Post-Olympics | 244 | 5.45 | 1.20 | 2.92 | 5.28 | 10.53 | 0.00 |
| Platelet aggregation (% platelets aggregated) | |||||||
| Pre-Olympics | 248 | 58.57 | 21.16 | 5.22 | 67.47 | 98.00 | 0.00 |
| During-Olympics | 249 | 63.33 | 17.71 | 10.84 | 68.85 | 98.28 | 0.00 |
| Post-Olympics | 246 | 57.93 | 22.17 | 5.66 | 66.99 | 98.50 | 0.00 |
| vWF (%) | |||||||
| Pre-Olympics | 247 | 102.24 | 30.01 | 25.42 | 101.34 | 176.70 | 0.00 |
| During-Olympics | 249 | 89.91 | 29.89 | 7.21 | 90.51 | 174.93 | 0.00 |
| Post-Olympics | 247 | 83.85 | 28.06 | 25.10 | 82.80 | 165.57 | 0.00 |
Data were not adjusted for repeated-measure structure or covariates.
Pre-Olympic period: 06/10 to 07/07/2008; during-Olympic period: 08/04 to 08/29/2008; and post-Olympic period: 10/06 to 10/30/2008.
APPENDIX C. Pollutant–Biomarker Association Results from Two-Pollutant Models
Figure C.1.
Estimated means and 95% CIs for the percent change in HR associated with one IQR increase in pollutant concentration, controlling for temperature (df = 1), RH (df = 1), sex, day of the week, and a second pollutant.
Figure C.2.
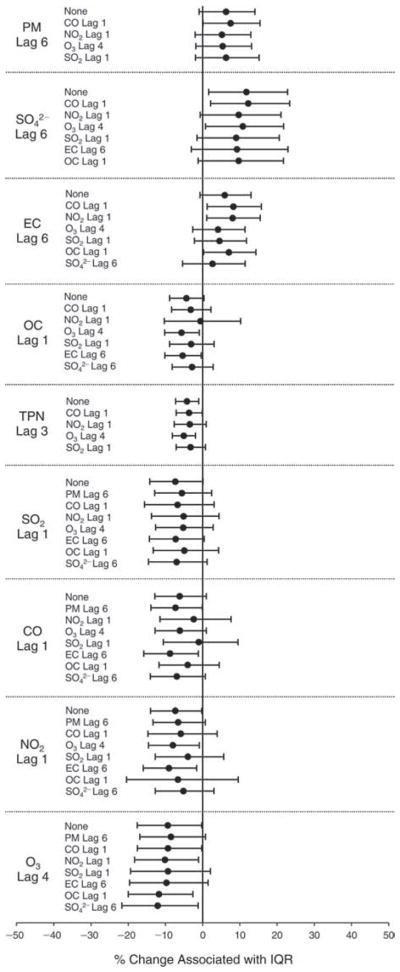
Estimated means and 95% CIs for the percent change in HF (HRV) associated with one IQR increase in pollutant concentration, controlling for temperature (df = 1), RH (df = 1), 7-day moving average of temperature (df = 1), sex, day of the week, and a second pollutant.
Figure C.3.
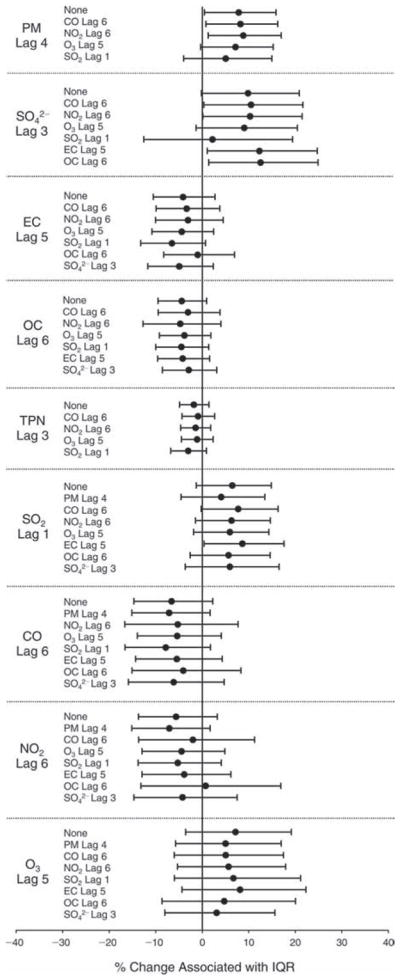
Estimated means and 95% CIs for the percent change in LF (HRV) associated with one IQR increase in pollutant concentration, controlling for temperature (df = 2), RH (df = 1), 7-day moving average of temperature (df = 1), 5-day moving average of RH (df = 1), sex, day of the week, and a second pollutant.
Figure C.4.
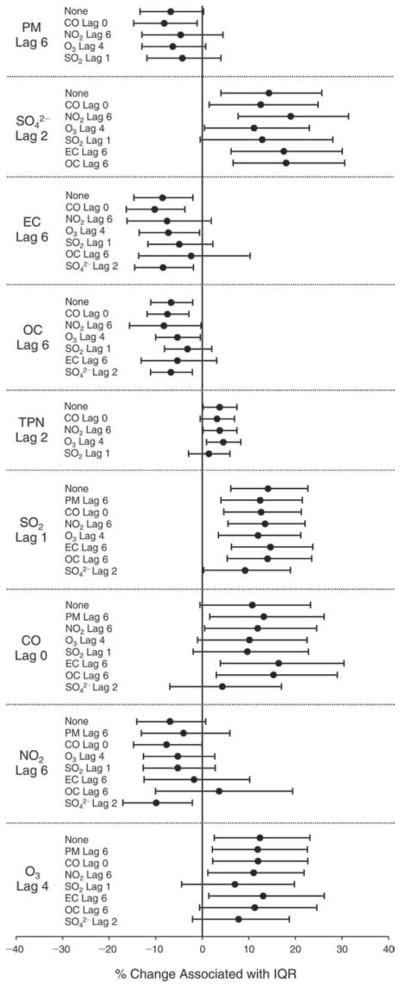
Estimated means and 95% CIs for the percent change in LF/HF (HRV) associated with one IQR increase in pollutant concentration, controlling for temperature (df = 2), RH (df = 1), 7-day moving average of temperature (df = 1), 2-day moving average of RH (df = 1), sex, day of the week, and a second pollutant.
Figure C.5.
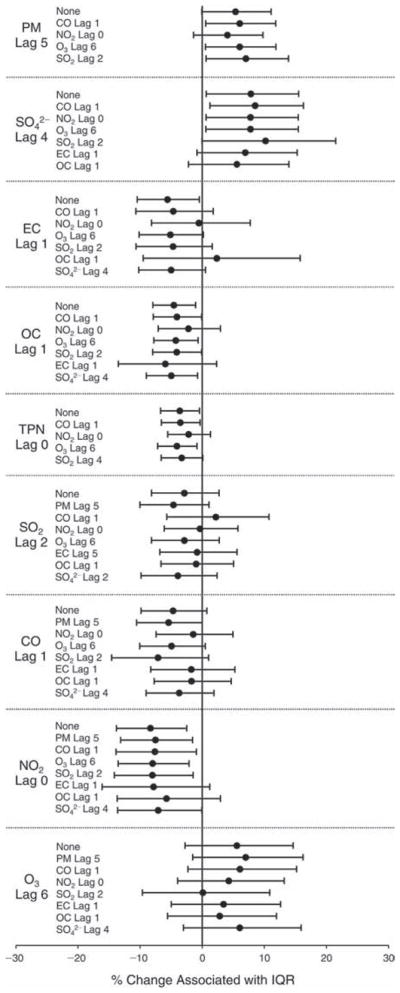
Estimated means and 95% CIs for the percent change in rMSSD (HRV) associated with one IQR increase in pollutant concentration, controlling for temperature (df = 1), RH (df = 1), 7-day moving average of temperature (df = 1), sex, day of the week, and a second pollutant.
Figure C.6.
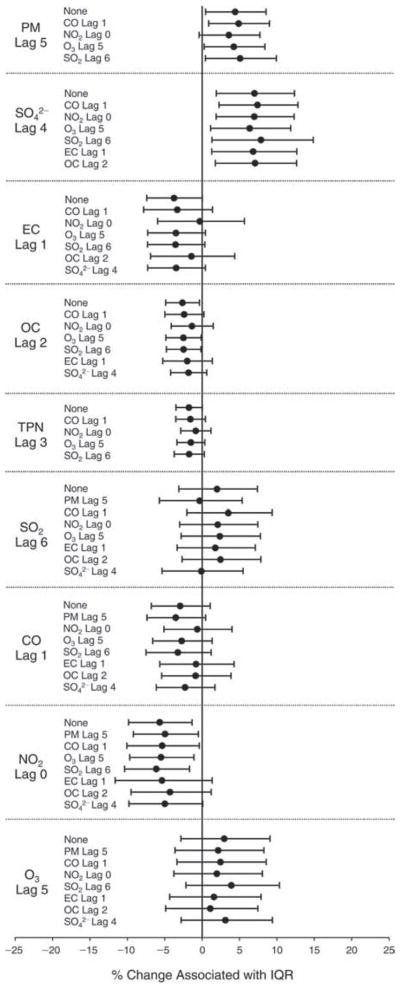
Estimated means and 95% CIs for the percent change in SDNN (HRV) associated with one IQR increase in pollutant concentration, controlling for temperature (df = 1), RH (df = 1), 7-day moving average of temperature (df = 1), sex, day of the week, and a second pollutant.
Figure C.7.
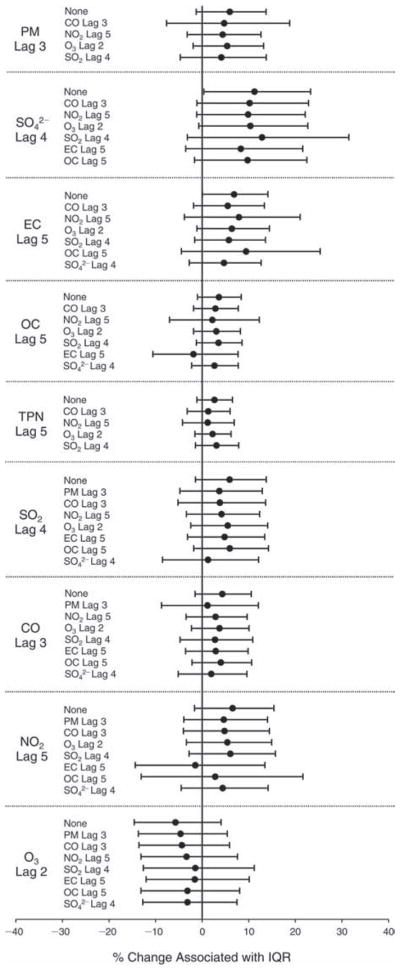
Estimated means and 95% CIs for the percent change in VLF (HRV) associated with one IQR increase in pollutant concentration, controlling for temperature (df = 1), RH (df = 1), 7-day moving average of temperature (df = 1), sex, day of the week, and a second pollutant.
Figure C.8.
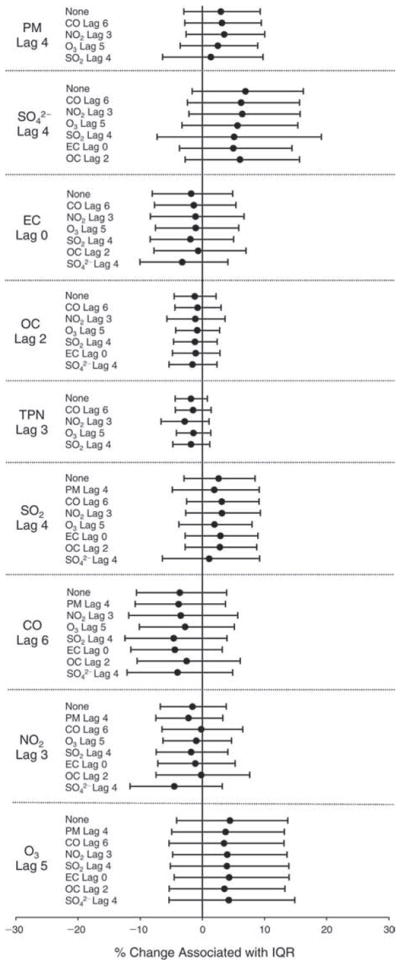
Estimated means and 95% CIs for the percent change in total power (HRV) associated with one IQR increase in pollutant concentration, controlling for temperature (df = 1), RH (df = 1), 7-day moving average of temperature (df = 1), 5-day moving average of RH (df = 1), sex, day of the week, and a second pollutant.
Figure C.9.
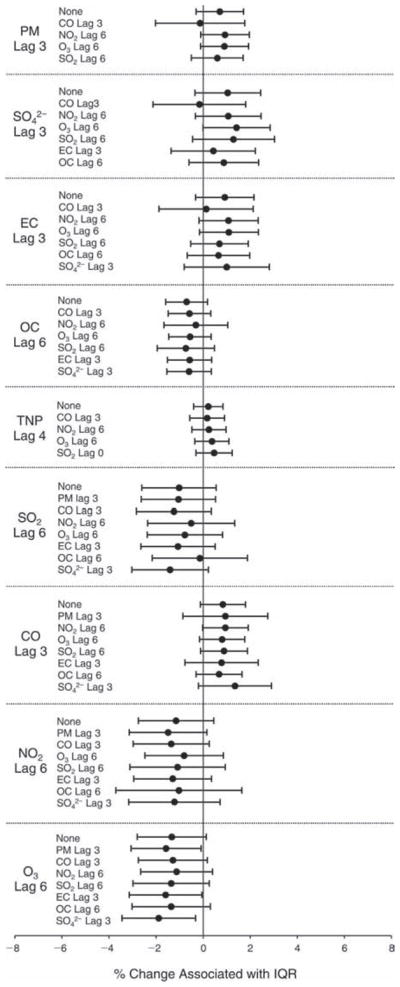
Estimated means and 95% CIs for the percent change in DBP associated with one IQR increase in pollutant concentration, controlling for temperature (df = 3), RH (df = 3), 7-day moving average of temperature (df = 3), 5-day moving average of RH (df = 3), sex, day of the week, and a second pollutant.
Figure C.10.
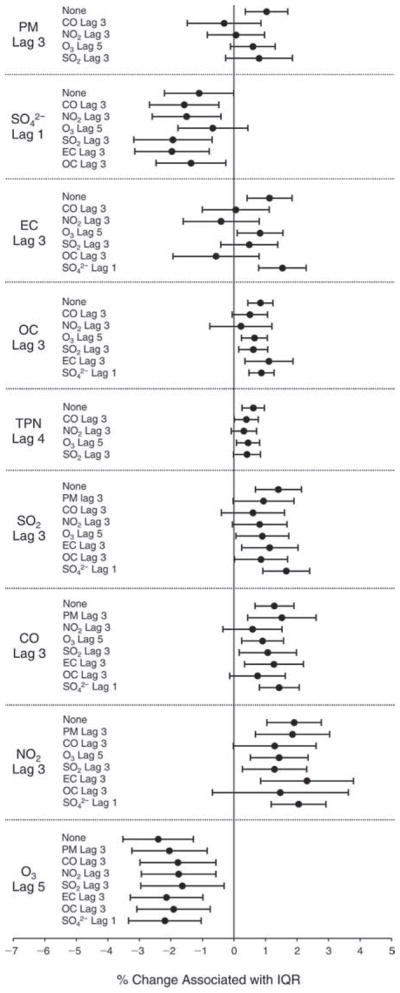
Estimated means and 95% CIs for the percent change in SBP associated with one IQR increase in pollutant concentration, controlling for temperature (df = 3), RH (df = 2), 7-day moving average of temperature (df = 3), 2-day moving average of RH (df = 3), sex, day of the week, and a second pollutant.
Figure C.11.
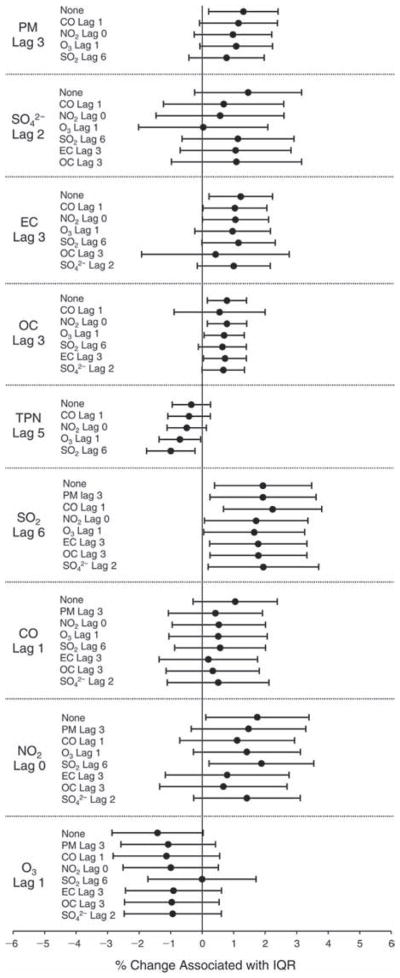
Estimated means and 95% CIs for the percent change in fibrinogen level associated with one IQR increase in pollutant concentration, controlling for temperature (df = 3), RH (df = 1), 6-day moving average of temperature (df = 1), sex, day of the week, and a second pollutant.
Figure C.12.
Estimated means and 95% CIs for the percent change in RBC count associated with one IQR increase in pollutant concentration, controlling for temperature (df = 1), RH (df = 1), 4-day moving average of RH (df = 1), sex, day of the week, and a second pollutant.
Figure C.13.
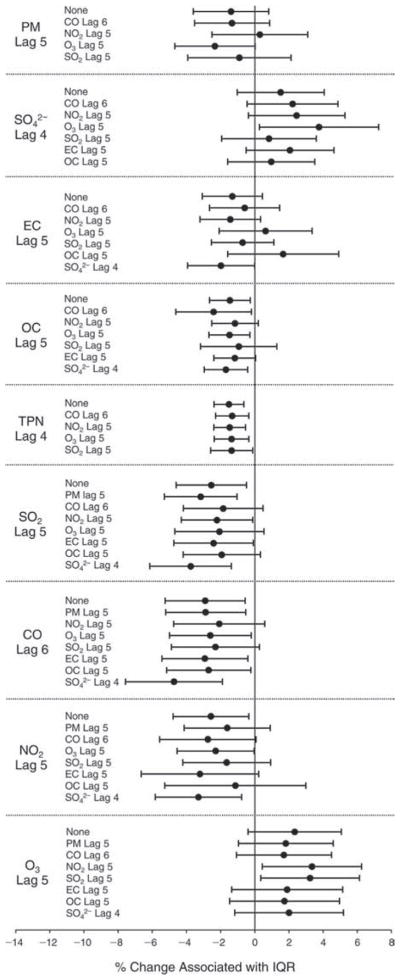
Estimated means and 95% CIs for the percent change in WBC count associated with one IQR increase in pollutant concentration, controlling for temperature (df = 1), RH (df = 1), 7-day moving average of temperature (df = 1), 7-day moving average of RH (df = 2), sex, day of the week, and a second pollutant.
Figure C.14.
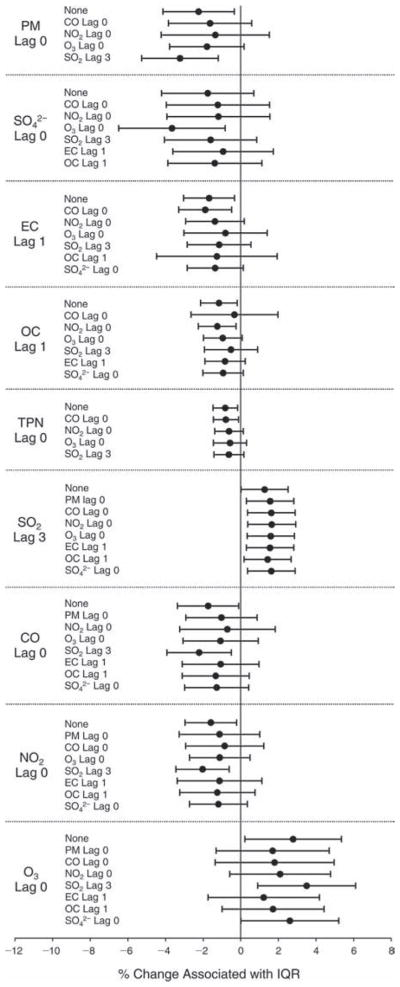
Estimated means and 95% CIs for the percent change in lymphocyte count associated with one IQR increase in pollutant concentration, controlling for temperature (df = 1), RH (df = 1), sex, day of the week, and a second pollutant.
Figure C.15.
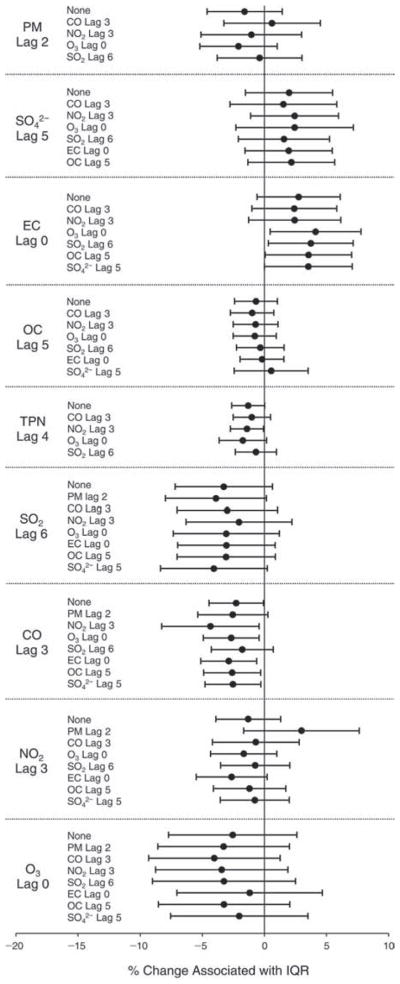
Estimated means and 95% CIs for the percent change in neutrophil count associated with one IQR increase in pollutant concentration, controlling for temperature (df = 1), RH (df = 1), 7-day moving average of temperature (df = 1), sex, day of the week, and a second pollutant.
Figure C.16.
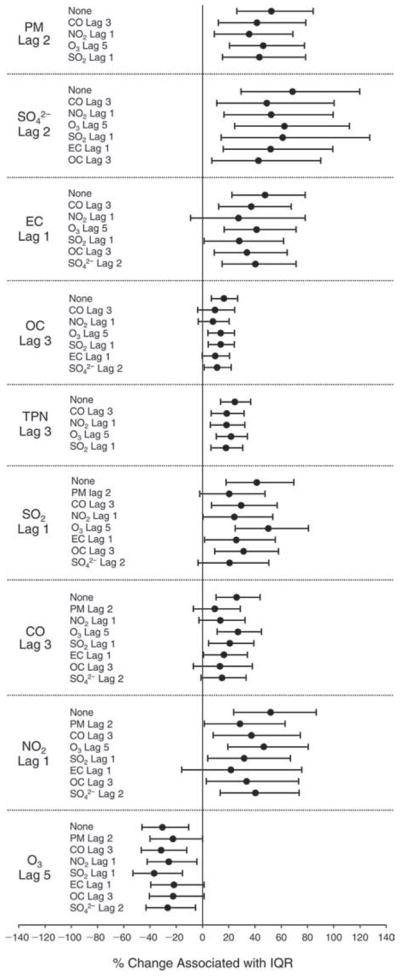
Estimated means and 95% CIs for the percent change in urinary 8-OHdG (corrected by creatinine) associated with one IQR increase in pollutant concentration, controlling for temperature (df = 1), RH (df = 1), 7-day moving average of temperature (df = 1), 2-day moving average of RH (df = 3), sex, day of the week, and a second pollutant.
Figure C.17.
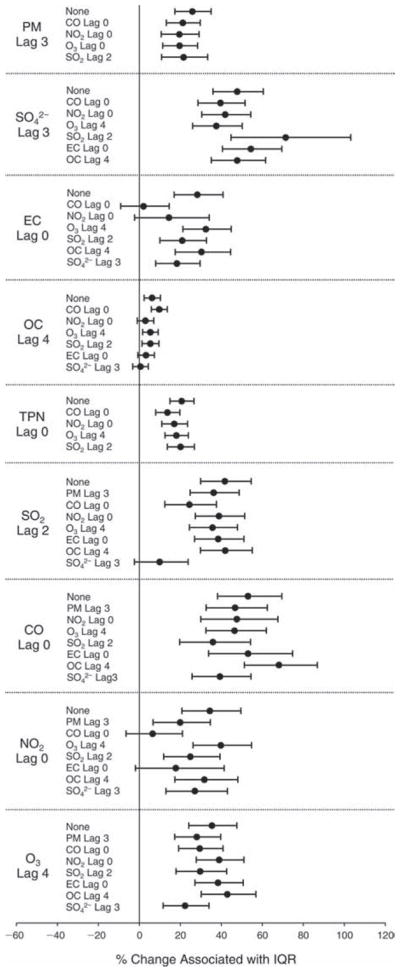
Estimated means and 95% CIs for the percent change in FeNO level associated with one IQR increase in pollutant concentration, controlling for temperature (df = 2), RH (df = 3), 7-day moving average of temperature (df = 2), 7-day moving average of RH (df = 3), sex, day of the week, and a second pollutant.
Figure C.18.
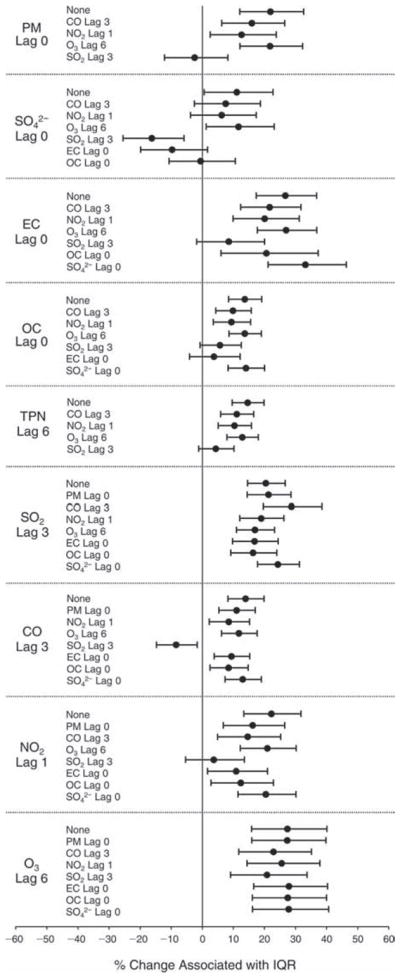
Estimated means and 95% CIs for the percent change in EBC nitrite level associated with one IQR increase in pollutant concentration, controlling for temperature (df = 2), RH (df = 1), 7-day moving average of temperature (df = 3), 3-day moving average of RH (df = 3), sex, day of the week, and a second pollutant.
Figure C.19.
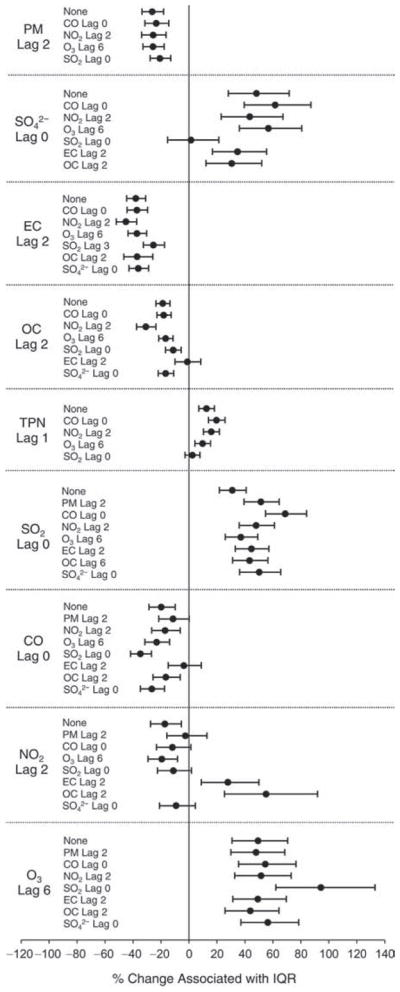
Estimated means and 95% CIs for the percent change in EBC nitrate level associated with one IQR increase in pollutant concentration, controlling for temperature (df = 2), RH (df = 1), 7-day moving average of temperature (df = 3), 3-day moving average of RH (df = 3), sex, day of the week, and a second pollutant.
Figure C.20.
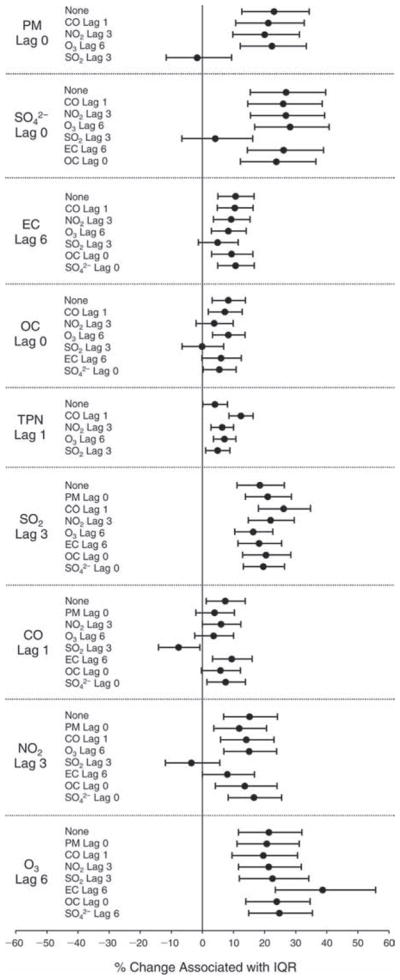
Estimated means and 95% CIs for the percent change in EBC nitrite+nitrate level associated with one IQR increase in pollutant concentration, controlling for temperature (df = 1), RH (df = 3), 7-day moving average of temperature (df = 3), 5-day moving average of RH (df = 3), sex, day of the week, and a second pollutant
Figure C.21.
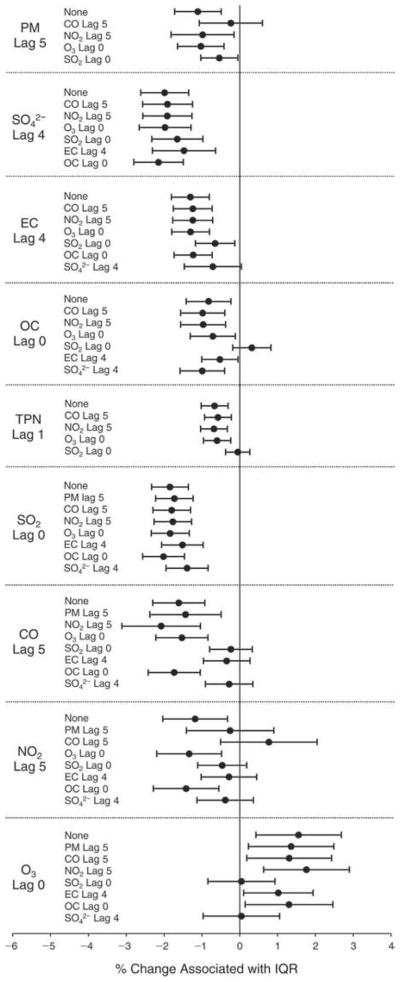
Estimated means and 95% CIs for the percent change in EBC pH level associated with one IQR increase in pollutant concentration, controlling for temperature (df = 1), RH (df = 1), 6-day moving average of temperature (df = 3), 3-day moving average of RH (df = 1), sex, day of the week, and a second pollutant.
Figure C.22.
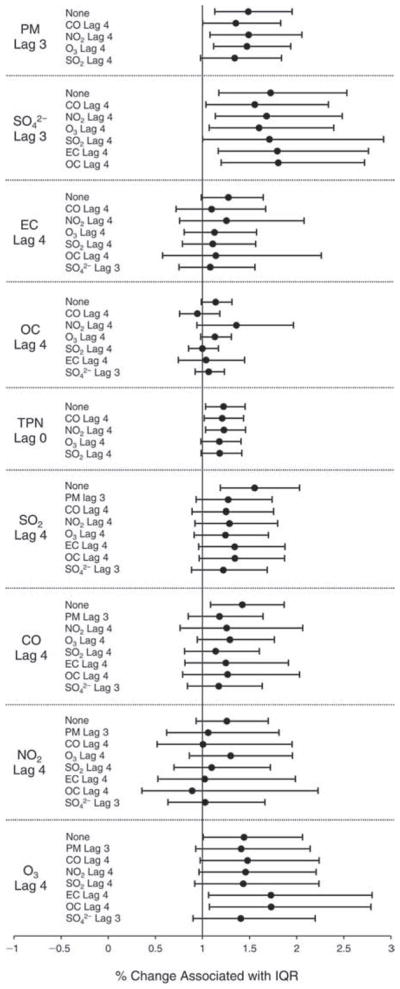
Estimated means and 95% CIs for the percent change in odds for getting a greater-than-75th-percentile value of EBC 8-isoprostane associated with one IQR increase in pollutant concentration, controlling for temperature (df = 1), RH (df = 1), 7-day moving average of temperature (df = 2), 2-day moving average of RH (df = 1), sex, day of the week, and a second pollutant.
Figure C.23.
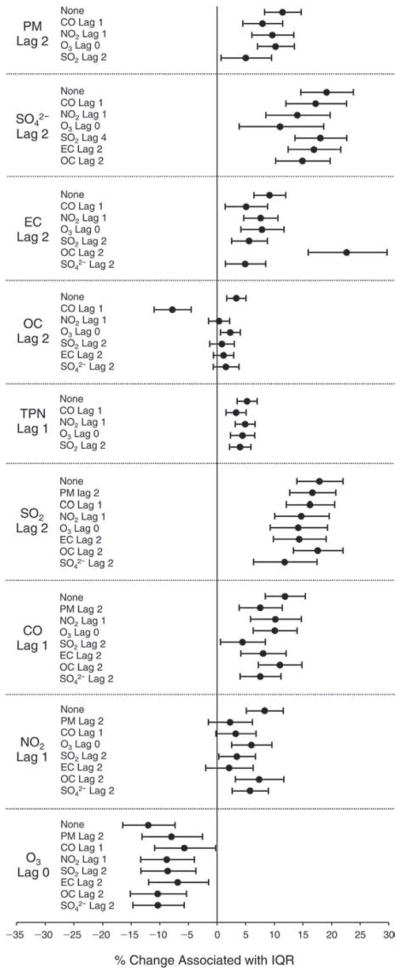
Estimated means and 95% CIs for the percent change in sCD62P level associated with one IQR increase in pollutant concentration, controlling for temperature (df = 1), RH (df = 3), 7-day moving average of temperature (df = 2), 4-day moving average of RH (df = 2), sex, day of the week, and a second pollutant.
Figure C.24.
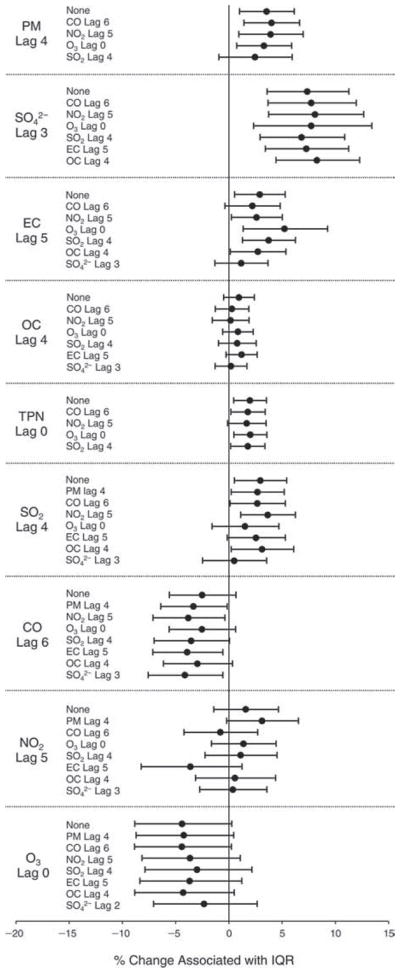
Estimated means and 95% CIs for the percent change in sCD40L level associated with one IQR increase in pollutant concentration, controlling for temperature (df = 1), RH (df = 1), 5-day moving average of temperature (df = 1), 2-day moving average of RH (df = 1), sex, day of the week, and a second pollutant.
Figure C.25.
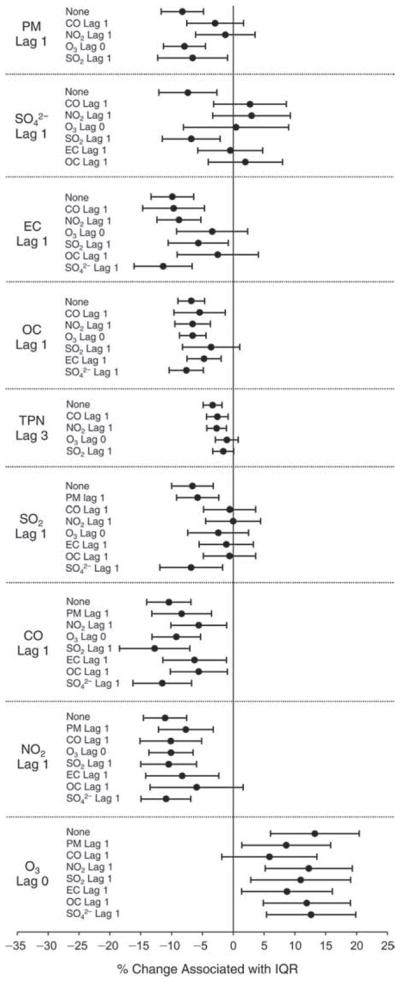
Estimated means and 95% CIs for the percent change in platelet aggregation level associated with one IQR increase in pollutant concentration, controlling for temperature (df = 3), RH (df = 3), 7-day moving average of temperature (df = 3), 3-day moving average of RH (df = 3), sex, day of the week, and a second pollutant.
Figure C.26.
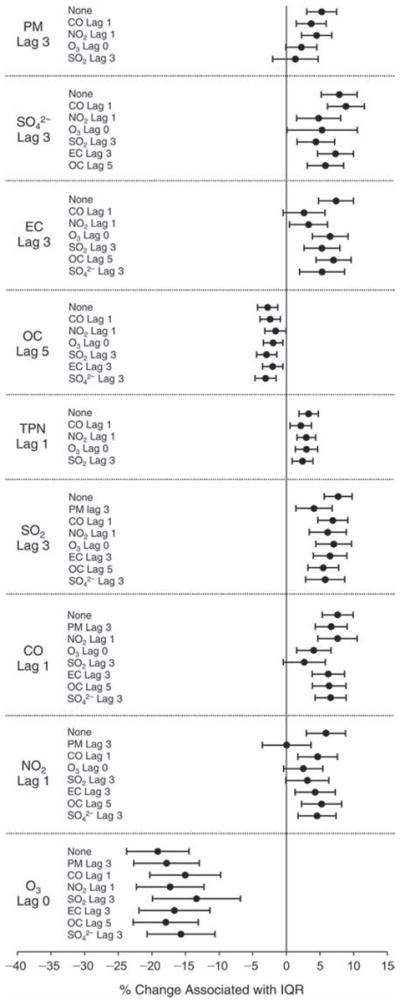
Estimated means and 95% CIs for the percent change in vWF level associated with one IQR increase in pollutant concentration, controlling for temperature (df = 3), RH (df = 3), 6-day moving average of temperature (df = 3), 6-day moving average of RH (df = 3), sex, day of the week, and a second pollutant.
APPENDIX D. Summary of Time–Activity Data for Study Subjects
Table D.1.
Differences in Average Time (hr) Spent Traveling Between Visits
| Foot/Bicycle | Motorcycling | Car/Taxi | Bus | Train/Subway | |
|---|---|---|---|---|---|
| Visit 1 (n = 125) | |||||
| Mean | 1.06 | 0.00 | 0.05 | 0.78 | 0.08 |
| SD | 0.21 | 0.00 | 0.04 | 0.18 | 0.06 |
| Visit 2 (n = 123) | |||||
| Mean | 0.83 | 0.07 | 0.09 | 0.68 | 0.04 |
| SD | 0.18 | 0.06 | 0.06 | 0.17 | 0.04 |
| Visit 3 (n = 125) | |||||
| Mean | 0.87 | 0.00 | 0.14 | 0.80 | 0.23 |
| SD | 0.18 | 0.00 | 0.08 | 0.18 | 0.10 |
| Visit 4 (n = 124) | |||||
| Mean | 0.63 | 0.00 | 0.02 | 0.82 | 0.06 |
| SD | 0.16 | 0.00 | 0.03 | 0.18 | 0.05 |
| Visit 5 (n = 123) | |||||
| Mean | 0.69 | 0.00 | 0.07 | 0.61 | 0.08 |
| SD | 0.17 | 0.00 | 0.05 | 0.16 | 0.06 |
| Visit 6 (n = 124) | |||||
| Mean | 0.66 | 0.00 | 0.06 | 0.73 | 0.15 |
| SD | 0.16 | 0.01 | 0.05 | 0.17 | 0.08 |
| P value | 0.003 | 0.42 | 0.16 | 0.57 | 0.20 |
| ICC (95% CI)a | 0.31 (0.23 to 0.39) | 0.00 (−0.04 to 0.05) | 0.15 (0.09 to 0.22) | 0.37 (0.30 to 0.46) | 0.07 (0.02 to 0.13) |
ICC indicates intraclass correlation coefficient.
Table D.2.
Differences in Average Time (hr) Spent Indoors and Outdoors Between Visits
| Inside Home | Inside Work | Inside Other Setting | Outside | |
|---|---|---|---|---|
| Visit 1 (n = 125) | ||||
| Mean | 13.42 | 6.26 | 1.20 | 0.69 |
| SD | 0.50 | 0.44 | 0.22 | 0.17 |
| Visit 2 (n = 123) | ||||
| Mean | 10.48 | 7.32 | 1.29 | 0.97 |
| SD | 0.50 | 0.46 | 0.23 | 0.20 |
| Visit 3 (n = 125) | ||||
| Mean | 11.43 | 7.46 | 1.36 | 0.45 |
| SD | 0.50 | 0.46 | 0.23 | 0.14 |
| Visit 4 (n = 124) | ||||
| Mean | 12.82 | 7.68 | 1.06 | 0.43 |
| SD | 0.50 | 0.47 | 0.21 | 0.13 |
| Visit 5 (n = 123) | ||||
| Mean | 11.99 | 8.09 | 1.41 | 0.43 |
| SD | 0.50 | 0.47 | 0.23 | 0.13 |
| Visit 6 (n = 124) | ||||
| Mean | 12.73 | 7.65 | 1.21 | 0.41 |
| SD | 0.50 | 0.47 | 0.22 | 0.13 |
| P value | 0.02 | 0.20 | 0.74 | 0.007 |
| ICC (95% CI)a | 0.20 (0.13 to 0.28) | 0.23 (0.16 to 0.31) | 0.20 (0.14 to 0.28) | 0.21 (0.15 to 0.29) |
ICC indicates intraclass correlation coefficient.
Table D.3.
Differences in Average Time (hr) Spent Engaged in Various Activities Between Visits
| Cooking | Sleeping | Exercising | At a Special Event | With Someone Smoking in the Same Room | |
|---|---|---|---|---|---|
| Visit 1 (n = 125) | |||||
| Mean | 0.05 | 8.10 | 0.53 | 0.06 | 0.03 |
| SD | 0.05 | 0.47 | 0.15 | 0.05 | 0.03 |
| Visit 2 (n = 123) | |||||
| Mean | 0.09 | 6.89 | 0.96 | 0.30 | 0.04 |
| SD | 0.06 | 0.45 | 0.20 | 0.11 | 0.04 |
| Visit 3 (n = 125) | |||||
| Mean | 0.07 | 8.16 | 0.28 | 0.40 | 0.05 |
| SD | 0.05 | 0.47 | 0.11 | 0.13 | 0.04 |
| Visit 4 (n = 124) | |||||
| Mean | 0.04 | 8.16 | 0.27 | 0.46 | 0.00 |
| SD | 0.04 | 0.47 | 0.10 | 0.14 | 0.00 |
| Visit 5 (n = 123) | |||||
| Mean | 0.07 | 8.22 | 0.39 | 0.48 | 0.01 |
| SD | 0.06 | 0.47 | 0.13 | 0.14 | 0.02 |
| Visit 6 (n = 124) | |||||
| Mean | 0.08 | 8.08 | 0.31 | 0.38 | 0.00 |
| SD | 0.06 | 0.47 | 0.11 | 0.13 | 0.00 |
| P value | 0.79 | 0.02 | 0.24 | 0.23 | 0.45 |
| ICC (95% CI)a | 0.16 (0.10 to 0.23) | 0.24 (0.17 to 0.33) | 0.31 (0.24 to 0.40) | 0.35 (0.28 to 0.44) | −0.01 (−0.05 to 0.05) |
ICC indicates intraclass correlation coefficient.
APPENDIX E. Degrees of Freedom Selected for Meteorologic Parameters and P Values for Associations Between Temperature or RH and Biomarkersa
| Biomarker | Temperature
|
RH |
Temperature Moving
Averageb
|
RH Moving
Averageb
|
||||
|---|---|---|---|---|---|---|---|---|
| df | P Value | df | P Value | df (dy) | P Value | df (dy) | P Value | |
| Autonomic Dysfunction | ||||||||
| HR (log) | 1 | 0.070 | 1 | 0.21 | — | NA | — | NA |
| HF (log) | 1 | 0.12 | 1 | 0.60 | 1 (7) | 0.77 | — | NA |
| LF (log) | 2 | 0.0004 | 1 | 0.043 | 1 (7) | 0.22 | 1 (5) | 0.0064 |
| LF/HF (log) | 2 | 0.17 | 1 | 0.054 | 1 (7) | 0.14 | 1 (2) | 0.022 |
| rMSSD (log) | 1 | 0.22 | 1 | 0.58 | 1 (7) | 0.48 | — | NA |
| SDNN (log) | 1 | 0.31 | 1 | 0.76 | 1 (7) | 0.28 | — | NA |
| VLF (log) | 1 | 0.31 | 1 | 0.89 | 1 (7) | 0.28 | — | NA |
| Total power (log) | 1 | 0.63 | 1 | 0.11 | 1 (7) | 0.17 | 1 (5) | 0.027 |
| DBP | 3 | 0.091 | 3 | 0.78 | 3 (7) | 0.66 | 3 (5) | 0.017 |
| SBP | 3 | 0.19 | 2 | 0.010 | 3 (7) | 0.041 | 3 (2) | 0.027 |
| Systemic Inflammation and Oxidative Stress | ||||||||
| CRPb | 1 | NA | 1 | NA | 1 (7) | NA | 2 (7) | NA |
| Fibrinogen | 3 | 0.0002 | 1 | 0.17 | 1 (6) | 0.022 | — | NA |
| RBCs | 1 | 0.0001 | 1 | 0.57 | — | NA | 1 (4) | 0.0002 |
| WBCs | 1 | 0.0924 | 1 | 0.49 | 1 (7) | 0.13 | 2 (7) | 0.027 |
| Lymphocytes | 1 | <0.0001 | 1 | 0.17 | — | NA | — | NA |
| Neutrophils | 1 | 0.28 | 1 | 0.42 | 1 (7) | 0.24 | — | NA |
| Urinary 8-OHdG (log) | 1 | 0.37 | 1 | 0.11 | 1 (7) | 0.72 | 3 (2) | 0.19 |
| Pulmonary Oxidative Stress and Inflammation | ||||||||
| FeNO (log) | 2 | 0.0021 | 3 | <0.0001 | 2 (7) | <0.0001 | 3 (7) | 0.0001 |
| EBC | ||||||||
| Nitrite (log) | 2 | 0.0004 | 1 | <0.0001 | 3 (7) | <0.0001 | 3 (3) | <0.0001 |
| Nitrate (log) | 2 | <0.0001 | 1 | <0.0001 | 3 (7) | <0.0001 | 3 (7) | <0.0001 |
| Nitrite+nitrate (log) | 1 | <0.0001 | 3 | <0.0001 | 3 (7) | <0.0001 | 3 (5) | <0.0001 |
| pH | 1 | 0.45 | 1 | 0.38 | 3 (6) | <0.0001 | 1 (3) | 0.0010 |
| 8-Isoprostaneb | 1 | NA | 1 | NA | 2 (7) | NA | 1 (2) | NA |
| Hemostasis | ||||||||
| sCD62P (log) | 1 | 0.017 | 3 | 0.0005 | 2 (7) | 0.85 | 2 (4) | 0.0063 |
| sCD40L (log) | 1 | 0.43 | 1 | 0.57 | 1 (5) | 0.011 | 1 (2) | 0.24 |
| Adrenaline | 3 | <0.0001 | 3 | 0.0097 | 3 (7) | 0.72 | 3 (3) | <0.0001 |
| vWF | 3 | 0.0058 | 3 | <0.0001 | 3 (7) | 0.077 | 3 (6) | <0.0001 |
P values were not available from the modeling software for the overall effects of temperature and RH.
The number of days included in the moving average as well as the degrees of freedom chosen for the natural splines are listed in the df (dy) column. If the AIC was not minimized by adding a moving average to the model, then this term was not added, those cells contain a dash, and the corresponding P values are listed as not available (NA).
APPENDIX F. Biomarker Results from a Comparison of Two-Pollutant Models
Figure F.1. Estimated means and 95% CIs for the percent change in urinary 8-OHdG controlling for temperature (df = 1), RH (df = 1), 7-day moving average for temperature (df = 1), 2-day moving average for RH (df = 3), sex, day of the week, and a second pollutant.
Left: results of a two-pollutant model controlling for the second pollutant using the most significant lag day; Right: results of a two-pollutant model controlling for the second pollutant using the same lag day as the primary pollutant.
Figure F.2. Estimated means and 95% CIs for the percent change in sCD40L controlling for temperature (df = 1), RH (df = 1), 5-day moving average for temperature (df = 1), 2-day moving average for RH (df = 1), sex, day of the week, and a second pollutant.
Left: results of a two-pollutant model controlling for the second pollutant using the most significant lag day; Right: results of a two-pollutant model controlling for the second pollutant using the same lag day as the primary pollutant.
Figure F.3. Estimated means and 95% CIs for the percent change in sCD62P controlling for temperature (df = 1), RH (df = 3), 7-d ay moving average for temperature (df = 2), 4-day moving average for RH (df = 2), sex, day of the week, and a second pollutant.
Left: results of a two-pollutant model controlling for the second pollutant using the most significant lag day; Right: results of a two-pollutant model controlling for the second pollutant using the same lag day as the primary pollutant.
Figure F.4. Estimated means and 95% CIs for the percent change in FeNO controlling for temperature (df = 2), RH (df = 3), 7-day moving average for temperature (df = 2), 7-day moving average for RH (df = 3), sex, day of the week, and a second pollutant.
Left: results of a two-pollutant model controlling for the second pollutant using the most significant lag day; Right: results of a two-pollutant model controlling for the second pollutant using the same lag day as the primary pollutant.
Figure F.5. Estimated means and 95% CIs for the percent change in EBC nitrite controlling for temperature (df = 2), RH (df = 1), 7-day moving average for temperature (df = 3), 3-day moving average for RH (df = 3), sex, day of the week, and a second pollutant.
Left: results of a two-pollutant model controlling for the second pollutant using the most significant lag day; Right: results of a two-pollutant model controlling for the second pollutant using the same lag day as the primary pollutant.
Figure F.6. Estimated means and 95% CIs for the percent change in vWF controlling for temperature (df = 3), RH (df = 3), 6-day moving average for temperature (df = 3), 6-day moving average for RH (df = 3), sex, day of the week, and a second pollutant.
Left: results of a two-pollutant model controlling for the second pollutant using the most significant lag day; Right: results of a two-pollutant model controlling for the second pollutant using the same lag day as the primary pollutant.
APPENDIX G. Description of Statistical Models
This appendix describes the primary analyses for the biomarker outcomes. Modifications made in sensitivity analyses are described in the main report.
We used mixed model analyses to examine period (pre-, during-, and post-Olympics) effects as well as, separately, associations between biomarker levels, controlling for temperature, RH, sex, and day of the week. We used the following basic algebraic model for biomarkers measured as continuous outcomes, whether log-transformed or not:
where Yijk represents the j th observation (j = 1,2) in the kth period (k = 1,2,3) for the i th subject. We included sex (Si = 1 if the ith subject was male and 0 if female) and day of the week (for example, D1,ijk = 1 if Sunday, 0 if not; D2,ijk = 1 if Monday, 0 if not, etc.) as categorical factors via indicator variables in all models. We used natural splines to adjust for the effects of temperature and RH for each biomarker (Hastie and Tibshirani, 1990). Specifically, the effects of same-day temperature and RH were included in all models. These are represented in the model given above as hT (TEMPijk) and hRH (RHijk) for temperature and RH, respectively, such that the degrees of freedom (see Appendix E) were specific for each meteorologic factor and biomarker. Then, if the AIC value was reduced, we added moving averages of temperature and/or RH. We chose only one moving average each for temperature and for RH, based on the model with the lowest AIC value, with the number of days extending back from the current day, for up to 7 days. We allowed up to 3 df to model the trend in association between pairs of variables (e.g., temperature and biomarker levels). The degrees of freedom were limited to 3 because in some cases (e.g., blood biomarkers) careful investigation of partial regression plots revealed that allowing a greater number of degrees of freedom resulted in bi- or tri-modal effects of temperature on predicted biomarker levels, which seemed to indicate overfitting. A summary of the degrees of freedom and the significance levels for each meteorologic factor is included in Appendix E. Once the base model was determined as described above, we added indicator variables for period and continuous pollutant levels in order to determine adjusted changes across periods or associations with continuous measures of the pollutants.
Some of the biomarkers had right-skewed distributions. Therefore, we took natural log transformations to stabilize variances and meet model assumptions. The results of the natural log transformations are found in Appendix E.
In order to account for correlation within subjects, the above model includes a random intercept for subject, inducing equicorrelation between all observations within subject. We compared three alternative correlation structures using AIC: (1) a single random effect for subject, which induced equicorrelation between all observations within subject; (2) multiple random effects for subject, as well as for session within subject, allowing observations within a session for a subject to be more highly correlated than between sessions within subject; and (3) use of a power function such that the correlation between observations was set to σ2ρdj,j′, where dj,j′ represented the number of days between two observations within subject, indexed by j and j′. The model that was consistently chosen as best across biomarkers was the simplest model in which a random effect for subject induced equicorrelation between all observations within subject. For details of estimation when the outcome was binary, see the software package documentation (R Development Core Team 2011) for the lmer routine (http://cran.r-project.org/web/packages/lme4/lme4.pdf).
All analyses were completed using R software programming (R Development Core Team 2011). Two sample R programs are given below: the first demonstrates the modeled analyses for a continuous outcome, and the second, for a binary outcome.
####################################################################
#   EBC Nitrite - PM
####################################################################
pm0<-matrix(0,7,9)
dat<-cbind(one$logEBCNitrite, one$pmlag1,
one$pmlag2, one$pmlag3, one$pmlag4, one$pmlag5,
one$pmlag6, one$pmlag7, one$TEMPHR24,
one$RHHR24, one$TEMPma7, one$RHma3,one$gender,
one$period, one$wkday, one$id)
dimnames(dat)[[2]]<-c(“logEBCNitrite”, “pmlag1”,
“pmlag2”,”pmlag3”,”pmlag4”,”pmlag5”,”pmlag6”,
“pmlag7”, “TEMPHR24”, “RHHR24”, “TEMPma7”,
“RHma3”, “gender”,”period”, “wkday”, “id”)
aa<-data.frame(dat)
for (i in 1:7)   {
xx=aa[, (1+i)]
a1<-lme(logEBCNitrite ~ xx + ns(TEMPHR24,2) +
ns(RHHR24,1)+ns(TEMPma7,3) + ns(RHma3,3) +
factor(gender) +factor(wkday), random=~1|id,
data=aa, na.action=na.omit)
ciu<- a1$coef$fixed[2]+1.96*sqrt(a1$var[2,2])
cil<- a1$coef$fixed[2]-1.96*sqrt(a1$var[2,2])
z<-(a1$coef$fixed[2]/sqrt(a1$var[2,2]))
p<-2*(1-pnorm(abs(z)))
pm0[i,]<-c(0,i-1, a1$coef$fixed[2],
sqrt(a1$var[2,2]), z, cil, ciu, p, AIC(a1))
}
pm<-cbind(“logEBCNitrite”, “pm”,pm0)
dimnames(pm)[[2]]<-c(“Biomarker”, “Pollutants”,
“Period”, “Lag”, “slope”, “se”, “z”,
“ci.lower”, “ci.upper”, “p”, “AIC”)
pm
#= = = = = = = = = = = = = = = = = = = = = = = = = = = = = = = = = = = = = =
# Categorical: EBC 8-ISO
#= = = = = = = = = = = = = = = = = = = = = = = = = = = = = = = = = = = = = =
one$u0<-1*(one$iso<1.56)
qt<-quantile(one$iso[one$iso>1.56], probs =
seq(0, 1, 0.25), na.rm=T)
qt3<-quantile(one$iso, probs = .75, na.rm=T)
# > qt3 75% 6.21
one$u1<-(one$iso>=qt3)*1
mean(one$u1, na.rm=T) #[1] 0.2581522
####################################################################
#  EBC 8-ISO - pm
####################################################################
pm0<-matrix(0,7,9)
dat<-cbind(one$iso, one$u1, one$pmlag1,
one$pmlag2, one$pmlag3, one$pmlag4, one$pmlag5,
one$pmlag6, one$pmlag7, one$TEMPHR24,
one$RHHR24,one$TEMPma7,one$RHma2, one$gender,
one$period, one$wkday, one$id)
dimnames(dat)[[2]]<-c(“iso”, “u1”, “pmlag1”,
“pmlag2”, “pmlag3”, “pmlag4”, “pmlag5”,
“pmlag6”, “pmlag7”,”TEMPHR24”, “RHHR24”,
“TEMPma7”,”RHma2”,”gender”,”period”, “wkday”,
“id”)
aa<-data.frame(dat)
for (i in 1:7) {
xx=aa[,(2+i)]
a1<-lmer(u1~xx+ ns(TEMPHR24,1) + ns(RHHR24,1)
+ns(TEMPma7,2) +ns(RHma2,1)+ factor(gender)
+ factor(wkday)+(1|id), data=aa,
na.action=na.omit, family=“binomial”)
ciu<- fixef(a1)[2] +1.96*sqrt(vcov(a1)[2,2])
cil<- fixef(a1)[2] -1.96*sqrt(vcov(a1)[2,2])
z<-fixef(a1)[2]/sqrt(vcov(a1)[2,2])
p<-2*(1-pnorm(abs(z)))
pm0[i,]<-c(0,i-1, fixef(a1)[2],
sqrt(vcov(a1)[2,2]), z, cil, ciu, p,
AIC(logLik(a1)))
}
pm<-cbind(“8-ISO”,”pm”,pm0)
dimnames(pm)[[2]]<-c(“Biomarker”, “Pollutants”,
“Period”, “Lag”, “slope”, “se”, “z”, “ci.lower”,
“ci.upper”, “p”, “AIC”)
pm
APPENDIX I. Intraclass Correlations for Biomarkers by Perioda
| Biomarker | Pre-Olympics<br1>Mean (95% CI) | During-Olympics<br1>Mean (95% CI) | Post-Olympics<br1>Mean (95% CI) |
|---|---|---|---|
| Autonomic Dysfunction | |||
| HR (bpm)b | 0.51 (0.36 to 0.63) | 0.62 (0.49 to 0.72) | 0.65 (0.54 to 0.74) |
| HF (ms2)b | 0.61 (0.48 to 0.71) | 0.69 (0.57 to 0.78) | 0.50 (0.35 to 0.62) |
| LF (ms2)b | 0.50 (0.35 to 0.63) | 0.39 (0.21 to 0.54) | 0.45 (0.30 to 0.58) |
| LF/HFb | 0.64 (0.52 to 0.74) | 0.54 (0.39 to 0.66) | 0.53 (0.39 to 0.65) |
| rMSSD (ms)b | 0.57 (0.43 to 0.68) | 0.31 (0.13 to 0.47) | 0.61 (0.49 to 0.71) |
| SDNN (ms)b | 0.58 (0.45 to 0.69) | 0.35 (0.17 to 0.51) | 0.58 (0.45 to 0.69) |
| VLF (ms2)b | 0.13 (−0.06 to 0.31) | 0.29 (0.10 to 0.46) | 0.20 (0.02 to 0.36) |
| Total power (ms2)b | 0.47 (0.31 to 0.60) | 0.54 (0.39 to 0.66) | 0.38 (0.22 to 0.52) |
| DBP (mmHg) | 0.65 (0.54 to 0.74) | 0.72 (0.62 to 0.80) | 0.63 (0.51 to 0.73) |
| SBP (mmHg) | 0.79 (0.71 to 0.85) | 0.82 (0.75 to 0.87) | 0.71 (0.61 to 0.79) |
| Systemic Inflammation and Oxidative Stress | |||
| CRP (%≥0.3 mg/L) | NA | NA | NA |
| Fibrinogen (g/L) | 0.49 (0.34 to 0.61) | 0.65 (0.53 to 0.74) | 0.54 (0.40 to 0.65) |
| RBCs (×1012/L) | 0.87 (0.82 to 0.91) | 0.93 (0.90 to 0.95) | 0.93 (0.90 to 0.95) |
| WBCs (×109/L) | 0.64 (0.52 to 0.73) | 0.69 (0.58 to 0.77) | 0.54 (0.40 to 0.65) |
| Lymphocytes (×109/L) | 0.71 (0.61 to 0.79) | 0.80 (0.73 to 0.86) | 0.74 (0.65 to 0.81) |
| Neutrophils (× 109/L) | 0.57 (0.44 to 0.68) | 0.56 (0.42 to 0.67) | 0.42 (0.26 to 0.56) |
| Urinary 8-OHdG (mg/mol creatinine)b | 0.02 (−0.16 to 0.20) | 0.02 (−0.16 to 0.20) | 0.39 (0.22 to 0.54) |
| Pulmonary Oxidative Stress and Inflammation | |||
| FeNO (ppb)b | 0.40 (0.24 to 0.54) | 0.34 (0.17 to 0.49) | 0.24 (0.07 to 0.40) |
| EBC | |||
| Nitrite (μM)b | 0.18 (0.01 to 0.34) | −0.07 (−0.25 to 0.11) | 0.07 (−0.16 to 0.29) |
| Nitrate (μM)b | 0.04 (−0.13 to 0.21) | −0.17 (−0.34 to 0.01) | −0.07 (−0.29 to 0.16) |
| Nitrite+nitrate (μM)b | 0.14 (−0.04 to 0.31) | −0.13 (−0.30 to 0.05) | −0.04 (−0.26 to 0.19) |
| pH | −0.04 (−0.21 to 0.14) | 0.20 (0.02 to 0.37) | 0.04 (−0.14 to 0.21) |
| 8-Isoprostane (%≥1.56 pg/ml) | NA | NA | NA |
| Hemostasis | |||
| sCD62P (ng/mL)b | 0.07 (−0.11 to 0.24) | 0.40 (0.24 to 0.54) | 0.38 (0.22 to 0.52) |
| sCD40L (ng/mL)b | 0.02 (−0.16 to 0.19) | 0.22 (0.04 to 0.38) | −0.19 (−0.36 to −0.01) |
| Platelet aggregation (%) | 0.55 (0.42 to 0.66) | 0.50 (0.35 to 0.62) | 0.35 (0.18 to 0.49) |
| vWF (%) | 0.79 (0.71 to 0.85) | 0.79 (0.71 to 0.85) | 0.73 (0.64 to 0.80) |
NA indicates not available.
Log transformation applied.
APPENDIX J. Estimated Means and 95% Confidence Intervals for Percent Change in Biomarker Levels from Period to Period, Controlling for Temperature, RH, and Their Moving Averages Having Statistically Significant Effects on Biomarkers
Figure J.1.
Estimated means and 95% CIs for the percent change in biomarker levels from (left) the pre-Olympics to the during-Olympics period and (right) the during-Olympics to the post-Olympics period, controlling for temperature, RH, and their moving averages having statistically significant effects on biomarkers.
APPENDIX K. Percent Change in Biomarker Levels Associated with One IQR Increase in Pollutant Concentration With and Without Controlling for Temperature and RH
Figure K.1. Estimated means and 95% CIs for the percent change in DBP associated with one IQR increase in pollutant concentration.
Left results without any adjustment for temperature or RH; Middle: results with full adjustments; Right: results with adjustments for temperature and RH having statistically sig-nificant effects on biomarkers.
Figure K.2. Estimated means and 95% CIs for the percent change in EBC pH associated with one IQR increase in pollutant concentration.
Left results without any adjustment for temperature or RH; Middle: results with full adjustments; Right: results with adjustments for temperature and RH having statistically significant effects on biomarkers.
Figure K.3. Estimated means and 95% CIs for the percent change in LF (HRV) associated with one IQR increase in pollutant concentration.
Left results without any adjustment for temperature or RH; Middle: results with full adjustments; Right: results with adjustments for temperature and RH having statistically significant effects on biomarkers.
Figure K.4. Estimated means and 95% CIs for the percent change in HR associated with one IQR increase in pollutant concentration.
Left results without any adjustment for temperature or RH; Right: results with full adjustments.
Figure K.5. Estimated means and 95% CIs for the percent change in HF (HRV) associated with one IQR increase in pollutant concentration.
Left results without any adjustment for temperature or RH; Right: results with full adjustments.
Figure K.6. Estimated means and 95% CIs for the percent change in total power (HRV) associated with one IQR increase in pollutant concentration.
Left: results without any adjustment for temperature or RH; Right: results with full adjustments.
Figure K.7. Estimated means and 95% CIs for the percent change in VLF (HRV) associated with one IQR increase in pollutant concentration.
Left: results without any adjustment for temperature or RH; Right: results with full adjustments.
Figure K.8. Estimated means and 95% CIs for the percent change in lymphocyte count associated with one IQR increase in pollutan t concentration.
Left: results without any adjustment for temperature or RH; Middle: results with full adjustments; Right: results with adjustments for temperature and RH having statistically significant effects on biomarkers.
Figure K.9. Estimated means and 95% CIs for the percent change in neutrophil count associated with one IQR increase in pollutant concentration.
Left: results without any adjustment for temperature or RH; Right: results with full adjustments.
Figure K.10. Estimated means and 95% CIs for the percent change in rMSSD (HRV) associated with one IQR increase in pollutant concentration.
Left: results without any adjustment for temperature or RH; Right: results with full adjustments.
Figure K.11. Estimated means and 95% CIs for the percent change in SBP associated with one IQR increase in pollutant concentration.
Left: results without any adjustment for temperature or RH; Middle: results with full adjustments; Right: results with adjustments for temperature and RH having statistically sig-nificant effects on biomarkers.
Figure K.12. Estimated means and 95% CIs for the percent change in SDNN (HRV) associated with one IQR increase in pollutant concentration.
Left: results without any adjustment for temperature or RH; Right: results with full adjustments.
Figure K.13. Estimated means and 95% CIs for the percent change in WBC count associated with one IQR increase in pollutant concentration.
Left: results without any adjustment for temperature or RH; Middle: results with full adjustments; Right: results with adjustments for temperature and RH having statistically significant effects on biomarkers.
Figure K.14. Estimated means and 95% CIs for the percent change in percentage of neutrophils associated with one IQR increase in pollutant concentration.
Left: results without any adjustment for temperature or RH; Middle: results with full adjustments; Right: results with adjustments for temperature and RH having statistically significant effects on biomarkers.
APPENDIX L. Percent Change in Biomarkers Associated with One IQR Increase in Pollutant Concentration, Controlling for Several Factors and Excluding Rainy Days
Figure L.1. Estimated means and 95% CIs for the percent change in DBP associated with one IQR increase in pollutant concentration, controlling for temperature (df = 3), RH (df = 3), 7-day moving average for temperature (df = 3), 5-day moving average for RH (df = 3), sex, and day of the week.
Left: results including all observations; Right: results excluding observations on rainy days. Number of days observations were excluded: 4 out of 51 pre-Olympics; 5 out of 64 during Olympics; 3 out of 38 post-Olympics.
Figure L.2. Estimated means and 95% CIs for the percent change in EBC nitrate associated with one IQR increase in pollutant con centration, controlling for temperature (df = 2), RH (df = 1), 7-day moving average for temperature (df = 3), 7-day moving average for RH (df = 3), sex, and day of the week.
Left: results including all observations; Right: results excluding observations on rainy days. Number of days observations were excluded: 4 out of 51 pre-Olympics; 5 out of 64 during Olympics; 3 out of 38 post-Olympics.
Figure L.3. Estimated means and 95% CIs for the percent change in EBC nitrite associated with one IQR increase in pollutant con centration, controlling for temperature (df = 2), RH (df = 1), 7-day moving average for temperature (df = 3), 3-day moving average for RH (df = 3), sex, and day of the week.
Left: results including all observations; Right: results excluding observations on rainy days. Number of days observations were excluded: 4 out of 51 pre-Olympics; 5 out of 64 during Olympics; 3 out of 38 post-Olympics.
Figure L.4. Estimated means and 95% CIs for the percent change in EBC nitrite+nitrate associated with one IQR increase in pollu tant concentration, controlling for temperature (df = 1), RH (df = 3), 7-day moving average for temperature (df = 3), 5-day moving average for RH (df = 3), sex, and day of the week.
Left: results including all observations; Right: results excluding observations on rainy days. Number of days observations were excluded: 4 out of 51 pre-Olympics; 5 out of 64 during Olympics; 3 out of 38 post-Olympics.
Figure L.5. Estimated means and 95% CIs for the percent change in EBC pH associated with one IQR increase in pollutant concentration, controlling for temperature (df = 1), RH (df = 1), 6-day moving average for temperature (df = 3), 3-day moving average for RH (df = 1), sex, and day of the week.
Left: results including all observations; Right: results excluding observations on rainy days. Number of days observations were excluded: 4 out of 51 pre-Olympics; 5 out of 64 during Olympics; 3 out of 38 post-Olympics.
Figure L.6. Estimated means and 95% CIs for the percent change in FeNO associated with one IQR increase in pollutant concentration, controlling for temperature (df = 2), RH (df = 3), 7-day moving average of temperature (df = 2), 7-day moving average of RH (df = 3), sex, and day of the week.
Left: results including all observations; Right: results excluding observations on rainy days. Number of days observations were excluded: 4 out of 51 pre-Olympics; 5 out of 64 during Olympics; 3 out of 38 post-Olympics.
Figure L.7. Estimated means and 95% CIs for the percent change in fibrinogen associated with one IQR increase in pollutant concentration, controlling for temperature (df = 3), RH (df = 1), 6-day moving average for temperature (df = 1), sex, and day of the week.
Left: results including all observations; Right: results excluding observations on rainy days. Number of days observations were excluded: 4 out of 51 pre-Olympics; 5 out of 64 during Olympics; 3 out of 38 post-Olympics.
Figure L.8. Estimated means and 95% CIs for the percent change in HF (HRV) associated with one IQR increase in pollutant concentration, controlling for temperature (df = 1), RH (df = 1), 7-day moving average for temperature (df = 1), and sex.
Left: results including all observations; Right: results excluding observations on rainy days. Number of days observations were excluded: 4 out of 51 pre-Olympics; 5 out of 64 during Olympics; 3 out of 38 post-Olympics.
Figure L.9. Estimated means and 95% CIs for the percent change in LF (HRV) associated with one IQR increase in pollutant concentration, controlling for temperature (df = 2), RH (df = 1), 7-day moving average for temperature (df = 1), 5-day moving average for RH (df = 1), sex, and day of the week.
Left: results including all observations; Right: results excluding observations on rainy days. Number of days observations were excluded: 4 out of 51 pre-Olympics; 5 out of 64 during Olympics; 3 out of 38 post-Olympics.
Figure L.10. Estimated means and 95% CIs for the percent change in LF/HF (HRV) associated with one IQR increase in pollutant concentration, controlling for temperature (df = 2), RH (df = 1), 7-day moving average for temperature (df = 1), 2-day moving average for RH (df = 1), sex, and day of the week.
Left: results including all observations; Right: results excluding observations on rainy days. Number of days observations were excluded: 4 out of 51 pre-Olympics; 5 out of 64 during Olympics; 3 out of 38 post-Olympics.
Figure L.11. Estimated means and 95% CIs for the percent change in HR associated with one IQR increase in pollutant concentration, controlling for temperature (df = 1), RH (df = 1), sex, and day of the week.
Left: results including all observations; Right: results excluding observations on rainy days. Number of days observations were excluded: 4 out of 51 pre-Olympics; 5 out of 64 during Olympics; 3 out of 38 post-Olympics.
Figure L.12. Estimated means and 95% CIs for the percent change in lymphocyte count associated with one IQR increase in pollutant concentration, controlling for temperature (df = 1), RH (df = 1), sex, and day of the week.
Left: results including all observations; Right: results excluding observations on rainy days. Number of days observations were excluded: 4 out of 51 pre-Olympics; 5 out of 64 during Olympics; 3 out of 38 post-Olympics.
Figure L.13. Estimated means and 95% CIs for the percent change in total power (HRV) associated with one IQR increase in pollutant concentration, controlling for temperature (df = 1), RH (df = 1), 7-day moving average for temperature (df = 1), 5-day moving average for RH (df = 1), sex, and day of the week.
Left: results including all observations; Right: results excluding observations on rainy days. Number of days observations were excluded: 4 out of 51 pre-Olympics; 5 out of 64 during Olympics; 3 out of 38 post-Olympics.
Figure L.14. Estimated means and 95% CIs for the percent change in VLF (HRV) associated with one IQR increase in pollutant concentration, controlling for temperature (df = 1), RH (df = 1), 7-day moving average for temperature (df = 1), sex, and day of the week.
Left: results including all observations; Right: results excluding observations on rainy days. Number of days observations were excluded: 4 out of 51 pre-Olympics; 5 out of 64 during Olympics; 3 out of 38 post-Olympics.
Figure L.15. Estimated means and 95% CIs for the percent change in percentage of lymphocytes associated with one IQR increase in pollutant concentration, controlling for temperature (df = 3), RH (df = 3), 7-day moving average for temperature (df = 3), 7-day moving average for RH (df = 3), sex, and day of the week.
Left: results including all observations; Right: results excluding observations on rainy days. Number of days observations were excluded: 4 out of 51 pre-Olympics; 5 out of 64 during Olympics; 3 out of 38 post-Olympics.
Figure L.16. Estimated means and 95% CIs for the percent change in neutrophils associated with one IQR increase in pollutant co ncentration, controlling for temperature (df = 3), RH (df = 3), 7-day moving average for temperature (df = 3), 2-day moving average for RH (df = 3), sex, and day of the week.
Left: results including all observations; Right: results excluding observations on rainy days. Number of days observations were excluded: 4 out of 51 pre-Olympics; 5 out of 64 during Olympics; 3 out of 38 post-Olympics.
Figure L.17. Estimated means and 95% CIs for the percent change in RBC count associated with one IQR increase in pollutant concentration, controlling for temperature (df = 1), RH (df = 1), 4-day moving average for RH (df = 1), sex, and day of the week.
Left: results including all observations; Right: results excluding observations on rainy days. Number of days observations were excluded: 4 out of 51 pre-Olympics; 5 out of 64 during Olympics; 3 out of 38 post-Olympics.
Figure L.18. Estimated means and 95% CIs for the percent change in rMSSD (HRV) associated with one IQR increase in pollutant concentration, controlling for temperature (df = 1), RH (df = 1), 7-day moving average for temperature (df = 1), sex, and day of the week.
Left: results including all observations; Right: results excluding observations on rainy days. Number of days observations were excluded: 4 out of 51 pre-Olympics; 5 out of 64 during Olympics; 3 out of 38 post-Olympics.
Figure L.19. Estimated means and 95% CIs for the percent change in SBP associated with one IQR increase in pollutant concentration, controlling for temperature (df = 3), RH (df = 2), 7-day moving average for temperature (df = 3), 2-day moving average for RH (df = 3), sex, and day of the week.
Left: results including all observations; Right: results excluding observations on rainy days. Number of days observations were excluded: 4 out of 51 pre-Olympics; 5 out of 64 during Olympics; 3 out of 38 post-Olympics.
Figure L.20. Estimated means and 95% CIs for the percent change in sCD40L associated with one IQR increase in pollutant concentration, controlling for temperature (df = 1), RH (df = 1), 5-day moving average for temperature (df = 1), 2-day moving average for RH (df = 1), sex, and day of the week.
Left: results including all observations; Right: results excluding observations on rainy days. Number of days observations were excluded: 4 out of 51 pre-Olympics; 5 out of 64 during Olympics; 3 out of 38 post-Olympics.
Figure L.21. Estimated means and 95% CIs for the percent change in sCD62P associated with one IQR increase in pollutant concentration, controlling for temperature (df = 1), RH (df = 3), 7-day moving average for temperature (df = 2), 4-day moving average for RH (df = 2), sex, and day of the week.
Left: results including all observations; Right: results excluding observations on rainy days. Number of days observations were excluded: 4 out of 51 pre-Olympics; 5 out of 64 during Olympics; 3 out of 38 post-Olympics.
Figure L.22. Estimated means and 95% CIs for the percent change in SDNN associated with one IQR increase in pollutant concentra tion, controlling for temperature (df = 1), RH (df = 1), 7-day moving average for temperature (df = 1), sex, and day of the week.
Left: results including all observations; Right: results excluding observations on rainy days. Number of days observations were excluded: 4 out of 51 pre-Olympics; 5 out of 64 during Olympics; 3 out of 38 post-Olympics.
Figure L.23. Estimated means and 95% CIs for the percent change in vWF associated with one IQR increase in pollutant concentration, controlling for temperature (df = 3), RH (df = 3), 7-day moving average for temperature (df = 3), 6-day moving average for RH (df = 3), sex, and day of the week.
Left: results including all observations; Right: results excluding observations on rainy days. Number of days observations were excluded: 4 out of 51 pre-Olympics; 5 out of 64 during Olympics; 3 out of 38 post-Olympics.
Figure L.24. Estimated means and 95% CIs for the percent change in WBC count associated with one IQR increase in pollutant concentration, controlling for temperature (df = 1), RH (df = 1), 7-day moving average for temperature (df = 3), 6-day moving average for RH (df = 3), sex, and day of the week.
Left: results including all observations; Right: results excluding observations on rainy days. Number of days observations were excluded: 4 out of 51 pre-Olympics; 5 out of 64 during Olympics; 3 out of 38 post-Olympics.
APPENDIX M. Percent Change in Biomarkers Associated with One IQR Increase in Pollutant Concentration, Controlling for Several Factors and Excluding Observations in the Post-Olympics Period
Figure M.1. Estimated means and 95% CIs for the percent change in urinary 8-OHdG (corrected by creatinine) associated with one IQR increase in pollutant concentration, controlling for temperature (df = 1), RH (df = 1), 7-day moving average of temperature (df = 1), 2-day moving average of RH (df = 3), sex, and day of the week.
Left: results including all three periods; Right: results of the pre- and during-Olympics periods only.
Figure M.2. Estimated means and 95% CIs for the percent change in EBC nitrite associated with one IQR increase in pollutant concentration, controlling for temperature (df = 2), RH (df = 1), 7-day moving average of temperature (df = 3), 3-day moving average of RH (df = 3), sex, and day of the week.
Left: results including all three periods; Right: results of the pre- and during-Olympics periods only.
Figure M.3. Estimated means and 95% CIs for the percent change in FeNO associated with one IQR increase in pollutant concentration, controlling for temperature (df = 2), RH (df = 3), 7-day moving average of temperature (df = 2), 7-day moving average of RH (df = 3), sex, and day of the week.
Left: results including all three periods; Right: results of the pre- and during-Olympics periods only.
Figure M.4. Estimated means and 95% CIs for the percent change in sCD40L associated with one IQR increase in pollutant concentration, controlling for temperature (df = 1), RH (df = 1), 5-day moving average of temperature (df = 1), 2-day moving average of RH (df = 1), sex, and day of the week.
Left: results including all three periods; Right: results of the pre- and during-Olympics periods only.
Figure M.5. Estimated means and 95% CIs for the percent change in sCD62P associated with one IQR increase in pollutant concentration, controlling for temperature (df = 1), RH (df = 3), 7-day moving average of temperature (df = 2), 4-day moving average of RH (df = 2), sex, and day of the week.
Left: results including all three periods; Right: results of the pre- and during-Olympics periods only.
Figure M.6. Estimated means and 95% CIs for the percent change in vWF associated with one IQR increase in pollutant concentrati on, controlling for temperature (df = 3), RH (df = 3), 7-day moving average of temperature (df = 3), 6-day moving average of RH (df = 3), sex, and day of the week.
Left: results including all three periods; Right: results of the pre- and during-Olympics periods only.
APPENDIX N. Percent Change in Biomarkers Associated with One IQR Increase in Pollutant Concentration, Controlling for Several Factors and With or Without Period Adjustment
Figure N.1. Estimated means and 95% CIs for the percent change in sCD62P associated with one IQR increase in pollutant concentration, controlling for temperature (df = 1), RH (df = 3), 7-day moving average of temperature (df = 2), 4-day moving average of RH (df = 2), sex, and day of the week.
Left: results for which the period factor was not adjusted; Right: results for which the period factor was adjusted.
Figure N.2. Estimated means and 95% CIs for the percent change in vWF associated with one IQR increase in pollutant concentrati on, controlling for temperature (df = 3), RH (df = 3), 7-day moving average of temperature (df = 3), 6-day moving average of RH (df = 3), sex, and day of the week.
Left: results for which the period factor was not adjusted; Right: results for which the period factor was adjusted.
Figure N.3. Estimated means and 95% CIs for the percent change in FeNO associated with one IQR increase in pollutant concentration, controlling for temperature (df = 2), RH (df = 3), 7-day moving average of temperature (df = 2), 7-day moving average of RH (df = 3), sex, and day of the week.
Left: results for which the period factor was not adjusted; Right: results for which the period factor was adjusted.
Figure N.4. Estimated means and 95% CIs for the percent change in EBC nitrite+nitrate associated with one IQR increase in pollu tant concentration, controlling for temperature (df = 1), RH (df = 3), 7-day moving average of temperature (df = 3), and 5-day moving average of RH (df = 3), sex, and day of the week.
Left: results for which the period factor was not adjusted; Right: results for which the period factor was adjusted.
APPENDIX O. Percent Change in Biomarkers Associated with One IQR Increase in Pollutant Concentration, Controlling for Several Factors, Including Subject as a Fixed or Random Effect
Figure O.1. Estimated means and 95% CIs for the percent change in sCD62P associated with one IQR increase in pollutant concentration, controlling for temperature (df = 1), RH (df = 3), 7-day moving average of temperature (df = 2), and 4-day moving average of RH (df = 2), sex, and day of the week.
Left: results controlling for subject as a random effect; Right: results controlling for subject as a fixed effect.
Figure O.2. Estimated means and 95% CIs for the percent change in vWF associated with one IQR increase in pollutant concentrati on, controlling for temperature (df = 3), RH (df = 3), 7-day moving average of temperature (df = 3), and 6-day moving average of RH (df = 3), sex, and day of the week, and treating the subject as a fixed effect.
Left: results controlling for subject as a random effect; Right: results controlling for subject as a fixed effect.
Figure O.3. Estimated means and 95% CIs for the percent change in FeNO associated with one IQR increase in pollutant concentration, controlling for temperature (df = 2), RH (df = 3), 7-day moving average of temperature (df = 2), and 7-day moving average of RH (df = 3), sex, and day of the week, and treating the subject as a fixed effect.
Left: results controlling for subject as a random effect; Right: results controlling for subject as a fixed effect.
Figure O.4. Estimated means and 95% CIs for the percent change in EBC nitrite+nitrate associated with one IQR increase in pollu tant concentration, controlling for temperature (df = 1), RH (df = 3), 7-day moving average of temperature (df = 3), and 5-day moving average of RH (df = 3), sex, and day of the week, and treating the subject as a fixed effect.
Left: results controlling for subject as a random effect; Right: results controlling for subject as a fixed effect.
APPENDIX P. PM2.5, Its Chemical Component Concentrations, and Particle Number, and Gaseous Pollutants by Period, with Mean and SD Based on Simple Algebraic Calculations
Table P.1.
Statistics for PM2.5 Mass and Chemical Components and Particle Number Concentration by Period Using Simple Algebraic Calculationsa
| Pollutant/Period | n | Mean | SD | Min | Median | Max | IQR |
|---|---|---|---|---|---|---|---|
| PM2.5 (μg/m3) | |||||||
| Whole | 100 | 85.2 | 51.9 | 14.6 | 80.6 | 268.2 | 76.8 |
| Pre | 35 | 100.9 | 38.8 | 24.4 | 95.8 | 219.1 | 39.3 |
| During | 33 | 69.4 | 42.9 | 14.6 | 59.2 | 171.4 | 66.5 |
| Post | 32 | 84.2 | 67.2 | 15.0 | 60.4 | 268.2 | 105.3 |
| SO42− (μg/m3) | |||||||
| Whole | 92 | 21.8 | 17.0 | 1.0 | 20.7 | 73.9 | 28.0 |
| Pre | 35 | 28.4 | 12.8 | 5.4 | 29.6 | 65.0 | 16.9 |
| During | 28 | 23.2 | 19.4 | 2.0 | 20.7 | 73.9 | 32.0 |
| Post | 29 | 12.4 | 15.2 | 1.0 | 4.8 | 47.8 | 15.9 |
| EC (μg/m3) | |||||||
| Whole | 94 | 2.3 | 1.3 | 0.6 | 2.1 | 6.7 | 1.4 |
| Pre | 35 | 2.2 | 0.7 | 0.6 | 2.2 | 4.3 | 0.7 |
| During | 28 | 1.4 | 0.6 | 0.6 | 1.3 | 3.1 | 0.6 |
| Post | 31 | 3.3 | 1.6 | 1.0 | 3.3 | 6.7 | 2.3 |
| OC (μg/m3) | |||||||
| Whole | 94 | 10.2 | 6.6 | 1.1 | 8.2 | 43.3 | 5.1 |
| Pre | 35 | 8.8 | 3.3 | 1.1 | 8.2 | 21.9 | 2.2 |
| During | 28 | 6.9 | 2.7 | 2.7 | 6.5 | 14.0 | 2.8 |
| Post | 31 | 14.8 | 9.1 | 3.0 | 14.5 | 43.3 | 12.5 |
| TPN (/cm3)b | |||||||
| Whole | 95 | 15,950 | 4652 | 5189 | 15,710 | 29,395 | 6572 |
| Pre | 35 | 15,934 | 2856 | 9769 | 15,710 | 23,678 | 3171 |
| During | 30 | 12,595 | 3118 | 8065 | 12,115 | 19,316 | 3449 |
| Post | 30 | 19,324 | 5239 | 5189 | 20,053 | 29,395 | 6198 |
All samples were above the detection limit. Summary statistics are based on 24-hr averages (from ~10 AM to ~10 AM next day).
TPN indicates total particle number ranging from 13 nm to 764.7 nm.
Table P.2.
Statistics for Gaseous Pollutants by Period Using Simple Algebraic Calculationsa
| Pollutant/Period | n | Mean | SD | Min | Median | Max | IQR |
|---|---|---|---|---|---|---|---|
| SO2 (ppb) | |||||||
| Whole | 91 | 6.1 | 4.0 | 0.9 | 4.9 | 21.0 | 5.4 |
| Pre | 35 | 7.6 | 4.5 | 2.0 | 5.8 | 21.0 | 6.9 |
| During | 24 | 3.1 | 1.6 | 0.9 | 3.0 | 7.7 | 2.7 |
| Post | 32 | 6.6 | 3.6 | 0.9 | 6.2 | 14.9 | 5.0 |
| CO (ppm) | |||||||
| Whole | 100 | 0.91 | 0.5 | 0.1 | 0.82 | 2.67 | 0.65 |
| Pre | 35 | 1.25 | 0.41 | 0.71 | 1.17 | 2.46 | 0.32 |
| During | 33 | 0.63 | 0.22 | 0.31 | 0.58 | 1.29 | 0.26 |
| Post | 32 | 0.82 | 0.59 | 0.1 | 0.74 | 2.67 | 0.85 |
| NO2 (ppb) | |||||||
| Whole | 100 | 27.0 | 15.3 | 9.5 | 24.7 | 80.7 | 18.7 |
| Pre | 35 | 26.0 | 5.1 | 15.8 | 25.3 | 41.2 | 5.4 |
| During | 33 | 13.9 | 4.6 | 9.8 | 13.0 | 30.0 | 2.5 |
| Post | 32 | 41.4 | 17.2 | 9.5 | 38.9 | 80.7 | 23.9 |
| O3 (ppb) | |||||||
| Whole | 100 | 29.1 | 17.0 | 3.5 | 25.1 | 69.1 | 25.4 |
| Pre | 35 | 31.8 | 16.4 | 5.3 | 34.1 | 64.3 | 23.5 |
| During | 33 | 39.5 | 16.0 | 10.0 | 38.4 | 69.1 | 17.3 |
| Post | 32 | 15.3 | 6.5 | 3.5 | 14.8 | 33.5 | 6.1 |
| O3 max (ppb)b | |||||||
| Whole | 100 | 63.3 | 30.9 | 12.4 | 63.6 | 132.7 | 47.6 |
| Pre | 35 | 65.8 | 31.7 | 12.7 | 65.9 | 123.5 | 45.7 |
| During | 33 | 80.4 | 28.1 | 26.2 | 82.3 | 132.7 | 39.3 |
| Post | 32 | 42.8 | 19.3 | 12.4 | 39.2 | 91.5 | 23.1 |
All samples were above the detection limit. Summary statistics are based on 24-hr averages (from ~10 AM to ~10 AM next day).
Maximum 1-hr average concentration within a 24-hr period.
APPENDIX Q. Period-Specific Means and SEs for Biomarker Measurements Based on Period Estimates from Mixed-Effects Models, Accounting for Repeated Measures But Not Adjusted for Covariates
| Biomarker | Pre-Olympics Mean ± SE |
During Olympics Mean ± SE |
Post-Olympics Mean ± SE |
|---|---|---|---|
| Autonomic Dysfunction and Blood Pressure | |||
| HR (bpm)a | 66.6 ± 1.0 | 65.6 ± 1.0 | 65.7 ± 1.0 |
| HF (ms2)a | 568.2 ± 1.1 | 558.0 ± 1.1 | 628.6 ± 1.1 |
| LF (ms2)a | 467.3 ± 1.1 | 403.4 ± 1.1 | 401.7 ± 1.1 |
| LF/HFa | 0.83 ± 1.1 | 0.71 ± 1.1 | 0.64 ± 1.1 |
| rMSSD (ms)a | 54 ± 1.1 | 54 ± 1.1 | 52 ± 1.1 |
| SDNN (ms)a | 60 ± 1.0 | 58 ± 1.0 | 59 ± 1.0 |
| VLF (ms2)a | 648.4 ± 1.1 | 597.1 ± 1.1 | 651.5 ± 1.1 |
| Total power (ms2)a | 1958.1 ± 1.1 | 1825.2 ± 1.1 | 1974.3 ± 1.1 |
| DBP (mmHg) | 60.5 ± 0.6 | 60.0 ± 0.6 | 61.5 ± 0.6 |
| SBP (mmHg) | 104.6 ± 0.9 | 103.3 ± 0.9 | 106.6 ± 0.9 |
| Systemic Inflammation and Oxidative Stress | |||
| CRP (%≥0.3 mg/L) | 55 | 46 | 36 |
| Fibrinogen (g/L) | 2.46 ± 0.03 | 2.41 ± 0.03 | 2.83 ± 0.03 |
| RBCs (×1012/L) | 4.59 ± 0.04 | 4.60 ± 0.04 | 4.47 ± 0.04 |
| WBCs (×109/L) | 5.24 ± 0.10 | 5.31 ± 0.10 | 5.10 ± 0.10 |
| Lymphocytes (×109/L) | 1.66 ± 0.03 | 1.71 ± 0.03 | 1.56 ± 0.03 |
| Neutrophils (×109/L) | 3.06 ± 0.08 | 3.09 ± 0.08 | 3.11 ± 0.08 |
| Urinary 8-OHdG (mg/mol creatinine)a | 3.70 ± 1.12 | 2.22 ± 1.12 | 3.34 ± 1.12 |
| Pulmonary Oxidative Stress and Inflammation | |||
| FeNO (ppb)a | 11.76 ± 1.04 | 5.80 ± 1.04 | 12.51 ± 1.04 |
| EBC | |||
| Nitrite (μM)a | 7.33 ± 1.03 | 4.71 ± 1.03 | 4.69 ± 1.04 |
| Nitrate (μM)a | 2.79 ± 1.04 | 2.61 ± 1.04 | 4.23 ± 1.05 |
| Nitrite+nitrate (μM)a | 10.48 ± 1.03 | 7.68 ± 1.03 | 10.37 ± 1.03 |
| pH | 7.43 ± 0.03 | 7.46 ± 0.03 | 7.61 ± 0.03 |
| 8-Isoprostane (%≥1.56 pg/ml) | 68 | 44 | 74 |
| Hemostasis | |||
| sCD62P (ng/mL)a | 6.49 ± 1.02 | 5.03 ± 1.02 | 5.34 ± 1.02 |
| sCD40L (ng/mL)a | 1.89 ± 1.02 | 1.77 ± 1.02 | 1.90 ± 1.02 |
| Platelet aggregation (%) | 58.47 ± 1.55 | 63.33 ± 1.55 | 57.78 ± 1.55 |
| vWF (%) | 102.1 ± 2.5 | 90.0 ± 2.5 | 83.8 ± 2.5 |
Biomarker had skewed data distributions, so geometric means are shown.
APPENDIX R. HEI Quality Assurance Statement
The conduct of this study was subjected to independent audits by David Bush of T&B Systems, Inc. Bush is an expert in quality assurance for air quality monitoring studies and data management. The audits included on-site reviews of study activities for conformance to the study protocol and operating procedures, and selected performance audits of monitoring equipment. The dates of the audits are listed here with the phase of the study examined.
QUALITY ASSURANCE AUDITS
October 6–8, 2008
The auditors conducted on-site audits at the Peking University First Hospital and Peking University, in Beijing, China, during the subject recruitment and testing period. Ellen Miles, an independent consultant, participated in this audit, providing expertise for the review of the clinical portions of the study. No significant issues were noted, though several recommendations were presented for improving documentation of SOPs and QC activities.
June 14, 2012
The auditor reviewed the study final report, as well as the final data set used in the analysis, during an on-site visit to the Keck School of Medicine, University of Southern California. Several data points for each measurement were traced through the entire data management sequence to verify the integrity of the data set. No significant issues were noted.
Written reports of each inspection were provided to the HEI project manager, who transmitted the findings to the principal investigator. These quality assurance audits demonstrated that the study was conducted by an experienced team with a high concern for data quality. The report appears to be an accurate representation of the study.

David H. Bush, Quality Assurance Officer
Footnotes
The contents of this report are solely the responsibility of the authors and do not necessarily represent the official views of the funding agencies.
The contents of this document also have not been reviewed by private party institutions, including those that support the Health Effects Institute; therefore, it may not reflect the views or policies of these parties, and no endorsement by them should be inferred.
OTHER PUBLICATIONS RESULTING FROM THIS RESEARCH
Gong J, Zhu T, Kipen H, Wang G, Hu M, Ohman-Strickland P, Lu S-E, Zhang L, Wang Y, Zhu P, Rich DQ, Diehl SR, Huang W, Zhang J. 2013. Malondialdehyde in exhaled breath condensate and urine as a biomarker of air pollution induced oxidative stress. J Expo Sci Environ Epidemiol (doi: 10.1038/jes.2012.127) [E-pub ahead of print.]
Huang W, Wang G, Lu S-E, Kipen H, Wang Y, Hu M, Lin W, Rich D, Ohman-Strickland P, Diehl SR, Zhu P, Tong J, Gong J, Zhu T, Zhang J. 2012. Inflammatory and oxidative stress responses of healthy young adults to changes in air quality during the Beijing Olympics. Am J Respir Crit Care Med 186:1150–1159.
Rich DQ, Kipen HM, Huang W, Wang G, Wang Y, Zhu P, Ohman-Strickland P, Hu M, Philipp C, Diehl SR, Lu S-E, Tong J, Gong J, Thomas D, Zhu T, Zhang J. 2012. Association between changes in air pollution levels during the Beijing Olympics and biomarkers of inflammation and thrombosis in healthy young adults. JAMA 307: 2068–2078.
Kipen H, Rich D, Huang W, Zhu T, Wang G, Hu M, Lu SE, Ohman-Strickland P, Zhu P, Wang Y, Zhang JJ. 2010. Measurement of inflammation and oxidative stress following drastic changes in air pollution during the Beijing Olympics: A panel study approach. Ann N Y Acad Sci 1203: 160–167.
This Investigators’ Report is one part of Health Effects Institute Research Report 174, which also includes a Commentary by the Health Review Committee and an HEI Statement about the research project.
References
- Adamkiewicz G, Ebelt S, Syring M, Slater J, Speizer FE, Schwartz J, Suh H, Gold DR. Association between air pollution exposure and exhaled nitric oxide in an elderly population. Thorax. 2004;59:204–209. doi: 10.1136/thorax.2003.006445. [DOI] [PMC free article] [PubMed] [Google Scholar]
- Adar SD, Adamkiewicz G, Gold DR, Schwartz J, Coull BA, Suh H. Ambient and microenvironmental particles and exhaled nitric oxide before and after a group bus trip. Environ Health Perspect. 2007;115:507–512. doi: 10.1289/ehp.9386. [DOI] [PMC free article] [PubMed] [Google Scholar]
- American Thoracic Society/European Respiratory Society (ATS/ERS) ATS/ERS recommendations for standardized procedures for the online and offline measurement of exhaled lower respiratory nitric oxide and nasal nitric oxide, 2005. Am J Respir Crit Care Med. 2005;171:912–930. doi: 10.1164/rccm.200406-710ST. [DOI] [PubMed] [Google Scholar]
- Anderson HR, Ponce de Leon A, Bland JM, Bower JS, Emberlin J, Strachan DP. Air pollution, pollens, and daily admissions for asthma in London 1987–92. Thorax. 1998;53:842–848. doi: 10.1136/thx.53.10.842. [DOI] [PMC free article] [PubMed] [Google Scholar]
- Antus B, Barta I, Kullmann T, Lazar Z, Valyon M, Horvath I, Csiszer E. Assessment of exhaled breath condesate pH in exacerbations of asthma and chronic obstructive pulmonary disease: A longitudinal study. Am J Respir Crit Care Med. 2010;182:1492–1497. doi: 10.1164/rccm.201003-0451OC. [DOI] [PubMed] [Google Scholar]
- Artlich A, Hagenah JU, Jonas S, Ahrens P, Gortner L. Exhaled nitric oxide in childhood asthma. Eur J Pediatr. 1996;155:698–701. doi: 10.1007/BF01957156. [DOI] [PubMed] [Google Scholar]
- Atkinson RW, Anderson HR, Sunyer J, Ayres J, Baccini M, Vonk JM, Boumghar A, Forastiere F, Forsberg B, Touloumi G, Schwartz J, Katsouyanni K. Acute effects of particulate air pollution on respiratory admissions: Results from APHEA 2 project. Air Pollution and Health: A European Approach. Am J Respir Crit Care Med. 2001;164:1860–1866. doi: 10.1164/ajrccm.164.10.2010138. [DOI] [PubMed] [Google Scholar]
- Baraldi E, Carraro S, Alinovi R, Pesci A, Ghiro L, Bodini A, Piacentini G, Zacchello F, Zanconato S. Cysteinyl leukotrienes and 8-isoprostane in exhaled breath condensate of children with asthma exacerbations. Thorax. 2003;58:505–509. doi: 10.1136/thorax.58.6.505. [DOI] [PMC free article] [PubMed] [Google Scholar]
- Barraza-Villarreal A, Sunyer J, Hernandez-Cadena L, Escamilla-Nuñez MC, Sienra-Monge JJ, Ramírez-Aguilar M, Cortez-Lugo M, Holguin F, Diaz-Sánchez D, Olin AC, Romieu I. Air pollution, airway inflammation, and lung function in a cohort study of Mexico City schoolchildren. Environ Health Perspect. 2008;116:832–838. doi: 10.1289/ehp.10926. [DOI] [PMC free article] [PubMed] [Google Scholar]
- Barreto M, Villa MP, Olita C, Martella S, Ciabattoni G, Montuschi P. 8-Isoprostane in exhaled breath condensate and exercise-induced bronchoconstriction in asthmatic children and adolescents. Chest. 2009;135:66–73. doi: 10.1378/chest.08-0722. [DOI] [PubMed] [Google Scholar]
- Bartoli CR, Wellenius GA, Diaz EA, Lawrence J, Coull BA, Akiyama I, Lee LM, Okabe K, Verrier RL, Godleski JJ. Mechanisms of inhaled fine particulate air pollution–induced arterial blood pressure changes. Environ Health Perspect. 2009;117:361–366. doi: 10.1289/ehp.11573. [DOI] [PMC free article] [PubMed] [Google Scholar]
- Becker S, Dailey LA, Soukup JM, Grambow SC, Devlin RB, Huang YC. Seasonal variations in air pollution particle-induced inflammatory mediator release and oxidative stress. Environ Health Perspect. 2005;113:1032–1038. doi: 10.1289/ehp.7996. [DOI] [PMC free article] [PubMed] [Google Scholar]
- Beckett WS, Chalupa DF, Pauly-Brown A, Speers DM, Stewart JC, Frampton MW, Utell MJ, Huang LS, Cox C, Zareba W, Oberdorster G. Comparing inhaled ultrafine versus fine zinc oxide particles in healthy adults: A human inhalation study. Am J Respir Crit Care Med. 2005;171:1129–1135. doi: 10.1164/rccm.200406-837OC. [DOI] [PMC free article] [PubMed] [Google Scholar]
- Birch ME. Elemental carbon (diesel particulate): method 5040. NIOSH Manual of Analytical Methods (NMAM) (4) 1999 2010. Available from www.cdc.gov/niosh/docs/2003-154/pdfs/5040f3.pdf.
- Blann AD, Nadar SK, Lip GY. The adhesion molecule P-selectin and cardiovascular disease. Eur Heart J. 2003;24:2166–2179. doi: 10.1016/j.ehj.2003.08.021. [DOI] [PubMed] [Google Scholar]
- Bondy SC, Guo-Ross SX, Truong AT. Promotion of transition metal-induced reactive oxygen species formation by beta-amyloid. Brain Res. 1998;799:91–96. doi: 10.1016/s0006-8993(98)00461-2. [DOI] [PubMed] [Google Scholar]
- Brook RD. Cardiovascular effects of air pollution. Clin Sci. 2008;115:175–187. doi: 10.1042/CS20070444. [DOI] [PubMed] [Google Scholar]
- Brook RD, Franklin B, Cascio W, Hong Y, Howard G, Lipsett M, Luepker R, Mittleman MA, Samet J, Smith SC, Tager I. Air pollution and cardiovascular disease: A statement for healthcare professionals from the expert panel on population and prevention science of the American Heart Association. Circulation. 2004;109:2655–2671. doi: 10.1161/01.CIR.0000128587.30041.C8. [DOI] [PubMed] [Google Scholar]
- Brook RD, Rajagopalan S, Pope CA, III, Brook JR, Bhatnagar A, Diez-Roux AV, Holguin F, Hong Y, Luepker RV, Mittleman MA, Peters A, Siscovick D, Smith SC, Jr, Whitsel L, Kaufman JD. Particulate matter air pollution and cardiovascular disease: An update to the scientific statement from the American Heart Association. Circulation. 2010;121:2331–2378. doi: 10.1161/CIR.0b013e3181dbece1. [DOI] [PubMed] [Google Scholar]
- Chen H, Goldberg MS, Villeneuve PJ. A systematic review of the relation between long-term exposure to ambient air pollution and chronic diseases. Rev Environ Health. 2008;23:243–297. doi: 10.1515/reveh.2008.23.4.243. [DOI] [PubMed] [Google Scholar]
- Chuang KJ, Chan CC, Su TC, Lee CT, Tang CS. The effect of urban air pollution on inflammation, oxidative stress, coagulation, and autonomic dysfunction in young adults. Am J Respir Crit Care Med. 2007;176:370–376. doi: 10.1164/rccm.200611-1627OC. [DOI] [PubMed] [Google Scholar]
- Churg A, Brauer M. Ambient atmospheric particles in the airways of human lungs. Ultrastruct Pathol. 2000;24:353–361. doi: 10.1080/019131200750060014. [DOI] [PubMed] [Google Scholar]
- Clancy L, Goodman P, Sinclair H, Dockery DW. Effect of air-pollution control on death rates in Dublin, Ireland: An intervention study. Lancet. 2002;360:1210–1214. doi: 10.1016/S0140-6736(02)11281-5. [DOI] [PubMed] [Google Scholar]
- Collins AR, Gedik CM, Olmedilla B, Southon S, Bellizzi M. Oxidative DNA damage measured in human lymphocytes: Large differences between sexes and between countries, and correlations with heart disease mortality rates. FASEB J. 1998;12:1397–1400. [PubMed] [Google Scholar]
- Corradi M, Folesani G, Andreoli R, Manini P, Bodini A, Piacentini G, Carraro S, Zanconato S, Baraldi E. Aldehydes and glutathione in exhaled breath condensate of children with asthma exacerbation. Am J Respir Crit Care Med. 2003a;167:395–399. doi: 10.1164/rccm.200206-507OC. [DOI] [PubMed] [Google Scholar]
- Corradi M, Pesci A, Casana R, Alinovi R, Goldoni M, Vettori MV, Cuomo A. Nitrate in exhaled breath condensate of patients with different airway diseases. Nitric Oxide. 2003b;8:26–30. doi: 10.1016/s1089-8603(02)00128-3. [DOI] [PubMed] [Google Scholar]
- Creason J, Neas L, Walsh D, Williams R, Sheldon L, Liao DP, Shy C. Particulate matter and heart rate variability among elderly retirees: The Baltimore 1998 PM study. J Expo Anal Environ Epidemiol. 2001;11:116–122. doi: 10.1038/sj.jea.7500154. [DOI] [PubMed] [Google Scholar]
- Danesh J, Collins R, Appleby P, Peto R. Association of fibrinogen, C-reactive protein, albumin, or leukocyte count with coronary heart disease: Meta-analyses of prospective studies. JAMA. 1998;279:1477–1482. doi: 10.1001/jama.279.18.1477. [DOI] [PubMed] [Google Scholar]
- Danesh J, Whincup P, Walker M, Lennon L, Thomson A, Appleby P, Gallimore JR, Pepys MB. Low grade inflammation and coronary heart disease: Prospective study and updated meta-analyses. BMJ. 2000;321:199–204. doi: 10.1136/bmj.321.7255.199. [DOI] [PMC free article] [PubMed] [Google Scholar]
- Davi G, Patrono C. Platelet activation and athero-thrombosis. N Engl J Med. 2007;357:2482–2494. doi: 10.1056/NEJMra071014. [DOI] [PubMed] [Google Scholar]
- de Hartog JJ, Lanki T, Timonen KL, Hoek G, Janssen NA, Ibald-Mulli A, Peters A, Heinrich J, Tarkiainen TH, van Grieken R, van Wijnen JH, Brunekreef B, Pekkanen J. Associations between PM2.5 and heart rate variability are modified by particle composition and beta-blocker use in patients with coronary heart disease. Environ Health Perspect. 2009;117:105–111. doi: 10.1289/ehp.11062. [DOI] [PMC free article] [PubMed] [Google Scholar]
- De Martinis B, Bianchi M. Methodology for urinary 8-hydroxy-2′-deoxyguanosine analysis by HPLC with electrochemical detection. Pharmacol Res. 2002;46:129–131. doi: 10.1016/s1043-6618(02)00080-4. [DOI] [PubMed] [Google Scholar]
- Delfino RJ, Staimer N, Gillen D, Tjoa T, Sioutas C, Fung K, George SC, Kleinman MT. Personal and ambient air pollution is associated with increased exhaled nitric oxide in children with asthma. Environ Health Perspect. 2006;114:1736–1743. doi: 10.1289/ehp.9141. [DOI] [PMC free article] [PubMed] [Google Scholar]
- Delfino RJ, Staimer N, Tjoa T, Gillen DL, Polidori A, Arhami M, Kleinman MT, Vaziri ND, Longhurst J, Sioutas C. Air pollution exposures and circulating biomarkers of effect in a susceptible population: Clues to potential causal component mixtures and mechanisms. Environ Health Perspect. 2009;117:1232–1238. doi: 10.1289/ehp.0800194. [DOI] [PMC free article] [PubMed] [Google Scholar]
- Delfino RJ, Staimer N, Tjoa T, Polidori A, Arhami M, Gillen DL, Kleinman MT, Vaziri ND, Longhurst J, Zaldivar F, Sioutas C. Circulating biomarkers of inflammation, antioxidant activity, and platelet activation are associated with primary combustion aerosols in subjects with coronary artery disease. Environ Health Perspect. 2008;116:898–906. doi: 10.1289/ehp.11189. [DOI] [PMC free article] [PubMed] [Google Scholar]
- Demirbag R, Yilmaz R, Erel O, Gultekin U, Asci D, Elbasan Z. The relationship between potency of oxidative stress and severity of dilated cardiomyopathy. Can J Cardiol. 2005;21:851–855. [PubMed] [Google Scholar]
- D’Ippoliti D, Forastiere F, Ancona C, Agabiti N, Fusco D, Michelozzi P, Perucci CA. Air pollution and myocardial infarction in Rome: A case-crossover analysis. Epidemiology. 2003;14:528–535. doi: 10.1097/01.ede.0000082046.22919.72. [DOI] [PubMed] [Google Scholar]
- Donaldson K, Tran L, Jimenez LA, Duffin R, Newby DE, Mills N, MacNee W, Stone V. Combustion-derived nanoparticles: A review of their toxicology following inhalation exposure. Part Fibre Toxicol. 2005;2:10. doi: 10.1186/1743-8977-2-10. [DOI] [PMC free article] [PubMed] [Google Scholar]
- Eilstein D. Prolonged exposure to atmospheric air pollution and mortality from respiratory causes. Rev Mal Respir. 2009;26:1146–1158. doi: 10.1016/s0761-8425(09)73532-6. [DOI] [PubMed] [Google Scholar]
- Epton MJ, Dawson RD, Brooks WM, Kingham S, Aberkane T, Cavanagh JA, Frampton CM, Hewitt T, Cook JM, McLeod S, McCartin F, Trought K, Brown L. The effect of ambient air pollution on respiratory health of school children: A panel study. Environ Health. 2008;7:16. doi: 10.1186/1476-069X-7-16. [DOI] [PMC free article] [PubMed] [Google Scholar]
- Ferdinands JM, Crawford CA, Greenwald R, Van Sickle D, Hunter E, Teague WG. Breath acidification in adolescent runners exposed to atmospheric pollution: A prospective, repeated measures observational study. Environ Health. 2008;7:10. doi: 10.1186/1476-069X-7-10. [DOI] [PMC free article] [PubMed] [Google Scholar]
- Folino AF, Scapellato ML, Canova C, Maestrelli P, Bertorelli G, Simonato L, Iliceto S, Lotti M. Individual exposure to particulate matter and the short-term arrhythmic and autonomic profiles in patients with myocardial infarction. Eur Heart J. 2009;30:1614–1620. doi: 10.1093/eurheartj/ehp136. [DOI] [PubMed] [Google Scholar]
- Frampton MW, Boscia J, Roberts NJ, Jr, Azadniv M, Torres A, Cox C, Morrow PE, Nichols J, Chalupa D, Frasier LM, Gibb FR, Speers DM, Tsai Y, Utell MJ. Nitrogen dioxide exposure: Effects on airway and blood cells. Am J Physiol Lung Cell Mol Physiol. 2002;282:L155–L165. doi: 10.1152/ajplung.2002.282.1.L155. [DOI] [PubMed] [Google Scholar]
- Genc H, Dogru T, Tapan S, Tasci I, Bozoglu E, Gok M, Aslan F, Celebi G, Erdem G, Avcu F, Ural AU, Sonmez A. Soluble CD40 ligand, soluble P-selectin and von Willebrand factor levels in subjects with prediabetes: The impact of metabolic syndrome. Clin Biochem. 2011;45:92–95. doi: 10.1016/j.clinbiochem.2011.10.022. [DOI] [PubMed] [Google Scholar]
- Ghio AJ, Hall A, Bassett MA, Cascio WE, Devlin RB. Exposure to concentrated ambient air particles alters hematologic indices in humans. Inhal Toxicol. 2003;15:1465–1478. doi: 10.1080/08958370390249111. [DOI] [PubMed] [Google Scholar]
- Ghio AJ, Kim C, Devlin RB. Concentrated ambient air particles induce mild pulmonary inflammation in healthy human volunteers. Am J Respir Crit Care Med. 2000;162:981–988. doi: 10.1164/ajrccm.162.3.9911115. [DOI] [PubMed] [Google Scholar]
- Gilliland FD, McConnell R, Peters J, Gong H., Jr A theoretical basis for investigating ambient air pollution and children’s respiratory health. Environ Health Perspect. 1999;107(Suppl 3):403–407. doi: 10.1289/ehp.99107s3403. [DOI] [PMC free article] [PubMed] [Google Scholar]
- Gold DR, Litonjua A, Schwartz J, Lovett E, Larson A, Nearing B, Allen G, Verrier M, Cherry R, Verrier R. Ambient pollution and heart rate variability. Circulation. 2000;101:1267–1273. doi: 10.1161/01.cir.101.11.1267. [DOI] [PubMed] [Google Scholar]
- Greiser KH, Kluttig A, Schumann B, Swenne CA, Kors JA, Kuss O, Haerting J, Schmidt H, Thiery J, Werdan K. Cardiovascular diseases, risk factors and short-term heart rate variability in an elderly general population: The CARLA study 2002–2006. Eur J Epidemiol. 2009;24:123–142. doi: 10.1007/s10654-009-9317-z. [DOI] [PubMed] [Google Scholar]
- Gundel LA, Lee VC, Mahanama KRR, Stevens RK, Daisey JM. Direct determination of the phase distributions of semi-volatile polycyclic aromatic-hydrocarbons using annular denuders. Atmos Environ. 1995;29:1719–1733. [Google Scholar]
- Guo S, Hu M, Wang ZB, Slanina J, Zhao YL. Size-resolved aerosol water-soluble ionic compositions in the summer of Beijing: Implication of regional secondary formation. Atmos Chem Phys. 2010;10:957–959. [Google Scholar]
- Hajat S, Haines A, Goubet SA, Atkinson RW, Anderson HR. Association of air pollution with daily GP consultations for asthma and other lower respiratory conditions in London. Thorax. 1999;54:597–605. doi: 10.1136/thx.54.7.597. [DOI] [PMC free article] [PubMed] [Google Scholar]
- Hastie TJ, Tibshirani RJ. Generalized Additive Models. Chapman & Hall; Boca Raton, FL: 1990. [Google Scholar]
- He LY, Hu M, Huang XF, Zhang YH, Tang XY. Seasonal pollution characteristics of organic compounds in atmospheric fine particles in Beijing. Sci Total Environ. 2006;359:167–176. doi: 10.1016/j.scitotenv.2005.05.044. [DOI] [PubMed] [Google Scholar]
- Health Effects Institute. Special Report 18. Health Effects Institute; Boston, MA: 2010. Outdoor Air Pollution and Health in the Developing Countries of Asia: A Comprehensive Review. [Google Scholar]
- Hedley AJ, Wong CM, Thach TQ, Ma S, Lam TH, Anderson HR. Cardiorespiratory and all-cause mortality after restrictions on sulphur content of fuel in Hong Kong: An intervention study. Lancet. 2002;360:1646–1652. doi: 10.1016/s0140-6736(02)11612-6. [DOI] [PubMed] [Google Scholar]
- Heeschen C, Dimmeler S, Hamm CW, van den Brand MJ, Boersma E, Zeiher AM, Simoons ML. Soluble CD40 ligand in acute coronary syndromes. N Eng J Med. 2003;348:1104–1111. doi: 10.1056/NEJMoa022600. [DOI] [PubMed] [Google Scholar]
- Heinrich J, Hoelscher B, Wichmann HE. Decline of ambient air pollution and respiratory symptoms in children. Am J Respir Crit Care Med. 2000;161:1930–1936. doi: 10.1164/ajrccm.161.6.9906105. [DOI] [PubMed] [Google Scholar]
- Holma B. Effects of inhaled acids on airway mucus and its consequences for health. Environ Health Perspect. 1989;79:109–113. doi: 10.1289/ehp.8979109. [DOI] [PMC free article] [PubMed] [Google Scholar]
- Holma B, Lindegren M, Andersen JM. pH effects on ciliomotility and morphology of respiratory mucosa. Arch Environ Health. 1977;32:216–226. doi: 10.1080/00039896.1977.10667285. [DOI] [PubMed] [Google Scholar]
- Hu M, Zhang J, Wu ZJ. Chemical compositions of precipitation and scavenging of particles in Beijing. Science in China Series B: Chemistry. 2005;48:265–272. [Google Scholar]
- Huang XF, He LY, Hu M, Zhang YH. Annual variation of particulate organic compounds in PM2.5 in the urban atmosphere of Beijing. Atmos Environ. 2006;40:2449–2458. [Google Scholar]
- Hunt JF, Fang K, Malik R, Snyder A, Malhotra N, Platts-Mills TA, Gaston B. Endogenous airway acidification: Implications for asthma pathophysiology. Am J Respir Crit Care Med. 2000;161:694–699. doi: 10.1164/ajrccm.161.3.9911005. [DOI] [PubMed] [Google Scholar]
- Jacobs L, Emmerechts J, Mathieu C, Hoylaerts MF, Fierens F, Hoet PH, Nemery B, Nawrot TS. Air pollution related prothrombotic changes in persons with diabetes. Environ Health Perspect. 2010;118:191–196. doi: 10.1289/ehp.0900942. [DOI] [PMC free article] [PubMed] [Google Scholar]
- Jansen KL, Larson TV, Koenig JQ, Mar TF, Fields C, Stewart J, Lippmann M. Associations between health effects and particulate matter and black carbon in subjects with respiratory disease. Environ Health Perspect. 2005;113:1741–1746. doi: 10.1289/ehp.8153. [DOI] [PMC free article] [PubMed] [Google Scholar]
- Kadiiska MB, Gladen BC, Baird DD, Germolec D, Graham LB, Parker CE, Nyska A, Wachsman JT, Ames BN, Basu S, Brot N, Fitzgerald GA, Floyd RA, George M, Heinecke JW, Hatch GE, Hensley K, Lawson JA, Marnett LJ, Morrow JD, Murray DM, Plastaras J, Roberts LJ, II, Rokach J, Shigenaga MK, Sohal RS, Sun J, Tice RR, Van Thiel DH, Wellner D, Walter PB, Tomer KB, Mason RP, Barrett JC. Biomarkers of Oxidative Stress Study II: Are oxidation products of lipids, proteins, and DNA markers of CCl4 poisoning? Free Radic Biol Med. 2005;38:698–710. doi: 10.1016/j.freeradbiomed.2004.09.017. [DOI] [PubMed] [Google Scholar]
- Kipen H, Rich D, Huang W, Zhu T, Wang G, Hu M, Lu SE, Ohman-Strickland P, Zhu P, Wang Y, Zhang JJ. Measurement of inflammation and oxidative stress following drastic changes in air pollution during the Beijing Olympics: A panel study approach. Ann N Y Acad Sci. 2010;1203:160–167. doi: 10.1111/j.1749-6632.2010.05638.x. [DOI] [PMC free article] [PubMed] [Google Scholar]
- Koenig JQ, Jansen K, Mar TF, Lumley T, Kaufman J, Trenga CA, Sullivan J, Liu LJS, Shapiro GG, Larson TV. Measurement of offline exhaled nitric oxide in a study of community exposure to air pollution. Environ Health Perspect. 2003;111:1625–1629. doi: 10.1289/ehp.6160. [DOI] [PMC free article] [PubMed] [Google Scholar]
- Koenig JQ, Mar TF, Allen RW, Jansen K, Lumley T, Sullivan JH, Trenga CA, Larson T, Liu LJ. Pulmonary effects of indoor- and outdoor-generated particles in children with asthma. Environ Health Perspect. 2005;113:499–503. doi: 10.1289/ehp.7511. [DOI] [PMC free article] [PubMed] [Google Scholar]
- Kostikas K, Papatheodorou G, Ganas K, Psathakis K, Panagou P, Loukides S. pH in expired breath condensate of patients with inflammatory airway diseases. Am J Respir Crit Care Med. 2002;165:1364–1370. doi: 10.1164/rccm.200111-068OC. [DOI] [PubMed] [Google Scholar]
- Kostikas K, Papatheodorou G, Psathakis K, Panagou P, Loukides S. Oxidative stress in expired breath condensate of patients with COPD. Chest. 2003;124:1373–1380. doi: 10.1378/chest.124.4.1373. [DOI] [PubMed] [Google Scholar]
- Lee SL, Wong WH, Lau YL. Association between air pollution and asthma admission among children in Hong Kong. Clin Exp Allergy. 2006;36:1138–1146. doi: 10.1111/j.1365-2222.2006.02555.x. [DOI] [PMC free article] [PubMed] [Google Scholar]
- Liao D, Cai J, Rosamond WD, Barnes RW, Hutchinson RG, Whitsel EA, Rautaharju P, Heiss G. Cardiac autonomic function and incident coronary heart disease: A population-based case-cohort study. The Atherosclerosis Risk in Communities Study (ARIC) Am J Epidemiol. 1997;145:696–706. doi: 10.1093/aje/145.8.696. [DOI] [PubMed] [Google Scholar]
- Liao D, Duan Y, Whitsel EA, Zheng ZJ, Heiss G, Chinchilli VM. Association of higher levels of ambient criteria pollutants with impaired cardiac autonomic control: A population-based study. Am J Epidemiol. 2004;159:768–777. doi: 10.1093/aje/kwh109. [DOI] [PubMed] [Google Scholar]
- Liao D, Heiss G, Chinchilli VM, Duan Y, Folsom AR, Lin HM, Salomaa V. Association of criteria pollutants with plasma hemostatic/inflammatory markers: A population-based study. J Expo Anal Environ Epidemiol. 2005;15:319–328. doi: 10.1038/sj.jea.7500408. [DOI] [PubMed] [Google Scholar]
- Lin W, Huang W, Zhu T, Hu M, Brunekreef B, Zhang Y, Liu X, Cheng H, Gehring U, Li C, Tang X. Acute respiratory inflammation in children and black carbon in ambient air before and during the 2008 Beijing Olympics. Environ Health Perspect. 2011;119:1507–1512. doi: 10.1289/ehp.1103461. [DOI] [PMC free article] [PubMed] [Google Scholar]
- Liu L, Poon R, Chen L, Frescura AM, Montuschi P, Ciabattoni G, Wheeler A, Dales R. Acute effects of air pollution on pulmonary function, airway inflammation, and oxidative stress in asthmatic children. Environ Health Perspect. 2009;117:668–674. doi: 10.1289/ehp11813. [DOI] [PMC free article] [PubMed] [Google Scholar]
- Lucking AJ, Lundback M, Mills NL, Faratian D, Barath SL, Pourazat J, Cassee FR, Donaldson K, Boon NA, Badimon JJ, Sandstrom T, Blomgerg A, Newby DE. Diesel exhaust inhalation increases thrombus formation in man. Eur Heart J. 2008;29:3043–3051. doi: 10.1093/eurheartj/ehn464. [DOI] [PubMed] [Google Scholar]
- Magari SR, Schwartz J, Williams PL, Hauser R, Smith TJ, Christiani DC. The association between personal measurements of environmental exposure to particulates and heart rate variability. Epidemiology. 2002;13:305–310. doi: 10.1097/00001648-200205000-00011. [DOI] [PubMed] [Google Scholar]
- Mar TF, Jansen K, Shepherd K, Lumley T, Larson TV, Koenig JQ. Exhaled nitric oxide in children with asthma and short-term PM2.5 exposure in Seattle. Environ Health Perspect. 2005a;113:1791–1794. doi: 10.1289/ehp.7883. [DOI] [PMC free article] [PubMed] [Google Scholar]
- Mar TF, Koenig JQ, Jansen K, Sullivan J, Kaufman J, Trenga CA, Siahpush SH, Liu LJ, Neas L. Fine particulate air pollution and cardiorespiratory effects in the elderly. Epidemiology. 2005b;16:681–687. doi: 10.1097/01.ede.0000173037.83211.d6. [DOI] [PubMed] [Google Scholar]
- McCreanor J, Cullinan P, Nieuwenhuijsen MJ, Stewart-Evans J, Malliarou E, Jarup L, Harrington R, Svartengren M, Han IK, Ohman-Strickland P, Chung KF, Zhang J. Respiratory effects of exposure to diesel traffic in persons with asthma. N Engl J Med. 2007;357:2348–2358. doi: 10.1056/NEJMoa071535. [DOI] [PubMed] [Google Scholar]
- Montuschi P, Corradi M, Ciabattoni G, Nightingale J, Kharitonov SA, Barnes PJ. Increased 8-isoprostane, a marker of oxidative stress, in exhaled condensate of asthma patients. Am J Respir Crit Care Med. 1999;160:216–220. doi: 10.1164/ajrccm.160.1.9809140. [DOI] [PubMed] [Google Scholar]
- Nel A. Air pollution-related illness: Effects of particles. Science. 2005;308:804–806. doi: 10.1126/science.1108752. [DOI] [PubMed] [Google Scholar]
- Nemmar A, Hoet PH, Dinsdale D, Vermylen J, Hoylaerts MF, Nemery B. Diesel exhaust particles in lung acutely enhance experimental peripheral thrombosis. Circulation. 2003a;107:1202–1208. doi: 10.1161/01.cir.0000053568.13058.67. [DOI] [PubMed] [Google Scholar]
- Nemmar A, Hoylaerts MF, Hoet PH, Dinsdale D, Smith T, Xu H, Vermylen J, Nemery B. Ultrafine particles affect experimental thrombosis in an in vivo hamster model. Am J Respir Crit Care Med. 2002;166:998–1004. doi: 10.1164/rccm.200110-026OC. [DOI] [PubMed] [Google Scholar]
- Nemmar A, Nemery B, Hoet PH, Vermylen J, Hoylaerts MF. Pulmonary inflammation and thrombogenicity caused by diesel particles in hamsters: Role of histamine. Am J Respir Crit Care Med. 2003b;168:1366–1372. doi: 10.1164/rccm.200306-801OC. [DOI] [PubMed] [Google Scholar]
- Nightingale JA, Rogers DF, Barnes PJ. Effect of inhaled ozone on exhaled nitric oxide, pulmonary function, and induced sputum in normal and asthmatic subjects. Thorax. 1999;54:1061–1069. doi: 10.1136/thx.54.12.1061. [DOI] [PMC free article] [PubMed] [Google Scholar]
- O’Neill SG, Pego-Reigosa JM, Hingorani AD, Bessant R, Isenberg DA, Rahman A. Use of a strategy based on calculated risk scores in managing cardiovascular risk factors in a large British cohort of patients with systemic lupus erythematosus. Rheumatology (Oxford) 2009;48:573–575. doi: 10.1093/rheumatology/kep037. [DOI] [PubMed] [Google Scholar]
- Parker JD, Mendola P, Woodruff TJ. Preterm birth after the Utah Valley Steel Mill closure: A natural experiment. Epidemiology. 2008;19:820–823. doi: 10.1097/EDE.0b013e3181883d5d. [DOI] [PubMed] [Google Scholar]
- Peel JL, Klein M, Flanders WD, Mulholland JA, Tolbert PE. Impact of improved air quality during the 1996 Summer Olympic Games in Atlanta on multiple cardiovascular and respiratory outcomes. Res Rep Health EffInst. 2010;148:3–23. discussion 25–33. [PubMed] [Google Scholar]
- Pekkanen J, Brunner EJ, Anderson HR, Tiittanen P, Atkinson RW. Daily concentrations of air pollution and plasma fibrinogen in London. Occup Environ Med. 2000;57:818–822. doi: 10.1136/oem.57.12.818. [DOI] [PMC free article] [PubMed] [Google Scholar]
- Peretz A, Sullivan J, Leotta D, Trenga C, Sands F, Allen J, Carlsten C, Wilkinson C, Gill E, Kaufman J. Diesel exhaust inhalation elicits acute vasoconstriction in vivo. Environ Health Perspect. 2008;116:937–942. doi: 10.1289/ehp.11027. [DOI] [PMC free article] [PubMed] [Google Scholar]
- Peters A, Dockery DW, Muller JE, Mittleman MA. Increased particulate air pollution and the triggering of myocardial infarction. Circulation. 2001a;103:2810–2815. doi: 10.1161/01.cir.103.23.2810. [DOI] [PubMed] [Google Scholar]
- Peters A, Doring A, Wichmann HE, Koenig W. Increased plasma viscosity during an air pollution episode: A link to mortality? Lancet. 1997;349:1582–1587. doi: 10.1016/S0140-6736(97)01211-7. [DOI] [PubMed] [Google Scholar]
- Peters A, Frohlich M, Doring A, Immervoll T, Wichmann HE, Hutchinson WL, Pepys MB, Koenig W. Particulate air pollution is associated with an acute phase response in men: Results from the MONICA-Augsburg Study. Eur Heart J. 2001b;22:1198–1204. doi: 10.1053/euhj.2000.2483. [DOI] [PubMed] [Google Scholar]
- Peters A, von Klot S, Heier M, Trentinaglia I, Hormann A, Wichmann HE, Lowel H. Exposure to traffic and the onset of myocardial infarction. N Engl J Med. 2004;351:1721–1730. doi: 10.1056/NEJMoa040203. [DOI] [PubMed] [Google Scholar]
- Pope CA., III Respiratory disease associated with community air pollution and a steel mill, Utah Valley. Am J Public Health. 1989;79:623–628. doi: 10.2105/ajph.79.5.623. [DOI] [PMC free article] [PubMed] [Google Scholar]
- Pope CA, III, Ezzati M, Dockery DW. Fine-particulate air pollution and lifeexpectancy in the United States. N Engl J Med. 2009;360:376–386. doi: 10.1056/NEJMsa0805646. [DOI] [PMC free article] [PubMed] [Google Scholar]
- Pope CA, III, Muhlestein JB, May HT, Renlund DG, Anderson JL, Horne BD. Ischemic heart disease events triggered by short-term exposure to fine particulate air pollution. Circulation. 2006;114:2443–2448. doi: 10.1161/CIRCULATIONAHA.106.636977. [DOI] [PubMed] [Google Scholar]
- Pope CA, III, Rodermund DL, Gee MM. Mortality effects of a copper smelter strike and reduced ambient sulfate particulate matter air pollution. Environ Health Perspect. 2007;115:679–683. doi: 10.1289/ehp.9762. [DOI] [PMC free article] [PubMed] [Google Scholar]
- Puett RC, Hart JE, Yanosky JD, Paciorek C, Schwartz J, Suh H, Speizer FE, Laden F. Chronic fine and coarse particulate exposure, mortality, and coronary heart disease in the Nurses’ Health Study. Environ Health Perspect. 2009;117:1697–1701. doi: 10.1289/ehp.0900572. [DOI] [PMC free article] [PubMed] [Google Scholar]
- R Development Core Team. R: A Language and Environment for Statistical Computing. R Development Core Team; Vienna, Austria: 2011. www.R-project.org. [Google Scholar]
- Radomski A, Jurasz P, Alonso-Escolano D, Drews M, Morandi M, Malinski T, Radomski MW. Nanoparticle-induced platelet aggregation and vascular thrombosis. Br J Pharmacol. 2005;146:882–893. doi: 10.1038/sj.bjp.0706386. [DOI] [PMC free article] [PubMed] [Google Scholar]
- Reil JC, Böhm M. The role of heart rate in the development of cardiovascular disease. Clin Res Cardiol. 2007;96:585–592. doi: 10.1007/s00392-007-0537-5. [DOI] [PubMed] [Google Scholar]
- Ren C, Fang S, Wright RO, Suh H, Schwartz J. Urinary 8-hydroxy-2′-deoxyguanosine as a biomarker of oxidative DNA damage induced by ambient pollution in the Normative Aging Study. Occup Environ Med. 2010;68:562–569. doi: 10.1136/oem.2010.056358. [DOI] [PMC free article] [PubMed] [Google Scholar]
- Ricciardolo FL, Rado V, Fabbri LM, Sterk PJ, Di Maria GU, Geppetti P. Bronchoconstriction induced by citric acid inhalation in guinea pigs: Role of tachykinins, bradykinin, and nitric oxide. Am J Respir Crit Care Med. 1999;159:557–562. doi: 10.1164/ajrccm.159.2.9804022. [DOI] [PubMed] [Google Scholar]
- Rich DQ, Kipen HM, Zhang J, Kamat L, Wilson AC, Kostis JB. Triggering of transmural infarctions, but not non-transmural infarctions, by ambient fine particles. Environ Health Perspect. 2010;118:1229–1234. doi: 10.1289/ehp.0901624. [DOI] [PMC free article] [PubMed] [Google Scholar]
- Rich KE, Petkau J, Vedal S, Brauer M. A case-crossover analysis of particulate air pollution and cardiac arrhythmia in patients with implantable cardioverter defibrillators. Inhal Toxicol. 2004;16:363–372. doi: 10.1080/08958370490439515. [DOI] [PubMed] [Google Scholar]
- Riediker M, Cascio WE, Griggs TR, Herbst MC, Bromberg PA, Neas L, Williams RW, Devlin RB. Particulate matter exposure in cars is associated with cardiovascular effects in healthy young men. Am J Respir Crit Care Med. 2004;169:934–940. doi: 10.1164/rccm.200310-1463OC. [DOI] [PubMed] [Google Scholar]
- Rihak V, Zatloukal P, Chladkova J, Zimulova A, Havlinova Z, Chladek J. Nitrite in exhaled breath condensate as a marker of nitrossative stress in the airways of patients with asthma, COPD, and idiopathic pulmonary fibrosis. J Clin Lab Anal. 2010;24:317–322. doi: 10.1002/jcla.20408. [DOI] [PMC free article] [PubMed] [Google Scholar]
- Robroeks CM, van de Kant KD, Jobsis Q, Hendriks HJ, van Gent R, Wouters EF, Damoiseaux JG, Bast A, Wodzig WK, Dompeling E. Exhaled nitric oxide and biomarkers in exhaled breath condensate indicate the presence, severity and control of childhood asthma. Clin Exp Allergy. 2007;37:1303–1311. doi: 10.1111/j.1365-2222.2007.02788.x. [DOI] [PubMed] [Google Scholar]
- Romieu I, Barraza-Villarreal A, Escamilla-Nuñez C, Almstrand AC, Diaz-Sanchez D, Sly PD, Olin AC. Exhaled breath malondialdehyde as a marker of effect of exposure to air pollution in children with asthma. J Allergy Clin Immunol. 2008;121:903–909. doi: 10.1016/j.jaci.2007.12.004. [DOI] [PubMed] [Google Scholar]
- Ruckerl R, Greven S, Ljungman P, Aalto P, Antoniades C, Bellander T, Berglind N, Chrysohoou C, Forastiere F, Jacquemin B, von Klot S, Koenig W, Kuchenhoff H, Lanki T, Pekkanen J, Perucci CA, Schneider A, Sunyer J, Peters A. Air pollution and inflammation (interleukin-6, C-reactive protein, fibrinogen) in myocardial infarction survivors. Environ Health Perspect. 2007;115:1072–1080. doi: 10.1289/ehp.10021. [DOI] [PMC free article] [PubMed] [Google Scholar]
- Ruckerl R, Ibald-Mulli A, Koenig W, Schneider A, Woelke G, Cyrys J, Heinrich J, Marder V, Frampton M, Wichmann HE, Peters A. Air pollution and markers of inflammation and coagulation in patients with coronary heart disease. Am J Respir Crit Care Med. 2006;173:432–441. doi: 10.1164/rccm.200507-1123OC. [DOI] [PubMed] [Google Scholar]
- Salvi S, Blomberg A, Rudell B, Kelly F, Sandström T, Holgate ST, Frew A. Acute inflammatory responses in the airways and peripheral blood after short-term exposure to diesel exhaust in healthy human volunteers. Am J Respir Crit Care Med. 1999;159:702–709. doi: 10.1164/ajrccm.159.3.9709083. [DOI] [PubMed] [Google Scholar]
- Schneider A, Hampel R, Ibald-Mulli A, Zareba W, Schmidt G, Schneider R, Ruckerl R, Couderc JP, Mykins B, Oberdorster G, Wolke G, Pitz M, Wichmann HE, Peters A. Changes in deceleration capacity of heart rate and heart rate variability induced by ambient air pollution in individuals with coronary artery disease. Part Fibre Toxicol. 2010;7:29. doi: 10.1186/1743-8977-7-29. [DOI] [PMC free article] [PubMed] [Google Scholar]
- Schwartz J, Litonjua A, Suh H, Verrier M, Zanobetti A, Syring M, Nearing B, Verrier R, Stone P, MacCallum G, Speizer F, Gold D. Traffic related pollution and heart rate variability in a panel of elderly subjects. Thorax. 2005;60:455–461. doi: 10.1136/thx.2004.024836. [DOI] [PMC free article] [PubMed] [Google Scholar]
- Seaton A, MacNee W, Donaldson K, Godden D. Particulate air pollution and acute health effects. Lancet. 1995;345:176–178. doi: 10.1016/s0140-6736(95)90173-6. [DOI] [PubMed] [Google Scholar]
- Seaton A, Soutar A, Crawford V, Elton R, McNerlan S, Cherrie J, Watt M, Agius R, Stout R. Particulate air pollution and the blood. Thorax. 1999;54:1027–1032. doi: 10.1136/thx.54.11.1027. [DOI] [PMC free article] [PubMed] [Google Scholar]
- Seinfeld JH, Pandis SN. Atmospheric Chemistry and Physics: From Air Pollution to Climate Change. John Wiley and Sons; New York, NY: 1998. [Google Scholar]
- Shishehbor MH, Bhatt DL, Topol EJ. Using C-reactive protein to assess cardiovascular disease risk. Clev Clin J Med. 2003;70:634–640. doi: 10.3949/ccjm.70.7.634. [DOI] [PubMed] [Google Scholar]
- Siegel PD, Saxena RK, Saxena QB, Ma JK, Ma JY, Yin XJ, Castranova V, Al-Humadi N, Lewis DM. Effect of diesel exhaust particulate (DEP) on immune responses: Contributions of particulate versus organic soluble components. J Toxicol Environ Health A. 2004;67:221–231. doi: 10.1080/15287390490266891. [DOI] [PubMed] [Google Scholar]
- Slaughter JC, Lumley T, Sheppard L, Koenig JQ, Shapiro GG. Effects of ambient air pollution on symptom severity and medication use in children with asthma. Ann Allergy Asthma Immunol. 2003;91:346–353. doi: 10.1016/S1081-1206(10)61681-X. [DOI] [PubMed] [Google Scholar]
- Sørensen M, Daneshvar B, Hansen ML, Dragsted LO, Hertel O, Knudsen L, Loft S. Personal PM2.5 exposure and markers of oxidative stress in blood. Environ Health Perspect. 2003;111:161–165. doi: 10.1289/ehp.111-1241344. [DOI] [PMC free article] [PubMed] [Google Scholar]
- Sørensen M, Schins RP, Hertel O, Loft S. Transition metals in personal samples of PM2.5 and oxidative stress in human volunteers. Cancer Epidemiol Biomarkers Prev. 2005;14:1340–1343. doi: 10.1158/1055-9965.EPI-04-0899. [DOI] [PubMed] [Google Scholar]
- Steerenberg PA, Nierkens S, Fischer PH, Van Loveren H, Opperhuizen A, Vos JG, Van Amsterdam JGC. Traffic-related air pollution affects peak expiratory flow, exhaled nitric oxide, and inflammatory nasal markers. Arch Environ Health. 2001;56:167–174. doi: 10.1080/00039890109604069. [DOI] [PubMed] [Google Scholar]
- Stewart JC, Chalupa DC, Devlin RB, Frasier LM, Huang LS, Little EL, Lee SM, Phipps RP, Pietropaoli AP, Taubman MB, Utell MJ, Frampton MW. Vascular effects of ultrafine particles in persons with type 2 diabetes. Environ Health Perspect. 2010;118:1692–1698. doi: 10.1289/ehp.1002237. [DOI] [PMC free article] [PubMed] [Google Scholar]
- Sullivan JH, Schreuder AB, Trenga CA, Liu SL, Larson TV, Koenig JQ, Kaufman JD. Association between short term exposure to fine particulate matter and heart rate variability in older subjects with and without heart disease. Thorax. 2005;60:462–466. doi: 10.1136/thx.2004.027532. [DOI] [PMC free article] [PubMed] [Google Scholar]
- Symons JM, Wang L, Guallar E, Howell E, Dominici F, Schwab M, Ange BA, Samet J, Ondov J, Harrison D, Geyh A. A case-crossover study of fine particulate matter air pollution and onset of congestive heart failure symptom exacerbation leading to hospitalization. Am J Epidemiol. 2006;164:421–433. doi: 10.1093/aje/kwj206. [DOI] [PubMed] [Google Scholar]
- Tan WC, Qiu D, Liam BL, Ng TP, Lee SH, van Eeden SF, D’Yachkova Y, Hogg JC. The human bone marrow response to acute air pollution caused by forest fires. Am J Respir Crit Care Med. 2000;161:1213–1217. doi: 10.1164/ajrccm.161.4.9904084. [DOI] [PubMed] [Google Scholar]
- Task Force of the European Society of Cardiology and the North American Society of Pacing and Electrophysiology. Heart rate variability: Standards of measurement, physiological interpretation and clinical use. Circulation. 1996;93:1043–1065. [PubMed] [Google Scholar]
- Trenga CA, Sullivan JH, Schildcrout JS, Shepherd KP, Shapiro GG, Liu LJ, Kaufman JD, Koenig JQ. Effect of particulate air pollution on lung function in adult and pediatric subjects in a Seattle panel study. Chest. 2006;129:1614–1622. doi: 10.1378/chest.129.6.1614. [DOI] [PubMed] [Google Scholar]
- Vallejo M, Ruiz S, Hermosillo AG, Borja-Aburto VH, Cárdenas M. Ambient fine particles modify heart rate variability in young healthy adults. J Expo Sci Environ Epidemiol. 2006;16:125–130. doi: 10.1038/sj.jea.7500447. [DOI] [PubMed] [Google Scholar]
- van Amsterdam JG, Nierkens S, Vos SG, Opperhuizen A, van Loveren H, Steerenberg PA. Exhaled nitric oxide: A novel biomarker of adverse respiratory health effects in epidemiological studies. Arch Environ Health. 2000;55:418–423. doi: 10.1080/00039890009604040. [DOI] [PubMed] [Google Scholar]
- van Amsterdam JG, Verlaan BPJ, Van Loveren H, Elzakker BGV, Vos SG, Opperhuizen A, Steerenberg PA. Air pollution is associated with increased level of exhaled nitric oxide in nonsmoking healthy subjects. Arch Environ Health. 1999;54:331–335. doi: 10.1080/00039899909602496. [DOI] [PubMed] [Google Scholar]
- van Eeden SF, Hogg JC. Systemic inflammatory response induced by particulate matter air pollution: The importance of bone-marrow stimulation. J Toxicol Environ Health A. 2002;65:1597–1613. doi: 10.1080/00984100290071685. [DOI] [PubMed] [Google Scholar]
- van Eeden SF, Tan WC, Suwa T, Mukae H, Terashima T, Fujii T, Qui D, Vincent R, Hogg JC. Cytokines involved in the systemic inflammatory response induced by exposure to particulate matter air pollutants (PM(10)) Am J Respir Crit Care Med. 2001;164:826–830. doi: 10.1164/ajrccm.164.5.2010160. [DOI] [PubMed] [Google Scholar]
- Vassalle C, Petrozzi L, Botto N, Andreassi MG, Zucchelli GC. Oxidative stress and its association with coronary artery disease and different atherogenic risk factors. J Intern Med. 2004;256:308–315. doi: 10.1111/j.1365-2796.2004.01373.x. [DOI] [PubMed] [Google Scholar]
- Wang M, Zhu T, Zheng J, Zhang RY, Zhang SQ, Xie XX, Han YQ, Li Y. Use of a mobile laboratory to evaluate changes in on-road air pollutants during the Beijing 2008 Summer Olympics. Atmos Chem Phys. 2009;9:8247–8263. [Google Scholar]
- Wang S, Zhao M, Xing J, Wu Y, Zhou Y, Lei Y, He KB, Fu LX, Hao JM. Quantifying the air pollutants emission reduction during the 2008 Olympic Games in Beijing. Environ Sci Technol. 2010;44:2490–2496. doi: 10.1021/es9028167. [DOI] [PubMed] [Google Scholar]
- Wang T, Nie W, Gao J, Xue LK, Gao XM, Wang XF, Qiu J, Poon CN, Meinardi S, Blake D, Wang SL, Ding AJ, Chai FH, Zhang QZ, Wang WX. Air quality during the 2008 Beijing Olympics: secondary pollutants and regional impact. Atmos Chem Phys. 2010;10:7603–7615. [Google Scholar]
- Wang T, Xie SD. Assessment of traffic-related air pollution in the urban streets before and during the 2008 Beijing Olympic Games traffic control period. Atmos E nviron. 2009;43:5682–5690. [Google Scholar]
- Wei YJ, Han IK, Hu M, Shao M, Zhang JJ, Tang X. Personal exposure to particulate PAHs and anthraquinone and oxidative DNA damages in humans. Chemosphere. 2010;81:1280–1285. doi: 10.1016/j.chemosphere.2010.08.055. [DOI] [PubMed] [Google Scholar]
- Wellenius G, Schwartz J, Mittleman MA. Particulate air pollution and hospital admissions for congestive heart failure in seven United States cities. Am J Cardiol. 2006;97:404–408. doi: 10.1016/j.amjcard.2005.08.061. [DOI] [PubMed] [Google Scholar]
- World Health Organization (WHO) Air Quality Guidelines: Global Update. World Health Organization; Copenhagen, Denmark: 2005. [Google Scholar]
- Wu SW, Deng FR, Niu J, Huang QS, Liu YC, Guo XB. Association of heart rate variability in taxi drivers with marked changes in particulate air pollution in Beijing in 2008. Environ Health Perspect. 2009;118:87–91. doi: 10.1289/ehp.0900818. [DOI] [PMC free article] [PubMed] [Google Scholar]
- Xia T, Kovochich M, Nel A. The role of reactive oxygen species and oxidative stress in mediating particulate matter injury. Clin Occup Environ Med. 2006;5:817–836. doi: 10.1016/j.coem.2006.07.005. [DOI] [PubMed] [Google Scholar]
- Xu DQ, Zhang WL. Monitoring of pollution of air fine particles (PM2.5) and study on their genetic toxicity. Biomed Environ Sci. 2004;17:452–458. [PubMed] [Google Scholar]
- Yee DL, Sun CW, Bergeron AL, Dong JF, Bray PF. Aggregometry detects platelet hyperreactivity in healthy individuals. Blood. 2005;106:2723–2729. doi: 10.1182/blood-2005-03-1290. [DOI] [PMC free article] [PubMed] [Google Scholar]
- Zanobetti A, Gold DR, Stone PH, Suh HH, Schwartz J, Coull BA, Speizer FE. Reduction in heart rate variability with traffic and air pollution in patients with coronary artery disease. Environ Health Perspect. 2010;118:324–330. doi: 10.1289/ehp.0901003. [DOI] [PMC free article] [PubMed] [Google Scholar]
- Zanobetti A, Schwartz J. The effect of particulate air pollution on emergency admissions for myocardial infarction: A multicity case-crossover analysis. Environ Health Perspect. 2005;113:978–982. doi: 10.1289/ehp.7550. [DOI] [PMC free article] [PubMed] [Google Scholar]
- Zanobetti A, Schwartz J, Dockery DW. Airborne particles are a risk factor for hospital admissions for heart and lung disease. Environ Health Perspect. 2000;108:1071–1077. doi: 10.1289/ehp.001081071. [DOI] [PMC free article] [PubMed] [Google Scholar]
- Zezos P, Papaioannou G, Nikolaidis N, Vasiliadis T, Giouleme O, Evgenidis N. Elevated plasma von Willebrand factor levels in patients with active ulcerative colitis reflect endothelial perturbation due to systemic inflammation. World J Gastroenterol. 2005;11:7639–7645. doi: 10.3748/wjg.v11.i48.7639. [DOI] [PMC free article] [PubMed] [Google Scholar]
- Zhang J, Mauzerall DL, Zhu T, Liang S, Ezzati M, Remais JV. Environmental health in China: Progress towards clean air and safe water. Lancet. 2010;375:1110–1119. doi: 10.1016/S0140-6736(10)60062-1. [DOI] [PMC free article] [PubMed] [Google Scholar]
- Zheng M, Salmon LG, Schauer JJ, Zeng LM, Kiang CS, Zhang YH, Cass GR. Seasonal trends in PM2.5 source contributions in Beijing, China. Atmos Environ. 2005;39:3967–3976. [Google Scholar]
- Zhou Y, Wu Y, Yang L, Fu LX, He KB, Wang SX, Hao JM, Chen JC, Li CY. The impact of transportation control measures on emission reductions during the 2008 Olympic Games in Beijing, China. Atmos Environ. 2010;44:285–293. [Google Scholar]
- Zielinska B, Samy S, McDonald JD, Seagrave J. Research Report 147. Health Effects Institute; Boston, MA: 2010. Atmospheric Transformation of Diesel Emissions. [PubMed] [Google Scholar]
- Zuurbier M, Hoek G, Oldenwening M, Meliefste K, Krop E, van den Hazel P, Brunekreef B. In-traffic air pollution exposure and CC16, blood coagulation, and inflammation markers in healthy adults. Environ Health Perspect. 2011;119:1384–1389. doi: 10.1289/ehp.1003151. [DOI] [PMC free article] [PubMed] [Google Scholar]


