

Abstract
Loss of p53 gene function, which occurs in most colon cancer cells, has been shown to abolish the apoptotic response to 5-fluorouracil (5-FU). To identify genes downstream of p53 that might mediate these effects, we assessed global patterns of gene expression following 5-FU treatment of isogenic cells differing only in their p53 status. The gene encoding mitochondrial ferredoxin reductase (protein, FR; gene, FDXR) was one of the few genes significantly induced by p53 after 5-FU treatment. The FR protein was localized to mitochondria and suppressed the growth of colon cancer cells when over-expressed. Targeted disruption of the FDXR gene in human colon cancer cells showed that it was essential for viability, and partial disruption of the gene resulted in decreased sensitivity to 5-FU-induced apoptosis. These data, coupled with the effects of pharmacologic inhibitors of reactive oxygen species, indicate that FR contributes to p53-mediated apoptosis through the generation of oxidative stress in mitochondria.
5-fluorouracil (5-FU) has been in clinical use for several decades and is still the most effective adjuvant therapy for patients with colon cancer. Metabolically, it acts by blocking the enzyme thymidylate synthase and by inhibiting both RNA and DNA synthesis. Like most chemotherapeutic agents, 5-FU induces marked apoptosis in sensitive cells. However, the molecular mechanisms underlying this apoptosis are only beginning to be elucidated.
Several studies have suggested a correlation between inactivation of p53 and resistance to 5-FU, both in patients and in experimental systems1,2. For example, a profound resistance to 5-FU–induced apoptosis was observed in a human colon cancer cell line with a targeted disruption of the p53 gene (Trp53)3. Such observations support a genetic basis for 5-FU chemosensitivity and indicate that isogenic cells differing only in p53 status represent a useful system for studying chemosensitivity in vitro.
The mechanisms through which p53 induces apoptosis are the focus of much current research4–7. Several studies have implicated mitochondria-derived reactive oxygen species (ROS) in the process8–11. Though pro-apoptotic members of the Bcl-2 family of proteins have been shown to be induced by p53 and affect mitochondrial permeability, the molecular mechanisms responsible for the formation of mitochondrial ROS remain unclear12,13.
In an effort to gain further insight into this process, we examined global patterns of gene expression using the serial analysis of gene expression (SAGE) approach14. We were particularly interested in finding p53-induced genes that encode mitochondrial proteins with the potential to directly stimulate ROS production. Here we identify mammalian ferredoxin reductase (FR) as a novel downstream mediator of p53 that fulfills this function.
Serial analysis of gene expression
The substantial difference in the 5-FU–sensitivity of isogenic HCT116 cell lines differing only in p53 status provided an ideal system for gene expression profiling3. SAGE libraries were constructed from mRNA of HCT116 TRP53+/+ and TRP53−/− cell lines that had been treated with 5-FU for 18 hours, well before morphologic features of apoptosis were evident. A total of 50,370 and 51,088 SAGE tags were obtained from the cells with and without functional p53 genes, respectively. These tags corresponded to 8,421 unique transcripts, diagrammed according to fold of induction or repression in Fig. 1a. Internal controls were provided by the p53-inducible genes P21 and PIG3 with SAGE tag ratios of 67:3 and 13:0, respectively, in the libraries from the TRP53+/+ and TRP53−/− cell lines.
Fig. 1.

Summary of SAGE data and northern-blot analysis of FDXR mRNA induction. a, Graphic representation of the number of unique transcripts stratified according to the fold that they were induced or repressed. P-False > 0.05 (ref. 35). b, Time course of FDXR mRNA (1.8 kb) induced by 5-FU at the indicated time in HCT116 cells with wild-type (WT) or TRP53−/−. c, FDXR mRNA induction 18 h after infection with an adenovirus expressing mutant (M) or wild-type (W) p53 in the indicated colon cancer cell lines. SW480 and DLD1 have mutated TRP53 whereas HCT116 and SW48 have wild-type. The film exposure for the TRP53−/− cells was longer, enabling detection of the lower basal levels of FDXR mRNA in these lines. The lower basal level is consistent with the transcriptional dependence of FR expression on p53. GAPDH served as controls for relative amounts of RNA in all lanes.
Only 14 previously identified genes were found to be induced greater than five-fold in the TRP53+/+ cells. Among these were p21, PIG3 and tumor necrosis factor-related apoptosis-inducing ligand (TRAIL)-receptor 2 (DR-5, KILLER) (Table 1). We identified 11 other significantly induced tags that did not correspond to any previously characterized genes and six genes that were repressed greater than five-fold; these were not pursued further.
Table 1.
Genes induced or repressed following 5-FU treatment
| Induced genes | SAGE Tag + (15th bp) | WT | KO | Ratio |
|---|---|---|---|---|
| Placental BMP homolog, TGFβ superfamily | GTGCTCATTCa | 24 | 0 | >24 |
| p21 | TGTCCTGGTTc | 67 | 3 | 22 |
| Ribosomal protein | GCGGCAGCGGa | 17 | 1 | 17 |
| Acyl CoA thioester hydrolase | GCAACGGGCCc | 15 | 0 | >15 |
| Ribosomal protein L28 | GCGGCGGCTCc | 30 | 2 | 15 |
| PIG3 (quinone oxidoreductase homolog) | GAGGCCAACA | 13 | 0 | >13 |
| Ferredoxin reductase/Adrenodoxin reductase | CTGGAAATAAa | 22 | 2 | 11 |
| DNA polymerase delta cat. subunit | GGGCGGGGGCg | 32 | 3 | 11 |
| TNF Related Apop Induc Lig Receptor 2 | ACCAAATTAAa | 19 | 2 | 10 |
| PolyA binding protein | GGGTAGCTGGg | 17 | 2 | 9 |
| MHC class II antigen | CTCCACAAATt | 24 | 3 | 8 |
| Huntingtin interacting protein (364bp DNA) | GGCAACGTGGt | 20 | 3 | 7 |
| Ribosomal protein | GGCCCGAGTTa | 23 | 4 | 6 |
| TNF Recep 2 related prot (CD18) | CAAATAAAAAg | 16 | 3 | 5 |
| Induced ESTs | SAGE Tag + (15th bp) | WT | KO | Ratio |
| UI-1-similar to CGI-67 protein | TGGACCCCCCg | 13 | 0 | >13 |
| UI-2-unkown | GGGGCAAAAAa | 12 | 0 | >12 |
| UI-3-weakly similar to yeast TPR | TGGGTGGGGGg | 18 | 1 | 18 |
| UI-4-MKP-1-like prot tyr phosphatase, dual specificity | TGCCCAGGATt | 16 | 1 | 16 |
| UI-5-homeobox gene | GGCTGGGTTTt | 15 | 1 | 15 |
| UI-6-similar to protein transport protein sec61 beta | AGAGAAATTTc | 14 | 1 | 14 |
| UI-7-SH3 domain-containing protein | AGGGGCGCAGa | 13 | 1 | 13 |
| UI-8-EST | GGGAGGAGGGg | 13 | 1 | 13 |
| UI-9-yeast SCO1&2 homolog | GCGGCTTTCCg | 17 | 2 | 9 |
| UI-10-EST | TGGCGTGGCCg | 28 | 3 | 9 |
| UI-11-EST | GGTGCAGAGCc | 38 | 5 | 8 |
| Repressed genes | SAGE Tag + (15th bp) | WT | KO | Ratio |
| Protein tyrosine phosphatase, hPTPCAAX1 | CATTTATCATc | 0 | 20 | 0.025 |
| Immunophilin homolog ARA9/Aryl hydrocarbon recep. | CTTCTGTGTAt | 0 | 11 | 0.045 |
| Survival motor neuron gene | GCTGTTCATTg | 1 | 13 | 0.077 |
| Repressed ESTs | SAGE Tag + (15th bp) | WT | KO | Ratio |
| UR-1-EST | TTGACACTTTc | 0 | 21 | 0.024 |
| UR-2-Unknown | TACTAGTCCCc | 0 | 13 | 0.038 |
| UR-3-EST | TAGTTGTAGGg | 0 | 12 | 0.042 |
The candidate genes are listed in decreasing order of fold induction or fold repression (P-False < 0.05). The SAGE tag sequence and the identity of the 15th base (lower case letter) are shown. UI, unknown induced gene; UR, unknown repressed gene. All genes are designated by their product. (A complete list of the tags induced and repressed in this system is available as supplemental information at http://www.sagenet.org)
Unexpectedly, one of the genes induced by p53 was FDXR (SAGE tag ratio 22:2). This gene had not previously been associated with p53 or with apoptosis. Northern blots confirmed that its induction by 5-FU was strictly dependent on functional p53 (Fig. 1b). FDXR mRNA began to be induced as early as three hours, indicating that it was a direct transcriptional target of p53. Accordingly, we found a perfect TRP53 DNA-binding consensus sequence (GGGCTTGCCC)15 33 bp upstream of the transcription start site. FDXR mRNA was induced in response to 5-FU in another colon cancer cell line with wild-type TRP53 (SW48) but not in DLD1 cells with mutant TRP53 (data not shown). Infection with adenoviruses expressing wild-type but not mutant TRP53 also induced FDXR mRNA in other colon cancer cell lines, indicating that p53 itself, rather than some other effect of 5-FU, was responsible for this induction (Fig. 1c).
FR (also called adrenodoxin reductase) is the sole mammalian mitochondrial cytochrome P-450 NADPH reductase, and is located on the matrix side of the inner mitochondrial membrane16–18. FR is responsible for transferring electrons from NADPH, via the single electron shuttle ferredoxin, to substrates such as cholesterol. Importantly, under substrate-limiting conditions, electrons can leak from this shuttling system and generate superoxide. Thus, FR has been labeled an ‘electron gun’19,20. These previously described biochemical properties, together with its induction by p53, stimulated us to determine whether this gene might have a previously unsuspected role in p53-dependent apoptosis.
Over-expression of FR inhibits cell growth
In order to study the effect of FDXR over-expression on cell growth, we cloned wild-type and deletion mutant FDXR–GFP (green fluorescent protein gene) fusion constructs into a tetracycline (tet)-inducible vector. The mutant construct retained only the mitochondrial-targeting domain located at the N-terminus and was missing the NADPH and FAD binding domains. Transient expression of these constructs in the DLD1 cell line resulted in robust expression of both the wild-type and mutant fusion proteins, as visualized by GFP fluorescence (Fig. 2a). This fluorescence colocalized with that from MitoTracker Red dye, indicating that both the wild-type and mutant fusion proteins were correctly targeted to the mitochondria (Fig. 2a).
Fig. 2.

Expression of FDXR–GFP fusion proteins. a, 911 cells were transfected with wild-type (WT) or deletion mutant (MUT) FDXR–GFP construct and its expression assessed with fluorescence microscopy. MitoTracker Red specifically labels the mitochondria and colocalizes with the FDXR–GFP (green). b, The fraction of stable clones that expressed GFP after doxycycline withdrawal in clones transfected with the indicated genes and grown in selective media for 14 d.
We next attempted to establish stable transfectants that would express wild-type or mutant FDXR–GFP fusion proteins, using DLD-1 cells containing an inducible tet activator construct21. We obtained numerous clones for both wild-type and mutant fusion genes, however, only the mutant FDXR–GFP clones exhibited robust GFP expression upon induction. We were unable to obtain any clones expressing significant levels of the wild-type FDXR–GFP fusion protein by fluorescence or by western-blot analysis (data not shown). One stable wild-type clone with high levels of mitochondrial GFP fluorescence turned out to have a de novo truncation of the FDXR–GFP fusion protein upon western-blot analysis. These results indicated that FR had a potent growth-suppressive effect, so that even the low levels of FR expression afforded in the presence of doxycycline repression precluded clonal outgrowth. Fig. 2b summarizes the colony survival results after transfection of the wild-type FDXR–GFP and mutant FDXR–GFP fusion genes as well as a control mitochondrial gene superoxide dismutase (MnSOD). While the mutant FDXR–GFP construct, devoid of the oxidoreductase domain, yielded as many colonies as the control MnSOD gene, expression of the wild-type FDXR–GFP fusion gene largely eliminated colony outgrowth (Fig. 2b).
Disruption of FDXR by targeted homologous recombination
To more rigorously determine the role of FR in 5-FU apoptosis, we performed targeted disruptions of the FDXR gene in the HCT116 cell line. Two targeting constructs (KO-1 and KO-2) were designed, each containing the neomycin-resistance gene flanked by loxP sites but with homology arms of different lengths (Fig. 3a). Targeted homologous recombination was performed as described22. The frequency of targeted FDXR gene disruption in parental HCT116 cells was approximately 1:10,000 and 1:3,000 with the KO-1 and KO-2 constructs, respectively. After confirming homologous recombination by Southern-blot analysis, adenovirus-Cre–mediated excision of the neomycin-resistance gene allowed us to use the same KO-1 or KO-2 constructs to disrupt the second allele. The two-allele FDXR knockout frequency was approximately 1:5,000 using the KO-2 construct, consistent with predictions from the frequency of one-allele knockout clones.
Fig. 3.

FDXR targeting constructs. a, Structure of the targeting constructs aligned with the FDXR gene, containing 12 exons (numbered vertical bars). b, Southern blot of parental HCT116 (+/+/+), one-allele FDXR knockout (+/+/−) and two-allele FDXR knockout (+/−/−) cells. The WT and the knockout bands are indicated, before (+neo) and after (−neo) Cre-recombinase excision of the neomycin gene from the FDXR heterozygotes. The FDXR knockout clones depicted here were obtained using the KO-1 construct. c, SNP determination of parental HCT116 (lane 1), FDXR+/+/− (lane 2), and four different FDXR+/−/− clones (lanes 3, 4, 5 and 6). Note that the relative intensities of the SNP:non-SNP sequence bands show 1:3, 1:2, and 1:1 intensity relationships corresponding to their respective FDXR genotypes.
Surprisingly, subclones that clearly had two alleles knocked out when assessed by PCR and Southern-blotting techniques still had one intact copy of the FDXR gene. Further analysis of this unexpected result revealed that the largely diploid HCT116 cell line had three copies of the FDXR gene. The FDXR gene is normally on chromosome 17q (ref. 17). In HCT116 there is a third copy located on an abnormal chromosome 18 that contains a small segment of chromosome 17q fused to the telomeric end of 18p (ref. 23). Fig. 3b shows the Southern blot of the wild-type (+/+/+), one-allele FDXR knockout (+/+/−) and two-allele FDXR knockout (+/−/−) clones. We obtained four independent clones (D2, C2, E9 and B7) in which two FDXR alleles had been disrupted (FDXR+/−/−). The genotypes of these clones were determined using two single nucleotide polymorphisms (SNPs; T1017C and C1046T) at the 3′ end of intron 2. These SNPs defined two alleles of FDXR, termed A and B (Fig. 3c). The parental HCT116 contained one A allele and two B alleles, indicating that the B allele was the one translocated to chromosome 18p. Of the four FDXR+/−/− heterozygotes, clone C2 retained allele B and lost one copy each of allele A and allele B, while clones D2, E9 and B7 retained allele A and had therefore lost both copies of allele B (Fig. 3c).
To disrupt the third FDXR allele, we transfected the two-allele knockout clones with the KO-2 construct. We found no FDXR−/−/− clones among more than 80,000 clones screened. This represented eight-fold more clones than estimated to be necessary for disrupting the third allele. Because it was possible to independently disrupt each of the three alleles individually (Fig. 3c), our inability to disrupt all three alleles in combination strongly suggested that FDXR is essential for the viability of HCT116 cells.
FDXR+/−/− clones show altered 5-FU induced apoptosis
Compared to the fraction of apoptotic cells in the parental cell line and in two sister clones with three intact copies of FDXR, there was significantly less apoptosis in the FDXR-knockout clones at 12.5 and 25 μM 5-FU (7 ± 1% and 18 ± 3%, respectively) versus wild-type cells (14 ± 2% and 35 ± 3%, respectively) (Fig. 4a). The resistance to 5-FU–induced apoptosis was not complete in these FDXR+/−/− clones, as higher levels of 5-FU or longer periods of exposure to 5-FU induced apoptosis in all clones tested (data not shown). Another HCT116 derivative, in which P21 had been disrupted by targeted homologous integration, showed similar sensitivity to 5-FU as the parental cells (Fig. 4a). Undiminished levels of 5-FU–induced apoptosis were also observed in HCT116 cells with the gene encoding 14-3-3σ (D11RUB13) disrupted or with both P21 and D11RUB13 disrupted (data not shown). Thus the gene disruption procedure per se did not account for the decreased sensitivity of the FDXR+/−/− clones to 5-FU, which was quite specific. We also performed western-blot analysis on both the HCT116 wild-type and FDXR+/−/− cell lines for the induction of TRP53 and P21 proteins after 5-FU treatment (Web Supplement, Fig. A). Both proteins were significantly induced in all clones, indicating an intact 5-FU response as measured by these parameters.
Fig. 4.

FDXR+/−/− clones are less sensitive to the apoptotic effects of 5-FU. a, The average percentage of apoptotic cells on the y-axis (mean ± s.e. of the mean) after 48 h of treatment at the indicated dose of 5-FU (x-axis) is shown for HCT116 WT (■, average of parental cells plus 2 independent wild-type sister subclones), HCT116 FDXR+/−/− (
 , average of clones D2, C2, E9 and B7), and HCT116 TRP53−/− (
 ) and p21−/− clones (□). At least 100–300 cells were counted in duplicate for each data point and each experiment was repeated at least 3 times. b, Western blots using antibodies against FR, caspase 9 and β-catenin to sequentially probe the same membrane after stripping. Cells were treated with (+) or without (−) 5-FU for 48 h. c, Percentage of cells with DNA contents corresponding to ■, SubG1;
, G1, □, S; and
, G2, as determined by flow cytometry. Percentages and error bars (n=3) from one representative experiment, repeated at least three times with similar results. d, Flow cytome-try profiles of the parental wild-type HCT116 (WT-Par), 2 wild-type sister sub-clones (WT-A1 and WT-E1), a TRP53−/− clone and 4 FDXR+/−/− clones (D2, C2, E9 and B7) before (0 h) and after (48 h) treatment with 5-FU. Cells with 2N DNA content correspond to those in G1 while cells in the 4N peak are in G2/M. These experiments were repeated at least three times with similar results.
) and p21−/− clones (□). At least 100–300 cells were counted in duplicate for each data point and each experiment was repeated at least 3 times. b, Western blots using antibodies against FR, caspase 9 and β-catenin to sequentially probe the same membrane after stripping. Cells were treated with (+) or without (−) 5-FU for 48 h. c, Percentage of cells with DNA contents corresponding to ■, SubG1;
, G1, □, S; and
, G2, as determined by flow cytometry. Percentages and error bars (n=3) from one representative experiment, repeated at least three times with similar results. d, Flow cytome-try profiles of the parental wild-type HCT116 (WT-Par), 2 wild-type sister sub-clones (WT-A1 and WT-E1), a TRP53−/− clone and 4 FDXR+/−/− clones (D2, C2, E9 and B7) before (0 h) and after (48 h) treatment with 5-FU. Cells with 2N DNA content correspond to those in G1 while cells in the 4N peak are in G2/M. These experiments were repeated at least three times with similar results.
Indicators of apoptosis in the knockout clones
A polyclonal antibody to FR protein was generated in rabbits following immunization with a FR synthetic peptide, and used to assess FR protein expression by western blotting. After 48 hours of treatment with 5-FU, FR protein expression was clearly induced in the parental cell line (wild-type, Fig. 4b). In comparison, the basal and 5-FU–induced levels of FR protein were decreased in all four FDXR+/−/− clones (examples in Fig. 4b). No FR protein was induced in TRP53−/− cells, consistent with the dependence of FDXR mRNA induction on p53 (Fig. 1b).
It has been shown that cleavages of caspase 9 and β-catenin are relatively early markers of apoptosis24. The protein levels of both caspase 9 precursor and intact β-catenin were seen to decrease in parental HCT116 cells treated with 5-FU, concomitant with the appearance of smaller immunoreactive peptides. In contrast, the FDXR+/−/− and TRP53−/− clones showed negligible reductions in the full-length proteins after 5-FU treatment (Fig. 4b).
Flow cytometry and quantification of apoptosis
Treatment of wild-type parental cells (WT-Par) with 5-FU resulted in pronounced changes in cell cycle distributions. These included the elimination of the normal 4N peak, blunting of the 2N peak, and many sub-2N cells (Fig. 4c and d). We observed nearly identical patterns following treatment of two wild-type subclones (WT-A1 and WT-E1) with three intact FDXR alleles. In contrast, treatment of TRP53−/− cells induced a G1 arrest (70% 2N fraction) and an absence of cells in G2 (4N), with no increase in apoptotic (sub-G1) cells.
The FDXR+/−/− clones (D2, C2, E9 and B7) showed a markedly different cell-cycle response with higher retention of G2 cells (32% versus only 13% in parental cells). The absence of a G2 peak in the TRP53−/− cells, but not in the FDXR+/−/− cells, is consistent with the absence of a G2 checkpoint that is dependent on p53 but not upon FR (ref. 25). Moreover, there was a smaller proportion of apoptotic cells (sub-G1, 17 ± 4%) in the FDXR+/−/− cells compared with those with three intact FDXR genes (30 ± 6%) (Fig. 4c). This 43% reduction in apoptotic cells was similar to that determined from morphological observations (49% reduction at 25 μM 5-FU, Fig. 4a).
Relationship between oxidative stress and 5-FU treatment
To determine whether the disruption of FDXR alleles affected the generation of ROS, we assessed cells 24 hours following 5-FU treatment when no significant morphological evidence of apoptosis was apparent. The parental HCT116 (wild-type) cells demonstrated a significant amount of ROS, indicated by green staining with dichlorofluorescein (DCF) after digitonin permeabilization (Fig. 5a). In contrast, the TRP53−/− cells and the two FDXR+/−/− clones (D2 and C2) showed significantly less DCF staining. It has been shown that digitonin permeabilization of the plasma membrane facilitates mitochondrial localization of DCF in cells that are stressed with an apoptotic stimulus26. The green DCF fluorescence in parental cells following 5-FU treatment colocalized with the mitochondrial MitoTracker Red staining (Fig. 5b).
Fig. 5.
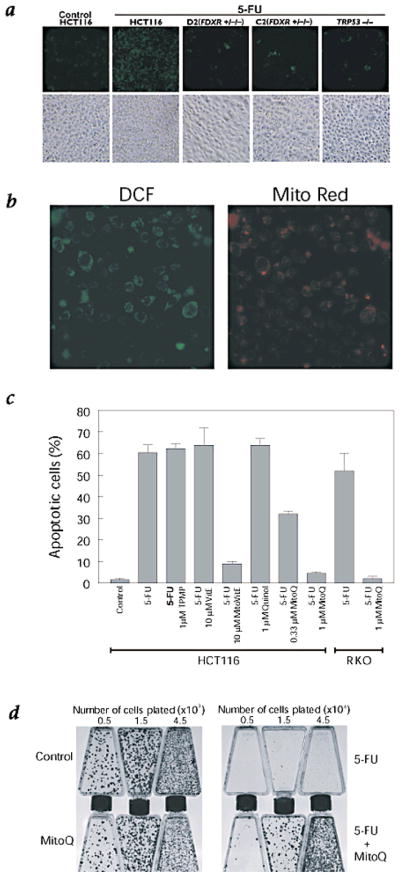
Increased DCF signal is associated with 5-FU–induced apoptosis. a, Cells were stained with the ROS-indicator DCF 18 to 24 h after 5-FU treatment of parental wild-type HCT116 cells, a TRP53−/− clone and two representative FDXR+/−/− (D2 and C2) clones. All 5 photomicrographs were taken at equal magnification (×20) and exposure times. The corresponding phase contrast images are shown to demonstrate equivalent cell densities. b, The DCF staining in the WT digitonin-permeabilized cells is consistent with mitochondrial localization, as confirmed by colocalization with MitoTracker Red. c, Mean percentage of apoptotic cells (y-axis) in the parental HCT116 or RKO cells treated for 48 h with the indicated agents. For the noted conditions, cells were pretreated with TPMP, vitamin E (VitE), TPMP-vitamin E (MitoVitE), ubiquinol (Quinol) or TPMP-ubiquinol (MitoQ) for 18 h prior to 5-FU addition. d, Colony-formation assays for the noted treatment conditions before plating at the indicated cell densities in T-25 flasks.
To determine whether 5-FU induced apoptosis is dependent on ROS generation, we used a pharmacologic approach. Ubiquinol is a powerful antioxidant that has been evaluated extensively due to its role in mitochondrial function and metabolism. A recently developed derivative of ubiquinol, mitoQ, is specifically targeted to mitochondria through its covalent attachment to the lipophilic cation triphenylmethyl phosphonium (TPMP)27. Treatment with as little as 0.3 μM mitoQ partially blocked 5-FU–induced apoptosis while 1 μM completely blocked it (Fig. 5c). The carrier molecule TPMP alone or free ubiquinol had no effect (Fig. 5c). The less powerful antioxidant vitamin E had no effect alone, but when conjugated to TPMP it also effectively blocked 5-FU apoptosis at 10 μM.
We examined two other human colorectal cancer cell lines (SW48 and RKO) with apparently intact p53 function to determine whether mitoQ could block 5-FU induced apoptosis. Only a minor effect was observed with SW48 cells (data not shown) but 1 μM mitoQ completely blocked apoptosis in RKO cells (Fig. 5c).
To ensure that mitoQ does not exert toxic effects on cells, thereby nonspecifically inhibiting the apoptotic process, we performed colony formation assays after exposing HCT116 cells to 1 μM mitoQ for 20 hours. Compared to control, there was no significant difference in the number of clones surviving after mitoQ treatment (Fig. 5d).
Clonogenicity assays provide a more stringent test of chemosensitivity than apoptosis assays. Cells with disrupted TRP53, for example, are resistant to 5-FU–induced apoptosis but still do not form colonies after 5-FU treatment3. To test whether mitoQ could prevent reduced clonogenicity after 5-FU treatment, we pretreated cells for 8 hours with 1 μM mitoQ, then applied 50 μg/ml 5-FU for an additional 12 hours. The mitoQ pretreatment had a dramatic effect on clonogenicity (Fig. 5d), further emphasizing the critical importance of mitochondrial ROS in the responses to 5-FU.
Discussion
The assessment of global gene-expression profiles in cells differing in only a single gene has great potential for elucidating the basis for pharmacologic action. Although the apoptosis following 5-FU treatment is completely dependent on the presence of intact p53 expression, our results demonstrate that only a small number of genes, including particularly FDXR, are induced by 5-FU in a p53-dependent manner.
Notably, we show here that a partial disruption of FDXR had a major effect on p53-induced apoptosis. We had expected such major effects only after complete disruption of the FDXR gene, as previous disruptions of p53-dependent genes have resulted in significant phenotypes only when all copies had been eliminated. In the case of FDXR, it was impossible to disrupt all three copies, as FDXR is apparently an essential gene. A requirement for FR is consistent with the fact that ferredoxin is essential for all cellular Fe-S enzyme biogenesis and with experiments in Saccharomyces cerevisiae demonstrating that the yeast FDXR homolog ARH1 is an essential gene28–30.
Colony formation assays on cells treated with mitoQ prior to 5-FU showed that the level of oxidative stress in mitochondria is critical for long-term colony survival (Fig. 5c). Notably, neither p53-deficiency nor partial knockout of FDXR allowed cells to survive 5-FU treatment when measured by clonogenic assays. Therefore, it appears that 5-FU toxicity involves more than p53, or any of its downstream mediators, including FR, and that p53 impacts only the short-term apoptotic response to 5-FU, not the longer-term growth inhibition. However, the mitoQ rescue of clonogenicity dramatically emphasizes the importance of mitochondrial ROS in determining cellular fate after 5-FU treatment.
As more has been learned about p53, it has become apparent that there is a reaction to nearly every p53 action31. For example, MDM2 negatively regulates p53 protein stability, but p53 positively regulates MDM2 expression, creating a negative feedback loop. A similar cross-regulatory phenomenon appears to apply to p53 and ROS. It has recently been shown that inhibition of the NADH quinone oxidoreductase 1 (NQO1, PIG3) can inhibit p53 induction following exposure to irradiation and can thereby interfere with p53-dependent apoptosis32. Our studies show that mitoQ and mitoVitE, two new antioxidants specifically targeted to mitochondria, completely eliminated 5-FU–induced apoptosis, whereas their non-targeted derivatives were inactive. Interestingly, this abrogation of apoptosis was associated with markedly less p53 protein when assessed by western blots (data not shown). The disruption of two FDXR alleles also significantly attenuated apoptosis, though p53 protein was still induced by 5-FU. Together, these results suggest a feed-forward loop between the production of ROS, the stabilization of p53 protein and the consequent induction of apoptosis. Though the physiologic stimulant of p53 stabilization remains to be defined33, we hypothesize that one important stimulant involves ROS and that a primary evolutionary function of p53 will be to protect cells from the effects of oxidative stress. At the animal level, this idea can be tested in mice, Drosophila and Caenorhabditis elegans with disruptions of their ferredoxin reductase homologs.
Methods
Cell culture and reagents
The human colon cancer cell lines HCT116, DLD1, SW48, SW480 and RKO (American Type Culture Collection, Manassas, Virginia) were maintained in McCoy’s 5A modified medium (Life Technologies, Grand Island, New York) supplemented with 10% FBS and penicillin/streptomycin (Gibco-BRL). The RPE cell line 911 was provided by A. J. Van der Eb. The derivations of the various cell lines and p53 adenovirus used in this study have been published3,21,34. Cells were treated with 5-fluorouracil at 50 μg/ml unless otherwise indicated.
Serial analysis of gene expression
The HCT116 TRP53+/+ and TRP53−/− cell lines were treated with 5-FU for 18 h prior to mRNA purification. A modified version of SAGE was performed as described (Micro-SAGE; www.sagenet.org/sage_protocol.htm). Differentially expressed tags were considered significant if the fold induction was ≥ 5 and the probability of induction was P–False < 0.05 by Monte Carlo analysis35.
Northern-blot analysis
Total RNA was purified using RNAgents kit (Promega, Madison, Wisconsin); 10-μg samples of RNA were separated in 1.5% agarose-formaldehyde gels. RNA was transferred onto Zeta-Probe GT Genomic blotting membrane (Bio-Rad, Hercules, California) and hybridized in QuickHyb (Stratagene, La Jolla, California)35. Probes for northern blotting were generated by PCR using cDNA or ESTs as template and labeled by random priming36.
MnSOD and FDXR fusion constructs and transfections
The MnSOD and FDXR constructs were made by PCR amplification from full-length ESTs and their coding sequences confirmed. The FDXR–GFP fusion gene was derived from pEGFP-N1 then subcloned into pTRE (Clontech, Palo Alto, California). The mutant FDXR construct was made by deleting amino acids 43–497 and by joining the mitochondrial leader sequence to the N-terminus of GFP. MnSOD was cloned into the pBi-MCS-GFP vector and the expression of MnSOD protein confirmed by western-blot analysis (data not shown)21. Transient and stable transfections were carried out in 911-tet and DLD1-tet cells ((tet)-off inducible system) as described21. The construct gene and pTK-hyg (Clontech) were stably cotransfected at a 5:1 molar ratio and clones selected with Hygromycin-B at 250 μg/ml (Calbiochem, La Jolla, California).
Mitochondrial colocalization studies
Confocal microscopy was used to visualize GFP expression 24 h after transient transfection of 911-tet cells. For colocalization studies, cells were incubated with 0.5 μM MitoTracker Red (Molecular Probes, Eugene, Oregon) at 37 °C for 30 min.
Targeted disruption of FDXR by homologous recombination
The KO-1 and KO-2 targeting constructs were made by PCR amplifying the FDXR gene from HCT116 genomic DNA. The KO-2 construct represented a bipartite targeting vector system with an additional recombination site designed into the middle portion of the neomycin resistance gene37. Transfection, selection and PCR screening strategies for somatic-cell homologous recombination have been described22. Because the frequency of recombination at the FDXR gene locus was relatively low, recombinant clones were screened in pools. Correctly targeted recombinant clones were cloned by limiting dilution and their genomic DNA analyzed by Southern blotting. The neomycin-resistance gene was excised by infection with an adenovirus expressing Cre recombinase prior to another round of homologous recombination38.
Apoptosis assays
For 5-FU sensitivity the loose cells in the media were pooled with the trypsinized cells and stained with Hoechst 33258 dye39. Apoptosis was scored by fluorescence microscopy and analyzed by flow cytometry.
FR antibody production and western-blot analysis
A FR synthetic peptide (aa473–490) was used to immunize rabbits and the sera were affinity purified (Quality Controlled Biochemicals, Hopkinton, Massachusetts). Western blotting of total protein lysates was performed as described22. The purified antibody against FR reacted with a single band of 52 kD corresponding to processed FR. A rabbit polyclonal antibody against caspase-9 (SC-7890, Santa Cruz Biotechnology, Santa Cruz, California) and a mouse monoclonal antibody against β-catenin (C19220, Transduction Laboratories) were also used.
DCF staining in plasma membrane-permeabilized cells
Cells were treated with 5-FU for 24 h and then incubated with 1 μM DCF (carboxy-dichlorofluorescein diacetate, Molecular Probes, Eugene, Oregon) in 50 μg/ml digitonin at 37 °C for 15 min26. These cells were then examined by phase, confocal and fluorescence microscopy.
Colony formation assay
HCT116 wild-type cells were treated with 1 μM mitoQ for 20 h prior to plating in T-25 flasks. For the post–5-FU exposure colony formation assay, the mitoQ pretreated cells were incubated with 1 μM mitoQ for 8 h, prior to the addition of 50 μg/ml 5-FU for an additional 12 h. The indicated number of cells were then plated in drug-free medium in T-25 flasks and stained with crystal violet after 7–14 d.
Supplementary Material
Acknowledgments
We thank L. Meszler for help with cell imaging and all members of the Kinzler/Vogelstein Laboratories for advice and discussion. This work was supported by the Clayton Fund, the Miracle Foundation, and NIH grants CA 43460 and GM 07184. K.W.K. receives research funding from Genzyme Molecular Oncology (Genzyme) and K.W.K. and B.V. are consultants to Genzyme. Under a licensing agreement between the Johns Hopkins University and Genzyme, the SAGE technology was licensed to Genzyme, and K.W.K. and B.V. are entitled to a share of royalty received by the University from sales of the licensed technology. The terms of these arrangements are being managed by the University in accordance with its conflict of interest policies.
Footnotes
Supplementary information is available on the Nature Medicine website (http://medicine.nature.com/supplementary_info/).
References
- 1.O’Connor PM, et al. Characterization of the p53 tumor suppressor pathway in cell lines of the National Cancer Institute anticancer drug screen and correlations with the growth-inhibitory potency of 123 anticancer agents. Cancer Res. 1997;57:4285–300. [PubMed] [Google Scholar]
- 2.Lowe SW, et al. p53 status and the efficacy of cancer therapy in vivo. Science. 1994;266:807–810. doi: 10.1126/science.7973635. [DOI] [PubMed] [Google Scholar]
- 3.Bunz F, et al. Disruption of p53 in human cancer cells alters the responses to therapeutic agents. J Clin Invest. 1999;104:263–269. doi: 10.1172/JCI6863. [DOI] [PMC free article] [PubMed] [Google Scholar]
- 4.Oren M. Regulation of the p53 tumor suppressor protein. J Biol Chem. 1999;274:36031–36034. doi: 10.1074/jbc.274.51.36031. [DOI] [PubMed] [Google Scholar]
- 5.Prives C, Hall PA. The p53 pathway. J Pathol. 1999;187:112–126. doi: 10.1002/(SICI)1096-9896(199901)187:1<112::AID-PATH250>3.0.CO;2-3. [DOI] [PubMed] [Google Scholar]
- 6.El-Deiry WS. Regulation of p53 downstream genes. Semin Cancer Biol. 1998;8:345–357. doi: 10.1006/scbi.1998.0097. [DOI] [PubMed] [Google Scholar]
- 7.Giaccia AJ, Kastan MB. The complexity of p53 modulation: emerging patterns from divergent signals. Genes Dev. 1998;12:2973–2983. doi: 10.1101/gad.12.19.2973. [DOI] [PubMed] [Google Scholar]
- 8.Johnson TM, Yu ZX, Ferrans VJ, Lowenstein RA, Finkel T. Reactive oxygen species are downstream mediators of p53-dependent apoptosis. Proc Natl Acad Sci USA. 1996;93:11848–11852. doi: 10.1073/pnas.93.21.11848. [DOI] [PMC free article] [PubMed] [Google Scholar]
- 9.Polyak K, Xia Y, Zweier JL, Kinzler KW, Vogelstein B. A model for p53 induced apoptosis. Nature. 1997;389:300–304. doi: 10.1038/38525. [DOI] [PubMed] [Google Scholar]
- 10.Lee JM. Inhibition of p53-dependent apoptosis by the KIT tyrosine kinase: regulation of mitochondrial permeability transition and reactive oxygen species generation. Oncogene. 1998;17:1653–1662. doi: 10.1038/sj.onc.1202102. [DOI] [PubMed] [Google Scholar]
- 11.Li PF, Dietz R, von Harsdorf R. p53 regulates mitochondrial membrane potential through reactive oxygen species and induces cytochrome c-independent apoptosis blocked by Bcl-2. EMBO J. 1999;18:6027–6036. doi: 10.1093/emboj/18.21.6027. [DOI] [PMC free article] [PubMed] [Google Scholar]
- 12.Green DR, Reed JC. Mitochondria and apoptosis. Science. 1998;281:1309–12. doi: 10.1126/science.281.5381.1309. [DOI] [PubMed] [Google Scholar]
- 13.Kroemer G, Reed JC. Mitochondrial control of cell death. Nature Med. 2000;6:513–519. doi: 10.1038/74994. [DOI] [PubMed] [Google Scholar]
- 14.Velculescu VE, Zhang L, Vogelstein B, Kinzler KW. Serial Analysis Of Gene Expression. Science. 1995;270:484–487. doi: 10.1126/science.270.5235.484. [DOI] [PubMed] [Google Scholar]
- 15.El-Deiry WS, Kern SE, Pietenpol JA, Kinzler KW, Vogelstein B. Definition of a consensus binding site for p53. Nature Genet. 1992;1:45–49. doi: 10.1038/ng0492-45. [DOI] [PubMed] [Google Scholar]
- 16.Lambeth JD, Seybert DW, Lancaster JR, Salerno JC, Kamin H. Steroidogenic electron transport in adrenal cortex mitochondria. Mol Cell Biochem. 1982;45:13–31. doi: 10.1007/BF01283159. [DOI] [PubMed] [Google Scholar]
- 17.Lin D, Shi YF, Miller WL. Cloning and sequence of the human adrenodoxin reductase gene. Proc Natl Acad Sci USA. 1990;87:8516–8520. doi: 10.1073/pnas.87.21.8516. [DOI] [PMC free article] [PubMed] [Google Scholar]
- 18.Ziegler GA, Vonrhein C, Hanukoglu I, Schulz GE. The structure of adrenodoxin reductase of mitochondrial P450 systems: electron transfer for steroid biosynthesis. J Mol Biol. 1999;289:981–990. doi: 10.1006/jmbi.1999.2807. [DOI] [PubMed] [Google Scholar]
- 19.Rapoport R, Sklan D, Hanukoglu I. Electron leakage from the adrenal cortex mitochondrial P450scc and P450c11 systems: NADPH and steroid dependence. Arch Biochem Biophys. 1995;317:412–416. doi: 10.1006/abbi.1995.1182. [DOI] [PubMed] [Google Scholar]
- 20.Hanukoglu I, Rapoport R, Weiner L, Sklan D. Electron leakage from the mitochondrial NADPH-adrenodoxin reductase- adrenodoxin-P450scc (cholesterol side chain cleavage) system. Arch Biochem Biophys. 1993;305:489–498. doi: 10.1006/abbi.1993.1452. [DOI] [PubMed] [Google Scholar]
- 21.Yu J, et al. Identification and classification of p53-regulated genes. Proc Natl Acad Sci USA. 1999;96:14517–14522. doi: 10.1073/pnas.96.25.14517. [DOI] [PMC free article] [PubMed] [Google Scholar]
- 22.Chan TA, Hermeking H, Lengauer C, Kinzler KW, Vogelstein B. 14-3-3Sigma is required to prevent mitotic catastrophe after DNA damage. Nature. 1999;401:616–620. doi: 10.1038/44188. [DOI] [PubMed] [Google Scholar]
- 23.Masramon L, et al. Cytogenetic characterization of two colon cell lines by using conventional G-banding, comparative genomic hybridization, and whole chromosome painting. Cancer Genet Cytogenet. 2000;121:17–21. doi: 10.1016/s0165-4608(00)00219-3. [DOI] [PubMed] [Google Scholar]
- 24.Yu J, Zhang L, Hwang PM, Kinzler KW, Vogelstein B. PUMA induces the rapid apoptosis of colorectal cancer cells. Molecular Cell. 2001;7:673–682. doi: 10.1016/s1097-2765(01)00213-1. [DOI] [PubMed] [Google Scholar]
- 25.Bunz F, et al. Requirement for p53 and p21 to sustain G2 arrest after DNA damage. Science. 1998;282:1497–1501. doi: 10.1126/science.282.5393.1497. [DOI] [PubMed] [Google Scholar]
- 26.Pham NA, Robinson BH, Hedley DW. Simultaneous detection of mitochondrial respiratory chain activity and reactive oxygen in digitonin-permeabilized cells using flow cytometry. Cytometry. 2000;41:245–251. doi: 10.1002/1097-0320(20001201)41:4<245::aid-cyto2>3.0.co;2-#. [DOI] [PubMed] [Google Scholar]
- 27.Kelso GF, et al. Selective targeting of a redox-active ubiquinone to mitochondria within cells: Antioxidant and antiapoptotic properties. J Biol Chem. 2001;276:4588–4596. doi: 10.1074/jbc.M009093200. [DOI] [PubMed] [Google Scholar]
- 28.Lill R, Kispal G. Maturation of cellular Fe-S proteins: an essential function of mitochondria. Trends Biochem Sci. 2000;25:352–356. doi: 10.1016/s0968-0004(00)01589-9. [DOI] [PubMed] [Google Scholar]
- 29.Manzella L, Barros MH, Nobrega FG. ARH1 of Saccharomyces cerevisiae: A new essential gene that codes for a protein homologous to the human adrenodoxin reductase. Yeast. 1998;14:839–846. doi: 10.1002/(SICI)1097-0061(19980630)14:9<839::AID-YEA283>3.0.CO;2-A. [DOI] [PubMed] [Google Scholar]
- 30.Li J, Saxena S, Pain D, Dancis A. Adrenodoxin reductase homolog (Arh1p) of yeast mitochondria required for iron homeostasis. J Biol Chem. 2001;276:1503–1509. doi: 10.1074/jbc.M007198200. [DOI] [PubMed] [Google Scholar]
- 31.Vogelstein B, Lane D, Levine AJ. Surfing the p53 network. Nature. 2000;408:307–310. doi: 10.1038/35042675. [DOI] [PubMed] [Google Scholar]
- 32.Asher G, Lotem J, Cohen B, Sachs L, Shaul Y. Regulation of p53 stability and p53-dependent apoptosis by NADH quinone oxidoreductase 1. Proc Natl Acad Sci USA. 2001;98:1188–1193. doi: 10.1073/pnas.021558898. [DOI] [PMC free article] [PubMed] [Google Scholar]
- 33.Meek DW. Mechanisms of switching on p53: a role for covalent modification? Oncogene. 1999;18:7666–7675. doi: 10.1038/sj.onc.1202951. [DOI] [PubMed] [Google Scholar]
- 34.Waldman T, Kinzler KW, Vogelstein B. p21 is necessary for the p53-mediated G(1) arrest in human cancer cells. Cancer Res. 1995;55:5187–5190. [PubMed] [Google Scholar]
- 35.Zhang L, et al. Gene expression profiles in normal and cancer cells. Science. 1997;276:1268–1272. doi: 10.1126/science.276.5316.1268. [DOI] [PubMed] [Google Scholar]
- 36.Feinberg AP, Vogelstein B. A technique for radiolabeling DNA restriction endonuclease fragments to high specific activity. Anal Biochem. 1983;132:6–13. doi: 10.1016/0003-2697(83)90418-9. [DOI] [PubMed] [Google Scholar]
- 37.Jallepalli PV, et al. Securin is required for chromosomal stability in human cells. Cell. 2001;105:445–457. doi: 10.1016/s0092-8674(01)00340-3. [DOI] [PubMed] [Google Scholar]
- 38.He TC, et al. A simplified system for generating recombinant adenoviruses. Proc Natl Acad Sci USA. 1998;95:2509–2514. doi: 10.1073/pnas.95.5.2509. [DOI] [PMC free article] [PubMed] [Google Scholar]
- 39.Waldman T, Lengauer C, Kinzler KW, Vogelstein B. Uncoupling of S phase and mitosis induced by anticancer agents in cells lacking p21. Nature. 1996;381:713–716. doi: 10.1038/381713a0. [DOI] [PubMed] [Google Scholar]
Associated Data
This section collects any data citations, data availability statements, or supplementary materials included in this article.