Abstract
We develop and test a pupil function determination algorithm, termed embedded pupil function recovery (EPRY), which can be incorporated into the Fourier ptychographic microscopy (FPM) algorithm and recover both the Fourier spectrum of sample and the pupil function of imaging system simultaneously. This EPRY-FPM algorithm eliminates the requirement of the previous FPM algorithm for a priori knowledge of the aberration in the imaging system to reconstruct a high quality image. We experimentally demonstrate the effectiveness of this algorithm by reconstructing high resolution, large field-of-view images of biological samples. We also illustrate that the pupil function we retrieve can be used to study the spatially varying aberration of a large field-of-view imaging system. We believe that this algorithm adds more flexibility to FPM and can be a powerful tool for the characterization of an imaging system’s aberration.
OCIS codes: (180.0180) Microscopy, (100.0100) Image processing
1. Introduction
Fourier ptychographic microscopy (FPM) is a newly developed super-resolution technique, which employs angularly varying illumination and a phase retrieval algorithm to surpass the diffraction limit of the objective lens [1]. By implementing FPM on a low numerical aperture (NA), large field-of-view (FOV) microscope, the space–bandwidth product (SBP) [2] can be scaled up dramatically by more than an order of magnitude [1]. However, because the low NA objective lens is not designed for high resolution imaging applications, the aberration becomes the limiting factor in pushing the SBP even higher.
To exploit the full throughput of the FPM imaging platform, Zheng et al. [1] introduced a digital wavefront correction strategy to correct for the spatially varying aberration [3–5] and demonstrate a high-resolution (0.78 um, 0.5 NA), wide-FOV (~120 mm2) microscope with a final SBP of ~1 gigapixel [1], which is highly desired for many biomedical applications such as digital pathology, haematology and immunohistochemistry.
One of the drawbacks of the aforementioned wavefront correction is that a pre-characterization of the spatially varying aberration of the microscopy system is needed [3]. Such a characterization can be computationally onerous, and is sensitive to the movement of the elements in the system. An adaptive wavefront correction method for FPM has been reported [6] and it uses an image-quality metric as a guide star for adaptive system corrections. This method eliminates the need of a pre-characterization process and is in particular useful for factoring out system uncertainty. However, the global optimization process imposes a heavy load on computational resources; only a limited number of low order aberrations can be corrected in a reasonable time duration.
In this paper, we introduce a new phase retrieval algorithm, termed embedded pupil function recovery (EPRY), which can reconstruct both the spatial Fourier spectrum of the sample and the pupil function of the imaging system from the captured FPM data set (the spatial Fourier spectrum can be directly recast as the spatial image of the sample by simply taking an inverse Fourier Transform). In this case, an aberration free image of the sample can be recovered and the aberration behavior of the image system can be estimated from the recovered pupil function without a complicated calibration process.
This paper is structured as follows: In Section 2, we describe the pupil function recovery problem we are trying to solve mathematically and the EPRY-FPM algorithm we use to recover the Fourier spectrum of the sample and imaging system pupil function. In Section 3, we verify the effectiveness of our proposed EPRY-FPM algorithm by simulation. In Section 4, we demonstrate that the implementation of our algorithm can help improve the imaging quality of the FPM system and that the pupil function we recovered can be further used to study the aberration behavior of the lens system. In Section 5, we illustrate the procedure of reconstructing large FOV, high resolution, monochrome and color images of biological samples using the EPRY-FPM algorithm. Specifically, we show that the recovered pupil function varies across the FOV and varies spectrally. In Section 6, we quantify the image quality improvement by using a USAF target and compare the performance of EPRY-FPM to the original FPM. We also illustrate that this new algorithm is automatic and allows for a less time consuming and more robust aberration characterization of the involved lens system. Finally, we end with a discussion of how this algorithm can add more flexibility to the FPM platform design and the possibility to use this algorithm as a general tool to measure lens system aberrations.
2. Reconstruction algorithm
As detailed described in previous publications [1, 7], the acquisition process of FPM involves illuminating the sample with plane waves from varying angles and capturing a sequence of images corresponding to these illuminations. This acquisition process can be modelled as a complex multiplication: the exit light wave from a thin sample , which is illuminated by oblique plane wave with a wavevector , can be written as. Here we define as the coordinate in the spatial domain and as the coordinate in the spatial frequency domain (Fourier domain). The light wave that propagates to the detector is the convolution of exit wave and the spatially invariant point spread function of the microscope system where the intensity is recorded, i.e. . In the Fourier domain:
| (1) |
where is the Fourier spectrum of the sample and is the pupil function of the image system.
The goal of the reconstruction algorithm is to recover the functions and that satisfy (1) for all n’s measured images. In cases when we have a precise estimation of the pupil function from the pre-characterized aberration behavior, an iterative phase retrieval algorithm can be used to find that satisfies Eq. (1) [1]. However, because the phase retrieval algorithm only renews the sample spectrum while keeping the pupil function unchanged, an imprecisely estimated pupil function will result in a poor recovery. Such inaccuracy in the pupil function estimation can be caused by the limited orders of aberration considered in pre-characterization process [3] or by mechanical or optical changes in the microscopy system.
A similar scenario occurs in conventional ptychography [8–10] as well. FPM and conventional ptychography differ in that in conventional ptychography, the probe illumination is spatially panned across the sample while the far field diffraction patterns are imaged and recorded. Traditional phase retrieval methods such as the ptychographic iterative engine (PIE) [11–13] rely on an accurate knowledge of the probe function to retrieve the object distribution, which might be inaccurately known due, for example, to the inaccurate or incomplete knowledge of features of the aperture (or focusing optics) that generates the illuminating beam [14].
To address this problem in conventional ptychography, Guizar-Sicairos and Fienup [15] introduced a gradient-descent-based non-linear optimization approach to jointly optimize the object and probe function. Thibault et al. [16, 17] solve for both the sample and the illuminating wavefront using a difference map iterative algorithm. Subsequently, Maiden and Rodenburg [18] extended the original PIE (ePIE) and demonstrated that this approach can lead to a much quicker rate of convergence and more robustness to noise compared to previous methods.
The work on ePIE [18–20] motivated us to examine the feasibility of applying such an integrated strategy for addressing system errors. In our case, these errors are the optical aberrations inherent in the imaging system. In this work, we develop the EPRY-FPM algorithm to address these errors by recovering both the Fourier spectrum of the sample and the pupil function of the imaging system simultaneously.
The flowchart of the EPRY-FPM algorithm is shown in Fig. 1. At the beginning, an initial guess of the pupil function and sample spectrum, labelled as and , are provided to start the algorithm. Generally, the initial pupil function guess is set as a circular shape low-pass filter, with all ones inside the pass band, zeros out of the pass band and uniform zero phase. The radius of the pass band is , where NA is the numerical aperture of the microscope objective and is the illumination wavelength. The Fourier transform of a frame of an up-sampled low-resolution image is taken as the initial sample spectrum guess. All the captured images are addressed in a sequence , n from 0 to N-1 (N is the number of captured images), and considered in turn, with both the pupil function and sample spectrum updated each loop.
Fig. 1.
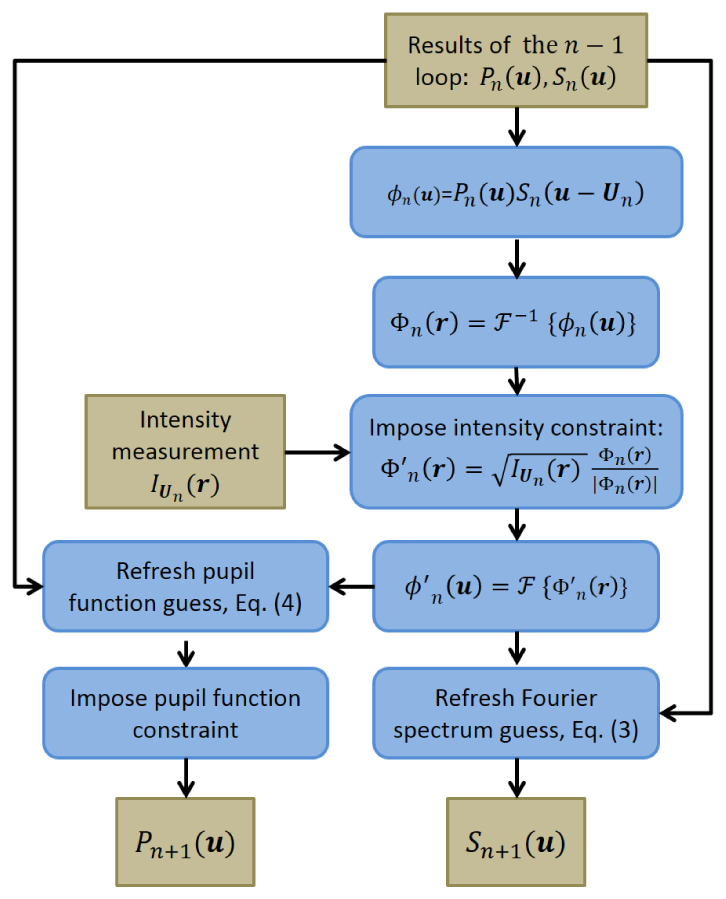
Flowchart of EPRY-FPM algorithm.
In the nth loop, with the knowledge of reconstructed and from the previous loop, the exit wave at the pupil plane while the sample is illuminated by wavevector can be simulated by the multiplication: , and the simulated image on the detector is the inverse Fourier transform of it:. Then the intensity constraint is applied: the modulus of the simulated image is replaced by the square-root of the real intensity measurement , which is captured with illumination wavevector , such that:
| (2) |
Next, an updated exit wave is calculated via a Fourier transform: , and the updated pupil function and sample spectrum is extracted from this result using two update functions, whose form is similar to the extraction function mentioned in [18]. The sample spectrum update function is given by:
| (3) |
This function is also used for updating the sample spectrum in the original FPM phase retrieval algorithm [1], in which case the pupil function remains unchanged throughout the iterative process. The correction of the sample spectrum is extracted from the difference of the two exit waves by dividing out the current pupil function, and this correction is added to the current sample spectrum guess with weight proportional to the intensity of the current pupil function estimate. The constant adjusts the step size of the update. In this paper, is used for the results.
The pupil update function takes the similar form:
| (4) |
In this function, the roles of the pupil function and sample spectrum function are reversed, while the basic principle remains the same. The constant adjusts the step size of the pupil function update and is used in this paper.
To suppress noise, a pupil function constraint is imposed on the updated pupil function. For a microscope system, a physical circular aperture stop is set to define the NA, thus the area in the pupil function that corresponds to the stop should always be zero. The non-zero points in the updated pupil function in the region corresponding to the stop are caused by the noise in image acquisition, and are set to zero to eliminate the noise. After that, we have updated pupil function and sample spectrum function .
This process continues until all the N captured images in the sequence are used to update the pupil and sample spectra, at which point a single iteration of EPRY-FPM is complete. Then the whole iterative process is repeated for more iterations to improve convergence toward the final pupil and sample spectra. Finally, the sample spectrum is inverse Fourier transformed back to the spatial domain, where we get a high resolution, modulus and phase distribution of the sample.
The extra computational cost of EPRY-FPM algorithm is tiny compared to the original FPM algorithm. Assuming that each captured low-resolution intensity image contains n raw pixels. For each loop, the exit wave simulation, inverse Fourier transform, intensity constraint and Fourier transform process has computational cost of n, nlog(n), n and nlog(n) respectively. The sample spectrum update, pupil function update and pupil function constraint has computational cost of 3n, 3n and n respectively. So the computational cost of the original FPM algorithm is 5n + 2nlog(n) for each loop, and the computational cost of the EPRY-FPM algorithm is 9n + 2nlog(n). Generally, the raw pixel count n is in the order of a million, so the incremental computational cost of 4n is ignorable compare to 2nlog(n).
3. Simulation results
To verify the effectiveness of the EPRY-FPM algorithm to separate the pupil function and sample distribution from the measurements, the original FPM phase retrieval algorithm used in [1] and the EPRY algorithm are run using a simulated FPM data set. Here we set the initial FPM pupil function guess as a flat function. We note that the FPM work reported in [1] actually used a pupil function estimate (with only the lowest 5 orders of Zernike polynomials accounting for the aberrated phase). The point of this current exercise is to compare FPM and EPRY-FPM performance in the total absence of prior aberration determination.
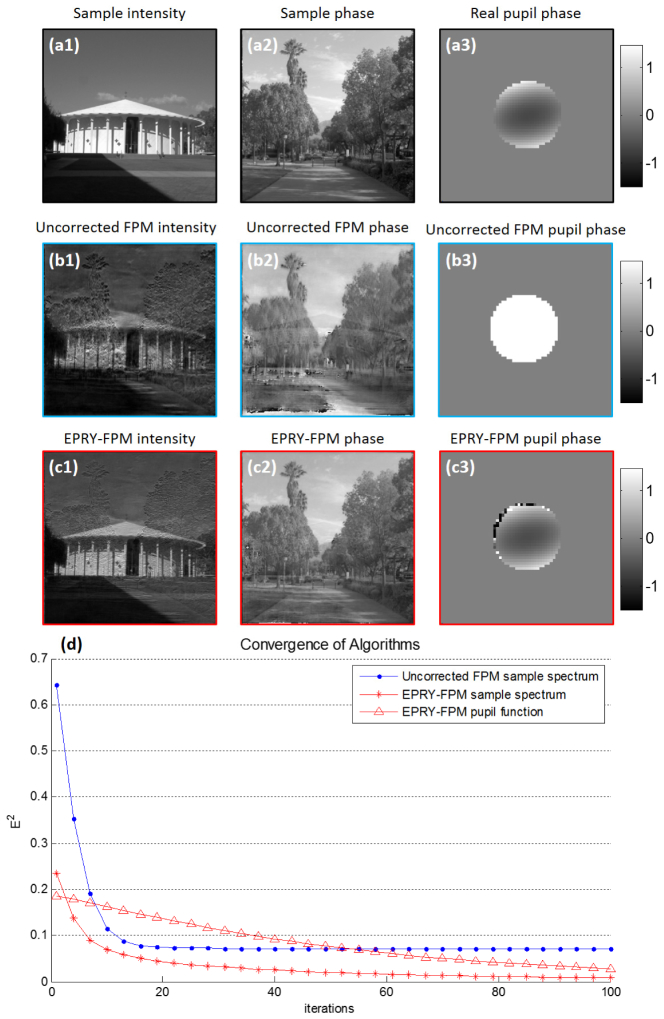
Two images, each containing 512*512 pixels with pixel size 0.2um, are used as the modulus and phase of the sample, as shown in Fig. 2(a1)-2(a2). The modulus is rescaled to 0-1 and phase is rescaled to –π to π. The simulated microscope system has a NA = 0.08 with wavefront aberration, resulting in a circularly shaped pupil function with a radius of 13 pixels and a pupil function phase as shown in Fig. 2(a3). A sequence of 225 images are simulated with different plane wave illuminations, with enough overlap in Fourier domain to assure convergence of the of the algorithm [1].
Fig. 2.
Sample for simulation and reconstruction results. (a1-a2) Sample modulus and phase used to generate simulated data set. (a3) Phase of the pupil function used to generate simulated data set, intensity of the pupil function is a circular shape low pass filter same size as the phase circle. (b1-b2) Reconstructed modulus and phase using the original uncorrected FPM algorithm. (b3) Initial guess of the pupil phase used in both uncorrected FPM and EPRY-FPM, the initial guess of the pupil intensity is a circular shape low pass filter same size as the phase circle. (c1-c2) Reconstructed modulus and phase using EPRY-FPM algorithm; the initial guess of the sample spectrum is the same as the one used in uncorrected FPM algorithm. (c3) Reconstructed pupil function phase, showing a similar distribution as (a3). (d) Plot of convergence of both algorithms using the normalized mean square error metric.
In both algorithms, the initial guess of the pupil function is set as a circular shape low-pass filter radius of 13 pixels with zero phase, and the first image in the sequence is up-sampled and Fourier transformed to serve as the initial guess of sample spectrum. Both algorithms were run for 100 iterations and the results are shown in Fig. 2(b1-b3) and 2(c1-c3). The reconstruction using the original uncorrected FPM is severely degraded. This is because the aberrated wavefront of the pupil function repeatedly influenced the low and high frequency components of the sample spectrum. In addition, there is a significant degree of crosstalk between the modulus and phase iages resulting from the lack of knowledge about the pupil function phase distribution. In comparison, the EPRY-FPM reconstruction is able to successfully separate the pupil function from the sample spectrum, resulting in an improved quality image and an accurate measurement of the real pupil function phase. Because the illuminations do not cover the entire Fourier spectrum of the sample, there exists a small amount of crosstalk in the modulus and phase image, and also, resulting in several phase-wrapped pixels in the reconstructed pupil function.
The convergence of both algorithms are also measured by calculating the normalized mean square error metric [21] in each iteration:
| (5) |
The parameter is given by:
| (6) |
This parameter allows the error metric to be invariant to a constant multiplication and a constant phase offset. Here is the true sample spectrum distribution and is the reconstructed sample spectrum distribution after m iterations. is calculated over the center 128 x 128 pixel area which have enough overlapping, and the results are shown in Fig. 2(d). For the reconstructed sample spectrum, EPRY-FPM algorithm has a significantly faster convergence rate compared to the uncorrected FPM algorithm, and ends up with an error of less than 0.01. Meanwhile, for the uncorrected FPM algorithm, the error stopped decreasing at 0.08 after 20 iterations, which is the limit imposed by the wavefront aberration in the real pupil function. The convergence of reconstructed pupil function using EPRY-FPM is also calculated using the same metric. As we can see in the plot, although it converges slower than the sample spectrum at the first few iterations, the final result has a small error of about 0.05.
4. Experimental results
We also implemented the algorithm on experimental data to demonstrate its performance. Our experimental setup consists of a conventional microscope with a 2X, NA = 0.08 objective, a CCD camera mounted on top, and a programmable color LED matrix as the light source. The setup is the same as the one reported in [1]. We used a Wright-Giemsa stained blood smear as a sample and we captured a sequence of 225 images using the center 15 by 15 red LEDs. We analyzed an area of 150um*150um from the sample, located at 35% to the edge from the center of the FOV of the imaging system, where the aberration is non-negligible. We ran both uncorrected FPM and EPRY-FPM algorithms on the data set from this area for 5 iterations through all 225 images. The initial guess of the pupil function was set as a circular shape low-pass filter, whose radius was determined by the NA, with zero phase, and the first image is up-sampled and Fourier transformed to serve as the initial guess of sample spectrum.
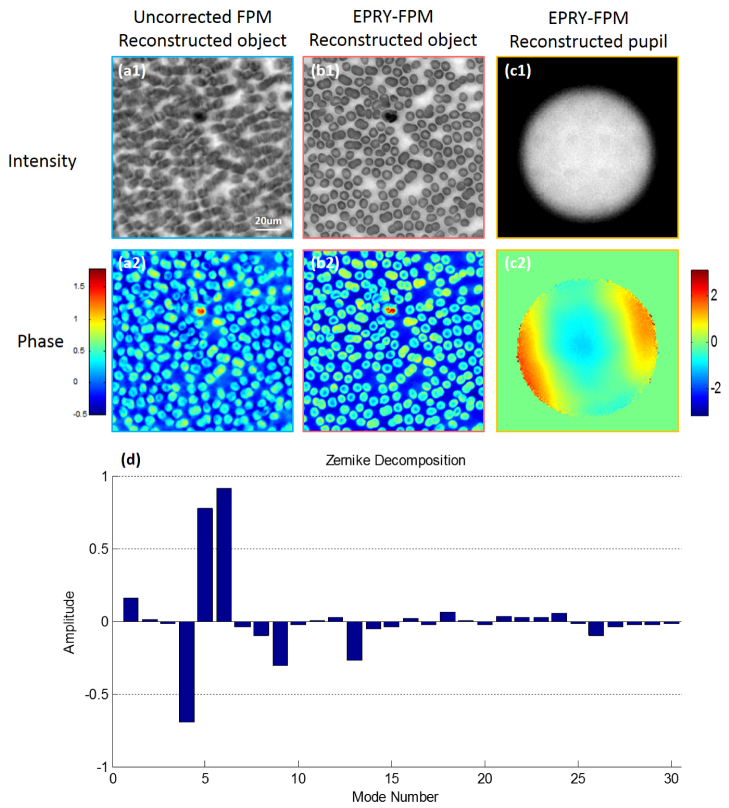
The results of both algorithms are shown in Fig. 3. Figure 3(a1) and 3(a2) shows the intensity and phase distribution of the blood smear using the uncorrected FPM algorithm. The image is blurry due to the very significant amount of objective aberration at that location in the FOV (the aberrations get progressively worse as we move away from the FOV’s center), the contour of the blood cells cannot be recognized clearly and it is hard to distinguish white blood cells from red blood cells. A high quality image can be achieved using the EPRY-FPM algorithm, as shown in Fig. 3(b1), 3(b2). The morphology of blood cells is clear, the zone of central pallor for the red blood cells is obvious, and the shape of the nucleus of the white blood cell is recognizable. From the phase image in Fig. 3(b2), we can also see the donut shape of the red blood cell. The pupil function for this FOV is also recovered using the EPRY-FPM algorithm and shown in Fig. 3(c1), 3(c2).
Fig. 3.
Reconstruction from uncorrected FPM and EPRY-FPM algorithms using FPM blood smear data set. The initial guess of the pupil function is a circular shape low pass filter with no phase, and the reconstructed region is located 35% from the center of the FOV. (a1-a2) Reconstructed sample intensity and phase using uncorrected FPM algorithm. (b1-b2) Reconstructed sample intensity and phase using EPRY-FPM algorithm. (c1-c2) Reconstructed pupil function modulus and phase using EPRY-FPM algorithm. (d) Zernike decomposition of pupil function phase, the amplitude of the lowest 30 modes (representing the 30 lowest order aberrations) are shown.
The recovered pupil function can be further studied to examine the properties of the lens system. For one example, the size and shape of the modulus of the pupil function reflects the shape and position of the physical aperture stop. In this case, the modulus part of the pupil function approximately remains the same as the initial guess, meaning that the numerical aperture is well defined by a circular shape aperture. We can also see that the pupil function that ought to be centered has a slight shift to the bottom right, which reflects an imprecise estimation of the wavevector caused by the shift of the LED matrix from its originally aligned position. Through the EPRY-FPM algorithm, this error is corrected.
As another example, we note that the phase of the pupil function represents the wavefront aberration [22]. If we do a decomposition of the pupil function phase component in Zernike polynomials [23], the coefficient of each Zernike polynomial represents the extent of aberration corresponding to this Zernike polynomial. In our case, the decomposition is executed and the coefficients of the first 30 Zernike polynomials are shown in Fig. 3(d). Different Zernike polynomials represent different types of aberration, from low order to high order according to the mode number. Mode number 1 represents the piston term, which will cause a constant phase shift to the entire aperture and is not considered as an aberration. The three dominant modes for the wavefront aberration are mode number 4, 5 and 6, which represent defocus aberration, astigmatism in the x direction and astigmatism in the y direction respectively. We can also see that coma aberration (mode 7 and 8) is not severe for this FOV but there are some higher order aberrations that are non-negligible for this position, such as mode 9 (trefoil) and mode 13.
5. EPRY-FPM for large FOV, high resolution image reconstruction
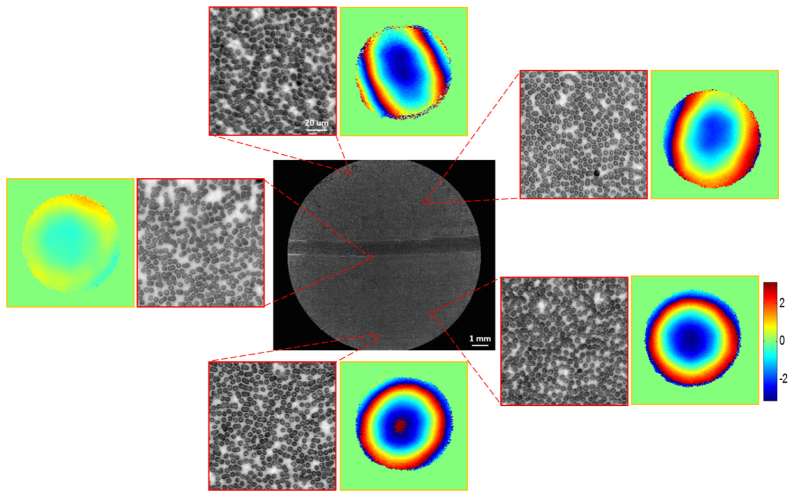
For a large FOV microscope system, the aberration and, by extension, pupil function can be expected to show spatial variations [3, 24]. To ensure the effectiveness of the EPRY-FPM algorithm, we segment the entire FOV into small tiles where in each tile the aberration can be considered as constant [1, 3]. For our FPM system with a 6mm radius FOV, the entire area is segmented into tiles sized 350um*350um, and the EPRY-FPM algorithm is run on the data set of each tile independently, using the aforementioned process. We take advantage of the fact that the pupil function varies continuously and use the reconstructed pupil function from the adjacent tile as the initial pupil function guess (instead of a flat phase initial guess) for the current tile to increase the convergence rate of the algorithm. All these reconstructed high resolution, aberration eliminated images are combined together to form a full FOV high resolution image, as shown in Fig. 4. The reconstructed sample image and wavefront aberration of five regions on the FOV are shown in Fig. 4, demonstrating the stable image quality from center to edge achieved by EPRY-FPM algorithm, despite the much more severe aberration at the edge compared to the center.
Fig. 4.
Full FOV high resolution monochrome image (red LED illumination) reconstruction of blood smear: the entire FOV is segmented into small tiles, and the aberration is treated as constant in each tile. EPRY-FPM algorithm is run on each tile and the reconstructed high resolution images are mosaicked together. The insets show the detail of the reconstructed image and also the wavefront aberration at those locations.
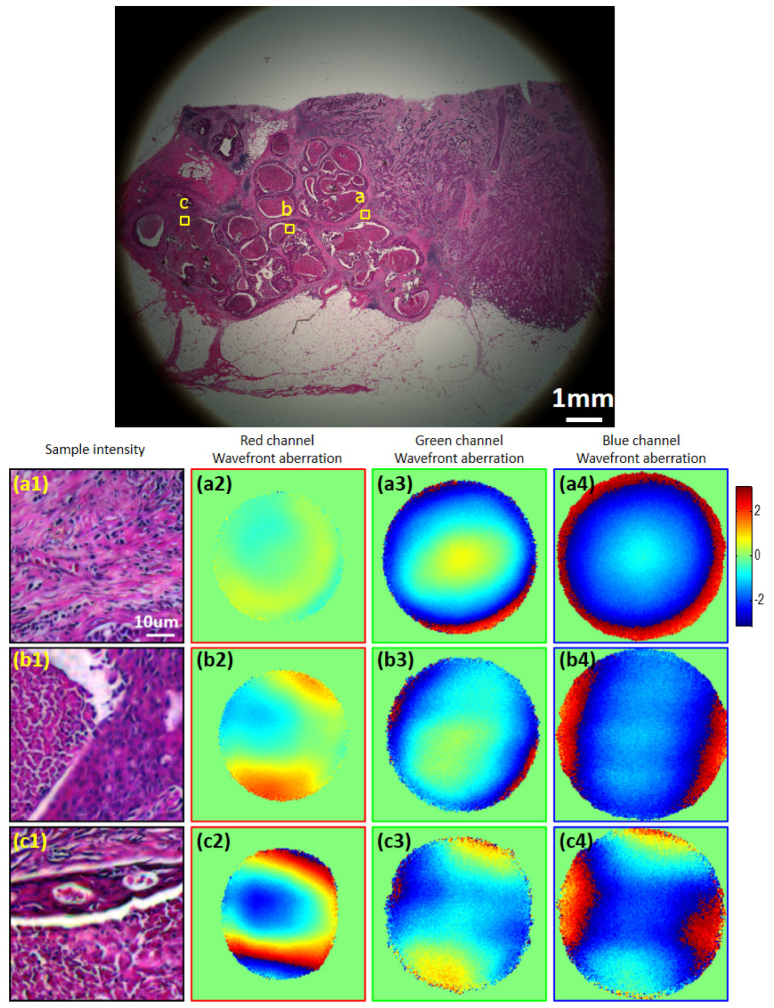
The same algorithm was also implemented to render a high resolution, large FOV color image of a pathology slide. The center 15x15 red, green and blue LEDs on the LED matrix are lit up individually and 3 sets of FPM data are captured. For each color channel, the same segmentation and reconstruction processes are executed as previously described. For each tile, because the pupil function which contains the defocus aberration is separated from the sample spectrum in EPRY-FPM reconstruction process, each color channel is focused at its best focal plane. In other words, the axial chromatic aberration, which is caused by different wavelengths focused at different planes, is correctable by EPRY-FPM. Before we combine red, green and blue channel images in the same tile together, green and blue images are slightly shifted spatially relative to the red channel to correct for lateral chromatic aberration. An automatic program is run to find the correct amount of shift which maximizes the correlation of the red-green image pair and red-blue image pair respectively. Finally, all the color tiles are mosaicked together and the result is shown in Fig. 5. Three regions are magnified and shown in Fig. 5(a1)-5(c1). The wavefront aberration on corresponding region for red, green and blue channels are also shown in the second (a2-c2), third (a3-c3) and fourth columns (a4-c4) of Fig. 5. We would like to point out that the different sizes of the circles between different color channels are caused by the different wavelengths. We further note that the shape of the pupil function changed from a circle to an ellipse significantly as we move towards the edge of the image. This is because the 2X objective we are using is not strictly a telecentric lens [25] and, as such, the aperture shape can be expected to change asymmetrically.
Fig. 5.
Full FOV high resolution color image reconstruction of pathology slide: each color channel are reconstructed using the same method described in Fig. 4, and three channels are combined to generate RGB image. (a1, b1, c1) reconstructed sample intensity of three regions in the FOV. (a2, b2, c2) reconstructed red channel wavefront aberration of the three regions. (a3, b3, c3) reconstructed green channel wavefront aberration of the three regions. (a4, b4, c4) reconstructed blue channel wavefront aberration of the three regions.
5. Comparison with original phase retrieval algorithm
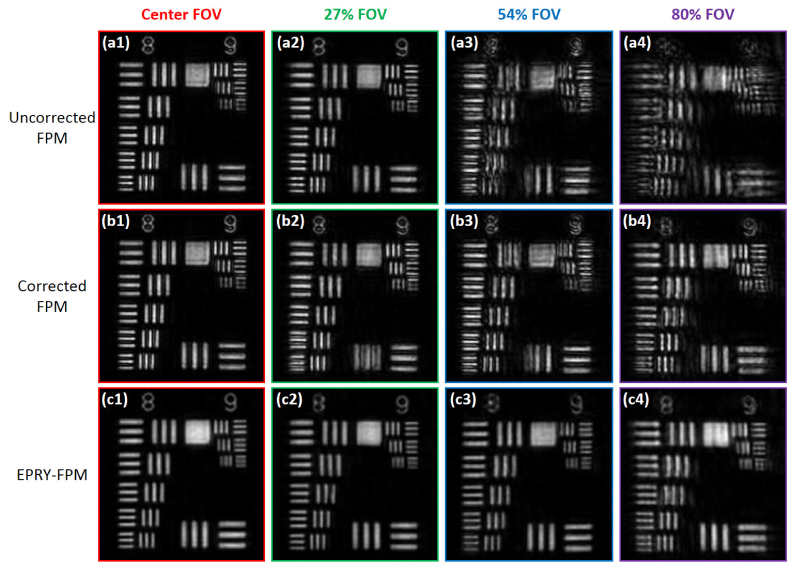
To quantify the improvement in image quality, we use a USAF target in the next set of experiments. The target is placed at 0%, 27%, 54% and 80% of the entire FOV from the center, and four sets of images are captured respectively using the red LED. Three methods are run on these four sets of images: 1) the original FPM algorithm without the knowledge of wavefront aberration (uncorrected FPM), 2) the original FPM algorithm with pre-characterized defocus and astigmatism aberration (corrected FPM) [3], 3) the EPRY-FPM algorithm without the knowledge of wavefront aberration. Group 8 and 9 of all the 12 reconstructed images are shown in Fig. 6.
Fig. 6.
Characterization of achievable resolution by three methods using USAF target: (a1-a4) Images at different FOV reconstructed by using uncorrected FPM method. (b1-b4) Images at different FOV reconstructed by using corrected FPM method. (c1-c4) Images at different FOV reconstructed by using EPRY-FPM method without pre-characterized aberration.
As we can see, the image quality is highly degraded by aberration for the 54% and 80% FOV locations (Fig. 6(a3), 6(a4)). After the correction of defocus and astigmatism aberration by method 2, the line on Group 9 (line width <1um) can be vaguely resolved (Fig. 6(b3), 6(b4)). Three reasons prevent further improvement of the image quality using method 2. First, a non-linear optimization algorithm [3] is used for the aberration pre-characterization process, so adding N more aberration variables for optimization means searching for the minimum point in an Nth order higher dimensional space, which will make the computational complexity 2N times that of the original 3 aberration optimization. Second, the image sets that are used for aberration characterization only contain low resolution images captured by the NA = 0.08 objective. The high order aberration information is easily overwhelmed by the noise of the imaging system, resulting in an imprecise measurement of the high order aberration. Third, the characterized high order aberration information can be volatile. This is because such aberration is highly sensitive to mechanical or optical system drifts. In conclusion, method 2 is impractical to correct higher order aberration.
However, by using the EPRY-FPM algorithm, the image quality is significantly improved. This is largely attributable to the fact that the EPRY-FPM considers and characterizes the entire pupil function rather than focusing on just the lower orders of wavefront aberration. As shown in Fig. 6(c3), 6(c4), group 9 element 3 can be resolved, resulting in a resolution of ~780um throughout the entire FOV. There are two primary reasons that the image quality at the edge is worse than the center: First, the synthesized Fourier spectrum domain is no longer symmetric for the edge region because the 15x15 LED for illumination are centered at the center point of the entire FOV. Second, because of the field distortion of the 2X objective, the pixel size on the sample plane is not the same from center to edge. The imprecise distance measurement from pixel count results in an imprecise estimation of wavevectors for the reconstruction of the edge FOV, which degrades the image quality.
6. Conclusion
In this paper, we described a new phase retrieval algorithm for FPM system called EPRY-FPM which can recover both the expanded sample spectrum and the pupil function of the imaging system by merely using the image set of the sample captured by FPM. The implementation of EPRY-FPM algorithm provided us with improvement of image quality, due to the fact that the entangled sample spectrum and pupil function are isolated from the captured image set during the recovery process. Moreover, the recovered pupil function which contains wavefront aberration information of the microscopy system can be further studied to characterize the behavior of the lenses. We illustrated the ability of the EPRY-FPM algorithm to cope with the spatially varying aberration of a large FOV image system, and reconstructed high resolution, large FOV monochrome and color images of biological samples using this algorithm. In the study of the recovered pupil function for the large FOV image system, we observed variation spatially and spectrally. From the elliptical shape of the pupil function at the edge of the FOV, we can also estimate the deviation of this objective lens from a telecentric lens. By imaging a standard USAF target and comparing the result with the original FPM algorithms, we showed that the EPRY-FPM algorithm is an automatic method which is less time consuming, generates higher quality images, and is more robust to the alignment drift of FPM system.
With the help of this algorithm, the FPM no longer requires the time-consuming and laborious acquisition of pupil characterization data. Besides its obvious advantage in simplicity of use, the development of EPRY-FPM also opens up the choice of optical systems we can adapt for FPM usage. Highly aberrated optical systems or systems without a well-defined physical aperture stop, which were previously precluded, can now be considered.
Finally, we would like to note that the EPRY-FPM method can also be potentially employed to characterize optical system aberrations for purposes beyond FPM. For example, it can be used to benchmark the quality of imaging systems for comparison purposes. Alternately, the recovered system aberration data can be used to design appropriate correction optics to improve a target system. We believe that this simple while elegant method can convert aberration characterization and correction from a formidable task which requires optical professionals, to a handy tool for researchers in all areas.
Acknowledgments
We thank Dr. Phil Willems, Mr. Roarke Horstmeyer and Mr. Jaebum Chung for discussions and help with experiments. We acknowledge funding support from the National Institutes of Health 1DP2OD007307-01 and Clearbridge Biophotonics (Singapore).
References and links
- 1.Zheng G., Horstmeyer R., Yang C., “Wide-field, high-resolution Fourier ptychographic microscopy,” Nat. Photonics 7(9), 739–745 (2013). 10.1038/nphoton.2013.187 [DOI] [PMC free article] [PubMed] [Google Scholar]
- 2.Lohmann A., Dorsch R., Mendlovic D., Zalevsky Z., Ferreira C., “Space-bandwidth product of optical signals and systems,” J. Opt. Soc. Am. A 13(3), 470–473 (1996). 10.1364/JOSAA.13.000470 [DOI] [Google Scholar]
- 3.Zheng G., Ou X., Horstmeyer R., Yang C., “Characterization of spatially varying aberrations for wide field-of-view microscopy,” Opt. Express 21(13), 15131–15143 (2013). 10.1364/OE.21.015131 [DOI] [PMC free article] [PubMed] [Google Scholar]
- 4.Nomura H., Sato T., “Techniques for measuring aberrations in lenses used in photolithography with printed patterns,” Appl. Opt. 38(13), 2800–2807 (1999). 10.1364/AO.38.002800 [DOI] [PubMed] [Google Scholar]
- 5.Wesner J., Heil J., Sure Th., “Reconstructing the pupil function of microscope objectives from the intensity PSF,” in Current Developments in Lens Design and Optical Engineering III, Fischer R. E., Smith W. J., Johnson R. B., eds., Proc. SPIE; 4767, 32–43 (2002). [Google Scholar]
- 6.Bian Z., Dong S., Zheng G., “Adaptive system correction for robust Fourier ptychographic imaging,” Opt. Express 21(26), 32400–32410 (2013). 10.1364/OE.21.032400 [DOI] [PubMed] [Google Scholar]
- 7.Ou X., Horstmeyer R., Yang C., Zheng G., “Quantitative phase imaging via Fourier ptychographic microscopy,” Opt. Lett. 38(22), 4845–4848 (2013). 10.1364/OL.38.004845 [DOI] [PMC free article] [PubMed] [Google Scholar]
- 8.Hoppe W., “Diffraction in inhomogeneous primary wave fields. 1. Principle of phase determination from electron diffraction interference,” Acta Crystallogr. A 25, 495–501 (1969). 10.1107/S0567739469001045 [DOI] [Google Scholar]
- 9.Rodenburg J., Bates R., “The theory of super-resolution electron microscopy via Wigner-distribution deconvolution,” Philos. Trans. R. Soc. Lond. A 339(1655), 521–553 (1992). 10.1098/rsta.1992.0050 [DOI] [Google Scholar]
- 10.Rodenburg J., “Ptychography and related diffractive imaging methods,” Adv. Imaging Electron Phys. 150, 87–184 (2008). 10.1016/S1076-5670(07)00003-1 [DOI] [Google Scholar]
- 11.Fienup J. R., “Phase retrieval algorithms: a comparison,” Appl. Opt. 21(15), 2758–2769 (1982). 10.1364/AO.21.002758 [DOI] [PubMed] [Google Scholar]
- 12.Rodenburg J. M., Faulkner H. M. L., “A phase retrieval algorithm for shifting illumination,” Appl. Phys. Lett. 85(20), 4795–4797 (2004). 10.1063/1.1823034 [DOI] [Google Scholar]
- 13.Hüe F., Rodenburg J., Maiden A., Sweeney F., Midgley P., “Wave-front phase retrieval in transmission electron microscopy via ptychography,” Phys. Rev. B 82(12), 121415 (2010). 10.1103/PhysRevB.82.121415 [DOI] [Google Scholar]
- 14.Faulkner H. M. L., Rodenburg J. M., “Error tolerance of an iterative phase retrieval algorithm for moveable illumination microscopy,” Ultramicroscopy 103(2), 153–164 (2005). 10.1016/j.ultramic.2004.11.006 [DOI] [PubMed] [Google Scholar]
- 15.Guizar-Sicairos M., Fienup J. R., “Phase retrieval with transverse translation diversity: a nonlinear optimization approach,” Opt. Express 16(10), 7264–7278 (2008). 10.1364/OE.16.007264 [DOI] [PubMed] [Google Scholar]
- 16.Thibault P., Dierolf M., Menzel A., Bunk O., David C., Pfeiffer F., “High-resolution scanning x-ray diffraction microscopy,” Science 321(5887), 379–382 (2008). 10.1126/science.1158573 [DOI] [PubMed] [Google Scholar]
- 17.Thibault P., Dierolf M., Bunk O., Menzel A., Pfeiffer F., “Probe retrieval in ptychographic coherent diffractive imaging,” Ultramicroscopy 109(4), 338–343 (2009). 10.1016/j.ultramic.2008.12.011 [DOI] [PubMed] [Google Scholar]
- 18.Maiden A. M., Rodenburg J. M., “An improved ptychographical phase retrieval algorithm for diffractive imaging,” Ultramicroscopy 109(10), 1256–1262 (2009). 10.1016/j.ultramic.2009.05.012 [DOI] [PubMed] [Google Scholar]
- 19.Maiden A., Rodenburg J., Humphry M., “A new method of high resolution, quantitative phase scanning microscopy,” in:Postek M.T., Newbury D.E., Platek S.F., Joy D.C. (Eds.), SPIE Proceedings of Scanning Microscopy, 7729, 2010 10.1117/12.853339 [DOI] [Google Scholar]
- 20.Marrison J., Räty L., Marriott P., O’Toole P., “Ptychography--a label free, high-contrast imaging technique for live cells using quantitative phase information,” Sci. Rep. 3, 2369 (2013). 10.1038/srep02369 [DOI] [PMC free article] [PubMed] [Google Scholar]
- 21.Fienup J. R., “Invariant error metrics for image reconstruction,” Appl. Opt. 36(32), 8352–8357 (1997). 10.1364/AO.36.008352 [DOI] [PubMed] [Google Scholar]
- 22.Goodman J. W., Introduction to Fourier Optics (Roberts and Company Publishers, 2005). [Google Scholar]
- 23.Mahajan V. N., “Zernike circle polynomials and optical aberrations of systems with circular pupils,” Appl. Opt. 33(34), 8121–8124 (1994). 10.1364/AO.33.008121 [DOI] [PubMed] [Google Scholar]
- 24.Zheng G., Ou X., Yang C., “0.5 gigapixel microscopy using a flatbed scanner,” Biomed. Opt. Express 5(1), 1–8 (2014). 10.1364/BOE.5.000001 [DOI] [PMC free article] [PubMed] [Google Scholar]
- 25.Watanabe M., Nayar S. K., “Telecentric optics for focus analysis,” IEEE Trans. Pattern Anal. Mach. Intell. 19(12), 1360–1365 (1997). 10.1109/34.643894 [DOI] [Google Scholar]


