Abstract
Understanding the response of cells to multiple stimuli is vital for predicting donor specific responses and better understanding the signaling pathways involved. This is of particular importance in platelets because exposure of phosphatidylserine (PS) occurs upon costimulation but not with a single agonist. Here, we describe a multiplexed pairwise agonist scanning flow cytometry (PAS-FC) method of measuring platelet inside-out responses to all pairs of six platelet agonists (convulxin, SFLLRN, AYPGKF, ADP, U46619, and PGE2) used at their EC50 concentrations. These agonists allowed exploration of platelet signaling downstream of GPVI, PAR-1, PAR-4, P2Y1, P2Y12, TP, and IP receptors. The three-color flow cytometry method simultaneously measured integrin αIIbβ3 activation with PAC-1 antibody, P-selectin exposure (via α granule release) with anti-P-selectin, and PS exposure with annexin V. These responses were consistent across a healthy male donor pool. In duplicate measurements with each donor, 4 of the 10 donors had a sufficiently unique 45-parameter (15 pairs × 3 colors) phenotype to self-cluster (P < 0.001). This method has the potential for efficiently scanning for patient specific responses across a broad agonist-receptor space.
Keywords: flow cytometry, platelets, patient-specific
Cells are subject to numerous dose dependent agonist signals at a given time in a biological system, resulting in a complex integrated response. In many instances, signaling pathways use common second messengers that may result in synergistic or antagonistic effects that could not be predicted from study of the agonists in isolation (1). Platelets respond to multiple signals in vivo in a donor specific manner to halt blood loss (2), a process which is also central to the thrombotic risks associated with the 2 million heart attacks and strokes that kill 800,000 people each year in the United States alone (3). Platelets are an ideal cell type for studying the effects of multiple signaling pathways because they are anucleate, easily obtained from donors, and their responses can be used to make donor specific predictions about thrombosis (4).
In vivo, a platelet can encounter numerous different activating and inhibitory signals at the same time, and the integrated response to all of these determines the prothrombotic state of the platelet. In a thrombotic event, the first signal encountered is often activation of glycoprotein VI (GPVI) ITAM tyrosine kinase signaling upon binding collagen in the exposed sub-endothelial matrix (5). This occurs during platelet rolling, enabled by GPIb-IX-V binding collagen or vWF, which gives the platelet time for the GPVI signal to induce calcium mobilization that activates αIIbβ3 and α2β1 integrins to firmly adhere the platelet to the site of injury (6). In addition to activation of adhesion molecules, ADP is released from the dense granules early during the activation process and signals via platelet P2 receptors in an autocrine and paracrine fashion (7). After activation dependent synthesis by cyclooxygenase 1 (COX1), thromboxane A2 (TXA2) is also released and binds platelets in the lumen and at the site of injury (8). Somewhat independent of the platelets, tissue factor (TF) exposed at the site of the injury initiates the extrinsic pathway of the coagulation cascade leading to the production of thrombin, which very strongly activates platelets through the PAR receptors. In addition to these and other minor activating signals, the endothelium constitutively releases prostacyclin (PGI2) and nitric oxide (NO) as inhibitory signals to platelet activation.
Platelets can encounter each of these signals at varying doses during the thrombotic process and combinations of four or more simultaneously would be common in the core of a growing thrombus in vivo. However, most in vitro studies of these signaling pathways are done in isolation. The effects of thrombin (9), ADP (10), and collagen (11) are known in great detail, but the previous studies do not address the conditions of the non-isotropic environment of a thrombus with many signaling molecules (12). To investigate the effects of simultaneous addition of agonist pairs, we have extended the previous Ca2+ assay that found donor specificity in platelet cytosolic calcium levels to utilize flow cytometry (2). Since integrin activation, degranulation, and phosphatidylserine (PS) exposure are all activation markers downstream of the cytosolic calcium, they may also exhibit donor specificity. Binding of the IgM antibody PAC-1 was used to measure the degree of integrin activation as it only binds the active form of the integrin αIIbβ3 (13). Secretion was measured using an IgG antibody against P-selectin (CD62P), which is exposed on the platelet surface when α granules fuse with the plasma membrane. This is not a direct measure of dense granule secretion, but dense granules release before α granules (14), so it is indicative of release of both types. Finally, the exposure of PS to serve as a catalytic surface for the coagulation cascade on the plasma membrane outer leaflet was measured by binding of annexin V (15). These three measures of platelet activation give a fuller representation of platelet behavior upon multiple agonist activation.
Materials and methods
Platelet Preparation
Whole blood was drawn from healthy male volunteers, according to the University of Pennsylvania Institutional Review Board guidelines with informed consent, into Phe-Pro-Arg-chloromethylketone (PPACK; Haematologic Technologies, Essex Junction, VT) with a final anticoagulant concentration of 100 μM. All donors affirmed not taking any medication for 10 days prior to donation and not consuming alcohol for 3 days prior to donation. The whole blood samples were centrifuged at 120× g for 10 min to obtain platelet rich plasma (PRP), which was diluted to 10% v/v in HEPES buffered saline (HBS; 20 mM HEPES, 140 mM NaCl, and 2.5 mM CaCl2 at pH 7.4). Calcium was added to the buffer to facilitate proper formation and activation of the αIIbβ3 integrin as well as binding of annexin V to exposed PS.
Agonist Selection
The agonists in this assay were chosen as representative of the major signaling cues a platelet will encounter during a thrombotic event. They are also the same agonists used in the calcium assay previously developed by our lab to allow for direct comparison of results (2). Convulxin (CVX; Centerchem, Norwalk, CT) is a rattlesnake venom protein that directly binds and activates glycoprotein VI (GPVI), the primary collagen signaling receptor on platelets (16). This is used because soluble monomeric collagen only binds to the integrin α2α1, which is an adhesive receptor and has little direct effect on signaling (17), and fibrillar collagen is not soluble, making it unsuitable for use in flow cytometry (18). Thrombin acts on the two Gq coupled protease activated receptors (PARs) in humans, PAR1 and PAR4, which signal differentially (19, 20). As such, we used the individual PAR agonist peptides, SFLLRN and AYPGKF (Bachem, King of Prussia, PA), to investigate PAR1 and PAR4 signaling individually. This also removes the need for inhibitors of fibrin polymerization such as Gly-Pro-Arg-Pro, which would be required in the presence of thrombin to maintain sample viscosity. The use of U46619 (Sigma-Aldrich, St. Louis, MO) in place of the physiological thromboxane A2 (TXA2) was required due to the short (~30 s) half-life of TXA2 in solution (21). Similarly, prostacyclin is a very short-lived molecule, so the more chemically stable prostaglandin E2 (PGE2; Sigma-Aldrich, St. Louis, MO) was chosen. In both cases, the more stable analog signals through the same receptor as the physiological ligand (8, 22). The only physiologic agonist that could be directly utilized in this assay was adenosine diphosphate (ADP; Sigma-Aldrich, St. Louis, MO).
96 well plate preparation
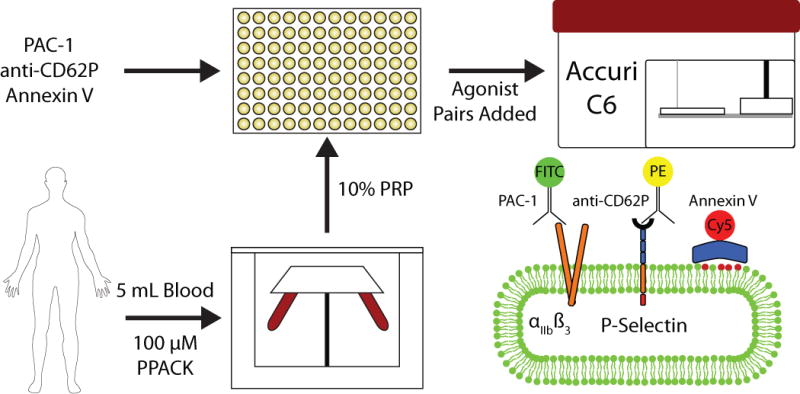
Each sample well of a white, flat-bottomed 96 well plate (Corning, Corning, NY) was loaded with 10 μL 10% v/v PRP, as well as 2 μL each FITC PAC-1, PE anti-CD62P (AK-4 clone), and Cy5 annexin V (BD Biosciences, San Jose, CA) as shown in Figure 1. In addition, 64 μL HBS was added to wells that would receive a pair of agonists, while 74 μL was added to wells for single agonist controls. Ten minutes prior to flow cytometry analysis, 10 μL of a 10× stock of the appropriate agonist was added, giving a final volume of 100 μL in each well. This gives a final concentration of 1% v/v PRP, which eliminates autocrine and paracrine signaling that could affect responses in a platelet concentration dependent manner (23).
Figure 1. Schematic of pairwise agonists canning flow cytometry assay.

Blood drawn from healthy male donors was centrifuged to isolate platelet rich plasma, which was diluted to 10% v/v and added to a 96 well plate loaded with antibodies. Ten minutes prior to analysis, 10× stocks of agonists were added. PAC-1 measures integrin αIIbβ3 activation, anti CD62P measures degranulation via P-selectin exposure, and annexin V binds exposed phosphatidylserine (PS; red head group phospholipids).
Flow Cytometry
This assay utilized an Accuri C6 flow cytometer with CSampler (BD Biosciences, San Jose, CA) to automate well plate handling. The sample flow rate was set to low (14 μL/min with a 10 μm core), and samples were analyzed for 60 s following 10 min of incubation with agonist(s). The time required for movement of the C Samplerarm and suction of each sample into the flow cytometer meant it was possible to analyze one sample every two minutes. Compensation was set such that 7.5% of FL1 was subtracted from FL2 and 4.0% FL2 from FL1 to account for emission spectra overlap between FITC and PE.
Results and discussion
Determining the dynamic range of each agonist
In order to determine the concentration range over which each of the six agonists affects integrin activation, degranulation, and PS exposure, each one was tested individually. No single agonist led to significant PS exposure, so EC50s could not be calculated for that response. Sigmoidal dose-response curves were constructed based on the mean fluorescence of PAC-1 and anti-CD62P binding at each dose. The inhibitory effects of PGE2 were studied by simultaneous stimulation with 15 μM SFLLRN. This allowed us to define an EC50 for each agonist for both integrin activation and degranulation (Table 1). Addition of U46619 did not elicit an increase in either signal, but it does exhibit signaling in the pairwise conditions. The EC50 concentrations of each agonist calculated for PAC-1 and anti-CD62P binding are within a factor of three of those seen in the previous calcium assay (2). Therefore, we chose to use the concentrations from the calcium assay so that data from both assays would be directly comparable.
Table 1.
Comparison of agonist EC50 values for different measures of platelet activation
| Measure of activation | Convulxin | SFLLRN | AYPGKF | ADP | U46619 | PGE2 |
|---|---|---|---|---|---|---|
| Cytosolic Ca2+ | 5.3 nM | 15.2 μM | 112.4 μM | 1.17 μM | 1.19 μM | 24.6 μM |
| PAC-1 | 1.6 nM | 4.4 μM | 267 μM | 595 nM | n/a | 11.5 μM |
| anti-CD62P | 2.4 nM | 6.6 μM | 223 μM | 371 nM | n/a | 49.4 μM |
Calculated EC50 values for platelet activation measured by binding of PAC-1 and anti-CD62P antibodies to ntegrin αIIbβ3 and P-selectin respectively and cytosolic Ca2+ values that were obtained previously. Platelet rich plasma was incubated with each of the five activating agonists, while PGE2 was coincubated with 15 μM SFLLRN. U46619 did not elicit significant antibody binding.
Pairwise agonist combinations and donor specificity
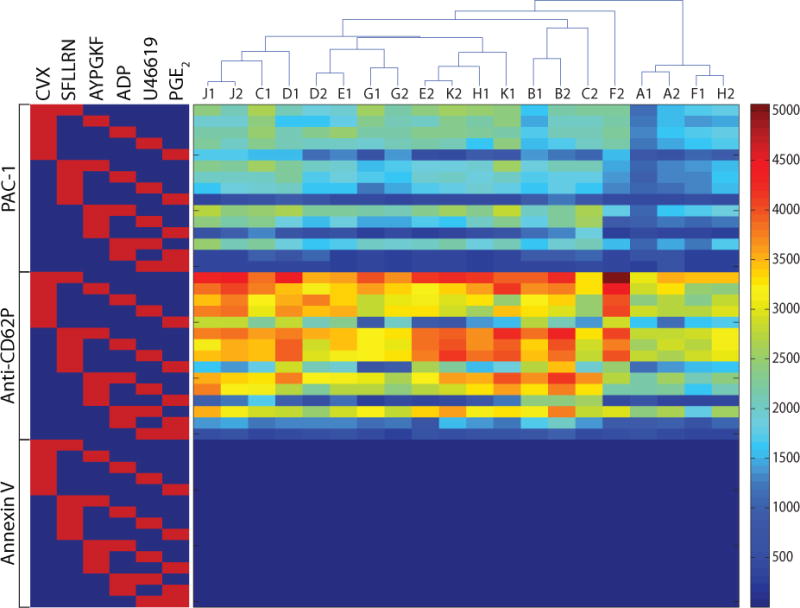
Each of the 15 pairwise combinations of the 6 agonists at their EC50 concentrations was tested. For each sample, the mean fluorescence of PAC-1 and anti-CD62P binding was determined, as well as the percentage of PS exposing platelets. To determine whether the donor specificity seen in the pairwise calcium responses was maintained through the signaling cascades to integrin activation, degranulation, and PS exposure, PAS-FC was carried out on blood draws no more than 2 weeks apart for each of 10 healthy male donors. The 45 data points from each experiment (15 agonist pairs × 3 colors for αIIbβ3 activation, P-selectin display, and PS exposure) were converted into a vector that became a column in the pairwise response matrix (Figure 2). Donor specificity was determined by generating a hierarchical cluster tree based on the Euclidean distance between each possible pair of vectors as calculated by the linkage function in MATLAB. Of the 10 donors, 4 exhibited self-clustering, where their 2 vectors clustered together, indicating the possibility of donor specificity. To determine the significance of 4 out of 10 donors self-clustering, groups of 10 hypothetical donors were constructed by randomly choosing values from the 10 original donors for each of the 45 data points. Simulating 10 million such groups showed that 4 self-clustering donors is highly significant (P < 0.001), and no groups with 8 or more self-clustering donors ever occurred.
Figure 2. Clustering of donor pairwise activation responses.

The matrix shows the 45 responses for each donor’s pair of experiments. The clustering tree above the matrix shows that 4 of 10 donors had results that were able to self-cluster. On the left, red squares indicate the pair of agonists used in that row and brackets indicate the fluorescent probe.
Donor similarity
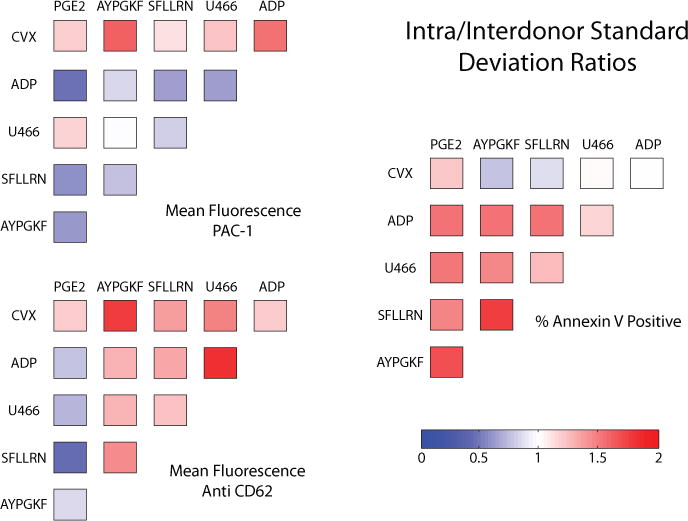
Given that this cohort is less diverse in genetic ancestry than the one used for the calcium assay (seven Europeans, one Indian, and two Asians here versus three Europeans, two Asians, two Indians, one Caribbean, one African American, and one African), less donor self-clustering may be a result of donor similarity. To examine this, we calculated the mean of the 10 donor standard deviations (intradonor variation) as well as the standard deviation of the mean value for each donor (interdonor variation) for each of the 45 data points. The ratio of intradonor variation divided by the interdonor variation is shown in Figure 3, where red indicates that variation within the repeats of a donor was larger than variation across donors, while blue indicates variation across the cohort was more significant. For 17 of the 30 PAC-1 or anti-CD62P binding data points, the intradonor variation was dominant, which makes it difficult to reliably distinguish donors and contributes to the low self-clustering. Some self-clustering is achieved, however, because of the relative donor specificity of PS exposure, anti-CD62P binding in the presence of PG E2, and PAC-1 binding in the absence of convulxin. The annexin V positive data for non-CVX conditions can be ignored as there is no PS exposure.
Figure 3. Comparison of variation within a donor to variation across donors.

The mean of the standard deviations from each donor’s 2 experiments is divided by the standard deviation for the mean value of each donor for all 45 data points. Some conditions vary more for a single donor (red) while others vary more across the cohort (blue).
In addition to the genetics of the donors, the range of the experimental space that was explored may contribute to the reduced self-clustering of this assay compared with the previous calcium based assay. Time constraints limited study to only pairwise combinations at EC50 concentrations, as completion of the 135 combinations of a pairwise scan at 0.1, 1, and 10× EC50 would take 4.5 h to complete. Platelets removed from the body, as well as the agonists, lose reactivity over that amount of time, and fixation is not possible because it artificially induces PS exposure and diminishes PAC-1 binding (24). Given this limited experimental space and our cohort of genetically similar, healthy donors, 4 of 10 self-clustering is likely a typical level of patient specificity that can be achieved currently. Increasing the number of experiments per donor to four or six may increase specificity, but the largest gains to be made are in expanding the concentrations of agonists tested. Testing multiple concentrations of each agonist would provide information about donor-specific sensitivity and maximum response that would allow this assay to provide a more complete picture of platelet activation.
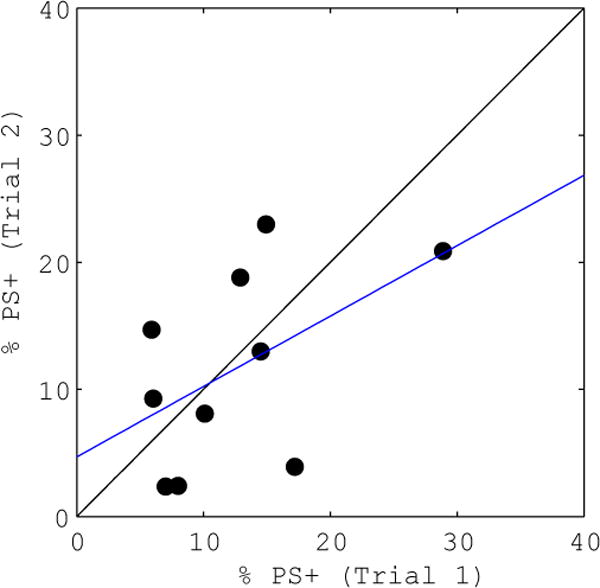
In order to further investigate donor specificity, the percentage of cells exposing PS in response to convulxin and SFLLRN costimulation for each donor’s two samples was compared (Figure 4). This response shows correlation between samples (R2 = 0.2577), and a wide range of values are seen. This is consistent with previously reported donor specificity of maximal PS exposure between 20%–70% upon treatment with convulxin and thrombin (25). Such high values are not achieved in this assay due to lower agonist concentrations, but the variable potential for PS exposure among donors is still evident. Expansion of the experimental space to include higher agonist concentrations would provide valuable patient-specific information about maximal responses in PS exposure as well as integrin activation and degranulation, but this requires a flow cytometer that can collect and measure samples more quickly.
Figure 4. CVX-SFLLRN induced phosphatidylserine (PS) exposure correlation.

The percentage of cells exposing PS in each donor’s first sample (abscissa) is compared with the percentage measured in the second sample (ordinate) for the addition of convulxin and SFLLRN. The linear regression (blue line) shows correlation between trials (R2 = 0.2577).
There is potential for improvement of this assay, which already gives a wealth of data about the effects of multiple simultaneous signals and significant donor specificity. Currently, there are some flow cytometers that are capable of analyzing a full 384-well plate in 15 min. Design of such a machine that also has the necessary liquid handling capabilities to add agonists at well-defined times before analysis would make full pairwise agonist scanning in flow cytometry possible. At such a point, the ability to test all 135 pairwise conditions for integrin activation, degranulation, PS exposure, and possibly even more measures of activation could provide a tremendous amount of donor specific information that could be utilized in models of thrombosis (4). Any response for which a fluorescently labeled probe exists can easily replace or be added to the three in this assay with the inclusion of a sufficient amount to measure the full dynamic range of the agonists. The number of responses that can be measured simultaneously is limited only by the ability of the flow cytometer to record their emission spectra.
Acknowledgments
This study was supported by NIH R01 HL-103419 to S.L.D. This paper is subject to the NIH Public Access Policy.
Footnotes
Competing Interests
The authors declare no competing interests.
References
- 1.Bhalla US, Iyengar R. Emergent Properties of Networks of Biological Signaling Pathways. Science. 1999;283:381–387. doi: 10.1126/science.283.5400.381. [DOI] [PubMed] [Google Scholar]
- 2.Chatterjee MS, Purvis JE, Brass LF, Diamond SL. Pairwise agonist scanning predicts cellular signaling responses to combinatorial stimuli. Nat Biotechnol. 2010;28:727–732. doi: 10.1038/nbt.1642. [DOI] [PMC free article] [PubMed] [Google Scholar]
- 3.Frieden TR, Berwick DM. The “Million Hearts” Initiative – preventing heart attacks and strokes. N Engl J Med. 2011;365:e27. doi: 10.1056/NEJMp1110421. [DOI] [PubMed] [Google Scholar]
- 4.Flamm MH, Colace TV, Chatterjee MS, Jing H, Zhou S, Jaeger D, Brass LF, Sinno T, Diamond SL. Multiscale prediction of patient-specific platelet function under flow. Blood. 2012;120:190–198. doi: 10.1182/blood-2011-10-388140. [DOI] [PMC free article] [PubMed] [Google Scholar]
- 5.Varga-Szabo D, Braun A, Nieswandt B. Calcium signaling in platelets. J Thromb Haemost. 2009;7:1057–1066. doi: 10.1111/j.1538-7836.2009.03455.x. [DOI] [PubMed] [Google Scholar]
- 6.Jackson SP, Mistry N, Yuan Y. Platelets and the Injured Vessel Wall – “Rolling into Action. Trends Cardiovasc Med. 2000;10:192–197. doi: 10.1016/s1050-1738(00)00062-1. [DOI] [PubMed] [Google Scholar]
- 7.Clemetson KJ, Clemetson JM. In: Platelet receptors, 117–143. Michelson AD, editor. Elsevier; Waltham, MA: 2007. Platelets Second Edition. [Google Scholar]
- 8.Breyer RM, Bagdassarian CK, Myers SA, Breyer MD. Prostanoid Receptors: Subtypes and Signaling. Annu Rev Pharmacol Toxicol. 2001;41:661–690. doi: 10.1146/annurev.pharmtox.41.1.661. [DOI] [PubMed] [Google Scholar]
- 9.Wilson DB, Neufeld EJ, Majerus PW. Phosphoinositide interconversion in thrombin-stimulated human platelets. J Biol Chem. 1985;260:1046–1051. [PubMed] [Google Scholar]
- 10.Daniel JL, Dangelmaier C, Jin J, Ashby B, Smith JB, Kunapuli SP. Molecular Basis for ADP-induced Platelet Activation I. evidence for three distinct ADP receptors on human platelets. J Biol Chem. 1998;273:2024–2029. doi: 10.1074/jbc.273.4.2024. [DOI] [PubMed] [Google Scholar]
- 11.Roberts DE, McNicol A, Bose R. Mechanism of collagen activation in human platelets. J Biol Chem. 2004;279:19421–19430. doi: 10.1074/jbc.M308864200. [DOI] [PubMed] [Google Scholar]
- 12.Furie B, Furie BC. In vivo thrombus formation. J Thromb Haemost. 2007;5:12–17. doi: 10.1111/j.1538-7836.2007.02482.x. [DOI] [PubMed] [Google Scholar]
- 13.Bennett JS, Shattil SJ, Power JW, Gartner TK. Interaction of Fibrinogen with Its Platelet Receptor differential effects of α and γ chain fibrinogen peptides on the glycoprotein IIb-IIIa complex. J Biol Chem. 1988;263:12948–12953. [PubMed] [Google Scholar]
- 14.Rendu F, Brohard-Bohn B. The platelet release reaction: granules’ constituents, secretion and functions. Platelets. 2001;12:261–273. doi: 10.1080/09537100120068170. [DOI] [PubMed] [Google Scholar]
- 15.Bevers EM, Comfurius P, Zwaal RF. Changes in membrane phospholipid distribution during platelet activation. Biochim Biophys Acta. 1983;736:57–66. doi: 10.1016/0005-2736(83)90169-4. [DOI] [PubMed] [Google Scholar]
- 16.Polgár J, Clemetson JM, Kehrel BE, Wiedemann J, Magnenat EM, Wells TNC, Clemetson KJ. Platelet activation and signal transduction by convulxin, a c-type lectin from Crotalus durissus terrificus (tropical rattlesnake) venom via the p62/GPVI collagen receptor. J Biol Chem. 1997;272:13576–13583. doi: 10.1074/jbc.272.21.13576. [DOI] [PubMed] [Google Scholar]
- 17.Knight CG, Morton LF, Olney DJ, Peachy AR, Ichinohe T, Okuma M, Farndale RW, Barnes MJ. Collagen-platelet interaction: Gly-Pro-Hyp is uniquely specific for platelet Gp VI and mediates platelet activation by collagen. Cardiovasc Res. 1999;41:450–457. doi: 10.1016/s0008-6363(98)00306-x. [DOI] [PubMed] [Google Scholar]
- 18.Hers I, Berlange O, Tiekstra MJ, Kamiguti AS, Theakston RDG, Watson SP. Evidence against a direct role of the integrin α2β1 in collagen-induced tyrosine phosphorylation in human platelets. Eur J Biochem. 2000;267:2088–2097. doi: 10.1046/j.1432-1327.2000.01214.x. [DOI] [PubMed] [Google Scholar]
- 19.Covic L, Gresser AL, Kuliopulos A. Biphasic kinetics of activation and signaling for PAR1 and PAR4 thrombin receptors in platelets. Biochemistry. 2000;39:5458–5467. doi: 10.1021/bi9927078. [DOI] [PubMed] [Google Scholar]
- 20.Shapiro MJ, Weiss EJ, Faruqi TR, Coughlin SR. Protease-activated receptors 1 and 4 are shut off with distinct kinetics after activation by thrombin. J Biol Chem. 2000;275:25216–25221. doi: 10.1074/jbc.M004589200. [DOI] [PubMed] [Google Scholar]
- 21.Moncada S, Vane JR. Unstable metabolites of arachidonic acid and their role in haemostasis and thrombosis. Br Med Bull. 1978;34:129–135. doi: 10.1093/oxfordjournals.bmb.a071482. [DOI] [PubMed] [Google Scholar]
- 22.Liel N, Mais DE, Halushka PV. Binding of a thromboxane A2/prostaglandin H2 agonist [3H]U46619 to washed human platelets. Prostaglandins. 1987;33:789–797. doi: 10.1016/0090-6980(87)90107-9. [DOI] [PubMed] [Google Scholar]
- 23.Fogelson AL, Wang NT. Platelet dense-granule centralization and the persistence of ADP secretion. Am J Physiol. 1996;270:H1131–H1140. doi: 10.1152/ajpheart.1996.270.3.H1131. [DOI] [PubMed] [Google Scholar]
- 24.Wong K, Li X, Ma Y. Paraform-aldehyde induces elevation of intracellular calcium and phosphatidylserine externalization in platelets. Thromb Res. 2006;117:537–542. doi: 10.1016/j.thromres.2005.04.030. [DOI] [PubMed] [Google Scholar]
- 25.Dale GL. Coated-platelets: anemerging component of the procoagulant response. J Thromb Haemost. 2005;3:2185–2192. doi: 10.1111/j.1538-7836.2005.01274.x. [DOI] [PubMed] [Google Scholar]


