

Abstract
Background
Assays used for discovery of biomarkers should be robust and high-throughput, capable of analyzing a sufficiently large number of samples over a sufficiently long period of time with good precision.
Methods
We evaluated the analytical performance of the Bio-Plex Pro™ Human Cancer Biomarker Panel 1, a 16-plex multiplex immunoassay, in serum for composite profiling of angiogenic factors. Because prostate cancer progression and metastasis are pathological events closely linked to angiogenesis, serum angiogenic factors are ideal candidates as prognostic biomarkers.
Results
Our 5-day evaluation indicated that all 16 assays in the panel had good reproducibility (total precisions over 5 independent plates in 5 days of <20%), adequate sensitivity (LOQs of majority of the assays less than 100 pg/ml), and wide dynamic ranges (linearity of majority of the assays spanning across 3 logs in concentrations).
Conclusions
Applying the panel to sera from prostate cancer patients with Gleason scores of 6, 7, 8–10, tumor stages that correlated with clinical outcome, we identified that the levels of sTIE-2, a soluble form of the transmembrane tyrosine kinase receptor for angiopoietins, were increased in patients with Gleason score of 8–10. Future studies are necessary to determine whether sTIE-2 could be used as a prognostic biomarker for identifying aggressive prostate cancer.
Keywords: Multiplex, Immunoassay, Serum angiogenic factors, Aggressive prostate cancer
1. Introduction
Prostate cancer is currently the most common cancer in American men. There were an estimated 240,890 new cases of prostate cancer per year [1]. The fact that only 33,720 of them died of prostate cancers annually suggests that majority of the cancers does not progress [2]. Thus, development of accurate prognostic markers to identify patients with aggressive prostate cancers who need to be aggressively treated is urgently needed.
A prognostic biomarker should possess a clear biological significance. Prostate cancer progression and metastasis are pathological events closely linked to angiogenesis, the formation of new blood vessels from the pre-existing ones [3–6]. This neovascularization process supplies oxygen and nutrients to tumor outgrowth, and contributes to tumor progression from in situ lesions to locally invasive, and eventually to metastatic tumors. In prostate cancer, intensity of angiogenesis, measured as microvessel density (MVD), was found to be higher when compared to benign glands [4,5]. Furthermore, angiogenesis was found to be increased in the primary tumors of patients with metastasis compared to patients with localized disease [3].
The tumor angiogenic process is controlled by pro- and antiangiogenic factors released from tumor cells, tumor-associated inflammatory cells, and/or from the extracellular matrix. Mechanistically driven by tumor progression, these factors may be present in serum, reflecting the overall angiogenic activity of the tumors. Tumor progression and patient survival in many cancers, including malignant melanoma [7], end-stage epithelial ovarian cancer [8], and pancreatic cancer [9], have been correlated with serum angiogenic factors. As a result, serum angiogenic factors are ideal candidates as prognostic biomarkers in prostate cancer.
Assays used for the discovery of biomarkers should be robust and high-throughput, capable of analyzing a sufficiently large number of samples over a sufficiently long period of time with good precision. Poor precision not only increases the required sample size for discovery, but also hinders the true revelation of differential expression of biomarkers in the case and control populations [10]. In this study, we discovered prognostic biomarkers for aggressive prostate cancer by composite profiling of serum angiogenic factors using the Bio-Plex Pro™ Human Cancer Biomarker Panel 1, a 16-plex multiplex immunoassay. This multiplex approach conserved specimen, limited sample handling, increased throughput, and reduced labor costs. We evaluated the analytical performance of the panel, including limit of quantification, linearity, and precisions. After the analytical evaluation, we applied the panel to assess the potentials of the 16 angiogenic factors for identifying aggressive prostate cancer in serum.
2. Materials and methods
2.1. Samples and reagents
The 37 serum specimens analyzed in this study were from men with prostate cancer. All men had a prostate biopsy. Blood was collected before radical prostatectomy and sera stored frozen at −70 °C before analysis. Informed consent was obtained under institutional review board approved and Health Insurance Portability and Accountability Act compliant protocols. Human pooled serum was from Sigma. Samples were assayed with the Bio-Plex Pro™ Human Cancer Biomarker Panel 1, 16-plex kit (171-AC500M) from BioRad Inc.
2.2. Procedures for performing the assays
The Bio-Plex Pro™ Human Cancer Biomarker Panel 1 includes 16 magnetic bead-based assays to measure sEGFR, FGF-basic, Osteopontin, PDGF-AB/BB, Follistatin, G-CSF, PECAM-1, Prolactin, sHer-2/neu, HGF, SCF, sTIE-2, sIL-6Ra, Leptin, sVEGFR-1, and sVEGFR-2. Each kit contains standard diluent HB, sample diluent HB, assay buffer, wash buffer, detection antibody diluent, streptavidin–phycoethythrin (SA–PE), 96-well flat bottom assay plate, coupled magnetic beads (20×), detection antibody (20×), standard (in a vial), quality control high and low (in vials). The reagents in the kit were warmed at the room temperature for 30 min before use. To prepare the standard and quality control high and low, 781and 250 μl of standard diluent HB were used to reconstitute the standard and quality controls, respectively, followed by vortex for 5 s and incubation on ice for 30 min. Meanwhile, the Tecan Evo 150 liquid handling system was used to perform 4-fold dilution of samples in sample diluent HB. Calibrators were prepared by 4-fold serial dilution of the reconstituted standard using the standard diluent.
To perform the assays, the coupled magnetic beads (20×) were vortexed for 30 s before they were diluted 20 times in the assay buffer. Since the coupled magnetic beads have internal fluorescence, they should be protected from light. Each well of the 96-well flat bottom plate was added 50 μl of the diluted magnetic beads. The plate was then washed by the Bio-Plex Pro II Wash Station using the MAGX2 function. After the wash, 50 μl of diluted sample or calibrator was added to each well. The plate was then covered with aluminum seal and incubated for 60 min at the room temperature on a horizontal orbital microplate shaker. The same setting for shaking was used throughout the analytical validation. Meanwhile, the Bio-Plex 200 system, which is used to read the fluorescence of magnetic beads for protein quantification, was turned on, warmed up, and calibrated using the Bio-Plex Calibration Kit.
After the 60-minute incubation, the plate was then washed by the Bio-Plex Pro II Wash Station using the MAGX3 function. During the wash, the detection antibody solution (1×) was prepared by diluting 145 μl of the 20× detection antibody into 2755 μl of detection Ab diluent. After the wash, 25 μl of the detection antibody solution was added to each well. The plate was then covered with aluminum seal and incubated for 30 min at the room temperature.
After the 30-min incubation, the plate was then washed the same way as before. During the wash, the SA–PE solution (1×) was prepared by diluting 60 μl of the 100× SA–PE into 5940 μl of the assay buffer. After the wash, 50 μl of the diluted SA–PE solution was added to each well. The plate was then covered with aluminum seal and incubated for 10 min at the room temperature.
The plate was then washed the same way as before. Each well of the plate was added 125 μl of the assay buffer. The plate was then put onto the shaker for 1 min before being analyzed by the Bio-Plex 200 system. The system read the beads from each well and analyzed the internal fluorescence of the beads and the external fluorescence of SA–PE. The template setup in the Bio-Plex Manager™ 6.0 system for analyzing the plate contained the information that linked the internal fluorescence of beads to analytes. The external fluorescence of SA–PE was used for protein quantification.
2.3. Precisions
Precisions were evaluated by analyses of the quality control (QC) samples in triplicates once per day for five days, based on the Clinical Laboratory Standards Institute (CLSI) guideline EP5-A2. A total of 9 levels of QC (QC1 to QC9) were prepared. QC1, the highest QC, was made by adding 325 μl of the pooled serum (Sigma S7023, Lot#041M8729) to each standard vial, and six such vials were then combined as QC1. QC1 was then 3-fold serial diluted by the pooled serum to make QC2 to QC 7. QC8 was the neat pooled serum. QC9 was a serum specimen identified (by Bio-Rad Laboratories) with the appropriate concentrations that serve as the lowest QCs for Follistatin, G-CSF, PECAM-1, and sTIE-2. The QC sample set was aliquoted and stored in −80 °C freezer. Before analysis, they were 4-fold diluted in the sample diluent.
2.4. Linearity and limit of quantification (LOQ)
For evaluation of LOQ, 8 samples (L1 to L8) were prepared by 4-fold serial dilution of QC1 with the standard diluent. Aliquoted and stored in a −80 °C freezer, the LOQ samples were analyzed once per day for five days. Before analysis, they were 4-fold diluted in the standard diluent.
2.5. Data analysis
Calibration curves were established by fitting the expected concentrations of the 16 angiogenic factors in 8 calibrators into the 5-parameter nonlinear regression model. Observed concentrations of the 16 angiogenic factors in the calibrators, QC, linearity, and patient samples were calculated and reported in Bio-Plex Manager™ 6.0. The analytical measurement ranges of the calibration curves were determined by the recovery of the analytes, where the ratio of the observed concentrations to the expected concentrations was within 70–130%. The lower and upper limit of quantifications (LLOQ and ULOQ) of the calibration curves, which defined the analytical measurement ranges, were the lowest and highest calibrators that met the acceptability criteria. The ESD (extreme studentized deviate) method was used to determine outliers. Once outliers were identified, they were excluded from data analysis. Total, within-run, and between-run precisions were calculated based on the CLSI guideline EP5-A2. Linearity was determined by the recovery of the analytes to be within 80–100%. LOQ, defined as the lowest concentration at which the assays have a CV of 20%, was evaluated by the EP Evaluator software (David G. Rhoads Associates, Inc., PA). Mann–Whitney unpaired t-test was performed in GraphPad Prism® Version 5.04.
3. Results and discussion
Multiplex immunoassays, developed either in-house or by commercial vendors, have been widely used for biomarker discovery and validation. For commercially available assays, information on analytical performance from the manufacturer is a useful reference point, but assay performance in the hands of customers may be different. Variations in the procedures, such as incubation times and washing conditions, affect reproducibility of the assays. The materials used by the manufacturer to establish the analytical performance may have different matrices than specimens the customers intend to use. Analytical performance (e.g., precision and accuracy) of these assays affects not only the number of samples that should be used in biomarker discovery and validation, but also the significance of observed differences in expression of biomarkers in the studied populations. Because of these considerations, we evaluated the analytical performance of Bio-Plex Pro™ Human Cancer Biomarker Panel 1 over 5 days in serum. We established standard operating procedures (SOPs) and strictly followed them to achieve consistent reproducibility. After the analytical evaluation, we applied the panel to profile serum angiogenic factors in prostate cancer patients to discover prognostic biomarkers for aggressive prostate cancer.
3.1. BioRad quality controls
BioRad has established the expected ranges for their low and high quality controls (QC) that come with the kits. The observed values of the low and high controls for all the analytes fell into the expected control ranges, except in a few cases for sVEGFR-1, the soluble form of the Vascular Endothelial Growth Factor Receptor-1 (Supplementary Table 1). On days 2 and 3, the observed values for the low controls were 562.3 and 559.6 pg/ml, respectively, which fell outside the expected range of 232–541 pg/ml. On day 5, the observed value for the high control 7951.5 pg/ml fell outside the expected range of 3087–7203 pg/ml. In the case where a control supplied with the assay kit falls outside of the expected range, it is up to the user to determine final acceptability criteria for the analyte. We determined that the QCs for sVEGFR-1 were within the ranges we established (425–607 pg/ml for the low control and 3375–9337 pg/ml for the high control) using Mean±2 standard deviation (SD).
3.2. Stability of calibration curves
Stability of the calibration curves was evaluated by the total precision of the observed concentrations for calibrators over 5 days (Supplementary Table 2). Calibrators S7 and S8 had the observed concentrations below the LOQs of the assays, and therefore, were excluded from the stability analyses. For all the assays, except for FGF-basic (basic Fibroblast Growth Factor), all the other 6 calibrators (S1 to S6) were included in the evaluation. FGF-basic had only 4 calibrators (S3 to S6) included, since the recovery of calibrators S1 and S2 was outside the recovery range of 70–130%. The total precisions for all the calibrators evaluated were less than 10%, indicating good stability of the calibration curves.
3.3. Precisions
Although 9 levels of QCs were prepared and analyzed for each analyte, precisions were only reported for 3 levels in Table 1, because not all the levels of QCs had the concentrations relevant to those of sera. For example, the 9 levels of QCs for G-CSF (Granulocyte Colony-Stimulating Factor) ranged from 71.4 to 8871.6 pg/ml; the range of G-CSF in human sera, however, was less than 200 pg/ml. As a result, QC5, QC6, and QC9 of 195.2, 121.8, and 76.5 pg/ml G-CSF, respectively, were selected for evaluation of precisions for G-CSF. Within-run (n=3), between-run (n=5), and total precisions (n=15) at 3 QC levels for all 16 analytes were summarized in Table 1. Optimized multiplex assays for research purpose should have total precisions less than 20% [11]. All the analytes in this panel, except Follistatin, met this requirement. Follistatin, at the level of 198.1 pg/ml, had a total precision of 22.9%. For clinical use, total precisions should be less than 10%. Eleven out of 16 assays met the criterion of total precisions less than 10%. For Follistatin, G-CSF, sTIE-2, and sVEGFR-1, the lowest level of QC had a total precision of 22.9%, 15.1%, 12.9%, and 19.5%, respectively. For Osteopontin, the highest level of QC had a total precision of 11.8%. Evidenced by our 5-day study, the majority of assays in this 16-plex panel showed good reproducibility in serum.
Table 1.
Within-run (n=3), between-run (n=5), and total precisions (n=15) at 3 QC levels for all 16 assays in the Bio-Plex Pro™ Human Cancer Biomarker Panel 1.
| Mean (pg/ml) | Within-run precision (%CV) | Between-run precision (%CV) | Total precision (%CV) | |
|---|---|---|---|---|
| sEGFR | 79,914.2 | 5.3 | 5.1 | 6.0 |
| 43,910.1 | 5.4 | 7.4 | 8.1 | |
| 28,622.5 | 6.1 | 5.5 | 6.5 | |
| FGF-basic | 445.8 | 3.1 | 4.9 | 5.2 |
| 226.9 | 5.9 | 5.4 | 6.4 | |
| 114.7 | 5.4 | 7.4 | 8.0 | |
| Follistatin | 1018.0 | 4.6 | 6.4 | 6.9 |
| 580.8 | 4.8 | 6.3 | 6.9 | |
| 198.1 | 14.5 | 21.3 | 22.9 | |
| G-CSF | 195.2 | 6.5 | 8.0 | 8.9 |
| 121.8 | 6.0 | 9.3 | 9.9 | |
| 76.5 | 4.8 | 14.8 | 15.1 | |
| sHEr-2/neu | 32,597.4 | 6.9 | 6.1 | 7.3 |
| 15,617.1 | 6.0 | 6.9 | 7.7 | |
| 8401.1 | 5.9 | 6.4 | 7.2 | |
| HGF | 6113.0 | 3.9 | 3.8 | 4.4 |
| 1461.3 | 3.8 | 5.8 | 6.2 | |
| 822.8 | 3.2 | 9.5 | 9.7 | |
| sIL-6Ra | 29,326.0 | 4.6 | 6.4 | 6.9 |
| 22,480.6 | 5.7 | 6.2 | 7.0 | |
| 18,928.2 | 7.3 | 9.2 | 10.1 | |
| Leptin | 48,749.7 | 6.0 | 9.5 | 10.1 |
| 9347.4 | 3.6 | 7.5 | 7.8 | |
| 7528.4 | 4.6 | 7.3 | 7.8 | |
| Osteopontin | 174,401.2 | 9.5 | 10.5 | 11.8 |
| 80,906.8 | 3.9 | 7.8 | 8.1 | |
| 29,199.7 | 4.0 | 8.4 | 8.7 | |
| PDGF-AB/BB | 16,406.1 | 6.2 | 9.5 | 10.1 |
| 6722.5 | 4.0 | 5.3 | 5.7 | |
| 1999.9 | 5.3 | 5.0 | 5.8 | |
| PECAM-1 | 33,682.2 | 3.3 | 3.5 | 4.0 |
| 12,710.6 | 2.9 | 4.3 | 4.6 | |
| 6154.4 | 4.6 | 5.5 | 6.1 | |
| Prolactin | 18,389.1 | 2.9 | 5.4 | 5.6 |
| 10,170.4 | 5.5 | 4.4 | 5.4 | |
| 6550.0 | 5.3 | 4.4 | 5.4 | |
| SCF | 900.3 | 2.9 | 8.1 | 8.3 |
| 469.7 | 3.3 | 6.1 | 6.4 | |
| 245.3 | 3.5 | 3.5 | 4.1 | |
| sTIE-2 | 59,457.9 | 3.4 | 4.6 | 5.0 |
| 15,308.3 | 3.6 | 6.0 | 6.4 | |
| 6542.7 | 2.7 | 12.9 | 12.9 | |
| sVEGFR-1 | 741.2 | 3.2 | 6.7 | 6.9 |
| 353.6 | 7.1 | 8.0 | 9.0 | |
| 147.8 | 12.2 | 18.2 | 19.5 | |
| sVEGFR-2 | 18,585.7 | 3.0 | 3.9 | 4.3 |
| 11,152.4 | 3.5 | 3.7 | 4.2 | |
| 8151.5 | 5.7 | 6.3 | 7.1 |
3.4. LOQ
The LOQs for the 16 assays in the BioRad Human Cancer Biomarker Panel 1, calculated as the lowest concentrations at which the assays demonstrated a total precision of 20%, were summarized in Table 2. For Leptin, PECAM-1 (Platelet/Endothelial Cell Adhesion Molecule-1), and SCF (Stem Cell Factor), the LOQs were not numerical numbers, but ranges, because the assays had total precisions less than 20% for all the concentrations evaluated, even for the lowest concentration (total precisions were 14.3%, 11.0%, and 12.1%, respectively). Therefore, the LOQs for Leptin, PECAM-1, and SCF were below the lowest concentrations evaluated, 31.5, 204.9, and 10.9 pg/ml, respectively.
Table 2.
LOQ and linearity of all the 16 assays in the Bio-Plex Pro™ Human Cancer Biomarker Panel 1.
| LOQ (pg/ml) | Linearity (pg/ml)a | Extended linearityb | |
|---|---|---|---|
| sEGFR | Less than 265.0 | 28,622.5–46,014.5 | 265.0–46,014.5 |
| FGF-basic | Less than 31.2 | 120.9–28,665.1 | 31.2–28,665.1 |
| Follistatin | 26.1 | 352.2–43,590.0 | 26.1–43,590.0 |
| G-CSF | 55.8 | 81.3–8892.7 | 55.8–8892.7 |
| sHEr-2/neu | 18.6 | 8401.1–32,597.4 | 18.6–32,597.4 |
| HGF | 28.0 | 822.8–53,654.5 | 28.0–53,654.5 |
| sIL-6Ra | 13.5 | 18,928.2–29,326.0 | 13.5–29,326.0 |
| Leptin | Less than 31.5 | 7528.4–119,075.8 | 31.5–119,075.8 |
| Osteopontin | 682.8 | 29,199.7–174,401.2 | 682.8–174,401.2 |
| PDGF-AB/BB | 41.9 | 1999.9–42,765.8 | 41.9–42,765.8 |
| PECAM-1 | Less than 204.9 | 9264.5–207,700.2 | 204.9–207,700.2 |
| Prolactin | 499.7 | 6550.0–293,875.7 | 499.7–293,875.7 |
| SCF | Less than 10.9 | 245.3–56,324.1 | 10.9–56,324.1 |
| sTIE-2 | 356.0 | 10,036.9–155,632.3 | 356.0–155,632.3 |
| sVEGFR-1 | 154.5 | 147.7–15,591.4 | 154.5–15,591.4 |
| sVEGFR-2 | 121.6 | 8151.5–135,750.2 | 121.6–135,750.2 |
Linearity was established using the QC samples.
Extended linearity was established by extending the linearity using the LOQ samples.
3.5. Linearity
Using the QC samples, we established that all the assays were linear in serum. The linearity ranges for these assays were summarized in Table 2. All the assays, except sEGFR, the soluble form of the epidermal growth factor receptor, were linear from QC8 (the lowest concentration) to QC1 (the highest concentration). sEGFR is linear up to QC3, because QC2 had a recovery of 128.0%, outside the recovery acceptability of 80–120% (Supplementary Table 3). The advantage of using the QC samples for evaluation of linearity was that all the QC samples had the same matrix as serum, excluding the possibility of matrix effect to be the culprit of non-linearity.
For proper evaluation of the assays' lower end of the linearity, QC8 may not be suitable. QC8, a serum sample without removing any of the endogenous analytes, contains analytes of interest whose concentrations may be above the lower ends of linearity. This problem can be solved by using the LOQ samples, which were prepared by proportional mixing QC1 and the standard diluent that contains no analytes of interest. Using the LOQ samples, we established that all the assays, except sVEGFR-1, were linear down to the concentrations close to or at the levels of the LOQs (Table 2). For sVEGFR-1, the assay was determined using the QC samples to be linear down to the 147.7 pg/ml, close to the LOQ level.
3.6. Matrix effects
QC1 was diluted in the sample diluent prior to analysis; whereas the LOQ samples, prepared from QC1, were diluted in standard diluent. In order to evaluate matrix difference in diluents, we determined the recovery of the LOQ samples, calculated as the ratio of measured concentrations to calculated concentrations (Supplementary Table 4). The calculated concentrations for LOQ samples were derived from the measured concentrations of QC1. If the recovery was close to 100%, it indicated that assays were not affected by the matrix difference in diluents. Seven assays, Follistatin, HGF (hepatocyte growth factor), sIL-6Ra, the soluble form of Interleukin-6 Receptor a, PDGF-AB/BB (platelet-derived growth factor-AB/BB), PECAM-1, Prolactin, and SCF, were not affected by matrix difference in diluents; whereas the other nine assays were. Specifically, the recovery of L2 to L9 for these analytes was all higher than the ideal recovery of 100%. This indicated that Bio-Plex sample diluent, which was used for dilution of QC1, helped eliminate false positive interference in human serum. Bio-Rad recommended diluting serum and plasma samples 4-fold in Bio-Plex sample diluent and reconstituting/diluting the supplied calibrators (standards) in Bio-Plex standard diluent. When prepared as such, both samples and standards have a matched serum content of 25% in the assay.
3.7. Expression of the 16 serum angiogenic factors in prostate cancer patients
Panel 1 includes 16 serum angiogenic factors associated with prostate cancer in three different ways. First, they are soluble receptors of the angiogenic factors that have well-established roles in prostate cancer, such as VEGF, TIE-2, IL-6 and Her-2/neu. VEGF and receptors and angiopoietins and their receptor TIE-2 are the most important systems involved in angiogenesis. VEGF expression in prostate cancer has been shown to correlate with tumor stage, grade and clinical outcome [12–15]. Inhibition of angiopeiotein-2 has been shown to impede angiogenesis and growth of LuCap23.1 prostate cancer xenografts, indicating the role of angiopeotiein-2 in prostate cancer progression and metastasis [16]. IL-6 was associated with advanced stage and metastasis-related morbidity in prostate cancer [17]. Serum IL-6 levels in patients with metastatic disease were higher than those in patients with localized disease and were predictors of biochemical recurrence in localized diseases [18]. In prostate cancer, Her2/neu was over-expressed in 25–40% and 60–80% of cases of localized and metastatic cancer, respectively [19–22]. Serum levels of Her-2/neu were used to predict biochemical recurrence-free survival in prostate cancer patients about to undergo endocrine therapy [23].
Although Panel 1 measures the soluble receptors of these angiogenic factors, evidence exists that the levels of soluble receptor correlate with clinical parameters. One example is the soluble ErbB1 receptor (sErbB1), which has been shown to correlate with tumor stage in epithelial ovarian cancer [24]. Another example is the soluble urokinase plasminogen activator receptor (suPAR) which can predict survival of patients with colorectal cancer [25]. Indeed, the detection of soluble receptor IL-6 improved a preoperative nomogram for predicting biochemical progression in patients with clinical localized prostate cancer [26].
Second, they have well-established roles in prostate cancer progression, such as FGF-basic and HGF. FGF-basic was a potent angiogenic factor and promoter of tumor angiogenesis [15,27]. As demonstrated in human prostate cancer cell lines and TRAMP mouse model, FGF-basic played important roles in prostate cancer progression [28,29]. Hepatocyte growth factor (HGF) was implicated in the progression and metastasis of prostate cancer through its receptor c-Met [30]. Men with metastatic prostate cancer have significantly higher serum level of HGF than men with localized prostate cancer and those without prostate cancer [31]. Lastly, they have less well-characterized roles in prostate cancer, but well-established roles in tumor angiogenesis, such as PDGF, and Osteopontin. PDGF-A and PDGF receptors were expressed by epithelial and stromal cells in prostatic intraepithelial neoplasia [32]. In addition, the human prostate cancer cell lines DU145 and PC-3 express PDGF [33], and PDGF stimulated human prostate stromal cell proliferation in vitro [34]. Thus, PDGF may promote reactive stroma in the prostate. The possible role of osteopontin in prostate cancer progression was exemplified through inhibition of the growth of human prostate cancer cell lines LNCaP and C4-2 in vitro by antibodies to human osteopontin [35].
Because of the implications of the angiogenic factors in prostate cancer, the Bio-Rad Human Cancer Biomarker Panel 1 was applied to analyze 37 serum samples from prostate cancer patients. Overall, the measurements were within reportable assay limits, confirming that the sample dilution factor of 4 was appropriate for all the analytes in serum. Expression of 16 markers in patients with GS=6, GS=7, and GS 8–10 is shown in Fig. 1. Because it had been shown that Gleason score less than 7, Gleason score 7, and Gleason score greater than 7 correlated significantly with the outcome of prostate cancer after radical prostatectomy [36,37], in our study, we correlated the biomarker concentrations with Gleason scores.
Fig. 1.
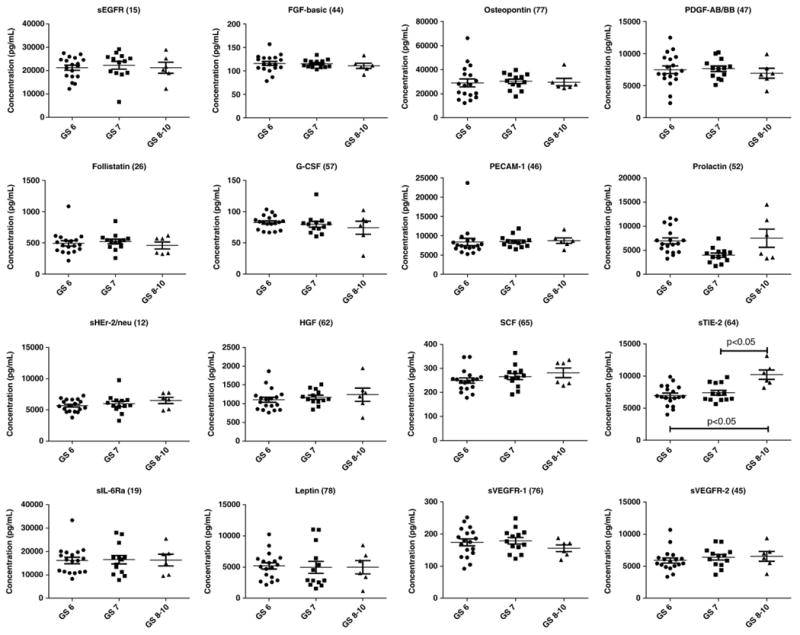
Expression of 16 serum angiogenic factors in prostate cancer patients with Gleason scores of 6, 7, and 8–10.
Median analysis of the expression of these markers in relation to the GS indicated that 7 markers (sHEr-2/neu, HGF, sIL-6-Ra, PECAM-1, SCF, sTIE-2, and sVEGFR-2) showed increasing expression with increasing Gleason score. However, none of the trends was statistically significant except for sTIE-2. In patients with GS 8–10, the levels of sTIE-2 were significantly increased compared to the patients with GS=6 or GS=7 or the combination of GS=6 and GS=7 (p<0.05). The levels of sTIE-2 between patients with GS=6 (n=18) and GS=7 (n=13) were not significantly different, although the median for GS=7 group was higher (7183 pg/ml vs. 6761 pg/ml). Opposite to sTIE-2, the levels of sVEGFR-1 were decreased in GS8-10 group, although the difference was not statistically significantly. sTIE-2, a soluble form of the angiopoietin receptor TIE-2, is generated by a shedding mechanism in which the transmembrane receptor is proteolytically cleaved leading to the release of the extracellular domain. sVEGFR-1, the soluble form of VEGFR-1, is generated by a different mechanism, the alternative splicing of a single gene. sVEGFR-1 levels were suppressed and sTie-2 receptor levels were raised in colorectal cancer patients [38], consistent with our result. This indicates that by combining these 2 biomarkers sTIE-2 and sVEGFR-1 (e.g., in a multiplex biomarker panel), we may be able to identify patients with GS 8–10 with better sensitivity and specificity than using sTIE-2 alone.
4. Conclusions
We evaluated the analytical performance of the Bio-Plex Pro™ Human Cancer Biomarker Panel 1, a 16-plex multiplex immunoassay, in serum for composite profiling of angiogenic factors. Our 5-day evaluation indicated good reproducibility (total precisions over 5 independent plates in 5 days of less than 20%), adequate sensitivity in serum for reliable detection of these 16 angiogenic factors in serum (LOQs of majority of the assays less than 100 pg/ml), and wide dynamic ranges (linearity of the majority of assays spanning 3 logs in concentrations) that allow for a single four-fold dilution factor for serum samples. The analytical performance was optimal for biomarker discovery of serum angiogenic factors in prostate cancer patients. Applying the panel to sera from prostate cancer patients with Gleason scores of 6, 7, 8–10, we demonstrated that levels of sTIE-2, a soluble form of the angiopoietin receptor TIE-2, were elevated in patients with Gleason scores of 8–10. Future studies will be necessary to determine whether sTIE-2 could be used as a prognostic biomarker for identifying aggressive prostate cancer.
Supplementary Material
Footnotes
Appendix A. Supplementary data: Supplementary data to this article can be found online at http://dx.doi.org/10.1016/j.cca.2012.06.017.
References
- 1.Cancer facts & figures 2009. Atlanta: American Cancer Society: American Cancer Society; 2009. [Google Scholar]
- 2.Cooperberg MR, Lubeck DP, Meng MV, Mehta SS, Carroll PR. The changing face of low-risk prostate cancer: trends in clinical presentation and primary management. J Clin Oncol. 2004;22(11):2141–9. doi: 10.1200/JCO.2004.10.062. [DOI] [PMC free article] [PubMed] [Google Scholar]
- 3.Weidner N, Carroll PR, Flax J, Blumenfeld W, Folkman J. Tumor angiogenesis correlates with metastasis in invasive prostate carcinoma. Am J Pathol. 1993;143(2):401–9. [PMC free article] [PubMed] [Google Scholar]
- 4.Strohmeyer D, Rossing C, Strauss F, Bauerfeind A, Kaufmann O, Loening S. Tumor angiogenesis is associated with progression after radical prostatectomy in pT2/pT3 prostate cancer. Prostate. 2000;42(1):26–33. doi: 10.1002/(sici)1097-0045(20000101)42:1<26::aid-pros4>3.0.co;2-6. [DOI] [PubMed] [Google Scholar]
- 5.Vartanian RK, Weidner N. Endothelial cell proliferation in prostatic carcinoma and prostatic hyperplasia: correlation with Gleason's score, microvessel density, and epithelial cell proliferation. Lab Invest. 1995;73(6):844–50. [PubMed] [Google Scholar]
- 6.Huss WJ, Hanrahan CF, Barrios RJ, Simons JW, Greenberg NM. Angiogenesis and prostate cancer: identification of a molecular progression switch. Cancer Res. 2001;61(6):2736–43. [PubMed] [Google Scholar]
- 7.Ugurel S, Rappl G, Tilgen W, Reinhold U. Increased serum concentration of angiogenic factors in malignant melanoma patients correlates with tumor progression and survival. J Clin Oncol. 2001;19(2):577–83. doi: 10.1200/JCO.2001.19.2.577. [DOI] [PubMed] [Google Scholar]
- 8.Secord AA, Darcy KM, Hutson A, et al. Co-expression of angiogenic markers and associations with prognosis in advanced epithelial ovarian cancer: a Gynecologic Oncology Group study. Gynecol Oncol. 2007;106(1):221–32. doi: 10.1016/j.ygyno.2007.03.021. [DOI] [PubMed] [Google Scholar]
- 9.Salgia R. Prognostic significance of angiogenesis and angiogenic growth factors in nonsmall cell lung cancer. Cancer. 2011;117(17):3889–99. doi: 10.1002/cncr.25935. [DOI] [PMC free article] [PubMed] [Google Scholar]
- 10.Zhang Z, Chan DW. The road from discovery to clinical diagnostics: lessons learned from the first FDA-cleared in vitro diagnostic multivariate index assay of proteomic biomarkers. Cancer Epidemiol Biomarkers Prev. 2010;19(12):2995–9. doi: 10.1158/1055-9965.EPI-10-0580. [DOI] [PMC free article] [PubMed] [Google Scholar]
- 11.Ellington AA, Kullo IJ, Bailey KR, Klee GG. Antibody-based protein multiplex platforms: technical and operational challenges. Clin Chem. 2010;56(2):186–93. doi: 10.1373/clinchem.2009.127514. [DOI] [PMC free article] [PubMed] [Google Scholar]
- 12.Borre M, Nerstrom B, Overgaard J. Association between immunohistochemical expression of vascular endothelial growth factor (VEGF), VEGF-expressing neuroendocrine-differentiated tumor cells, and outcome in prostate cancer patients subjected to watchful waiting. Clin Cancer Res. 2000;6(5):1882–90. [PubMed] [Google Scholar]
- 13.Kuniyasu H, Troncoso P, Johnston D, et al. Relative expression of type IV collagenase, E-cadherin, and vascular endothelial growth factor/vascular permeability factor in prostatectomy specimens distinguishes organ-confined from pathologically advanced prostate cancers. Clin Cancer Res. 2000;6(6):2295–308. [PubMed] [Google Scholar]
- 14.Strohmeyer D, Rossing C, Bauerfeind A, et al. Vascular endothelial growth factor and its correlation with angiogenesis and p53 expression in prostate cancer. Prostate. 2000;45(3):216–24. doi: 10.1002/1097-0045(20001101)45:3<216::aid-pros3>3.0.co;2-c. [DOI] [PubMed] [Google Scholar]
- 15.Doll JA, Reiher FK, Crawford SE, Pins MR, Campbell SC, Bouck NP. Thrombospondin-1, vascular endothelial growth factor and fibroblast growth factor-2 are key functional regulators of angiogenesis in the prostate. Prostate. 2001;49(4):293–305. doi: 10.1002/pros.10025. [DOI] [PubMed] [Google Scholar]
- 16.Morrissey C, Dowell A, Koreckij TD, et al. Inhibition of angiopoietin-2 in LuCaP 23.1 prostate cancer tumors decreases tumor growth and viability. Prostate. 2010;70(16):1799–808. doi: 10.1002/pros.21216. [DOI] [PMC free article] [PubMed] [Google Scholar]
- 17.Adler HL, McCurdy MA, Kattan MW, Timme TL, Scardino PT, Thompson TC. Elevated levels of circulating interleukin-6 and transforming growth factor-beta1 in patients with metastatic prostatic carcinoma. J Urol. 1999;161(1):182–7. [PubMed] [Google Scholar]
- 18.Michalaki V, Syrigos K, Charles P, Waxman J. Serum levels of IL-6 and TNF-alpha correlate with clinicopathological features and patient survival in patients with prostate cancer. Br J Cancer. 2004;90(12):2312–6. doi: 10.1038/sj.bjc.6601814. [DOI] [PMC free article] [PubMed] [Google Scholar]
- 19.Signoretti S, Montironi R, Manola J, et al. Her-2-neu expression and progression toward androgen independence in human prostate cancer. J Natl Cancer Inst. 2000;92(23):1918–25. doi: 10.1093/jnci/92.23.1918. [DOI] [PubMed] [Google Scholar]
- 20.Osman I, Scher HI, Drobnjak M, et al. HER-2/neu (p185neu) protein expression in the natural or treated history of prostate cancer. Clin Cancer Res. 2001;7(9):2643–7. [PubMed] [Google Scholar]
- 21.Shi Y, Brands FH, Chatterjee S, et al. Her-2/neu expression in prostate cancer: high level of expression associated with exposure to hormone therapy and androgen independent disease. J Urol. 2001;166(4):1514–9. doi: 10.1016/s0022-5347(05)65822-3. [DOI] [PubMed] [Google Scholar]
- 22.Morris MJ, Reuter VE, Kelly WK, et al. HER-2 profiling and targeting in prostate carcinoma. Cancer. 2002;94(4):980–6. [PubMed] [Google Scholar]
- 23.Okegawa T, Kinjo M, Nutahara K, Higashihara E. Pretreatment serum level of HER2/nue as a prognostic factor in metastatic prostate cancer patients about to undergo endocrine therapy. Int J Urol. 2006;13(9):1197–201. doi: 10.1111/j.1442-2042.2006.01533.x. [DOI] [PubMed] [Google Scholar]
- 24.Baron AT, Cora EM, Lafky JM, et al. Soluble epidermal growth factor receptor (sEGFR/sErbB1) as a potential risk, screening, and diagnostic serum biomarker of epithelial ovarian cancer. Cancer Epidemiol Biomarkers Prev. 2003;12(2):103–13. [PubMed] [Google Scholar]
- 25.Seetoo DQ, Crowe PJ, Russell PJ, Yang JL. Quantitative expression of protein markers of plasminogen activation system in prognosis of colorectal cancer. J Surg Oncol. 2003;82(3):184–93. doi: 10.1002/jso.10210. [DOI] [PubMed] [Google Scholar]
- 26.Kattan MW, Shariat SF, Andrews B, et al. The addition of interleukin-6 soluble receptor and transforming growth factor beta1 improves a preoperative nomogram for predicting biochemical progression in patients with clinically localized prostate cancer. J Clin Oncol. 2003;21(19):3573–9. doi: 10.1200/JCO.2003.12.037. [DOI] [PubMed] [Google Scholar]
- 27.van Moorselaar RJ, Voest EE. Angiogenesis in prostate cancer: its role in disease progression and possible therapeutic approaches. Mol Cell Endocrinol. 2002;197(1–2):239–50. doi: 10.1016/s0303-7207(02)00262-9. [DOI] [PubMed] [Google Scholar]
- 28.Nakamoto T, Chang CS, Li AK, Chodak GW. Basic fibroblast growth factor in human prostate cancer cells. Cancer Res. 1992;52(3):571–7. [PubMed] [Google Scholar]
- 29.Huss WJ, Barrios RJ, Foster BA, Greenberg NM. Differential expression of specific FGF ligand and receptor isoforms during angiogenesis associated with prostate cancer progression. Prostate. 2003;54(1):8–16. doi: 10.1002/pros.10163. [DOI] [PubMed] [Google Scholar]
- 30.Humphrey PA, Zhu X, Zarnegar R, et al. Hepatocyte growth factor and its receptor (c-MET) in prostatic carcinoma. Am J Pathol. 1995;147(2):386–96. [PMC free article] [PubMed] [Google Scholar]
- 31.Naughton M, Picus J, Zhu X, Catalona WJ, Vollmer RT, Humphrey PA. Scatter factor-hepatocyte growth factor elevation in the serum of patients with prostate cancer. J Urol. 2001;165(4):1325–8. [PubMed] [Google Scholar]
- 32.Fudge K, Bostwick DG, Stearns ME. Platelet-derived growth factor A and B chains and the alpha and beta receptors in prostatic intraepithelial neoplasia. Prostate. 1996;29(5):282–6. doi: 10.1002/(SICI)1097-0045(199611)29:5<282::AID-PROS2>3.0.CO;2-C. [DOI] [PubMed] [Google Scholar]
- 33.Sitaras NM, Sariban E, Bravo M, Pantazis P, Antoniades HN. Constitutive production of platelet-derived growth factor-like proteins by human prostate carcinoma cell lines. Cancer Res. 1988;48(7):1930–5. [PubMed] [Google Scholar]
- 34.Vlahos CJ, Kriauciunas TD, Gleason PE, et al. Platelet-derived growth factor induces proliferation of hyperplastic human prostatic stromal cells. J Cell Biochem. 1993;52(4):404–13. doi: 10.1002/jcb.240520405. [DOI] [PubMed] [Google Scholar]
- 35.Rittling SR, Chambers AF. Role of osteopontin in tumour progression. Br J Cancer. 2004;90(10):1877–81. doi: 10.1038/sj.bjc.6601839. [DOI] [PMC free article] [PubMed] [Google Scholar]
- 36.Amin A, Partin A, Epstein JI. Gleason score 7 prostate cancer on needle biopsy: relation of primary pattern 3 or 4 to pathological stage and progression after radical prostatectomy. J Urol. 2011;186(4):1286–90. doi: 10.1016/j.juro.2011.05.075. [DOI] [PubMed] [Google Scholar]
- 37.Tsivian M, Sun L, Mouraviev V, et al. Changes in Gleason score grading and their effect in predicting outcome after radical prostatectomy. Urology. 2009;74(5):1090–3. doi: 10.1016/j.urology.2009.03.043. [DOI] [PubMed] [Google Scholar]
- 38.Chin KF, Greenman J, Reusch P, Gardiner E, Marme D, Monson J. Changes in serum soluble VEGFR-1 and Tie-2 receptors in colorectal cancer patients following surgical resections. Anticancer Res. 2004;24(4):2353–7. [PubMed] [Google Scholar]
Associated Data
This section collects any data citations, data availability statements, or supplementary materials included in this article.