

Abstract
The study of transient chemical phenomena by conventional NMR has proved elusive, particularly for non-1H nuclei. For 13C, hyperpolarization using the dynamic nuclear polarization (DNP) technique has emerged as a powerful means to improve SNR. The recent development of rapid dissolution DNP methods has facilitated previously impossible in vitro and in vivo study of small molecules. This review presents the basics of the DNP technique, identification of appropriate DNP substrates, and approaches to increase hyperpolarized signal lifetimes. Also addressed are the biochemical events to which DNP-NMR has been applied, with descriptions of several probes that have met with in vivo success.
1. Introduction
The term “molecular imaging” has been used to describe techniques that directly or indirectly monitor and record the spatiotemporal distribution of molecular or cellular processes for biochemical, biologic, diagnostic, or therapeutic applications.1 A variety of imaging methods fit this description, including positron emission tomography (PET), single photon emission computed tomography (SPECT), optical imaging, and Raman spectroscopy. The relevant chemistries are highly evolved for some of these fields, with the earliest SPECT camera developed in the 1960’s and hundreds of PET tracers now described in the literature. Magnetic resonance imaging (MRI), whose origin is in nuclear magnetic resonance (NMR), was developed for clinical use as of the 1980’s, and began with a structural emphasis. More recently, functional insights have been provided by several MRI innovations. In vivo magnetic resonance spectroscopy (MRS), use of gadolinium (Gd) chelates, and imaging of magnetic nanoparticles (MNP), to name a few, have permitted interrogation of basic cellular mechanisms on the molecular level.
One limitation of MRS in particular is low sensitivity, a problem that has been addressed by hyperpolarization, where the spin polarization of a nucleus is enhanced beyond that seen at thermodynamic equilibrium. Hyperpolarized (HP) 129Xe and 3He have been achieved by optical pumping, with potential for low-radiation imaging of the lungs. For nuclei found in endogenous molecules (in particular carbon and nitrogen), the dynamic nuclear polarization (DNP) technique has emerged as a way to polarize small-molecule metabolites not readily observable by traditional MR. The dramatic signal enhancements obtained (up to 105) allow not only the detection of the introduced metabolic agent, but also its metabolic products in real-time. Progress has been catalyzed by a remarkable technical achievement, namely, the retention of spin polarization in solution following low-temperature DNP in the solid state.2 This process has been termed dissolution-DNP and is the focus of this review. New 13C probes, MRI methods, disease models, and biochemical insights have advanced the field significantly over the last decade, culminating in the first human trial using HP [1-13C] pyruvate in prostate cancer patients.3
In vivo studies are only one application of DNP, which has also probed a variety of chemistries in vitro. DNP-NMR is particularly suited to processes that are rapid, transient, and dynamic since their study is difficult at thermodynamic equilibrium. The focus of this review is 13C, but several other spin 1/2 nuclei are amenable to DNP, including 15N, 29Si, and 89Y. This review presents the basics of the DNP technique, identification of appropriate DNP substrates, and approaches to increase HP signal lifetimes. Also addressed are the biochemical events to which DNP-NMR has been applied, with descriptions of several probes that have met with in vivo success.
2. WHY DNP?
2.1. Clinical development of 1H MRI/MRS
One of the major advances in biomedical imaging of the last century has been the development of MRI, which evolved from NMR. Since the pioneering work of Lauterbur and Mansfield, advances in MR imaging have progressed rapidly, with MRI now considered critical in the workup of patients suffering from a wide array of disorders. Nuanced discussion of the development of MRI is beyond the scope of this review.4 Briefly, the vast majority of clinical MRI scans observe protons (1H nuclei, spin 1/2), which are highly abundant in the body in the form of H2O. In a typical NMR experiment, at thermal equilibrium these 1H spins precess about an applied magnetic field with a net magnetization, which may be perturbed and detected by appropriate radiofrequency radiation and detection. In MRI, the location of the detected signal in 3D-space is obtained by applying additional magnetic field gradients during detection. In conventional pulsed NMR, the return to thermal equilibrium is characterized by a relaxation time T1.
While MRI provides morphometric information about the organs and/or disease studied, MRS is used to study metabolites in tissue, providing functional and biochemical insights. MRS is commonly performed during clinical scans of the brain and prostate gland.5,6 The brain is ideal for MRS due to its relative lack of motion, and its comparatively high concentrations of metabolites that become altered in cancer, ischemia, and neurodegenerative disease. MRS is based on chemical shift, whereby the microenvironment of 1H spins causes a small change in their spin frequency, expressed in parts-per-million (ppm). This frequency information is used to generate metabolite maps with spectra corresponding to various volume elements, or voxels.
2.2. Study of non-1H nuclei at thermodynamic equilibrium
Of potential MR-observable nuclei, only 1H is currently used in clinical practice. Several features of 1H make it the ideal nucleus for MRI/MRS at thermodynamic equilibrium. These include (1) high natural abundance, (2) high concentration in the body, (3) large gyromagnetic ratio (γ), (4) short T1 relaxation, and (5) presence in several metabolites that are relevant to human disease.
In contrast, other nuclei found in biomolecules, e.g., the MR-active isotopes of carbon, oxygen, and nitrogen, are difficult to observe at thermodynamic equilibrium. Despite various shortcomings, several non-1H nuclei have been used for MRS in man. 31P has been studied in vivo, with an emphasis on high-energy metabolites and lipid metabolism.7–9,23Na has been used to image sodium throughout the body, mostly focusing on the brain to assess changes with stroke and neurodegenerative disease.10,11 While 1H, 23Na and 31P MRS studies have focused on endogenous nuclei, several other nuclei have been investigated following long infusions of small molecules containing MR-active nuclei. These include 2H, 19F and 13C. For example, following administration of [2-13C] glucose and using low-power stochastic decoupling on a modified clinical 3 T scanner, incorporation of the label into glutamine, glutamate, aspartate, gamma-aminobutyric acid, and N-acetylaspartate was observed in the human brain.12 In a separate study, [1-13C] glucose and [6,6-2H2] were used to measure glucose metabolism in humans by assaying biofluids.13 19F studies have focused on the metabolism of fluorinated drugs.14 The basic properties of nuclei studied at thermal equilibrium are presented in Table 1.
Table 1.
NMR active nuclei typically used for biomedical applications
| Nuclei | m (spin) | Natural abundance (%) | γ (rel to 1H) | Δδ(ppm) | T1 range | Example biomedical application |
|---|---|---|---|---|---|---|
| 1H | 1/2 | 99.98 | 1 | 13 | 0.1–2 s | Total body MRI and MRSI |
| 2H | 1 | 0.02 | 0.1535 | 13 | <1 s | Metabolic tracer injection using MRSI |
| 13C | 1/2 | 1.11 | 0.2515 | 200 | 0.1–100 s | Metabolic tracer injection using MRSI |
| 15N | 1/2 | 0.37 | 0.1013 | 900 | 0.1–400 s | Metabolic tracer injection using MRSI |
| 17O | 5/2 | 0.04 | 0.1355 | 1160 | 5–50 ms | Oxidative metabolism using MRSI |
| 19F | 1/2 | 100.00 | 0.9409 | 700 | 0.1–1 s | Tracer injection of therapies using MRSI |
| 23Na | 3/2 | 100.00 | 0.2645 | 72 | 10–50 ms | Neurodegeneration and cardiac using MRI |
| 31P | 1/2 | 100.00 | 0.4048 | 430 | 0.05–2 s | Bioenergetics and pH using MRSI |
MRI – magnetic resonance imaging, MRSI – magnetic resonance spectroscopic imaging, m – quantum spin number, γ – gyromagnetic ratio, Δδ– chemical shift.
Clinical translation of non-1H nuclear imaging has proved difficult. For these nuclei, a lower gyromagnetic ratio (γ) results in the need for extensive signal averaging; hence the necessity of utilizing species with short T1 relaxation times. In nuclei that exhibit long T1 relaxation times, signals are not fully relaxed upon acquisition and must be corrected, further impacting sensitivity. Typically, methyl carbons (i.e., the methyl moiety of 13C lactate) are used for in vivo 13C spectroscopy, as they have shorter T1’s.15 Unfortunately, 13C nuclei typically have directly attached protons, leading to J-coupling and resonance splitting. When used in ex vivo MRS, 1H decoupling may be implemented, but this can be problematic for in vivo use. T2 relaxation times can also negatively affect the ability to image certain nuclei, with acquisition times heavily dependent on transverse magnetization decay. For example, in the case of 31P, short T2 relaxation times lead to broad spectroscopic lines and make it difficult to implement spectroscopic imaging sequences.16 As will be subsequently discussed, the dissolution-DNP technique has emerged as a way to increase the MR signal for 13C and 15N, affording the needed signal enhancement for in vivo studies.
2.3. Enhancing the MR signal using DNP
The use of non-1H nuclei in MRS, in particular 13C, has been partially motivated by the limited chemical shift range (Δδ ≈ 10 ppm) of metabolites of interest in the 1H spectrum.17 Deconvolution of the many metabolite resonances in the 1H spectrum is difficult. Additionally, strong signals from 1H’s of water and lipids, relative to those of relevant metabolites, overwhelm the spectrum and are difficult to suppress.18–20 Several strategies have been employed to overcome these limitations, including outer-voxel suppression, spectral editing techniques, and 2D-MRS. In the latter experiments, coherence transfer between J-coupled spins or J-coupling induced phase differences can be used to “uncover” nuclei of interest in a second frequency dimension.21–23 These methods are commonly applied to in vitro NMR, but are relatively new to in vivo imaging and have been facilitated by the proliferation of high field-strength magnets (3 T and 7 T).
In contrast to the crowded 1H spectrum, peaks corresponding to 13C metabolites of interest occur over a much larger range, approximately 200 ppm. However, as previously mentioned, 13C applications in vivo have been limited by both nuclear features and the low concentrations of interrogated metabolites. The natural abundance of 13C, the NMR-active isotope, is only 1.1%. In addition, the gyromagnetic ratio (γ) of 13C is only 1/4 that of 1H, which further limits sensitivity. Finally, in contrast to water (60–70% of the human body), in which the concentration of 1H is approximately 110 M, the most concentrated metabolites (for example, ascorbate and lactate) are present in the mM range in vivo. Accordingly, MRI/MRS of endogenous 13C is not possible at reasonable imaging times.
Fortunately, HP MR has recently emerged as a way to dramatically improve sensitivity, with signal enhancements in solution routinely observed on the order of 104 for a variety of small molecules. Both percent polarizations and signal enhancements are reported in the literature, with the latter term depending on field strength. For example, a 13C nucleus HP to 30% and studied at 3 T may be compared with its thermodynamic polarization at this field strength, namely 2.47 ppm. The corresponding enhancement factor would be 0.3/2.47 × 10−6 or roughly 105. In addition to 13C (the focus of this review), several other long T1 nuclei have been polarized using the DNP technique, including 15N, 29Si, 89Y, and 129Xe, with potential applications in biomedical imaging (Table 2).24–31 The PASADENA technique has also been used to polarize 13C metabolites of interest.32–34 While the PASADENA method has the benefit of rapid polarization times, the DNP technique has the advantage of being applicable to a broad range of chemistries and metabolites, as will be discussed shortly.
Table 2.
Nuclei that have been HP using the dissolution dynamic nuclear polarization method (DNP)
| HP nuclei | Natural abundance (%) | γ (rel to 1H) | Example molecules | Example T1’s (field strength) |
|---|---|---|---|---|
| 1H | 99.98 | 1 | H2O | 3.7 s (4.7 T)220 |
| 13C | 1.11 | 0.2515 | Fructose, urea | 13 s (11.7 T)90–85 s (3 T)221 |
| 15N | 0.37 | 0.1013 | choline | 189 s–390 s (7 T)105 |
| 29Si | 4.70 | 0.1987 | Nano-particles | 100–10 000 s (2.9 T)28 |
| 89Yi | 100.00 | 0.17605 | DOTA chelates | 264–620 s (14.1 T)29 |
2.4. Categories of 13C DNP probes
HP 13C agents can be divided into three categories according their discrete utilities: (1) endogenous molecules, modified only by 13C or 2H enrichment, (2) environmental sensors, and (3) molecules that interrogate and expand the reach of DNP-NMR as an imaging technique.
HP [1-13C] pyruvate and [1,4-13C2] fumarate are examples of probes in the first category, used to follow basic biochemistry with many potential applications in oncologic imaging (REF). For this set of agents, the principal question is what the HP data reveals about flux through metabolic pathways, and how this information might help us better understand and treat disease. The second category of DNP agents may be non-endogenous and include [2-13C] benzoylformic acid and [13C,D3]-p-anisidine (used to detect reactive oxygen species), 13C HCO3− (used to interrogate pH) and salicylic acid (used to detect hydrophobic binding in vitro).35–38 These may also be applied to biologic problems, but the emphasis here is detecting chemical environment, usually by a reaction-based mechanism. The final category of 13C probes includes many that are critical in advancing and understanding DNP-NMR technology. For example, [2,3-13C2] diacetyl has been used to study spin polarization in the singlet state, allowing retention of HP signal beyond that dictated by T1.39 Modification of substrates by HP [1,1′-13C2] acetic anhydride has demonstrated the transfer of hyperpolarization by chemical means,40 while HP styrene has allowed direct visualization of living anionic intermediates during polarization.41 For this last set of probes, the main emphasis is identifying special properties of DNP-NMR, and ways the technology itself can expand.
2.5. Mechanics of the dissolution-DNP experiment
The physics of DNP are beyond the scope of this review and are discussed elsewhere.42 The DNP phenomenon, namely that the heating of one spin system could lead to cooling of another, was described as early as 1953 by Overhauser.43 Solid-state experiments at low temperatures showed that high electron polarizations could be transferred, in part, to nuclear spins by microwave irradiation, at frequencies close to the resonance frequency of the electron spin. As early as the 1974, de Boer demonstrated that through thermal contact between nuclear and electronic spins, dynamic nuclear polarization is produced.44 Hyperpolarization can occur by three main mechanisms: the solid effect, Overhauser enhancement, and thermal mixing. The mechanism requires the presence of unpaired electrons, which can be accomplished via addition of an electron paramagnetic agent (EPA), often an organic free radical. The choice of this radical and in turn its electron spin resonance (ESR) linewidth is indicative of the major mechanism used to achieve hyperpolarization. Very high polarizations (up to 50%) have been reported for 13C in the solid state.45 For applications in solution, fast heating/melting of the frozen sample (dissolution), with retention of spin polarization, was accomplished only recently by Ardenkjaer-Larsen et al.2 Since this development, the field of DNP-NMR has progressed rapidly, with reports of several new MRI/MRS methods, DNP agents, and biochemical applications.
The components of a DNP sample include the MR-active nucleus of interest, an organic free radical, and a solvent that ensures homogeneous distribution of the radical, forming an amorphous solid or “glass” when frozen. In the DNP polarizer, at moderate magnetic field strength (up to 5 T) and liquid helium temperatures (1 K), electron spin polarization is at unity. Partial transfer of spin polarization is accomplished by microwave irradiation, with the solid-state polarization reaching a plateau at 1–2 hours for a typical sample. Several media have been employed for dissolution, but for biological applications an aqueous buffer is used. A chelating agent (typically ethylenedinitrotetraacetic acid, or EDTA) is often used to bind paramagnetic ions that might increase the relaxation rate. The solution is then ready for in vitro and in vivo applications, which are usually performed within 1–2 minutes following dissolution to minimize T1-dependent loss of signal. For in vivo MR studies, special hardware is required to transmit and receive radiofrequency signals at the 13C frequency. A dual-tuned coil is used to acquire 1H anatomical imaging, for correlation of 13C magnetic resonance spectroscopic imaging (MRSI) data with organs/tissues of interest. These components together facilitate the HP MR experiment.
Both dynamic and single time-point studies may be performed, as shown in Fig. 1. In this example, [1-13C] pyruvate was HP and injected into a pig, with spectral data acquired from the porcine myocardium.46 First, a dynamic experiment was conducted where a 10 cm axial slab was excited with a low flip angle (10°) pulse and a 2 s repetition time. The injection duration was approximately 15 s and the maximum HP pyruvate was also observed at this time point. HP pyruvate then underwent enzymatic conversion and its metabolic products (lactate 183 ppm, alanine 176.5 ppm and bicarbonate 161 ppm) observed as they formed in real time. This type of experiment is used to determine the timing of single time-point studies. Here the researchers chose to initiate the 3D MRSI sequence at 18 s after the start of the pyruvate injection. In this range they found relatively constant lactate and bicarbonate signals for 10–20 s. It is important to note that since this data is dynamic, the window chosen for imaging weights the ratios observed. Analysis of the 3D data shows differential metabolism to HP bicarbonate across the porcine heart, including localized bicarbonate in the myocardium as compared to the predominant pyruvate signal in the heart chamber.
Fig. 1.

(A) Single 13C spectrum acquired following injection of 15 ml of HP [1-13C] pyruvate at 3 T in a porcine heart. The pyruvate was injected at a constant rate from 0 to 15 s. (B) To generate the time course, spectra were acquired every 2 s using a 10° flip angle and a 10 cm slice. The peak height plot demonstrates the time course of pyruvate delivery and lactate, alanine and bicarbonate labeling. (C) Axial T2-weighted 1H image depicting the porcine heart with color overlays reconstructed from MRSI data. Cardiac-gated data demonstrate the spatial distribution of pyruvate and bicarbonate in a single 10 mm axial slice. The inset spectrum is a sum over all magnitude spectra. The scale bar indicates 2 cm. The color scale for both images ranges from 15 to 100% of the image intensity maximum. Adapted from ref. 46.
In vivo metabolism of several HP 13C probes has been observed, as will be discussed in Section 11. In addition, many exciting in vitro experiments have shown the value of DNP for observing fast chemical reactions, characterizing binding in solution, and monitoring metabolism in engineered cellular systems or “bioreactors”.
3. Considerations for DNP probe development
The prototype agent for dynamic nuclear polarization is [1-13C] pyruvic acid, which has been used for the majority of in vivo studies, including a recent clinical trial in prostate cancer patients. The chemical structure of [1-13C] pyruvic acid is shown in Fig. 2A. Pyruvic acid forms a glass as a neat liquid upon freezing, has a high concentration (14.2 M), readily dissolves several organic free radicals, and has a long spin–lattice relaxation constant (T1), especially at clinically relevant magnetic field strengths (i.e., 1.5 and 3 T). As discussed later, the biochemical features of this probe are also desirable, including low toxicity, rapid uptake, and fast conversion to metabolites that are readily observable by chemical shift. When designing new probes and predicting their chemical and biochemical behavior, the success of [1-13C] pyruvic acid provides an important exemplar.
Fig. 2.
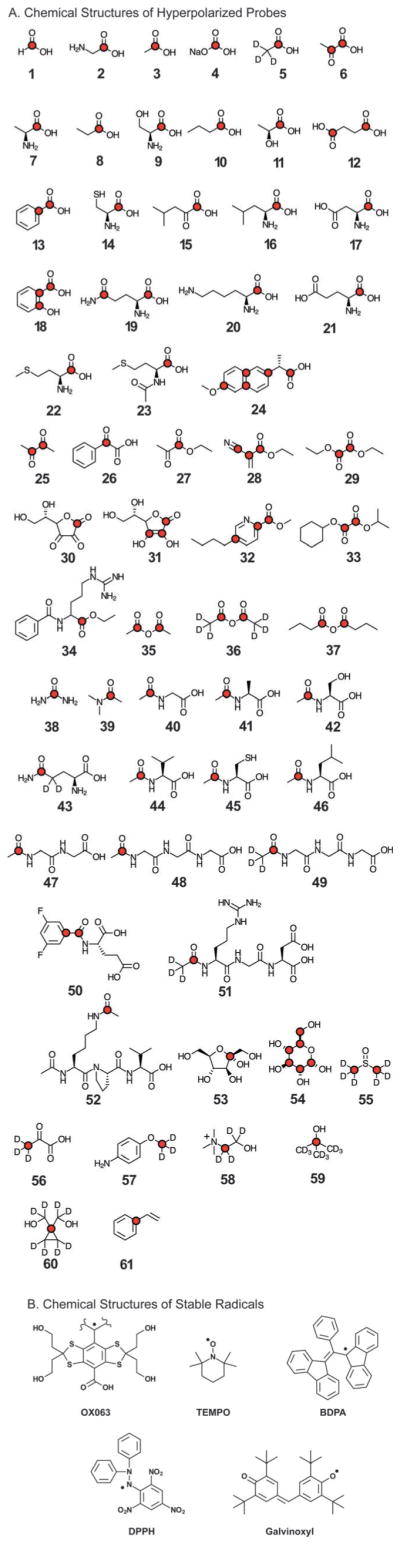
(A) Chemical structures of compounds that have been HP. Long-T1 nuclei (those without directly attached 1H) that have been studied by DNP-NMR are labeled. These correspond to Table 3. (B) Chemical structures of stable organic free radicals used for hyperpolarization.
3.1. Identification of DNP candidates
In recent years, the pool of 13C agents for DNP has rapidly expanded, incorporating a large number of functional groups, and focusing on a broad range of physiologic processes. Although several features are considered essential for the viability of 13C DNP substrates as in vitro and in vivo agents, this review presents the versatility of DNP with respect to chemical structure. This section will also describe the basic preparation of a DNP sample, which includes an organic free radical and glass-forming solution of the 13C agent being studied. Generally, the DNP technique has been applied to small molecules (<200 Da) that contain a long T1 nucleus. A large number of endogenous metabolites meet these criteria.
3.1.1. Hyperpolarized lifetime and spin–lattice relaxation (T1)
In DNP, the critical property of a nucleus is its T1, which determines its useful HP lifetime in solution. Following dissolution, 37% of the HP MR signal remains at 1T1, and only 5% at 3T1’s. For this reason, even MR studies with long T1 probes are initiated within 1–2 minutes following dissolution. Dipolar coupling is the most important consideration, although the strong magnetic field dependence observed for some biomolecules indicates a significant contribution from chemical shift anisotropy (CSA), which scales with the square of the field (B02).47 For 13C nuclei in biomolecules of interest, dipolar coupling is usually with 1H, and depends on the number of intervening bonds.
Generally, nuclei with directly attached protons are not feasible candidates for DNP. For example, glucose is of broad interest in metabolic studies, but the T1’s of the carbons are all <2 seconds.48,49 To observe upstream glycolysis, two approaches have been used to overcome this limitation. The first is substitution of 1H with 2H, a quadrupole nucleus (this will be discussed in detail in Section 5). The second is use of glucose surrogates, for example [2-13C] fructose and [1-13C] dehydroascorbate, which share several biochemical features with glucose. In both cases, both the probe and metabolite are of sufficiently long T1 to observe in living systems. The structures of glucose (an aldo-sugar) and fructose (a keto-sugar) are shown in Fig. 2A. For a comprehensive discussion of magnetic dipole–dipole interactions, Levitt’s text is suggested.50
If relaxation by dipolar coupling were the only mechanism observed, a modest increase in T1 would be anticipated with increasing field strength. In fact, this is observed for [2-13C] fructose, which exists predominantly as a hemi-ketal in aqueous solution. Also, the average T1’s calculated for [U-13C6, 2H7] glucose carbons are similar over a large magnetic field range (3–11.8 T).49 However, for the majority of DNP substrates, a longer T1 is observed at lower field strength. This is the result of chemical shift anisotropy, where circulating π-electrons cause local induced magnetic fields depending on their orientation with respect to the external field. This effect is expected in alkenes, carbonyls, and aromatic species. Since the majority of compounds polarized by DNP are carbonyls, higher field strength generally results in a lower T1, sometimes significantly.51,52 Therefore, the benefits of conducting DNP-NMR studies at higher field strength (increased spectral dispersion and improved SNR for 1H correlative studies at thermal equilibrium) are partially offset by a reduced HP lifetime. Several 13C probes have been HP and studied at varying field strengths (Table 3).
Table 3.
Chemical structures of HP probes
| Chemical structure | Index | HP agent | MW (Da) | Apparent T1 (s) | Application | Ref. |
|---|---|---|---|---|---|---|
 carboxylic acid |
1 | 13C sodium formate | 69 | NR | C | 222 |
| 2 | [1-13C] glycine | 76 | 50 (9.4 T) | C | 78 | |
| 3 | [1-13C] sodium acetate | 83 | 40 (9.4 T); 46 (14.1 T) | A, C | 121, 223 and 224 | |
| 4 | 13C-sodium bicarbonate | 85 | 49 (11.7 T); 50 (3 T); 34 (3 T) | A, C | 83 and 177 | |
| 5 | [1-13C, 2H3] sodium acetate | 86 | 50 (14.1 T) | C | 121 | |
| 6 | [1-13C] pyruvic acid | 89 | 67 (3 T); 48 (11.7 T); 44 (14.1 T) | A, B, C | 83 and 121 | |
| 6 | C1 of [1,2-13C] pyruvic acid | 90 | 56 (3 T) | A, C | 177 | |
| 7 | [1-13C] alanine | 90 | 42 (3 T); 29 (9.4 T) | A, C | 78 and 225 | |
| 8 | [1-13C] sodium proprionate | 97 | NR | A, C | 224 | |
| 9 | [1-13C] serine | 106 | 23 (9.4 T) | C | 78 | |
| 6 | [1-13C] sodium pyruvate | 111 | NR | C | 80 | |
| 10 | [1-13C] sodium butyrate | 111 | 43 (14.1 T) | C | 226 | |
| 11 | [1-13C] sodium lactate | 113 | 45, 50.6 (3 T); 32, 33.4 (14.1 T) | A, C | 52 and 227 | |
| 12 | [1,4-13C2] fumaric acid | 118 | 24 (9.4 T); 29 (11.7 T) | A, B, C | 83 and 196 | |
| 13 | C1 of benzoic acid | 122 | 35 (11.7 T) | C | 54 | |
| 14 | [1-13C] cysteine | 122 | 30 (9.4 T) | C | 78 | |
| 13 | [1-13C] benzoic acid | 123 | 35 (11.7 T) | C | 54 | |
| 15 | [1-13C] ketoisocaproic acid | 131 | 55 (9.4 T) | A, C | 169 | |
| 16 | [1-13C] leucine | 132 | 24 (9.4 T) | C | 78 | |
| 17 | [1-13C] aspartic acid | 134 | 29 (9.4 T) | C | 78 | |
| 18 | C1 of salicylic acid | 138 | NR | C | 38 | |
| 19 | [1-13C] glutamine | 147 | 25 (9.4 T) | C | 78 | |
| 20 | [1-13C] lysine | 147 | 26 (9.4 T) | C | 78 | |
| 21 | [1-13C] glutamate | 148 | 26 (9.4 T); 34 (9.4 T) FG | A, C | 78 | |
| 22 | [1-13C] methionine | 150 | 17 (9.4 T) | C | 78 | |
| 23 | [1-13C] N-acetyl-methionine | 192 | 28 (3 T) | A, B, C | 188 | |
| 4 | 13C-cesium bicarbonate | 195 | NR | A, C | 37 | |
| 24 | 2-Napthaleneacetic acid-6-methoxy-α-methyl (NA) | 230 | 15 (11.7 T) | C | 54 | |
 ketone |
25 | [2,3-13C2] diacetyl | 88 | 30 (7 T) | C | 39 |
| 6 | [2-13C] pyruvic acid | 89 | NR | B, C | 84 | |
| 6 | C2 of [1,2-13C2] pyruvic acid | 90 | 44 (3 T) | A, C | 177 | |
| 26 | [2-13C] benzoylformic acid | 151 | 24 (11.7 T); 19 (14.1 T) | C | 35 | |
 ester |
27 | [1-13C] ethyl pyruvate | 117 | 45 (3 T) | A, C | 87 |
| 28 | Ethyl-2-cyanoacrylate (NA) | 125 | NR | C | 132 | |
| 29 | [1,1′-13C2] diethyl oxalate | 148 | 22 (8.4 T) | C | 126 | |
| 30 | [1-13C] dehydroascorbic acid | 175 | 56 (3 T); 21 (9.4 T); 21 (11.7 T) | A, B, C | 85 and 86 | |
| 31 | C1 of ascorbic acid (NA) | 176 | NR | C | 38 | |
| 31 | [1-13C] ascorbic acid | 177 | 29 (3 T); 16 (9.4 T); 16 (11.7 T) | A, B, C | 85 and 86 | |
| 32 | Methyl fusarate (NA) | 193 | NR | C | 132 | |
| 33 | Cyclohexyl-isopropyl-1,2-13C2-oxalate-2H18 | 234 | 54 (4.7 T) | C | 128 | |
| 34 | Nα-benzoyl-L-arginine-ethyl ester | 306 | NR | C | 228 | |
 anhydride |
35 | [1,1′-13C2] acetic anhydride | 104 | 34 (11.7 T); 45,50 (14.1 T) | C | 40 |
| 36 | [1,1′-13C2, 2H6] acetic anhydride | 110 | NR | C | 121 | |
| 37 | [1,1′-13C2] butyric anhydride | 160 | 39,40 (14.1 T) | C | 226 | |
 amide |
38 | 13C-urea | 61 | 44 (11.7 T); 35 (14.1 T) | A, C | 83 |
| 39 | Dimethyl acetamide (NA) | 87 | NR | C | 85 | |
| 40 | N-[Acetyl-1-13C] glycine | 118 | 15 (11.7 T); 17 (14.1 T) | C | 40 | |
| 41 | N-[Acetyl-1-13C] alanine | 132 | 15 (11.7 T) | C | 40 | |
| 19 | [5-13C] glutamine | 145 | 16 (9.4 T) | B, C | 118 | |
| 42 | N-[Acetyl-1-13C] serine | 148 | 11 (11.7 T) | C | 40 | |
| 43 | [5-13C, 4-2H2] glutamine | 149 | 33 (9.4 T) | B, C | 40 | |
| 44 | N-[Acetyl-1-13C] valine | 160 | 10 (11.7 T) | C | 40 | |
| 45 | N-[Acetyl-1-13C] cysteine | 164 | NR | C | 40 | |
| 46 | N-[Acetyl-1-13C] leucine | 174 | 9 (11.7 T) | C | 40 | |
| 47 | N-[Acetyl-1-13C] gly-gly | 175 | 10 (11.7 T) | C | 40 | |
| 48 | N-[Acetyl-1-13C] triglycine | 232 | 9 (11.7 T) | C | 40 | |
| 49 | N-[Acetyl-1-13C,2H3] triglycine | 235 | 10 (14.1 T) | C | 40 | |
| 50 | C1 of 3,5-difluorobenzoyl-L-glutamate (NA) | 287 | 7 (11.7 T) | C | 185 | |
| 51 | N-[Acetyl-1-13C,2H3] RGD peptide | 393 | 5 (14.1 T) | C | 40 | |
| 52 | Lys-N-[acetyl-1-13C] adduct of N-acetyl-α-MSH (11–13) peptide | 426 | 10 (11.7 T) | C | 40 | |
 hemi-ketal |
53 | [2-13C] fructose | 181 | 13–15 (3 T); 16 (11.7 T) | A, B, C | 90 |
 hemi-acetal |
54 | C1 of [U-13C, U-2H] glucose | 193 | 12 (14.1 T)a | A, B, C | 101 and 111 |
 primary carbon |
55 | [13C2, 2H6] DMSO | 86 | NR | C | 80 |
| 56 | [3-13C, 2H3] pyruvic acid | 92 | 56 (14.1 T) | C | 120 | |
| 57 | [13C, 2H3]-p-anisidine | 127 | 44.4 (9.4 T) | C | 125 | |
 primary alcohol |
54 | C6 of [U-13C, U-2H] glucose | 193 | 10 (14.1)a | A, B, C | 101 and 111 |
 primary alcohol |
58 | [2-13C, 1,2-2H4] choline chloride | 142 | 47 (14.1 T) | C | 107 |
 secondary alcohol |
54 | C2-5 of [U-13C, U-2H] glucose | 193 | 12 (14.1 T)a | A, B, C | 101 and 111 |
 tertiary alcohol |
59 | [U-2H, 13C]methylpropan-2-ol | 84 | 46 (9.4 T) | A, C | 68 |

|
60 | Bis-1,1-(hydroxymethyl)-[1-13C]cyclopropane-2H8 | 111 | 82 (2.4 T) | A, C | 89 |
 alkene |
28 | Ethyl-2-cyanocrylate (NA) | 125 | NR | C | 132 |
|
nitrile |
28 | Ethyl-2-cyanoacrylate | 125 | NR | C | 132 |
 enediol (reductone) |
31 | C2, C3 of ascorbic acid (NA) | 176 | NR | C | 38 |
 phenyl |
61 | C1 of styrene (NA) | 104 | 37 (9.4 T) | C | 41 |
| 13 | C2 of benzoic acid (NA) | 122 | 19 (11.7 T) | C | 54 | |
| 18 | C2 of salicylic acid (NA) | 138 | NR | C | 38 | |
| 32 | C2 of methyl fusarate (NA) | 193 | NR | C | 132 | |
| 32 | C5 of methyl fusarate (NA) | 193 | NR | C | 132 | |
| 50 | C2 of 3,5-difluorobenzoyl-L-glutamate (NA) | 287 | 6 (11.7 T) | C | 185 | |
 phenol |
18 | C3 of salicylic acid (NA) | 138 | NR | C | 38 |
 napthalene |
24 | C3, C5, C8, C10 of 2-napthaleneacetic acid-6-methoxy-α-methyl (NA) | 230 | NR | C | 54 |
Apparent T1 relaxation rates are reported in seconds with the corresponding field strength. Application abbreviation: A – in vivo studies, B – studies in cells, tissues, and perfused organs, C – solution studies (basic physiochemical properties, chemical reactions).
For [U-13C, U-2H] glucose, T1 studies were performed at a wide range of field strengths, concentrations, and enrichment sites. For further analysis please refer to Allouche-Arnon et al.111
Dedicated studies have been performed to investigate the dependence of T1 on magnetic-field strength for 13C compounds. The T1 dispersion of [1-13C] acetate was measured by shuttling the sample in and out of an NMR spectrometer, with the local field determined by the fringe field of the magnet.53 For this study, the spin–lattice relaxation rates (1/T1) of [1-13C] acetate in D2O were measured from 2 mT to 18.8 T (most state-of-the-art clinical MR scanners are 1.5–3.0 T), with and without the presence of TEMPO radical. The results demonstrate relaxation due to intra-molecular dipolar effects, chemical shift anisotropy, and presence of the paramagnetic species. Significantly, long T1’s are identified in the clinically-relevant range, with higher relaxation rates observed at both very low and high fields. High fields (up to 14 T) are often employed for in vitro and preclinical (animal) studies,54 while low fields are experienced by HP samples during transfer from the DNP apparatus to the magnet.
These results confirming the dependent relationship of T1 on magnetic-field strength were tested using an alternate method, employing HP [1-13C] pyruvate with a fast field-cycling relaxometer, at relaxation fields varying between 0.237 mT and 0.705 T.55 The authors investigated these low-field T1’s since the magnetic field surrounding the DNP apparatus is normally near or at the earth’s field. [1-13C] pyruvate was polarized by DNP, and dissolved in aqueous pH 7.8 buffer at a concentration of 80 mM, which is similar to the concentration employed in preclinical in vivo studies. The authors found that the relaxation time for the C1 nucleus was approximately 46.9 s at the earth’s magnetic field (0.05 mT) compared to 65 s at 3 T, suggesting the utility of a “holding field” through which the HP solution could be transferred following dissolution to avoid loss of sample magnetization.
3.1.2. Molecular size
Small molecules are usually employed in DNP given (1) ease of synthesis (2) high aqueous solubility and (3) relevance in fast metabolism. In addition, for small molecules T1 decreases as a function of the increasing correlation time (τc) seen with increasing molecular size. This relationship is described in Fig. 3, and was investigated using HP 13C MR spectroscopy in a series of N-acetylated glycine peptides (glycine, diglycine and triglycine).40 This study showed a significant reduction in T1 with increasing molecular weight, for similar chemical structures. Therefore, it is not surprising that the highest reported DNP enhancements are for small molecules (the molecular weight of pyruvic acid is 88 Da).
Fig. 3.

Plot of relaxation time versus correlation time (τc) demonstrates the expected changes in T1 and T2 relaxation with molecule size. Adapted from ref. 229.
At high molecular weights, as seen in polymers and larger proteins, the opposite trend in T1 is expected. Recently, solution NMR of HP polypeptides was described, for both a short peptide (bacitracin A) and full-length protein (L23).56 This technique required both 13C enrichment and partial deuterium substitution, to minimize loss of T1 due to dipolar coupling. Bacterial cultures were grown in media containing 13C6-glucose and 80% D2O, leading to approximately 50% total fractional enrichment. Samples were then prepared by the usual technique, in 60% (v/v) ethylene glycol/D2O. While the signal enhancements obtained were modest (300 to 2000-fold), solution spectra (including both carbonyl and aliphatic groups) were obtained in a single scan, in a L23 sample at only 15 μM. These findings suggest the potential to reduce the long experiment times of protein NMR in solution. In addition, DNP-NMR may be particularly well suited to studying transient processes in protein samples, such as ligand binding or folding. One potential limitation on DNP-enhanced protein studies is the relatively harsh conditions of current dissolution methods, and ensuring the structural integrity of these macromolecules would be important. Hilty et al. have also described a rapid sample injection device, which minimizes loss of signal during transfer of the HP sample to the magnet.57 In the context of the observed apparent relaxation times of 1.3–5.1 s, this innovation is particularly relevant.
3.1.3. Toxicity in living systems
The concentrations of agents polarized using the DNP method are often quite high for in vitro and in vivo applications, in contrast to the tracer doses typically used for other metabolic imaging methods, for example PET. Clinical PET doses are quantified by radiation, with the typical dose of FDG at 10 mCi. Assuming a specific activity of 5000 Ci per mmol for FDG,58 this corresponds to 2 nmol. In contrast, if a typical HP [1-13C] pyruvate dose administered to a 20 g mouse (200 μL of an 80 mM solution) were extrapolated to a 70 kg man, 0.056 mol of the agent would be given. The result is a 107–108 difference in pharmacologic dose between the technologies. Therefore, toxicity is a consideration for use of HP molecules in biologic systems. For these applications, the DNP agent used is usually: (1) chemically identical, or similar to an endogenous metabolite, or (2) chemically inert. Inert substances, for example iodinated contrast media or Gd-chelates, are currently the mainstay for improving tissue contrast in clinical CT and MR scans, and are administered at fairly high doses (~500 mM in the case of Gd-chelates).59
Metabolically inert 13C compounds were described in some of the earliest DNP-NMR work, which used the nascent technology in angiography and catheter tracking.60–62 More recently, these probes have been used in perfusion imaging, for example 13C urea. Urea is a natural end product of nitrogen metabolism in the human body, and one of the main components of urine. In the kidneys, urea is reabsorbed in the renal medulla and acts as an osmolyte as part of the natural water reclamation process. For HP imaging, the carbonyl of urea provides a long T1 species for imaging (Fig. 2A). HP 13C urea experiments have been used to determine tissue perfusion, in both static and dynamic studies.63 Urea has been used in conjunction with other probes as a co-polarized agent and potentially could be used to normalize for delivery in DNP studies since it is not metabolized on the time scale of the HP experiment.64 Recent work has shown that it can also be used to measure absorption in diuresis and assess kidney function.65 While many clinical studies employ CT and MR contrast agents, these tend to use high concentrations of iodinated contrast or Gd-chelates, which are not safe for patients with renal disease.66,67 Thus perfusion imaging using HP 13C urea has high potential for clinical translation. Other inert DNP probes include [U-2H9, 2-13C] methylpropan-2-ol68 and (bis-1,1-(hydroxymethyl)-[1-13C]cyclopropane-2H8) or HP001, the first HP agent used to study cerebral perfusion.62
3.2. Components of the DNP sample
A DNP sample preparation includes the 13C substrate to be polarized and an organic free radical in solution. This solution must form an amorphous solid on freezing, which may require the addition of a co-solvent. To increase polarization, a paramagnetic agent (often a Gd-chelate) may be used. Multiple 13C agents may be polarized simultaneously with minimal loss of polarization and T1.
3.2.1. Enriched 13C substrate
For in vivo and most in vitro applications, the molecule is enriched in 13C at the atom of interest. Since the natural abundance of 13C is only 1.1%, this increases the observable NMR signal by at least two orders of magnitude (not accounting for 13C–13C spin diffusion). One compelling feature of DNP-NMR is limited background signal, with a natural abundance 13C signatures (non-enriched nuclei) not generally observed in biologic applications. Several 13C-enriched metabolites and precursors are commercially available, although the cost of these DNP candidates can be prohibitively high. For this reason, natural abundance species can be used to answer critical questions regarding T1 and receptor binding, prior to investing in costly enriched substrates. For example, the binding of salicylic acid and ascorbic acid to albumin was studied via polarization of the natural abundance small-molecules, while the effect of hydrophobic binding on T1 was analyzed by polarization of natural abundance benzoic acid and mixing with varying concentrations of β-cyclodextrin.38,54
3.2.2. Organic free radical
As discussed, the DNP mechanism requires the presence of unpaired electrons, which are often provided as an organic radical. In a typical experiment, irradiation of the electron paramagnetic resonance (EPR) spectrum of the radical with microwaves induces spin polarization transfer to the nucleus of interest. A narrow EPR line-width allows higher nuclear polarization when the line-width is larger than, or comparable to the nuclear Larmor frequency. Fig. 2B summarizes the organic radicals applied to DNP. The first, and most common radicals used for fast dissolution DNP-NMR are the trityls,69 with several versions employed depending on the solvent used to prepare the sample. The most water-soluble, and versatile of these is OX063. Nitroxides (e.g., TEMPO),70 1,3-bisdiphenylene-2-phenylallyl (BDPA),71 2,2-diphenyl-1-picryl-hydrazyl (DPPH),72 and 2,6-di-tert-butyl-α-(3,5-di-tert-butyl-4-oxo-2,5-cyclohexadien-1-ylidene)-p-tolyloxy (galvinoxyl)73 and their derivatives have also been studied. Recently, rigid biradical systems using nitroxides have been constructed (bTbk and relatives), for which large 13C enhancements were recorded; these were quite sensitive to the orientation of, and distance between, the NO moieties.74 One of the bTbk radicals studied (bTbk-py) used tetrahydropyran groups to increase aqueous solubility, and performed well in a glycerol–water solvent matrix. Incorporation of sulfoxides and sulfones into this biradical scaffold has also been used to increase solubility.75 Finally, mixtures of two radicals (a relative of BDPA and trityl) have been studied. Their EPR frequencies are separated by approximately the 13C nuclear Larmor frequency.76
3.2.3. Solvents and glassing
One of the requirements of DNP is formation of an amorphous solid on freezing of the 13C sample, to ensure homogeneous distribution of the radical. To accomplish this, a co-solvent such as glycerol, dimethyl sulfoxide (DMSO), or dimethylacetamide is usually added to aqueous preparations. The solvent and glassing agent are chosen to maximize the concentration of the 13C agent. A high sample molarity both enhances 13C–13C spin diffusion during polarization, and allows a more concentrated solution following dissolution.77 One strategy that has been used for zwitterionic compounds (e.g., amino acids) at high concentrations has been to generate their corresponding sodium or chloride salts, by addition of NaOH or HCl.78 In its present embodiment, the DNP technique is inherently dilutional, and high metabolite concentrations are needed for in vivo studies. Approaches to minimize the dilution of HP analytes include use of immiscible liquids for the melting and flushing of the DNP sample; this significantly reduces the amount of aqueous solvent required.79
Another approach to maximize 13C–13C spin diffusion is use of enriched 13C solvents in the DNP sample.80 [1-13C] sodium pyruvate was dissolved in 13C-enriched DMSO, and the solution doped with the OX063 trityl radical. For this system, the authors determined that the build-up time (τ) for polarization of the sample in 13C-enriched DMSO was approximately twice as fast as that observed for an identical sample using natural abundance DMSO. However, the absolute enhancements recorded in solution were nearly identical for the two samples. These findings suggest that spin diffusion is the mechanism responsible for propagation of nuclear spin surrounding paramagnetic centers, altering the kinetics of DNP in this system, but not affecting the overall polarization magnitude. The extension of these results to other spin systems/solvents may increase the efficiency of the DNP process.
3.2.4. Use of Gd-chelates
A recent development is the addition of Gd-chelates to the DNP sample, which has been shown to increase polarization. Gd3+ doping was accomplished via addition of gadolinium complex of 10-(2-hydroxy-propyl)-1,4,7,10-tetraazacyclododecane-1,4,7-triacetic acid (gadoteridol) to [1-13C] pyruvic acid samples containing the OX063 trityl, 4-oxo-TEMPO, and BDPA.81 In these experiments, the concentration of Gd-chelate was varied from 0–8 mM, with the solid-state polarization initially increasing, peaking at 1–2 mM, and decreasing with higher Gd-chelate concentrations. A 300% increase in solid-state polarization for the pyruvic acid-OX063 sample was observed following Gd-doping, versus only 5–20% for the other radicals. Improvement in the DNP-enhanced NMR intensity with Gd3+ doping has been attributed to the shortening of the electronic spin–lattice relaxation time T1e. Use of Gd-chelates to increase signal enhancements can be problematic in solution, since these paramagnetic agents may also shorten the T1 of the 13C nucleus of interest, thereby limiting its observable lifetime in MR applications.82 This is particularly important at low field strengths where the relaxivity of many lanthanide chelates is higher. Interestingly, Johannesson et al. observed only a modest effect on polarization when [1-13C] pyruvate was polarized at 4.6 T with 1.5 mM Gd-chelate.45 This finding suggests that the effect of Gd-chelates on DNP may be field-dependent, and warrants future study. Careful evaluation of these effects in vitro is suggested prior to considering use of Gd-chelates in biologic systems.
3.2.5. Multi-metabolite polarization
The chemical shift dispersion of metabolites in the 13C spectrum allows several probes and their products to be observed simultaneously, both in vitro and in vivo.83 Multi-metabolite polarization can be accomplished with minimal effect on polarization and T1. Fig. 4 depicts HP [1-13C] pyruvate, [1,4-C2] fumarate, 13C urea, and 13C bicarbonate in solution at 11.7 T. These agents could potentially be used to study lactate dehydrogenase (LDH) activity, necrosis, perfusion, and pH in the same MR imaging experiment. For several in vivo studies, 13C urea (or other biochemically inert agent) has been co-polarized with the metabolite of interest to determine the role of perfusion, which is often altered in angiogenic tumors.64
Fig. 4.
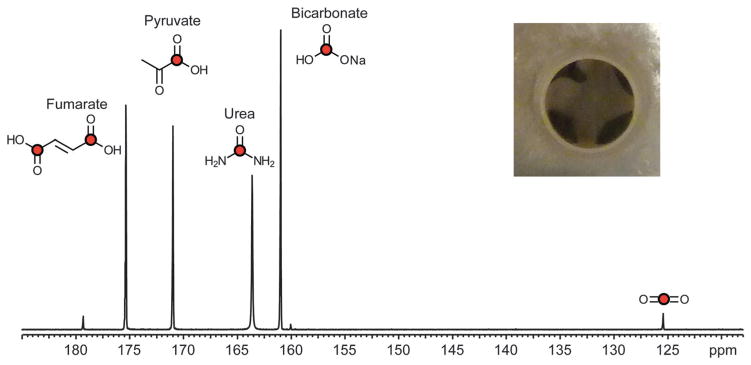
Multi-compound polarization demonstrates the simultaneous dissolution of [1-13C] pyruvate, 13C-bicarbonate, 13C-urea, [1,4-13C2] fumarate at 11.7 T. The inlay image is a top down view of a standard sample cup with all 4 compound preparations frozen together prior to placement in the hyperpolarizer. Adapted from ref. 83.
4. Chemical structures: carbonyls and beyond
Most 13C DNP substrates studied have been carbonyls, including carboxylic acids, ketones, esters, and amides. The classes of chemical structures polarized by DNP are summarized in Table 3. Carboxylic acids in particular are (1) abundant in endogenous molecules, (2) typically water-soluble, (3) often amenable to 13C enrichment, (4) have longer T1’s, and (5) are involved directly in, or positioned near sites of biochemical modification. This last feature is critical, as most HP MR strategies rely on chemical shift to observe reactions in vitro and in vivo. The dicarbonyl structure of pyruvic acid (seen in other DNP substrates, e.g., dehydroascorbic acid or benzoylformic acid) has a carboxylic acid at the 1-position and a ketone at the 2-position, and both sites have been 13C-enriched for metabolic studies. [1-13C] pyruvate has a long T1 at clinically relevant field strengths (60 s at 3 T) due to weak dipole–dipole interactions. Its conversion to other acids, lactate, alanine, and bicarbonate is easily observed spectroscopically in a variety of biologic systems. [2-13C] pyruvate is labeled at the adjacent ketone position and as expected has a lower T1 (50 s at 3 T) due to stronger coupling with nearby spins. In biologic systems with a high rate of oxidative phosphorylation, conversion of HP [2-13C] pyruvate to [1-13C] citrate and [5-13C] glutamate is observed84 (Fig. 5).
Fig. 5.

Biochemical scheme of labeling resulting from the injection of HP pyruvate. Carbons that have been observed via metabolism of HP substrates are labeled. Red dots indicate labeling from the C1 of pyruvate in the first pass of metabolism. Yellow dots indicate the fate of the C1 carbon if it were to enter through pyruvate carboxylase and progress backward to fumarate. At this point, the label can scramble due to symmetry. The blue dots indicate the labeled intermediates derived from metabolism of C2 pyruvate. TCA has been abbreviated for the purposes of clarity, though the necessary enzymes are listed and cofactors have been omitted. Abbreviations: LDH – lactate dehydrogenase (EC 1.1.2.4), ALT – alanine transaminase (EC 2.6.1.2), CA – carbonic anhydrase (EC 4.2.1.1), PDH – pyruvate dehydrogenase complex (EC 1.2.4.1, 2.3.1.12 and 1.8.1.4), CAT – carnitine o-acetyltransferase (EC 2.3.1.7), PC – pyruvate carboxylase (EC 6.4.1.1), CS – citrate synthase (EC 2.3.3.1), aconitase (EC 4.2.1.3), IDH – isocitrate dehydrogenase (EC 1.1.1.42), OGDC – oxoglutarate dehydrogenase complex (EC 1.2.4.2), SCS – succinyl coenzyme A synthetase (EC 6.2.1.4), SQR – succinate dehydrogenase (EC 1.3.5.1), FH – fumarate hydratase (EC 4.2.1.2), MDH – malate dehydrogenase (EC 1.1.1.37), AST – aspartate transaminase (EC 2.6.1.1), GLDH – glutamate dehydrogenase (EC 1.4.1.2). CoA – coenzyme A.
Several 13C esters have been polarized using the DNP technique. These may correspond to an endogenous metabolite, for example the lactone [1-13C] dehydroascorbate employed in redox applications.85,86 Alternatively, a non-endogenous ester that is the precursor of a metabolite of interest may be used. This is a “pro-drug” strategy that has been exploited in other imaging applications. For example, [1-13C] ethyl pyruvate has been used to image the anesthetized rat brain, taking advantage of increased lipophilicity to cross the blood–brain barrier (BBB).87 This agent is reasonably well-tolerated in animals, and has been shown to be neuroprotective in a cerebral ischemia model.88 Rapid and preferential uptake into brain was shown in rats, as well as the metabolites [1-13C] pyruvate and [1-13C] lactate, which are formed by hydrolysis of the ethyl ester (to pyruvate and ethanol) and subsequent conversion to [1-13C] lactate. These steps are depicted in Fig. 6. For esters, controlling the dissolution conditions is critical to avoid saponification. Hurd et al. used NaOH in the dissolution media to intentionally generate a combination of both [1-13C] ethyl pyruvate and [1-13C] pyruvate,87 but a stable solution of the HP ester is also feasible.
Fig. 6.
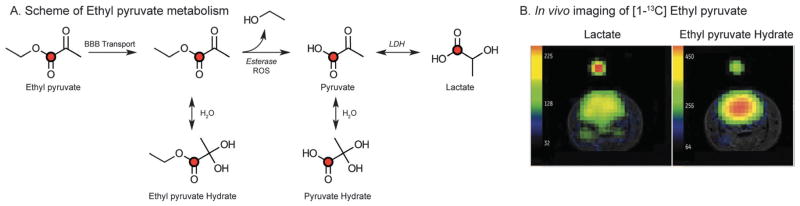
(A) Scheme of transport across the blood brain barrier (BBB) and subsequent metabolism of ethyl pyruvate. Ethyl pyruvate can be hydrolyzed by either esterases or reactive oxygen species (ROS). LDH – lactate dehydrogenase. (B) Representative axial imaging of a normal rat brain demonstrating the distribution of HP ethyl pyruvate hydrate and subsequent lactate generated at 3 T. HP images are overlaid on standard T2-weighted anatomic images. Adapted from ref. 87.
Although carbonyls have dominated the DNP literature, the viability of other chemical structures has been established.41,89 Non-carbonyl structures with sufficient T1’s for DNP are common in biomolecules, and often commercially available (for example, the hemi-ketal [2-13C] fructose).90 One limitation is the synthetic feasibility of 13C enrichment. For example, the tocopherol structure (vitamin E) has several carbons without directly attached protons, with potential applications to study reduction/oxidation (redox) chemistry (Fig. 7). In fact, 13C enrichment of numerous atoms in α-tocopherol has been achieved.91 However, synthesis of an appropriate 13C-enriched molecule at a long-T1 site might prove difficult, especially at reasonable cost. Fortunately, for some applications natural abundance substrates are appropriate for DNP-NMR. Another strategy used is to increase the T1 of a 13C nucleus of interest by additional substrate enrichment. This has been accomplished by partial, or complete deuteration of molecules allowing DNP polarization of aliphatic 13C. These approaches will be further described in the following section.
Fig. 7.

Chemical structure of tocopherol (vitamin E) demonstrating carbons with long T1s for potential labeling and hyperpolarization. These carbons are indicated by the red dots.
5. Increasing T1 by deuterium enrichment
Substitution of deuterium (2H) into molecules for analytical study, above its natural abundance (0.0156%), has historically been used to follow chemical and biochemical reactions,92 and to characterize molecular structure from small molecules93 to proteins.94 As a spin 1 nucleus, deuterium is a quadrupole and exhibits scalar coupling (J-coupling) with other spin 1/2 nuclei using the standard 2n + 1 rule. The splitting pattern is then determined by the J-coupling constant, and in the case of 13C–2H bonds is on the order of 30 Hz. 2H substitution of exchangeable protons permits exchange experiments in different solvent systems, providing a means to study the rates of these phenomena. More frequently, 2H enrichment is performed at non-exchangeable sites, so 2H can be followed through chemical and or biochemical conversions.
While HP MR affords a huge signal-to-noise ratio (SNR) increase, the lifetime of this signal is determined by the apparent T1 relaxation rate of the nucleus of interest. One strategy for increasing the T1 is to design chemical systems that are devoid of neighboring spin 1/2 nuclei, such as carboxylate carbons. Another viable approach is the replacement of directly attached, or 2-bond spin 1/2 nuclei with deuterium. This has been used in multiple HP probes and has resulted in a dramatically increased T1 in some cases. It is important to note that the effect of deuterium substitution on T1 is a function of the coupling of the 1H it replaces, and in the context of stronger coupling can have a greater effect. Although the replacement of directly-bonded (strongly J-coupled) protons with 2H would be expected to have the highest impact on T1, in this case 2H substitution also leads to splitting. This, in turn, can decrease overall SNR when moving to field strengths where J is large relative to ω. For long-range protons (>1 bond, weakly J-coupled), substitution with 2H has a modest effect on T1, and no observable splitting.
In addition to splitting of the 13C resonance of interest, 2H substitution also has a significant impact on metabolism in biologic symptoms due to the kinetic isotope effect, which has been considered in the context of HP 13C studies.95 The isotope effect may be primary or secondary. The primary isotope effect describes rate differences when the isotopic enrichment is in a chemical bond that is formed or broken in the rate-limiting step of a reaction.96 In contrast, the secondary isotope effect describes rate differences observed when the isotopic substitution is remote from this bond. For the primary isotope effect, the heavier atom results in a higher activation energy for bond cleavage, lowering the measured reaction rate. In the latter case, electronic effects such as induction and hyperconjugation change the vibrational frequency of a remote chemical bond.97–99 Rarely, a deuterated molecule will react faster than its 1H analog.100 The 2H-enriched metabolites evaluated by DNP-NMR are expected to (1) be dominated by the primary isotope effect, and (2) react more slowly than their 1H counterparts. Of note, isotopic rate changes are most pronounced when the mass change is greatest. Substitution of 1H by 2H represents a doubling of mass, versus the 8% increase when 12C is replaced by 13C. Therefore 13C enrichment should not significantly impact the rate of biochemical reactions.
The kinetic isotope effect may impact the ability to observe certain deuterated 13C metabolites by DNP-NMR. In some cases, 2H substitution may retard the rate of metabolite formation. Alternatively, the isotope effect may actually aid in metabolite accumulation, if the rate of its subsequent conversion is decreased. The isotope effect may be partially responsible for the observation of dihydroxyacetone phosphate (DHAP) following metabolism of HP [U-13C, U-2H] glucose in yeast.101 In glycolysis, fructose-bisphosphate aldolase splits the diphospho-hexose (fructose 1,6-bisphosphate, F1,6P) into two triose sugars, DHAP and glyceraldehyde 3-phosphate (GA3P). GA3P is predominantly taken downstream in glycolysis and the enzyme triosephosphate isomerase (TPI) catalyzes the rapid interconversion of DHAP and GA3P. Deuterium substitution in [1(R)-2H] DHAP leads to a 2.9 times smaller kcat for TPI,102 versus natural abundance DHAP. If the isotope effect is partially responsible for the HP DHAP signal observed in yeast, 2H substitution might be viewed as a kinetic “trapping” mechanism not unlike strategies commonly employed in PET.103
5.1. HP [2-13C, 2-2H4] choline
One of the first HP molecules to be investigated as a deuterated species was 15N enriched choline. Choline has been a staple of in vivo 1H MRSI investigation as its MR signature is seen in a wide range of cancers,104 and is readily visualized in vivo due to the sensitivity afforded it by 9 magnetically equivalent protons. For HP applications, both 15N and 13C enriched versions of the molecule have been studied. Enrichment with 15N is particularly attractive, since the 15N of the trimethylamine choline head group has a T1 on the order of 200 s. The J(15N,1H) is approximately 0.8 Hz and when substituted with 2H, the [1-15N, 2H9] choline has a T1 of approximately 390 s split into a triplet, since all 9 deuteriums are equivalent.105 In vivo applications of this molecule have been hindered by a small chemical shift difference to its products, including phosphocholine (δ15N = 43.6 ppm, Δδ≈0.2 ppm) and its relative toxicity, with the LD50 of intravenous choline chloride reported as 53 mg kg−1 body weight.106 Given this extremely long T1, the deuterated tri-methylamine of choline could play a role as a reporter molecule when integrated into other HP probe systems. Recent work has attempted to use the 13C labeled and deuterated side chain moieties of choline, [2-13C, 2-2H4] choline.107 While it exhibits a relatively long carbon T1 relaxation time (Table 3), a complex deuterium coupling pattern may limit its utility.
5.2. HP [2-13C, U-2H] fructose
For the hemi-ketal carbon of fructose, polarized resonances are observed for each of the predominant 5 and 6 membered ring forms (Fig. 8).90 These have similar T1 relaxation rates and polarizations since they are in fast isomeric exchange in solution. Additionally, these resonances are all approximately singlets since the long range J-coupling through the ring is small as compared with typical one bond C–H coupling constants. When all exchangeable protons of the fructose molecule are substituted for 2H, the T1 relaxation time increases more than 2-fold at 11.7 T, from 16 to 34 s. Although the T1 increases, importantly, the carbon resonances remain approximately singlets, even at high field, since the J-coupling constant to the ring deuterons is small.
Fig. 8.
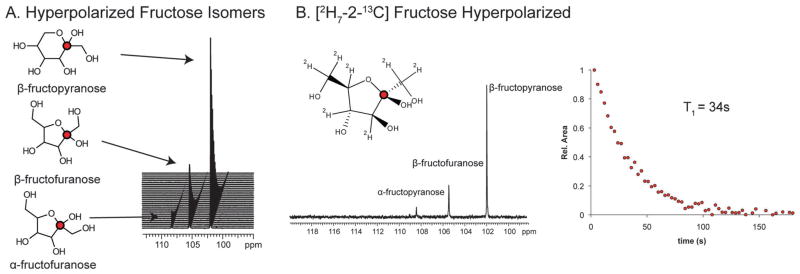
(A) Chemical structures of fructose isomers with accompanying HP resonances. HP [2-13C] fructose was dissolved in 1× phosphate buffered saline (PBS, pH = 7.6) to a concentration of 5 mM. The dynamic spectra were acquired on an 11.7 T with a temporal resolution of 3 s and flip angle of 5°. Adapted from ref. 90. (B) Chemical structure of the furanose isomer of fructose uniformly deuterated with a HP spectrum acquired on 10 mM fructose in PBS (pH = 7.5) using a flip angle of 5°. Corresponding apparent T1 decay of the HP signal is shown at the right, nearly 34 s in solution.
Given the presumed role of fructose in diabetes,108 fatty liver disease,109 and certain forms of cancer,110 HP [2-13C] fructose holds strong potential for clinical translation, especially with the enhanced T1 observed for the deuterated species. A study in the transgenic adenocarcinoma of the mouse prostate (TRAMP) model suggested increased phosphorylation of HP [2-13C] fructose to [2-13C] fructose-6P, although in vivo results were limited by inadequate chemical shift separation between the two metabolites.90 In yeast, several metabolites were seen following application of [2-13C] fructose, including [2-13C] dihydroxyacetone phosphate (DHAP) as well as signals arising from anabolic reactions, corresponding to [2-13C] glucose-6P and [5-13C] fructose-1,6BP.101 Glucose-6P is formed from fructose-6P by the activity of phosphofructose isomerase, while [5-13C] fructose-1,6BP results from the aldol condensation of DHAP with [2-13C] glyceraldehyde-3P. The detection of these metabolites in relevant cell-lines and animal models has not been reported, but should be facilitated by partial or complete deuteration of the 13C species.
5.3. HP [U-13C, U-2H] glucose
As highlighted by the widespread clinical use of 18F-FDG, glucose is of great interest in metabolic imaging, particularly for cancer. However, its lack of long T1 carbons limits HP MR applications.48,49 Substitution of the non-exchangeable protons with 2H significantly increases T1 of glucose carbons for [U-13C, U-2H] glucose, reported as approximately 12 s for 13C1–5 and 10 s for 13C6.101 Allouche-Arnon et al. have also studied the effect of concentration, magnetic field, and variable enrichment on T1.111 A large polarization (approximately 25%) was obtained for this probe using the DNP technique. Several recent studies have examined the in vitro metabolism of [U-13C, U-2H] glucose, in living yeast (Saccharomyces cerevisiae), as well as bacteria (Escherichia coli).95,101 In addition, the role of sulfur(IV) compounds (generally referred to as “sulfites”) in glycolytic inhibition has been explored.112 These experiments were remarkable for several reasons. First, a very large number of metabolites were observed, due to the high glycolytic activity of these organisms, and careful experimental design. Following administration of the HP [U-13C, U-2H] glucose dietary substrate, metabolism could be followed along entire metabolic pathways with accumulation of the corresponding end-products. The relevant metabolic pathways are summarized in Fig. 9. For Saccharomyces cerevisiae, these end-products were primarily ethanol and CO2. Interestingly, the delay between CO2 and HCO3− formation was resolved in this system, which was not seen in vivo by Gallagher et al., due to the high activity of carbonic anhydrase in animals.37 For Escherichia coli, significant flux through pyruvate dehydrogenase (PDH) was observed with decarboxylation of pyruvate to acetyl-CoA, followed by formation of acetate. In addition, a significant resonance representing formate was seen, representing the activity of pyruvate formate lyase, which converts pyruvate to formate by a radical mechanism.113
Fig. 9.
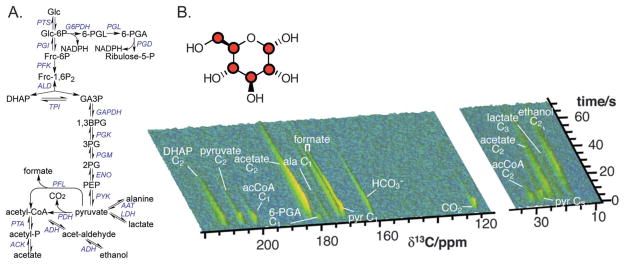
(A) Overview of metabolism observed in Escherichia coli interrogated using HP [U-13C, U-2H] glucose. The reactions of glycolysis, the pentose phosphate shunt, and fermentation are displayed. These pathways are nearly identical to those observed in yeast (Saccharomyces cerevisiae). (B) Time-resolved HP 13C NMR spectra recorded every 0.5 s demonstrating generation of 13C metabolites in real time. The overall signal decreases with loss of hyperpolarization. Adapted from ref. 95. Abbreviations: 1,3BPG – 1,3 bisphosphoglycerate, 2PG – 2-phosphoglycerate, 3PG – 3-phosphoglycerate, 6-PG – 6-phosphogluconate, 6-PGL – 6-phospho-Δ-gluconolactone, AAT – alanine aminotransferase (EC 2.6.1.2), Ac – acetate, Ac-CoA – acetyl-CoA, ACK –acetyl kinase (EC 2.7.2.1), ADH – alcohol dehydrogenase (EC 1.1.1.1), ALD – aldolase (EC 4.1.2.13), DHAP – dihydroxyacetone phosphate, ENO – enolase (EC 4.2.1.11), Frc-1,6P2 – fructose-1,6-bisphosphate, Frc-6P – fructose-6phosphate, G6PDH – glucose-6-phosphate dehydrogenase (EC 1.1.1.49), GA3P – glyceraldehyde 3-phosphate, GAPDH – glyceraldehydes-3-phosphate dehydrogenase (EC 1.2.1.12), Glc – glucose, Glc-6P – glucose-6phosphate, LDH – lactate dehydrogenase (EC 1.1.1.27), PDC – pyruvate decarboxylase (EC 4.1.1.1), PEP – phosphoenolpyruvate, PFL – pyruvate formate lyase (EC 2.3.1.54), PFK – phosphofructokinase (EC 2.7.1.11), PGD – 6-phosphogluconate dehydrogenase (EC 1.1.1.43), PGL – 6-phosphogluconate lactonase (EC 3.1.1.31), PGK – phosphoglycerate kinase (EC 2.7.2.3), PGM – phosphoglycerate mutase (EC 5.4.2.1), PTA – phosphotransacetylase (EC 2.3.1.8), PTS –glucose-specific enzyme II of the phosphotransferase system (2.7.1.63), Pyr – pyruvate, PYK – pyruvate kinase (EC 2.7.1.40), TPI – triosephosphate isomerase (EC 5.3.1.1).
Several other resonances were more characteristic of metabolism in mammals. These included fructose 1,6-bisphosphate, the aldolase products of DHAP and glyceraldehyde 3-phosphate (GA3P), phosphoenolpyruvic acid (PEP). The metabolites most familiar to DNP researchers were also seen, i.e., lactate, pyruvate and alanine. Finally, the resonances of the pentose phosphate shunt 6-phosphogluconate (6-PG) and ribulose 5-phopshate were observed.
These studies were also remarkable for the resonances that were not seen. It is surprising that fructose 6-phosphate was not observed, given that its subsequent conversion by phosphofructokinase is one of the most tightly regulated steps of glycolysis.114 Phosphofructokinase may have not been significantly inhibited under the experimental conditions, or the resonance of fructose 6-phosphate may overlap with that of fructose 1,6-bisphosphate. In other cases, it appears likely that glycolytic intermediates were not observed due to fast turnover. For example, 1,3-bisphosphoglycerate (1,3BPG), 3-phosphoglycerate (3PG) and 2-phosphoglycerate (2PG) were not detected, which may be secondary to the high activities of glyceraldehyde-3-phopsphate dehydrogenase (GAPDH), phosphoglycerate kinase (PGK), and phosphoglycerate mutase (PGM) respectively.115 Furthermore, in Saccharomyces cerevisiae although ethanol was readily seen, its direct precursor acetaldehyde was not. This finding is consistent with rapid flux through alcohol dehydrogenase (ADH).
Careful isotopic enrichment of glucose may allow further delineation of these pathways, and promote clinical translation of 13C-enriched glucose. Despite the dramatic results achieved with [U-13C, U-2H] glucose in vitro, a universally 13C-labeled, perdeuterated analog is not ideal for several reasons. First, the isotope effect will affect the rate of biochemical reactions, most dramatically when a bond to 2H is broken or formed. Second, the complex J-coupling observed confounds the spectrum and limits SNR. Finally, the T1 of 13C nuclei may be reduced by dipolar interactions with adjacent 13C nuclei. This was explicitly studied by comparing the T1’s of [U-13C, U-2H] glucose carbons to those of [U-2H] glucose.49 In the natural abundance case, for which the probability of a given position being occupied by 13C is 1.1%, the probability of adjacent 13C–13C nuclei is negligible. The T1’s recorded for [U-2H] glucose were 12.2 ± 1.3 s, versus 8.9 ± 1.4 s for [U-13C, U-2H] glucose. As applications for 13C glucose continue to emerge, 2H and 13C substitution can be tailored to the specific pathway under investigation.
5.4. HP [5-13C, 4-2H2] glutamine
Growing interest in glutaminolysis, as well as the role of 2-hydroxygluterate (2HG) in cancer metabolism, has sparked the need to develop noninvasive imaging markers for the rate of glutamine uptake and metabolism.116,117 In the first demonstrations of HP glutamine, although the relaxation time of the C1 carbon was substantially longer than that of the C5 (Table 3), the chemical shift change of the C5 when converted to glutamate was large enough (Δδ≈ 3.4 ppm) to permit observation of the conversion.118 The relaxation rates of both glutamine and glutamate may hinder their translation and recent work has investigated the synthesis of partially deuterated glutamine.119 [5-13C, 4-2H2] glutamine has been produced in a 7-step synthetic scheme with the resulting T1 nearly 2-fold longer for the C5. Hyperpolarization of the partially deuterated probe permitted the visualization of real-time generation of deuterated HP glutamate in brain tumor cells. As with fructose, while the C5 carbon of glutamine has no directly attached protons, elimination of the long range J-coupling permits a dramatic lengthening of the carbonyl T1.
5.5. HP [3-13C, 2H3] pyruvate
The vast majority of DNP studies employ [1-13C] pyruvate, although there is increased interest in [2-13C] pyruvate allowing detection of downstream metabolites in the mitochondria. Since the C3 carbon is protonated, its T1 is much shorter making [3-13C] pyruvate suitable for metabolic studies at thermodynamic equilibrium, but not DNP applications. Recently, [3-13C, 2H3] pyruvate was synthesized by chemical exchange in D2O/ammonium carbonate and polarized by the usual method.120 Following incubation with alanine transaminase [ALT] and glutamate, direct detection of 13C-β-L-alanine was observed, with SNR comparing favorably with that obtained for 13C-α-L-alanine seen in the [2-13C] pyruvate case. ALT-catalyzed D/H exchange at the alanine methyl group was also noted.
5.6. Other deuterated species for DNP
As discussed, the DNP technique has been used to rapidly obtain 13C spectra for large polypeptides and proteins that were partially deuterated.56 Secondary polarization of amino acids and short polypeptides (e.g., Arg-Gly-Asp or “RGD”) has also been performed by acylation of their N-termini using [1,1′-13C2, 2H6] acetic anhydride, which resulted in significantly longer T1’s than those obtained for the 1H electrophile.121 Recently, 29Si has emerged as an attractive nucleus for DNP applications, and controlled incorporation of deuterons was shown to dramatically increase sensitivity in a series of organosilica materials that contain surface propylazide fragments.122 Both [2H9]-TMS and [2H3]-methoxy groups were used to coat the silica surface, resulting in significantly larger T1’s determined by both direct acquisition and cross-polarization. For perfusion imaging, both HP001 and perdeuterated 13C 2-methylpropan-2-ol have incorporated deuterium to lengthen T1.68,123,124 As discussed in the next section, [13C, 2H3]-p-anisidine was developed to target hypochlorous acid (HOCl), employing a long-lived deuterated methoxy group.125
6. Beyond T1-the singlet state
Another approach to extend HP spin lifetimes in solution includes conversion of HP magnetization into nuclear singlet order, where many relaxation mechanisms do not apply. Conceptually, this approach steps between symmetry and asymmetry. In the case of a symmetric molecule with 2 adjacent spin 1/2 nuclei, the singlet and triplet states are disconnected. This allows the singlet state to experience dramatically reduced relaxation, but it is difficult to populate and also observe. In the asymmetric case, the triplet and singlet states are connected, but a long-lived singlet state is difficult to maintain. Accessing the singlet state has been achieved via field cycling, continuous irradiation, and chemical modification,39 although these are not readily feasible for in vivo imaging. Recently, a pulse sequence has been designed to populate the singlet state in a symmetric molecule, which also contains couplings that break magnetic equivalence.126 In all cases a preparation is necessary to put the spins in the singlet state, typically labeled as M2S, followed by a time-reversed S2M sequence to bring the magnetization back into the triplet state to observe.
Pileio et al. reported a method for converting magnetization into singlet order and back again, that is compatible with the DNP technique.127 The authors used a 15N-labelled nitrous oxide (N2O) spin system; audio-frequency pulse trains were used to temporarily store magnetization as low-field singlet order. The decay measured outside the NMR magnet beyond 500 s had a constant of 25 ± 3 minutes, which is an order of magnitude larger than the conventional T1’s for the 15N nuclei. This method may be applied to molecules containing two spin-1/2 nuclei, which can exist as singlet and triplet nuclear spin isomers, and has been extended to 13C molecules on a hardware setup typical of in vivo dissolution-DNP.128 A sample of cyclohexyl-isopropyl-1,2-13C2-oxalate-2H18 (Fig. 2A) was HP by the usual method and MRI experiments were conducted on a 4.7 T preclinical horizontal bore scanner. When HP magnetization was converted into the singlet order, the resulting decay of MR signals (at later times) were fit to an exponential time constant of 77 ± 12 s, versus a measured time constant T1 of 54 ± 2 s by conventional T1 measurement at this field strength. Although only a modest improvement, this work demonstrated the ability to extend HP signal lifetimes beyond those dictated by T1. This was achieved using a molecule in which the two 13C spins are highly coupled, having a spin-spin scalar coupling constant greater than the shielding-dependent frequency difference between the nuclei. However, as the authors describe, to access the singlet order a chemical shift difference between the two nuclei is required.
Storage of singlet magnetization has been extended further by incorporating singlet-friendly species into potential substrates of interest. Feng et al. demonstrate that for a molecule such as diethyl oxalate-13C2, 13C labeled at the C2 and C3 positions, a duality of symmetries can be created for singlet storage.126 In this scenario, the 13C and 1H pairs are symmetric around the same inversion center, with a singlet–singlet state (SS, with no dipole-allowed transitions to other states) and an additional triple–triplet state (TT). In this 4 spin system (AA′XX′), with the appropriate scalar couplings, the SS and TT states can communicate, allowing for storage from the TT to the SS. Taking advantage of this may provide a means of incorporating singlet state storage moieties into molecules of interest for hyperpolarization. In its current form, the technique is applicable to a limited class of chemical structures, and its relevance in biologic systems remains to be seen.
7. Observing fast chemistry by DNP-NMR
The marked MR signal enhancement afforded by DNP (up to 105) has allowed observation of fundamental chemistry and biochemistry both in vitro and in vivo. Due to T1-dependent signal decay of the HP 13C signals, DNP-NMR is well-suited to the study of fast chemical reactions, and transient/dynamic molecular interactions. Chemical reactions that have been studied in vitro include polymerization, acetylation, oxidation, reduction, hydration/dehydration, and acid–base. Binding in aqueous solution has also been studied by DNP-NMR, using the T1-mediated loss of HP ligand signal seen with receptor binding. These methods are amenable to studying relatively weak interactions at high SNR and short experiment times, and may be useful for both drug discovery and in vivo imaging.
7.1. Hydration/dehydration
The most well-known reaction to a chemist studying HP [1-13C] pyruvate is its reversible hydration at the 2-position, which is both temperature and pH-dependent.124 Higher percentages of the hydrate exist when pH < pKa (2.2 for pyruvic acid), with lower percentages seen on the basic side. The rates of hydration and dehydration of pyruvate have been calculated with a broad range of catalysts. At near-physiologic pH, pH > pKa and the hydrate is <8%. The nonmetabolically-active HP 13C pyruvate hydrate is readily observed in HP [1-13C] pyruvate MR studies, as a resonance approximately 8 ppm downfield from the dominant keto resonance. For pyruvate esters, e.g., ethyl pyruvate used in HP 13C brain studies, the predominant form in water is the hydrated species.87
The hydration of CO2 to carbonic acid, and subsequent deprotonation to bicarbonate may also be interrogated using HP DNP-NMR, as well as the reverse reactions.37,129 As discussed further in Section 8 (Essential Biochemistry of DNP), HP 13C bicarbonate may be used to determine the pH of a solution, by integrating the 13C bicarbonate and 13C CO2 resonances and employing the Henderson–Hasselbalch equation. This exchange is rapid even without catalysis by carbonic anhydrase, with the rate constant describing the flux between bicarbonate and CO2 in solution estimated as 0.1 s−1 using magnetization transfer methods.37
7.2. Oxidation
Reactive oxygen species (ROS) are implicated in a variety of diseases, including cancer, reperfusion injury, and neurodegeneration. Recent studies have also suggested a positive role for ROS in normal cell-signaling, mediated by the NADPH oxidase (NOX) enzymes.130 A reaction-based approach was developed to detect H2O2 based on its oxidation of an α-ketoacid (13C-benzoyl-formic acid or BFA) to a carboxylic acid (13C-benzoic acid), readily observable by chemical shift35 (Fig. 10). The oxidative decarboxylation of BFA was also shown to be relatively selective for H2O2 over other relevant ROS, for example O2−, NO, and hydroxyl radical using analytical HPLC. The reactivity of BFA towards H2O2 is easily manipulated by ring-substituents, potentially facilitating next-generation probes for in vivo use.
Fig. 10.
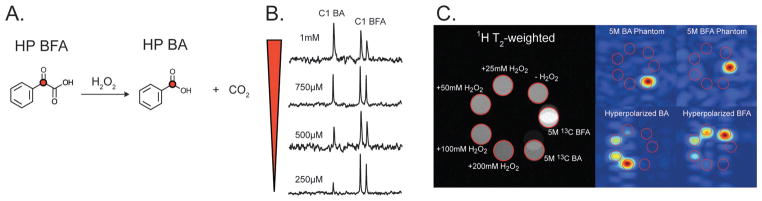
(A) Reaction scheme of HP [2-13C] benzoylformic acid (BFA) reaction with H2O2 to form HP [1-13C] benzoic acid (BA). (B) With increasing concentrations of H2O2, a proportional amount of HP BA is formed. These spectra were acquired with a single 90° pulse after incubation of HP BFA with H2O2 at 11.7 T. (C) Phantom images of 5 M thermally polarized 13C BFA in H2O, 5 M thermally polarized 13C BA in DMA, and 20 mM HP 13C BFA in 100 mM phosphate, 0.3 mM EDTA buffered at pH 7.8 with 0, 25, 50, 100, and 200 mM H2O2. HP Images were acquired after ~37 s of reaction with H2O2 with a TR = 150 ms, FOV 40 × 40 × 40 mm, 16 × 12 × 12 matrix, and zero-filled to a final resolution of 1.25 mm isotropic, at 14 T. Adapted from ref. 35.
More recently, a deuterated DNP probe was developed to target hypochlorous acid (HOCl),125 an oxidizer that reacts with a large range of biomolecules in vivo. The chemical structure of [13C, 2H3]-p-anisidine (Fig. 11) incorporates a fully deuterated 13C methoxy group. The basic mechanism of this probe is an alkoxy/aryloxy to alcohol conversion that has been used in a variety of environment-responsive chemical pro-drugs.131 Therefore, the deuterated methoxy group may find a number of interesting applications, in the development of probes that interrogate ROS, pH, or a specific enzyme activity. In each case the liberated 13C product would be CD3OH, which has been reported to have a T1 of 32.9 s at 9.4 T. The reaction of [13C,D3]-p-anisidine with HOCl demonstrates the formation of CD3OH in the HP spectrum. This exciting result suggests that other long-T1 moieties might be employed in a similar fashion in HP chemical sensors. Practical considerations for in vivo applications, such as bio-orthogonality, sensitivity, and toxicity warrant further study.
Fig. 11.

(A) Reaction of [13C,D3]-p-anisidine with hypochlorous acid (HOCl), resulting in liberation of deuterated methanol. (B) Time-resolved 13C NMR spectra of a 1.7 mM solution of HP [13C,D3]-p-anisidine acquired every 4 seconds, using a 18° tip angle. The calculated T1 for this probe was 44.4 s (9.4 T, 37 °C). (C) 13C NMR spectrum of HP [13C,D3]-p-anisidine acquired 4 s after addition of HOCl (final concentration 20 mM), using a 90° tip angle. Adapted from ref. 125.
7.3. Reduction
HP [1-13C] dehydroascorbate (DHA), the oxidized form of vitamin C (VitC), has recently been developed as an endogenous redox sensor. The direct chemical reduction of HP [1-13C] DHA has been studied in vitro, using the water-soluble reducing agents NaBH3CN and reduced glutathione.85,86 In both cases, conversion to HP [1-13C] VitC depended on the concentration of the reducing agent. Interestingly, when NaBH3CN was added to a solution of HP [1-13C] DHA (1 major peak), several resonances were observed in the dynamic HP spectra. Following the DNP-NMR experiment, a spectrum at thermodynamic equilibrium was obtained revealing only the reduced VitC species (1 peak). Therefore, it is unclear what the multiple additional resonances observed in the HP spectra represent. Possibilities include semidehydroascorbate, the radical anion formed by a one-electron reduction, or tautomers of vitamin C, corresponding to transient species seen following reduction at the 2 or 3-positions.
7.4. Acetylation
Near quantitative acetylation of primary amines by HP [1,1-13C] acetic anhydride has been employed to transfer polarization to a biomolecule of interest by chemical means.40 This technique may be useful to (1) interrogate nucleophile-rich biofluids of interest (e.g., cerebrospinal fluid [CSF], urine) with high SNR, and (2) polarize substrates that are not amenable to direct polarization, either due to crystalline properties in solution or high molecular weight (e.g., peptides). Fig. 12 demonstrates the acetylation of an amino acid mixture using HP [1,1-13C] acetic anhydride and the T1-dependent signal loss for the various resolved N-acetyl adducts at 11.7 T. Recently, the fully deuterated analog [2H6, 1,1-13C] acetic anhydride was used to label the Arg-Gly-Asp or “RGD” peptide, a common motif in cellular recognition.121 The measured T1 of the 13C-RGD adduct was 5.4 s at 14 T, but >30 s at 3 T highlighting the effect of CSA on T1. The relevance of secondary polarization for in vivo applications is unclear, given the relatively modest signal enhancements obtained (on the order of 103 for N-acetylglycine).
Fig. 12.

(A) General strategy for secondary hyperpolarization of amino acids using prepolarized [1,1-13C] acetic anhydride. Red dots indicate HP carbons. (B) HP spectrum obtained when a buffered solution (100 mM phosphate, pH 7.8) containing the amino acids gly, ser, val, leu, ala (3.5 mM amino acid) is reacted with a 2-fold excess of HP acetic anhydride at 11.7 T. (B, top) Full spectrum (t = 0) including large peaks corresponding to unreacted acetic anhydride and hydrolysis product acetic acid, and acetylated amino acid products (outlined). (B, bottom) Dynamic HP spectrum with resolved acetylated amino acid products. (C) Thermal spectrum corresponding to the HP data in B. (C, top) After addition of Magnevist Gd-chelate to a final concentration of 5 mM, the only peaks observed correspond to [1-13C] AcOH and the previously observed acetylated amino acid products (outlined). (C, bottom) Expanded region of interest in the 13C spectrum. Adapted from ref. 40.
7.5. Polymerization
Hilty et al. have investigated the time-resolved spectroscopy of anionic polymerization reactions using DNP-NMR. The authors initially described formation of poly(ethyl-2-cyanoacrylate).132 A 50:50 (v/v) mixture of natural abundance ethyl-2-cyanoacrylate and methyl methacrylate containing BDPA radical were polarized using the usual technique, dissolved in THF, mixed with tetra-methylethylenediamine (TMEDA) and studied by NMR. Rapid formation of long polymer chains was indicated by the line-broadening of product peaks. In a more recent paper, the anionic polarization of styrene was observed by DNP-NMR.41 Although polystyrene can be synthesized by several methods, the anionic method was chosen to avoid formation of radical intermediates that might diminish the NMR signal by paramagnetic relaxation. For the DNP experiment, styrene monomer (natural abundance) was HP by the usual method, dissolved in dioxane, and mixed with the initiator sodium naphthalenide (NaC10H8) in THF. As described in Fig. 13, the reaction begins with dimerization of two styryl radical ions, and is followed by bidirectional propagation. Although the resulting HP 13C spectrum had a large contribution from the styrene monomer, additional resonances not seen in the styrene/polystyrene references at thermal equilibrium correspond to reaction intermediates. For these intermediates, the authors performed correlation experiments with selective inversion of a spin of interest, to unambiguously assign resonances to the anionic species. This is possible in DNP-NMR when two chemical species are transformed into each other.133,134 These findings are ground-breaking not only for their elucidation of living polymerization reactions, but also for the potential utility of DNP-NMR to study a variety of transient phenomena.
Fig. 13.

(A) Anionic polymerization using HP styrene. This scheme shows the propagation of polystyrene from bifunctional initiator in dioxane. (B) HP 13C NMR spectrum obtained when HP styrene is mixed with NaC10H8 initiator compared to the non-HP 13C spectra obtained for the synthesized polystyrene and for the styrene monomer. The * labels signify dioxane and THF resonances. A large number of peaks are observed in the HP 13C spectrum during polymer formation, which are not seen in the reference spectra obtained at thermal equilibrium. Correlation experiments with selective spin inversion were used to identify the chemical shifts of these reaction intermediates unambiguously. Adapted from ref. 41.
7.6. Study of molecular interactions
The study of molecular interactions in solution using NMR at thermodynamic equilibrium is well-established. Screening studies for ligand–receptor interactions in solution are usually ligand-directed and have employed both 1H and 19F NMR.135–137 Use of a 13C nucleus is attractive given the large 13C chemical shift range, but sensitivity has been limited by low natural abundance and γ. Hyperpolarization using the DNP technique has been suggested as a means to circumvent this problem, allowing 13C screening experiments that would be impractical at thermal equilibrium. In a proof-of-principle study, a HP ligand solution containing salicylate and ascorbate was mixed with human serum albumin.38 In the presence of the receptor, resonances corresponding to salicylate were not seen, while the ascorbate resonances are clearly visible (Fig. 14A). These effects are due primarily to T1-mediated HP signal decay, and the effect of exchange line-broadening. Attenuation of MR signal amplitude, line-broadening, and chemical shift changes in the presence of serum albumin were observed for HP salicylate in a separate experiment at an earlier time-point.
Fig. 14.

(A) Spectra of 200 mM HP salicylate and ascorbate at natural 13C isotopic abundance injected into buffer and into solutions of 50 mM human serum albumin at 9.4 T. Spectra are recorded 2 s after injections. 13C signals of the salicylate are detected in the binding reaction and show attenuated signal amplitude, line broadening and shift changes. Adapted from ref. 38. (B) Structure of the β-cyclodextrin–benzoic acid complex, as solved by X-ray crystallography and 13C NMR spectrum of natural abundance HP benzoic acid, obtained in a single 5° pulse at 36.4 mM (310 K, pH 7.8) at 11.7 T. All carbons are observed: C1-176.6 ppm, C2-137.3 ppm, C3,C7-129.8 ppm, C4,C6-129.3 ppm and C5-132.2 ppm. (C) HP 13C MR imaging experiment conducted at 14 T. (C, left) 1H imaging shows the orientation of tubes containing variable β-cyclodextrin concentration (0–10 mM final concentration). Also included is a [1-13C] benzoic acid phantom (5 M). The HP 13C MR imaging study was performed using a 3D frequency-selective sequence after administration of HP [1-13C] benzoic acid (final concentration 2.5 mM), and demonstrates loss of signal corresponding with increasing [β-cyclodextrin]. (C, right) Plot of HP [1-13C] benzoic acid MR signals observed with variable [β-cyclodextrin], quantified for the imaging experiment. Adapted from ref. 54.
The relationship between binding and T1 was studied explicitly using a model ligand–receptor system, namely the hydrophobic binding of benzoic acid to β-cyclodextrin, a cyclic sugar used in a variety of enzyme mimics.54,138 Natural abundance benzoic acid was polarized using the DNP method and combined with β-cyclodextrin, with T1’s calculated for varying concentrations of the ligand. The results were used to estimate logK, which was similar to that described previously for this ligand–receptor pair. In a second set of experiments, enriched [1-13C] benzoic acid was HP and mixed with solutions with varied concentrations of the cyclodextrin host. A 3D frequency selective echo-planar imaging method was then used to image the HP benzoate, with attenuation of signals observed with the host present. Signal changes correlated with the cyclodextrin concentration (Fig. 14C). These findings suggest that HP MR may be used to determine the presence, and concentration of a relevant ligand–receptor pair in vivo, for example a polarized steroid and androgen receptors expressed by prostate cancer.
8. Essential biochemistry of DNP
The enzymatic conversion of HP probes plays a crucial role in the ability to visualize metabolism non-invasively. Key processes include the uptake/transport kinetics of substrates, their rapid enzymatically-catalyzed conversion and availability of cofactors. This section describes rapid enzyme mediated processes, which can be used as a primer for the understanding of biochemical mechanisms characterized by DNP.
8.1. Dehydrogenases and redox
The most well-studied reaction by DNP-NMR, namely the conversion of [1-13C] pyruvate to [1-13C] lactate, is a reduction. In many studies, this conversion has been linked to the aberrant metabolism seen in cancer. As Warburg and colleagues postulated,139,140 many cancers undergo increased aerobic glycolysis even in the presence of oxygen. This adaptation is counterintuitive, given the energetic advantage of metabolizing glucose via the tricarboxylic acid cycle (TCA) and oxidative phosphorylation to produce energy (ATP). Warburg’s hypothesis has driven extensive research into the reasons for this shift, and what competitive advantage is afforded cells in this state. In vivo, one important driving force is modulation in the ratio of reducing to oxidizing (redox) agents leading to increased metabolism to lactate.141,142
Generation of lactate from the glycolytic intermediate pyruvate is mediated by the enzyme lactate dehydrogenase (LDH, EC 1.1.1.27). At steady state, the kinetics of LDH can be characterized as an ordered bi-reactant scheme, specifically a Theorell–Chance mechanism.143,144 First the enzyme binds the reduced dinucleotide cofactor nicotinamide adenine dinucleotide (NADH). It then binds the substrate pyruvate and catalyzes its reduction to the product lactate via a hydride transfer (Fig. 15). At high concentrations of pyruvate, LDH has been shown to be substrate inhibited and the concentration of pyruvate in the cell is tightly regulated in glycolysis. In the case of HP [1-13C] pyruvate, the labeled carbonyl is adjacent to the C2 carbon, which is the site of reduction. Pyruvate is rapidly transported into the cell by the monocarboxylate transporter family (MCT), predominantly MCT1 (Km = 0.7–2 mM).145–147 While there are sodium dependent MCTs, the greater density of MCT1 is a H+ symporter, thus requiring a molar equivalent of H+s to enter the cell upon uptake of pyruvate. In most experiments, HP pyruvate is introduced into the system at very high concentrations and thus the magnitude of conversion to labeled lactate can be limited by the specific activity of MCT.148 Once in the cell, the high availability of NADH and LDH allows for near instantaneous conversion to lactate. It is important to note that if the lifetime of the pyruvate–LDH complex were long during the conversion to lactate, the HP signal would decrease more rapidly due to through space relaxation and increased molecular correlation time. Once reduced, the HP lactate is incorporated into the intracellular lactate pool. The label can also be transported out of the cell, predominantly through MCT4,149,150 which has also been shown to be upregulated in cancer cells.151,152 Given the ubiquitous nature of this dehydrogenase reaction, HP pyruvate has been studied extensively, demonstrating rapid conversion in cells152–155 and animal models.155–159
Fig. 15.
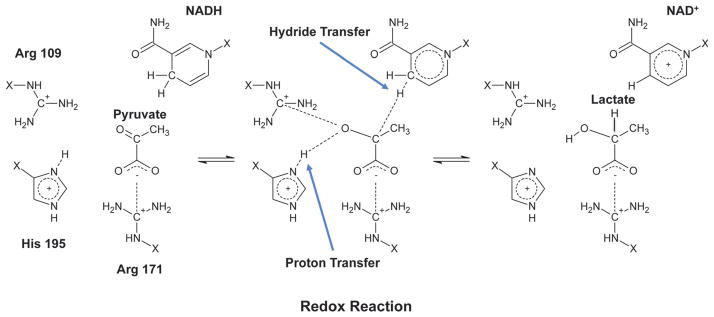
Lactate dehydrogenase (LDH) enzymatic conversion of pyruvate to lactate. The hydride transfer from nicotinamide adenine dinucleotide (NADH) is shown in the enzyme pocket. Amino acids are shown abbreviated with –X to simplify the scheme.
While pyruvate provides a window into the predominantly cytosolic NAD(H)-dependent redox pool, the network of redo-related enzymes and cofactors is both complicated and expansive. Many other redox networks have been targeted for metabolic study.130,160–162 The generation of reactive oxygen species and its subsequent quenching has been a topic of great interest and the antioxidants glutathione [GSH] and ascorbate (vitamin C) have been found to be critical in maintaining redox.161,163 Interestingly, the oxidized form of vitamin C, dehydroascorbate, is rapidly transported into the cell by glucose transporters (GLUTs), predominantly GLUT1. It then takes part in a 2-electron reduction to ascorbate catalyzed by a range of redox enzymes including GSH-dependent glutaredoxin (EC 1.20.4.1), protein disulfide isomerase (PDI, EC 5.3.4.1), and glutathione transferase (GSTO, EC 2.5.1.18). Reduced glutathione levels can then be maintained by through NADPH-dependent reactions, including glutathione reductase (EC 1.8.1.7). Given the robustness of this redox network, [1-13C] DHA was developed as a redox probe for monitoring intracellular reducing capacity. Following application to cells or intravenous administration, HP DHA is rapidly transported into the cell and reduced to HP [1-13C] vitamin C. It is important to note that the export of vitamin C from the cell is relatively slow and, on the time scale of the HP experiment, would be expected to accumulate intracellularly.
HP DHA conversion to vitamin C has been demonstrated in cancer cells as well as in animal models.85,86 High rates of conversion are observed in organs whose exposure to ROS is high, including the brain, liver, and kidneys. High rates of reduction are also observed in tumors,85 consistent with both high concentrations of glutathione as well as over-expression of redox enzymes.164
8.2. Transaminases
Conversion of HP [1-13C] pyruvate to [1-13C] alanine has been observed by DNP-NMR. The rapid enzymatic conversion of α-keto-acids to amino acids is typically catalyzed by transaminases. These enzymes are responsible for many processes including the maintenance of nitrogen homeostasis, catabolism and shuttling of substrates. The reversible conversion of pyruvate to alanine is mediated by the enzyme alanine aminotransferase (ALT, EC 2.6.1.2), which uses glutamate as the amine donor. ALT, like all transaminases, requires pyridoxal-phosphate, which is converted into pyridoxamine post-reaction with an amino acid. When HP [1-13C] pyruvate is enzymatically converted via ALT in vivo, [1-13C] alanine is observed in many tissues, most predominantly the liver165–167 (Fig. 16). Liver pathologies can impact the observed alanine signal and increased metabolism of HP pyruvate to alanine has been seen in early development of myc-driven hepatocellular carcinoma.168 Since transport of HP pyruvate into the cell is regulated by the MCTs, the reaction rate of ALT becomes dependent on its balance with other processes, including reduction of pyruvate to lactate. This can be envisioned as real-time enzymatic competition.
Fig. 16.
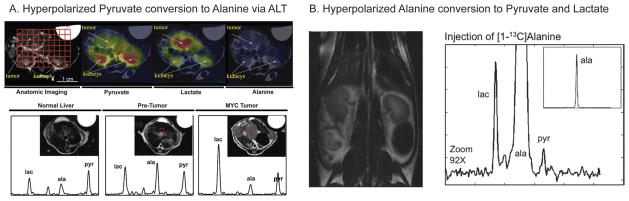
(A, top) HP images acquired post-injection of 80 mM [1-13C] pyruvate in a myc inducible transgenic model of liver cancer at 3 T. Color overlay maps from spectroscopic grids show clear differences in metabolic profiles between liver tumors and other tissues. (A, bottom) HP imaging of varying stages in tumor induction. Images demonstrate changes in metabolic profile during Myc-driven tumor formation. High pyruvate is detected in normal liver. Elevated alanine is associated with pretumor liver with modest MYC induction but no apparent phenotypic changes. A substantial increase in lactate is seen in developed tumor masses. Adapted from ref. 168. (B) T2-Weighted coronal image derived from a normal rat with corresponding representative 13C spectrum post-injection of [1-13C] alanine. Resonances corresponding to pyruvate and lactate are observed. Adapted from ref. 225.
This HP probe design has been extended to other keto-acids, including [1-13C] ketoisocaproic acid (KIC).169 Like pyruvate, KIC’s conversion to leucine through the branch chain aminotransferases (BCAT, EC 2.6.1.42) requires glutamate as the amine donor. KIC is transported into the cell using similar transporters to pyruvate and its compartmentalization is dependent on the activity of both a cytosolic and mitochondrial isoform BCAT. In recent work, the conversion of HP KIC to leucine was observed in tumors with high BCAT activity.169 In the brain, HP KIC metabolism is expected to inform on glutamate transport between neurons and astroglia.170
8.3. Decarboxylases
In tissues with a high rate of oxidative phosphorylation, such as the heart, HP 13C bicarbonate (a surrogate for 13C CO2) is seen following administration of [1-13C] pyruvate, both in vivo and in perfused systems. Removal of a carboxyl group from amino and keto-acids is catalyzed by the family of decarboxylases. These reactions tend to be fast and since they can easily be traced using a labeled carboxyl group, they are readily addressed by long T1 HP probes. The decarboxylation of pyruvate is typically catalyzed by the pyruvate dehydrogenase complex (PDC), which is comprised of 3 enzyme units.171 Pyruvate dehydrogenase (EC 1.2.4.1), with the cofactor thiamine pyrophosphate (TPP – vitamin B1) catalyzes the conversion of pyruvate to CO2 in the first step of metabolism of pyruvate to acetyl-CoA. In this mechanism, pyruvate and TPP are bound by the enzyme and the C2 carbon of TPP performs a nucleophilic attack on the C2 of pyruvate, leading to the decarboxylation of pyruvate and production of CO2. This is considered the rate-limiting step of the PDC. Using HP [1-13C] pyruvate in highly oxidative cells and organs, the flux through PDC was monitored by CO2 formation and found to be sensitive to physiologic perturbations.157,172 The CO2 observed is readily converted to bicarbonate through both carbonic anhydrase and acid–base chemistry (Fig. 17). Production of 13CO2, and in turn 13C bicarbonate, has been linked to changes in cardiac status173,174 as well as response to chemotherapeutics such as dichloroacetate.175,176
Fig. 17.
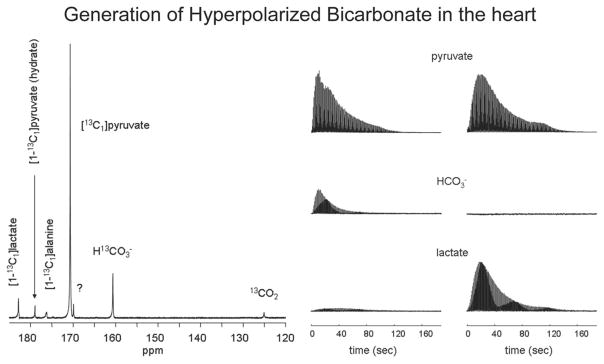
(left) 13C NMR spectrum of an isolated rat heart at 14 T. The summed spectrum (100 consecutive scans) demonstrates resonances for CO2, HCO3, pyruvate, lactate, alanine, and pyruvate hydrate. (right) Stacked plot of 13C NMR spectra from hearts supplied with [1-13C] pyruvate. Each resonance is a single scan showing the dynamic production of each metabolite. The left column is from a heart supplied with [1-13C] pyruvate, while the right was also incubated with octanoate. Adapted from ref. 172.
While [1-13C] pyruvate can interrogate decarboxylation in the first step of the PDC, labeling using HP [2-13C] pyruvate has demonstrated flux into the TCA cycle.84 TCA intermediates can be observed in real time showing flux from [2-13C] pyruvate directly to [1-13C] citrate and [5-13C] glutamate. Using HP [1,2-13C] pyruvate, flux though both pathways has been compared.177 While the T1 relaxation rates of these intermediates must be determined to quantify differences in observed flux, relative changes can be used to assess changes with disease state such as ischemia. It is important to note that the relative signal intensities of these TCA metabolites to the injected C2 pyruvate is quite low, due to both the faster relaxation times of these intermediates as well as potential extended relaxation due to interaction with multiple enzymes.
A resonance corresponding to [1-13C] oxaloacetate has been seen following HP [1-13C] pyruvate infusion. Addition of a carboxyl group to keto-acids is mediated by the ligase class of carboxylases.178 Pyruvate carboxylase (PC, EC 6.4.1.1) catalyzes the irreversible carboxylation of pyruvate to oxaloacetate (OAA), using both ATP and acetyl-CoA. OAA can then take part in many reactions including shuttling from the mitochondria to the cytosol as malate, converted back to OAA and decarboxylated and phosphorylated to phosphoenolpyruvate (PEP) for gluconeogenesis. Regulation of the fate of OAA derived from PC is dependent on glucose concentration and upstream enzymatic processes as well as the anaplerotic role of replenishing carbons in TCA. In conditions of high glucose, high PC activity can lead to pyruvate cycling in pancreatic β-cells in order to facilitate glycolysis.179 HP [1-13C] pyruvate injected into perfused livers has demonstrated conversion through OAA to malate and aspartate, indicative of PC activity167 as well as in vivo.166 Interestingly, the researchers show label scrambling of both malate and aspartate as a result of malate’s hydration reaction through fumarase (EC 4.2.1.2) to the symmetric TCA intermediate fumarate, leading to both [1-13C] and [4-13C] malate and aspartate. The contribution of flux through fumarase is visualized in the relative resonance amplitudes for the C1 and C4 carbons.
8.4. Peptidases, acetyltransferases, and acylases
As discussed, translocation of carboxyl groups provides a convenient means of following enzymatic conversion by HP MR due to the long T1 relaxation of the carboxyl moiety. This has been extended to the cleaving of carboxyl groups from substrate mimics in an effort to report on the activity of the enzyme. Importantly, although a peptide bond can spontaneously hydrolyze in water (taking on the order of 1000 years), it is enzymatically facilitated in vivo, releasing nearly 4 kcal mol−1 (ref. 180) of energy; the ability to visualize this process by HP MR is striking.
Carboxypeptidases are protease enzymes (EC 3.4.16-18) that hydrolyze a C-terminal peptide bond.181 Typically these are involved in protein regulation and have also been the target of developing chemotherapeutics,182 treatment of neurodegenerative/inflammatory diseases,183 and even detection of prostate cancer (PSMA).184 Typically this is a Zn2+-dependent mechanism where the carboxyl carbon of the peptide bond to be cleaved is coordinated by the zinc ion. This mechanism has not yet been applied to in vivo HP study, however ex vivo work has shown the ability to visualize peptide carboxyl cleavage. 3,5-Diflurobenzoyl-L-glutamate was HP at natural abundance and reacted with carboxypetidase G2 (CPG2) as a reporter probe, with cleavage to glutamate indicating CPG2 activity.185 Interestingly, the amide carbonyl is not observed; its lifetime shortening is attributed to depolarization via an exchange effect with zinc and is reversed by addition of a chelator (i.e., EDTA). The T1’s of the carbons of interest in solution were relatively short, thus limiting clinical translation, but its important to note the C1 carbonyl resonance of glutamate survives the reaction and is readily observed.
Like removal of carboxyl groups, acetyltransferases are capable of removing acetyl moieties from peptides and small molecules and transferring them. In the brain, choline acetyltransferase (EC 2.3.1.6) catalyzes the cleavage of the acetyl group from acetyl-CoA and its ligation with choline to form the neurotransmitter acetylcholine.186 Histone acetyltransferase (EC 2.3.1.48) catalyzes the acetylation of N-acetyl-lysine, removing the acetyl from acetyl-CoA and playing a major role in gene regulation.187 For this reason, acetyl transferases have been studied using HP precursors, but they have yet been shown to be robustly translatable to living systems. This is most likely due to the slow uptake of the precursor, for example choline. Recently, researchers have used a similar mechanism, aminoacylase (EC 3.5.1.14), as a reporter.188 This probe catalyzes the cleavage of a carboxylate from an N-acyl-amino acid. By genetically modifying HEK cells to include the Acyl-1 gene, Chen et al. were able to demonstrate that cells expressing elevated aminoacylase cleaved N-acetyl-methionine to methionine on the timescale of the HP experiment. In these cases, the acylase probes have been shown to be potentially transport-limited and using the transport architecture of the cell, may provide a means to yield higher signals. While intracellular incorporation may prove difficult when investigating endogenous reactions, enzymatic enrichment may be a beneficial tool for non-invasive cell tracking.
8.5. Kinases
The prevalence of phosphorylation reactions in metabolism and cell-signaling cascades make these a novel and high-yield application of 13C DNP-NMR. The phosphorylation of both 13C hexoses and 13C choline derivatives has been demonstrated in vitro. This transfer of phosphate groups from high-energy molecules, such as adenine triphosphate (ATP), to metabolites of interest is catalyzed by the kinase family of enzymes. Due to phosphate bond strengths, phosphorylation stores approximately 7 kcal mol−1 of energy.189 Over the last two decades a great deal of effort has been directed toward the elucidation of protein kinase pathways and their regulation of disease state, leading to many therapeutic targets. The metabolic elucidation of kinases began with older studies describing glycolysis. Hexokinase (EC 2.7.1.1) catalyzes the phosphorylation of hexoses and is the first step in the glycolytic metabolism of glucose, resulting in glucose-6-phosphate.190 Hexokinase has been shown to be regulated and recruited by a number of mechanisms, including insulin response, and hexokinase 2 (encoded by the HK2 gene), which localizes to the outer mitochondrial membrane and is upregulated in many rapidly dividing cancer cells.191 In order to investigate this metabolic process, multiple HP probes have been developed. The first was [2-13C] fructose,90 which exists as multiple hexose isomers, predominantly the β-fructopyranose and fructofuranose rings. This was chosen since the hemi-ketal carbon of fructose has a long T1 relative to the short glucose T1’s. In vitro, with the addition of hexokinase, phosphorylation could be observed and resolved, since fructose-6-phosphate only exists as a furanose isomer. In vivo, fructose is transported by the GLUTs, predominantly GLUT5, which is upregulated in some cancers. Changes in the ratio of phosphorylated to total fructose can be anticipated in regions of both high GLUT mediated uptake and resulting hexokinase activity. In more recent studies, fully deuterated glucose and fructose have been HP (see Sections 5.2 and 5.3) and have tremendous in vivo promise since metabolism assessed by GLUTs and glycolysis may be more representative of the upstream oncogenic phenotype.
Another kinase that has been extensively studied for clinical translation is choline kinase (EC 2.7.1.32). Choline and its phosphorylated intermediates of the Kennedy cycle, phosphocholine (PC) and glycerophosphocholine (GPC), have been observed by 1H NMR and are related to stage and progression in a number of cancer types.192–194 Recently it was shown that CHK plays a role in a complex with the EGF receptor (EGFR) in a c-Src-dependent manner, and functions cooperatively with EGFR and c-Src in regulating cell proliferation pathways.195 Choline uptake and trapping via CHK have also been exploited as the radioactive PET analogue 11C-choline. Given this level of interest in choline metabolism, both 15N and 13C labeled choline molecules have been HP for study.26,105,107 While ex vivo experiments have demonstrated the phosphorylation of HP choline by CHK, detecting this conversion in vivo may be limited by the kinetics of the choline transporter.
8.6. Hydratases
Enzyme-catalyzed hydration and dehydration reactions have been interrogated by 13C DNP-NMR, using probes with high potential for clinical translation. Specifically, the hydration of HP [1,4-13C2] fumarate to malate has been seen in necrotic cells, while the carbonic anhydrase-mediated hydration of 13C CO2 to 13C HCO3− (and the reverse reaction) have been studied in the context of extracellular pH.37 Due to the high concentration of water in cells, these reactions contrast with previously discussed cases, for which enzymatic conversion of HP probes is reactant-limited. For example, with depletion of NAD(H) in chemotherapy, LDH flux observed by HP [1-13C] pyruvate is decreased. For reactions using H2O, the presence of this virtually unlimited reactant allows a more precise understanding of metabolic flux.
Recently, Gallagher et al. have used [1,4-13C2] fumarate to study necrosis both in vitro and in vivo.196 In normal tissue, fumarate is transported into the cell by sodium dependent dicarboxylic acid transporters (DCATs) and rapidly hydrated by fumarate hydratase (FH, EC 4.2.1.2) to malate. Tumor, as well as normal tissues have demonstrated very low, if any, detectable HP malate. When treated with chemotherapies that induce high levels of necrosis, [1,4-13C2] malate is detected and was correlated to levels of necrosis (Fig. 18). Observing the static FH activity and ubiquitous availability of the cofactor (H2O), the researchers postulate that this increased malate production is due to the increased membrane permeability, which accompanies necrosis. Importantly, HP fumarate addresses one of the most exciting applications of DNP, namely monitoring response to therapy.
Fig. 18.
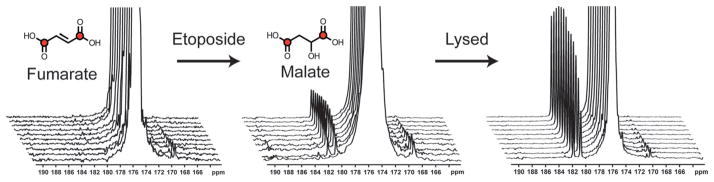
13C spectra acquired over a period of 1 min after injection of HP [1,4-13C2] fumarate into suspensions of intact murine lymphoma cells (5 × 10⁷ cells), cells treated with etoposide for 16 h and lysed cells. (B) Cells 16 h after etoposide treatment. Increased malate is observed with increased necrosis. Adapted from ref. 210.
The determination of extracellular pH (pHe) non-invasively has been a goal of many researchers in the last 3 decades. Acidification of the extracellular matrix (ECM) has been related to many diseases, particularly cancer. While nuclear medicine and MRI techniques have been developed to image an acidic pHe, these efforts have been plagued by quantification inaccuracies and sensitivity. Using the unlimited reactant water, Gallagher et al. have developed HP 13C-bicarbonate as a means for measuring pHe.37,83 Bicarbonate remains extracellular and its conversion to CO2 can happen fairly rapidly by acid–base chemistry (10’s of seconds). In vivo, the interconversion of bicarbonate and CO2 is facilitated by the family of carbonic anhydrases (CA, EC 4.2.1.1) because the non-catalyzed rate of interconversion is slow relative to the metabolic fluxes, which generate (and consume) H+.197,198 CA can increase this inter-conversion 104–106 fold and exists both on the cell surface as well as on the mitochondrial membrane. The rapid chemical exchange of 13C HCO3−and 13C CO2, catalyzed by carbonic anhydrase, was investigated in a series of saturation experiments in vivo (Fig. 19). In these experiments, selective saturation of the 13C CO2 resonance was performed, with and without treatment with acetazolamide, a CA inhibitor. These studies showed more rapid decay of the 13C HCO3− resonance with 13C CO2 saturation, as expected in a fast-exchanging pair. By contrast, when acetazolamide was administered, 13C CO2 saturation had little effect on the decay of the 13C HCO3− resonance (dominated by its T1). Therefore, the role of CA in facilitating this equilibrium was unambiguously established. 13C cesium bicarbonate was used to demonstrate CA-catalyzed interconversion both in vitro and in tumor-bearing mice, demonstrating lower pH within tumor (Fig. 19). The ratio of 13C HCO3 to 13CO2 is governed by the Henderson–Hasselbach equation and pH can be readily determined from a ratiometric image. Recent work has extended this to hyperpolarizing 13C sodium bicarbonate, a non-toxic salt, showing this method has great potential for non-invasive imaging of pHe.83 It is important to note that intracellular CA activity is also observed in most tissues via conversion of the CO2 derived from HP pyruvate to bicarbonate. The pH derived in this way is of the intracellular compartment and is typically observed in cardiac experiments.
Fig. 19.

In vivo saturation experiment demonstrating that 13C HCO3− and 13C CO2 are in rapid chemical exchange, catalyzed by carbonic anhydrase. (A) Spectra acquired from a EL4 lymphoma tumor using a surface coil with a control saturation (first three spectra) and 13C CO2 saturation (second three spectra). (B) Identical experiment, but the mouse was treated with acetazolamide, a carbonic anhydrase inhibitor. Adapted from ref. 37.
9. Engineered cell and tissue culture systems (bioreactors)
The study of HP probes and their biochemistry requires tissue culture systems that interface with DNP-NMR. Due to limited HP MR lifetimes, it is difficult to use traditional cell and tissue culture to investigate HP probe metabolism. Moreover, reproducibility and robustness of the measurement is confounded by variations in cell density, the concentrations of metabolic precursors, and media components. To study changes in metabolism with HP probes as well as characterize biochemical mechanisms, MR-compatible systems have been developed, deemed bioreactors.199–201 These systems may be studied using both NMR at thermal equilibrium and DNP-NMR, with several key modifications needed for the latter. These modifications include (1) a fast injection system, so that the 13C substrate of interest reaches the cells/tissues within its useful HP lifetime, (2) the ability to adjust key parameters (for example flow rate) to investigate rapid kinetic mechanisms, and (3) maintenance of magnetic field homogeneity, to resolve 13C probes and their metabolites by chemical shift.
First incarnations of these perfusion systems were adapted from predecessors designed for large cultures and used to monitor dynamic and steady state metabolism of small molecules, including 13C and 19F labeled probes.202,203 In recent work, systems that perfuse immortal cells with injection of HP pyruvate148,153 have measured changes in cell uptake,148 response to therapy,154 and reproducibility of measurements.153 Similar to perfused organ and murine studies, metabolic pathways are readily visualized in real time. Of greater importance is the ability to control parameters such as oxygenation, flow, pH, and substrate availability to introduce perturbations in microenvironment. Additionally, these systems can be used to accurately measure kinetics and derive parameters of interest for translation. With a well-controlled system, typical confounders such as variability in cell bioenergetics state can be controlled for using 31P MR and HP 13C kinetics can be assessed. A recent study demonstrated that not only does transporter uptake govern the HP lactate observed, derived from pyruvate and MCT1, but also the transport of lactate out of the cell (MCT4). Because this was observed in cell lines of differing aggressiveness, MCT4 may be a potential cancer target.152
The extension of this approach to more biologically relevant model systems is of great importance. Over the years, many targeted therapies and biomarkers that have been discovered in immortal cell lines and mouse models, have yielded poor clinical translation.204,205 In recent work, living primary human tissue slice cultures (TSCs) have been integrated into a bioreactor platform for metabolic study.206 These TSCs are derived from patients at surgery and kept alive under perfusion inside of an NMR spectrometer for metabolic study using injected HP probes (Fig. 20). Metabolism of HP pyruvate to lactate in these cultures was shown to increase in prostate cancer relative to benign prostate tissues and will be important in validating studies in prostate cancer patients.
Fig. 20.
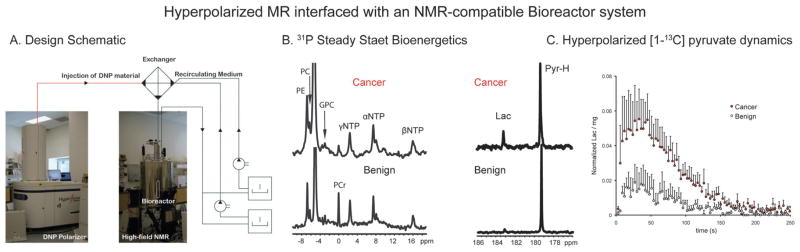
(A) Design schematic for NMR-compatible bioreactor system, including interface between a DNP polarizer and high-field NMR magnet (11.7 T). (B) 31P spectra from living human malignant and benign tissue slice cultures (TSCs) perfused in a 10 mm NMR-compatible bioreactor. (C) Representative single 13C spectrum taken at 90 s post-injection of HP [1-13C] pyruvate in the bioreactor with benign (N = 4) or malignant TSCs (N = 4) and accompanying average HP lactate dynamics for TSCs. Significantly increased lactate is observed in malignant prostate TSCs as compared to benign. PCr –phosphocreatine, PC – phosphocholine, PE – phosphoethanolamine, GPC – glycerophosphocholine, α,β,γ-NTPs – nucleotide triphosphates. Adapted from ref. 206.
10. HP kinetic measurements
While the focus of this review is on the chemistry and biochemistry of HP MR, it is important to consider the relevant parameters needed to assess observed kinetics. Each HP probe has a characteristic T1 relaxation rate at a given field strength, which affects the observed signals in time. In order to analyze ex vivo kinetic data for a given probe, the T1 of the substrate and product must first be measured at the proposed field strength, using a low flip angle (α) pulse and acquire sequence. After correcting for pulse saturation due to excitation (i.e. cosn(α)), the T1 can be fit to a mono-exponential decay using standard methods. Using these T1’s, one can apply standard kinetic analysis methods to the acquired HP MR data. In the case of first order chemical kinetics, T1 relaxation can be incorporated into a first order rate equation and used to derive measured rates.
| (1) |
| (2) |
| (3) |
The reaction rate is represented by k with the relaxation rates of A and B as T1A and T1B, respectively. These coupled ordinary differential equations can then be integrated:
| (4) |
| (5) |
A0 and B0 are the starting measurements of substrate and product. This approach can be used as a primer for extending to higher order kinetics using standard methods and has been applied to chemical reactions.134
This method can also be applied to enzyme kinetics, with the inclusion of the appropriate rate equation. Recent work has modeled monocarboxylate transport kinetics using an exchange model155 and then standard Michaelis–Menten kinetics148 while others have modeled lactate dehydrogenase kinetics using a Theorell–Chance mechanism.144 Others have attempted to include additional information such as mass spectroscopy derived concentrations to aid in the quantification.207 Additionally, this modeling has been extended to include delivery dynamics both in cell and in vivo systems.153,208 Each approach makes assumptions to reduce the number of variables and allow for numerical solution. These approximations typically assume that the substrate and product have similar relaxation rates or that the reaction is unidirectional. For the purposes of quantifying in vivo kinetics, it is important to note that relaxation parameters are difficult to assess for different tissues and this must be accounted for to develop quantitative rates. Diffusion and perfusion of substrates as well as products64,121,209 will also influence the observed signals and these limitations must be addressed to calculate absolute rates in vivo. While rates, in the classical sense, are important for understanding the underlying biochemical mechanism of conversion, a high range of contrast between normal and malignant tissues can be determined using simple approaches such as resonance ratios.85,156,168,210 These are typically used for in vivo experiments and provide a robust measurement for tissue comparison. As in other imaging methods, e.g., dynamic contrast enhanced MRI, modeling of HP parameters will play a major role in the future quantification of observed metabolic conversions and a better appreciation of these kinetic changes may yield other more sensitive parameters for tissue characterization.
11. In vivo success stories: pyruvate, dehydroascorbate, and fumarate
Many 13C substrates have been polarized using the DNP technique, but only a handful have been useful for detailed in vivo study, during which metabolites are not only detected but also localized to an organ/tissue of interest. Simply stated, this requires large 13C metabolite signals and chemical shift imaging [CSI] methods to parse those signals into voxels. For the prototype agent [1-13C] pyruvate, this was described as early as 2006, but several newer 13C agents have also demonstrated rapid in vivo metabolism amenable to CSI. Two recent examples are dehydroascorbate and fumarate. This section presents the chemical and biochemical features of pyruvate, dehydroascorbate, and fumarate that render these metabolic agents potentially useful in the clinic.
The identification of chemical structures amenable to hyperpolarization by DNP has already been discussed. These three small molecules (1) have a long T1 carbon nucleus, (2) are endogenous, (3) are highly soluble, and (4) experience a chemical reaction that is observable by chemical shift. For in vivo applications, several additional features are critical. Since HP 13C agents are administered intravenously as a concentrated bolus (mM range), toxicity may limit the dose delivered. Transport of the 13C agent into the cellular compartment (or organ) of interest is also an important consideration. For example, for studying cerebral metabolism the introduced 13C probe must cross the blood–brain barrier at a sufficient rate, which is not the case for many small-molecule metabolites. The conversion of the introduced 13C agent to its metabolic products must also occur at a high rate, to be observed on the time-scale of the HP MR experiment. The 13C metabolic products formed must also have longer T1’s, and be maintained at a high steady-state concentration. This requirement is highlighted by studies in yeast using [U-2H, U-13C] glucose, remarkable not only for the number of resonances observed, but also for the resonances not observed, corresponding to intermediates in the glycolytic pathway. Although these intermediates (e.g., 3-phospoglycerate) are certainly formed, they are themselves consumed too rapidly to permit detection, reflected by their low steady-state concentrations in the cell. This is also the case for intermediates of the TCA cycle that are not seen following administration of [2-13C] pyruvate.
11.1. HP [1-13C] pyruvate
Pyruvate is the most prolific HP 13C agent, and numerous studies have been performed in preclinical models, including transgenic and implanted murine tumors, perfused organs, and bioreactors. Many outstanding studies have been published that not only validate [1-13C] lactate as a cancer biomarker, but also demonstrate the utility of [1-13C] pyruvate in cardiac and cerebral imaging, and investigate fundamental cellular processes. Further discussion of these reports are beyond the scope of this review, but have been addressed elsewhere.211–213 HP [1-13C] lactate signals have been correlated with tumor grade in a TRAMP model.156 Tumor response to therapy has been investigated in vivo in a murine lymphoma model comparing HP [1-13C] pyruvate to 18F-FDG.214 In cardiac imaging, decarboxylation of [1-13C] pyruvate by the pyruvate dehydrogenase (PDH) complex results in large bicarbonate signals in the normal heart, that are significantly decreased in ischemia.215 Metabolism of HP [1-13C] pyruvate has been observed both in the normal brain, and implanted glial tumors where increased lactate signals were observed.216 Several basic cellular processes have been investigated using HP [1-13C] pyruvate, including a recent study describing the role of carbonic anhydrase-rich domains in facilitating mitochondrial respiration in myocytes.217
These studies are possible due to the previously described chemical and biochemical features of pyruvate, as well as its central role in metabolism. Increasingly, HP [2-13C] pyruvate has been studied, which also has a long T1 and is amenable to DNP. Metabolites of the citric acid (TCA) cycle cannot be observed in biologic systems using [1-13C] pyruvate, since it is the C2 carbon that enters TCA as acetyl-CoA, with C1 “lost” as CO2. HP [2-13C] pyruvate has been used in the heart, which has a high rate of oxidative phosphorylation.
11.2. HP [1-13C] dehydroascorbic acid
As noted earlier, the oxidized form of vitamin C (VitC), dehydroascorbic acid (DHA) has been developed as a redox probe and studied in vivo.85,86 It shares a dicarbonyl structure with pyruvate, although in aqueous solution various hydrates and intramolecular hemi-ketal forms are seen, that complicate its MR spectrum. Like pyruvate, it has a long T1, high solubility (in DMA and DMSO), and may be injected at concentrations for which physiologic effects in animals are not observed (up to 15 mM). In vivo, dehydroascorbate shares an uptake mechanism with glucose via the GLUT 1,3,4 transporters and is rapidly converted to vitamin C. This reduction is considered glutathione (GSH) dependent, although a host of redox enzymes, NADPH, and vitamin C itself are also implicated. As discussed previously, direct reduction of DHA by GSH in vitro is possible, but this rate is too slow to account for the large in vivo signals VitC signals observed following administration of HP [1-13C] DHA. In the TRAMP model, the largest VitC signals were observed in the kidneys, liver, brain, and prostate tumor (Fig. 21).85,164 This reduction is probably best considered a measure of redox capacity,218 rather than redox state.219 While the former term refers to the cell’s ability to reduce oxidizing species (reflected in both reducing agent concentration and its maintenance), the latter may be defined as the [GSH]/[GSSG] ratio. It is not clear that [GSSG] may be interrogated using the DHA–VitC pair. Following administration of HP [1-13C] VitC, only trace DHA is observed, which may not depend on the concentration of oxidized glutathione.
Fig. 21.

(A) Sequential coronal T2-weighted images and corresponding 13C 3D MRSI demonstrating distribution of HP DHA and vitamin C (VitC) in a TRAMP mouse post intravenous injection of 350 μL of 15 mM HP [1-13C] DHA at 3 T. The liver and kidneys are best seen in (A, top) and prostate tumor in (A, bottom), but both imaging slices contain significant amounts of liver, kidney, and tumor tissue. Regions of liver, kidney, and prostate tumor are segmented and superimposed on the spectral grid (color-coded dashed lines). Differences in metabolite ratios are seen between normal organs and between prostate tumor and normal surrounding tissues with representative spectra from liver, kidney, and prostate tumor. (B) Axial T2-weighted images and corresponding color overlays of HP DHA and vitamin C (VitC) signal in a normal rat brain. Adapted from ref. 85.
11.3. HP [1,4-13C2] fumarate
Tumors may respond to therapy by both apoptotic and non-apoptotic mechanisms including necrosis, with unregulated digestion of cellular components. While necrosis may be imaged macroscopically using traditional 1H methods, early necrosis is of great interest in observing a tumor’s response to therapy. HP [1,4-13C2] fumarate has been used to image necrosis in a murine lymphoma model, with formation of [1,4-13C2] malate correlated with the percentage of cells that had lost plasma membrane integrity.196 Following treatment with etoposide, there was Hyperpos a significant (2.4-fold) increase in [1,4-13C2] malate production that correlated with tumor cell necrosis (Fig. 22). As previously discussed, fumarate is a TCA intermediate that is maintained at low concentrations in the mitochondria, and converted to malate by the activity of fumarase. Gallagher et al. found that the increased [1,4-13C2] malate signal observed was unlikely to be due to fumarase expression, or increased transport via the sodium-dependent dicarboxylate transporter. Rather, the primary mechanism appears to be spilling of fumarase from damaged necrotic cells. Use of HP [1,4-13C2] fumarate in the clinic might therefore allow observation of both pathological states and response to treatment.
Fig. 22.
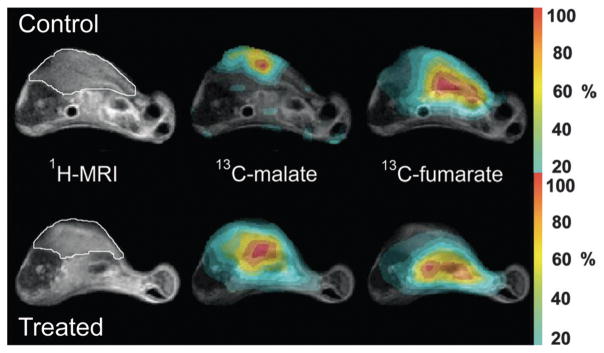
Representative axial images from untreated and etoposide-treated mice with implanted lymphoma tumors. Color overlays demonstrate increased total malate produced in etoposide treated mice in comparison to untreated tumors. Adapted from ref. 210.
12. Summary
The development of rapid dissolution DNP methods has facilitated previously impossible in vitro and in vivo study of small molecules. The DNP technique is generalizable to a large number of analytes, in contrast to other hyperpolarization methods. Several considerations for identifying compatible chemistries are presented in this review, for example the T1 of the 13C nucleus of interest, and the biochemistry of endogenous substrates. New approaches are overcoming the limitations imposed by T1, for example controlled incorporation of enriched nuclei, and storage of spin polarization in the singlet state. The former approach will require development of new (and cheaper) synthetic methodologies, while the latter demands focused investigation of fundamental physical chemistry. HP NMR using DNP holds special promise in the interrogation of rapid and dynamic chemistries in solution, for which equilibrium spin magnetizations do not suffice. In addition, the technique has the potential to revolutionize the way patients are diagnosed and treated in the clinic, via non-invasive insights into basic metabolism.
Acknowledgments
Grant sponsors: National Institutes of Health (R01 CA166766, K99 EB014328).
Biographies
 Kayvan R. Keshari
Kayvan R. Keshari is an Assistant Attending in the Department of Radiology and Assistant Member in the Molecular Pharmacology and Chemistry Program at Memorial Sloan-Kettering Cancer Center (MSKCC). He received his bachelor’s degrees in Biochemistry and Applied Mathematics from the University of California, Berkeley in 2003. He completed his PhD in 2009 under Professor J. M. Macdonald in Biomedical Engineering at the University of North Carolina, Chapel Hill. He then moved to the University of California, San Francisco and completed a post-doctoral training in Cancer Metabolic Imaging in the Departments of Radiology and Bioengineering and Therapeutic Sciences under the supervision of Professor J. Kurhanewicz. He has authored over 20 manuscripts and 3 patents in metabolism, with a focus on hyperpolarized MR. His research focuses on the development of imaging approaches and bioengineered systems to study cancer metabolism, particularly in the realm of hyperpolarized MR and oxidative stress.
 David M. Wilson
David M. Wilson is an Assistant Professor in the Department of Radiology and Biomedical Engineering at University of California, San Francisco (UCSF) where he is an attending radiologist in the neuroradiology section. He received his BS in biochemistry from Harvard University in 1997, and finished his MD-PhD training in 2004 working under Professor Ronald Breslow in the Columbia University Department of Chemistry. His clinical training including both residency in general radiology and fellowship in neuroradiology were completed at UCSF in 2010 at which time he joined the faculty. David has published 15 peer-reviewed papers on hyperpolarized 13C spectroscopy since 2009 and has patents on two new hyperpolarized agents. His work focuses on developing new 13C probes, comparing them to their 11C and 18F correlates used in positron emission tomography, and understanding their biochemical mechanisms.
References
- 1.Thakur ML, Lentle BC. J Nucl Med. 2005;46:11N–13N. 42N. [PubMed] [Google Scholar]
- 2.Ardenkjaer-Larsen JH, Fridlund B, Gram A, Hansson G, Hansson L, Lerche MH, Servin R, Thaning M, Golman K. Proc Natl Acad Sci U S A. 2003;100:10158–10163. doi: 10.1073/pnas.1733835100. [DOI] [PMC free article] [PubMed] [Google Scholar]
- 3.Nelson SJ, Kurhanewicz J, Vigneron DB, Larson PE, Harzstark AL, Ferrone M, van Criekinge M, Chang JW, Bok R, Park I, Reed G, Carvajal L, Small EJ, Munster P, Weinberg VK, Ardenkjaer-Larsen JH, Chen AP, Hurd RE, Odegardstuen LI, Robb FJ, Tropp J, Murray JA. Sci Transl Med. 2013;5:198ra108. doi: 10.1126/scitranslmed.3006070. [DOI] [PMC free article] [PubMed] [Google Scholar]
- 4.Macovski A. J Magn Reson Imaging. 2009;30:919–923. doi: 10.1002/jmri.21962. [DOI] [PubMed] [Google Scholar]
- 5.DeFeo EM, Wu CL, McDougal WS, Cheng LL. Nat Rev Urol. 2011;8:301–311. doi: 10.1038/nrurol.2011.53. [DOI] [PubMed] [Google Scholar]
- 6.Duarte JM, Lei H, Mlynarik V, Gruetter R. Neuroimage. 2012;61:342–362. doi: 10.1016/j.neuroimage.2011.12.038. [DOI] [PubMed] [Google Scholar]
- 7.Kemp GJ, Brindle KM. Diabetes. 2012;61:1927–1934. doi: 10.2337/db11-1725. [DOI] [PMC free article] [PubMed] [Google Scholar]
- 8.Boesch C. J Magn Reson Imaging. 2007;25:321–338. doi: 10.1002/jmri.20806. [DOI] [PubMed] [Google Scholar]
- 9.Ten Hove M, Neubauer S. Heart Failure Rev. 2007;12:48–57. doi: 10.1007/s10741-007-9003-8. [DOI] [PubMed] [Google Scholar]
- 10.Ouwerkerk R. J Am Coll Radiol. 2007;4:739–741. doi: 10.1016/j.jacr.2007.07.001. [DOI] [PMC free article] [PubMed] [Google Scholar]
- 11.Thulborn KR, Davis D, Snyder J, Yonas H, Kassam A. Neuroimag Clin N Am. 2005;15:639–653. xi–xii. doi: 10.1016/j.nic.2005.08.003. [DOI] [PubMed] [Google Scholar]
- 12.Li S, Zhang Y, Wang S, Yang J, Ferraris Araneta M, Farris A, Johnson C, Fox S, Innis R, Shen J. Magn Reson Med. 2009;62:565–573. doi: 10.1002/mrm.22044. [DOI] [PMC free article] [PubMed] [Google Scholar]
- 13.Bluck LJ, Clapperton AT, Coward WA. Clin Sci. 2005;109:513–521. doi: 10.1042/CS20050155. [DOI] [PubMed] [Google Scholar]
- 14.Stevens AN, Morris PG, Iles RA, Sheldon PW, Griffiths JR. Br J Cancer. 1984;50:113–117. doi: 10.1038/bjc.1984.146. [DOI] [PMC free article] [PubMed] [Google Scholar]
- 15.van Zijl PC, Chesnick AS, DesPres D, Moonen CT, Ruiz-Cabello J, van Gelderen P. Magn Reson Med. 1993;30:544–551. doi: 10.1002/mrm.1910300504. [DOI] [PubMed] [Google Scholar]
- 16.Jensen JE, Drost DJ, Menon RS, Williamson PC. NMR Biomed. 2002;15:338–347. doi: 10.1002/nbm.776. [DOI] [PubMed] [Google Scholar]
- 17.Zhu H, Barker PB. Methods Mol Biol. 2011;711:203–226. doi: 10.1007/978-1-61737-992-5_9. [DOI] [PMC free article] [PubMed] [Google Scholar]
- 18.Haase A, Frahm J, Hanicke W, Matthaei D. Phys Med Biol. 1985;30:341–344. doi: 10.1088/0031-9155/30/4/008. [DOI] [PubMed] [Google Scholar]
- 19.Prost E, Sizun P, Piotto M, Nuzillard JM. J Magn Reson. 2002;159:76–81. doi: 10.1016/s1090-7807(02)00003-4. [DOI] [PubMed] [Google Scholar]
- 20.Smith MA, Gillen J, McMahon MT, Barker PB, Golay X. Magn Reson Med. 2005;54:691–696. doi: 10.1002/mrm.20592. [DOI] [PubMed] [Google Scholar]
- 21.Prescot AP, Renshaw PF. J Magn Reson Imaging. 2013;37:642–651. doi: 10.1002/jmri.23848. [DOI] [PMC free article] [PubMed] [Google Scholar]
- 22.Cocuzzo D, Lin A, Ramadan S, Mountford C, Keshava N. Conf Proc IEEE Eng Med Biol Soc. 2011;2011:4929–4934. doi: 10.1109/IEMBS.2011.6091222. [DOI] [PubMed] [Google Scholar]
- 23.Roussel T, Giraudeau P, Ratiney H, Akoka S, Cavassila S. J Magn Reson. 2012;215:50–55. doi: 10.1016/j.jmr.2011.12.013. [DOI] [PubMed] [Google Scholar]
- 24.Cudalbu C, Comment A, Kurdzesau F, van Hees-wijk RB, Uffmann K, Jannin S, Denisov V, Kirik D, Gruetter R. Phys Chem Chem Phys. 2010;12:5818–5823. doi: 10.1039/c002309b. [DOI] [PubMed] [Google Scholar]
- 25.Reineri F, Viale A, Ellena S, Alberti D, Boi T, Giovenzana GB, Gobetto R, Premkumar SS, Aime S. J Am Chem Soc. 2012;134:11146–11152. doi: 10.1021/ja209884h. [DOI] [PubMed] [Google Scholar]
- 26.Gabellieri C, Reynolds S, Lavie A, Payne GS, Leach MO, Eykyn TR. J Am Chem Soc. 2008;130:4598–4599. doi: 10.1021/ja8001293. [DOI] [PubMed] [Google Scholar]
- 27.Atkins TM, Cassidy MC, Lee M, Ganguly S, Marcus CM, Kauzlarich SM. ACS Nano. 2013;7:1609–1617. doi: 10.1021/nn305462y. [DOI] [PMC free article] [PubMed] [Google Scholar]
- 28.Aptekar JW, Cassidy MC, Johnson AC, Barton RA, Lee M, Ogier AC, Vo C, Anahtar MN, Ren Y, Bhatia SN, Ramanathan C, Cory DG, Hill AL, Mair RW, Rosen MS, Walsworth RL, Marcus CM. ACS Nano. 2009;3:4003–4008. doi: 10.1021/nn900996p. [DOI] [PMC free article] [PubMed] [Google Scholar]
- 29.Jindal AK, Merritt ME, Suh EH, Malloy CR, Sherry AD, Kovacs Z. J Am Chem Soc. 2010;132:1784–1785. doi: 10.1021/ja910278e. [DOI] [PMC free article] [PubMed] [Google Scholar]
- 30.Lumata L, Jindal AK, Merritt ME, Malloy CR, Sherry AD, Kovacs Z. J Am Chem Soc. 2011;133:8673–8680. doi: 10.1021/ja201880y. [DOI] [PMC free article] [PubMed] [Google Scholar]
- 31.Kuzma NN, Pourfathi M, Kara H, Manasseh P, Ghosh RK, Ardenkjaer-Larsen JH, Kadlecek SJ, Rizi RR. J Chem Phys. 2012;137:104508. doi: 10.1063/1.4751021. [DOI] [PMC free article] [PubMed] [Google Scholar]
- 32.Shchepin RV, Coffey AM, Waddell KW, Chekmenev EY. J Am Chem Soc. 2012;134:3957–3960. doi: 10.1021/ja210639c. [DOI] [PMC free article] [PubMed] [Google Scholar]
- 33.Zacharias NM, Chan HR, Sailasuta N, Ross BD, Bhattacharya P. J Am Chem Soc. 2012;134:934–943. doi: 10.1021/ja2040865. [DOI] [PMC free article] [PubMed] [Google Scholar]
- 34.Bhattacharya P, Chekmenev EY, Perman WH, Harris KC, Lin AP, Norton VA, Tan CT, Ross BD, Weitekamp DP. J Magn Reson. 2007;186:150–155. doi: 10.1016/j.jmr.2007.01.017. [DOI] [PMC free article] [PubMed] [Google Scholar]
- 35.Lippert AR, Keshari KR, Kurhanewicz J, Chang CJ. J Am Chem Soc. 2011;133:3776–3779. doi: 10.1021/ja111589a. [DOI] [PMC free article] [PubMed] [Google Scholar]
- 36.Nonaka H, Hata R, Doura T, Nishihara T, Kumagai K, Akakabe M, Tsuda M, Ichikawa K, Sando S. Nat Commun. 2013;4:2411. doi: 10.1038/ncomms3411. [DOI] [PMC free article] [PubMed] [Google Scholar]
- 37.Gallagher FA, Kettunen MI, Day SE, Hu DE, Ardenkjaer-Larsen JH, Zandt RI, Jensen PR, Karlsson M, Golman K, Lerche MH, Brindle KM. Nature. 2008;453:940–943. doi: 10.1038/nature07017. [DOI] [PubMed] [Google Scholar]
- 38.Lerche MH, Meier S, Jensen PR, Baumann H, Petersen BO, Karlsson M, Duus JO, Ardenkjaer-Larsen JH. J Magn Reson. 2010;203:52–56. doi: 10.1016/j.jmr.2009.11.020. [DOI] [PubMed] [Google Scholar]
- 39.Warren WS, Jenista E, Branca RT, Chen X. Science. 2009;323:1711–1714. doi: 10.1126/science.1167693. [DOI] [PMC free article] [PubMed] [Google Scholar]
- 40.Wilson DM, Hurd RE, Keshari K, Van Criekinge M, Chen AP, Nelson SJ, Vigneron DB, Kurhanewicz J. Proc Natl Acad Sci U S A. 2009;106:5503–5507. doi: 10.1073/pnas.0810190106. [DOI] [PMC free article] [PubMed] [Google Scholar]
- 41.Lee Y, Heo GS, Zeng H, Wooley KL, Hilty C. J Am Chem Soc. 2013;135:4636–4639. doi: 10.1021/ja4001008. [DOI] [PubMed] [Google Scholar]
- 42.Abragam A, Goldman M. Rep Prog Phys. 1978;41:395–467. [Google Scholar]
- 43.Overhauser AW. Phys Rev. 1953;92:411–415. [Google Scholar]
- 44.de Boer W, Borghini M, Morimoto K, Niinikoski TO, Udo F. J Low Temp Phys. 1974;15:249–267. [Google Scholar]
- 45.Johannesson H, Macholl S, Ardenkjaer-Larsen JH. J Magn Reson. 2009;197:167–175. doi: 10.1016/j.jmr.2008.12.016. [DOI] [PubMed] [Google Scholar]
- 46.Lau AZ, Chen AP, Ghugre NR, Ramanan V, Lam WW, Connelly KA, Wright GA, Cunningham CH. Magn Reson Med. 2010;64:1323–1331. doi: 10.1002/mrm.22525. [DOI] [PubMed] [Google Scholar]
- 47.Blicharski JS. Z Naturforsch. 1972;A:1456–1458. [Google Scholar]
- 48.Harada M, Kubo H, Abe T, Maezawa H, Otsuka H. Jpn J Radiol. 2010;28:173–179. doi: 10.1007/s11604-009-0390-8. [DOI] [PubMed] [Google Scholar]
- 49.Allouche-Arnon H, Wade T, Waldner LF, Miller VN, Gomori JM, Katz-Brull R, McKenzie CA. Contrast Media Mol Imaging. 2013;8:72–82. doi: 10.1002/cmmi.1497. [DOI] [PubMed] [Google Scholar]
- 50.Levitt MH. Spin Dynamics: Basics of Nuclear Magnetic Resonance. 2. John Wiley & Sons Ltd; West Sussex, England: 2008. [Google Scholar]
- 51.Allouche-Arnon H, Lerche MH, Karlsson M, Lenkinski RE, Katz-Brull R. Contrast Media Mol Imaging. 2011;6:499–506. doi: 10.1002/cmmi.452. [DOI] [PubMed] [Google Scholar]
- 52.Chen AP, Tropp J, Hurd RE, Van Criekinge M, Carvajal LG, Xu D, Kurhanewicz J, Vigneron DB. J Magn Reson. 2009;197:100–106. doi: 10.1016/j.jmr.2008.12.004. [DOI] [PMC free article] [PubMed] [Google Scholar]
- 53.Mieville P, Jannin S, Bodenhausen G. J Magn Reson. 2011;210:137–140. doi: 10.1016/j.jmr.2011.02.006. [DOI] [PubMed] [Google Scholar]
- 54.Keshari KR, Kurhanewicz J, Macdonald JM, Wilson DM. Analyst. 2012;137:3427–3429. doi: 10.1039/c2an35406c. [DOI] [PMC free article] [PubMed] [Google Scholar]
- 55.Chattergoon N, Martinez-Santiesteban F, Handler WB, Ardenkjaer-Larsen JH, Scholl TJ. Contrast Media Mol Imaging. 2013;8:57–62. doi: 10.1002/cmmi.1494. [DOI] [PubMed] [Google Scholar]
- 56.Ragavan M, Chen HY, Sekar G, Hilty C. Anal Chem. 2011;83:6054–6059. doi: 10.1021/ac201122k. [DOI] [PubMed] [Google Scholar]
- 57.Bowen S, Hilty C. Phys Chem Chem Phys. 2010;12:5766–5770. doi: 10.1039/c002316g. [DOI] [PubMed] [Google Scholar]
- 58.Hariharan R, Bray M, Ganim R, Doenst T, Goodwin GW, Taegtmeyer H. Circulation. 1995;91:2435–2444. doi: 10.1161/01.cir.91.9.2435. [DOI] [PubMed] [Google Scholar]
- 59.Runge VM, Ai T, Hao D, Hu X. Invest Radiol. 2011;46:807–816. doi: 10.1097/RLI.0b013e318237913b. [DOI] [PubMed] [Google Scholar]
- 60.Magnusson P, Johansson E, Mansson S, Petersson JS, Chai CM, Hansson G, Axelsson O, Golman K. Magn Reson Med. 2007;57:1140–1147. doi: 10.1002/mrm.21239. [DOI] [PubMed] [Google Scholar]
- 61.Olsson LE, Chai CM, Axelsson O, Karlsson M, Golman K, Petersson JS. Magn Reson Med. 2006;55:731–737. doi: 10.1002/mrm.20847. [DOI] [PubMed] [Google Scholar]
- 62.Svensson J, Mansson S, Johansson E, Petersson JS, Olsson LE. Magn Reson Med. 2003;50:256–262. doi: 10.1002/mrm.10530. [DOI] [PubMed] [Google Scholar]
- 63.Golman K, Ardenkjaer-Larsen JH, Petersson JS, Mansson S, Leunbach I. Proc Natl Acad Sci U S A. 2003;100:10435–10439. doi: 10.1073/pnas.1733836100. [DOI] [PMC free article] [PubMed] [Google Scholar]
- 64.von Morze C, Larson PE, Hu S, Yoshihara HA, Bok RA, Goga A, Ardenkjaer-Larsen JH, Vigneron DB. Magn Reson Imaging. 2012;30:305–311. doi: 10.1016/j.mri.2011.09.026. [DOI] [PMC free article] [PubMed] [Google Scholar]
- 65.von Morze C, Bok RA, Sands JM, Kurhanewicz J, Vigneron DB. Am J Physiol Renal Physiol. 2012;302:F1658–F1662. doi: 10.1152/ajprenal.00640.2011. [DOI] [PMC free article] [PubMed] [Google Scholar]
- 66.Kaewlai R, Abujudeh H. AJR Am J Roentgenol. 2012;199:W17–W23. doi: 10.2214/AJR.11.8144. [DOI] [PubMed] [Google Scholar]
- 67.Laville M, Juillard L. J Nephrol. 2010;23:387–398. [PubMed] [Google Scholar]
- 68.Grant AK, Vinogradov E, Wang X, Lenkinski RE, Alsop DC. Magn Reson Med. 2011;66:746–755. doi: 10.1002/mrm.22860. [DOI] [PMC free article] [PubMed] [Google Scholar]
- 69.Reddy TJ, Iwama T, Halpern HJ, Rawal VH. J Org Chem. 2002;67:4635–4639. doi: 10.1021/jo011068f. [DOI] [PubMed] [Google Scholar]
- 70.Jannin S, Comment A, Kurdzesau F, Konter JA, Hautle P, van den Brandt B, van der Klink JJ. J Chem Phys. 2008;128:241102. doi: 10.1063/1.2951994. [DOI] [PubMed] [Google Scholar]
- 71.Lumata L, Ratnakar SJ, Jindal A, Merritt M, Comment A, Malloy C, Sherry AD, Kovacs Z. Chemistry. 2011;17:10825–10827. doi: 10.1002/chem.201102037. [DOI] [PMC free article] [PubMed] [Google Scholar]
- 72.Lumata L, Merritt M, Khemtong C, Ratnakar SJ, van Tol J, Yu L, Song L, Kovacs Z. RSC Adv. 2012;2:12812–12817. doi: 10.1039/C2RA21853D. [DOI] [PMC free article] [PubMed] [Google Scholar]
- 73.Lumata LL, Merritt ME, Malloy CR, Sherry AD, van Tol J, Song L, Kovacs Z. J Magn Reson. 2013;227:14–19. doi: 10.1016/j.jmr.2012.11.006. [DOI] [PMC free article] [PubMed] [Google Scholar]
- 74.Kiesewetter MK, Corzilius B, Smith AA, Griffin RG, Swager TM. J Am Chem Soc. 2012;134:4537–4540. doi: 10.1021/ja212054e. [DOI] [PMC free article] [PubMed] [Google Scholar]
- 75.Dane EL, Corzilius B, Rizzato E, Stocker P, Maly T, Smith AA, Griffin RG, Ouari O, Tordo P, Swager TM. J Org Chem. 2012;77:1789–1797. doi: 10.1021/jo202349j. [DOI] [PMC free article] [PubMed] [Google Scholar]
- 76.Michaelis VK, Smith AA, Corzilius B, Haze O, Swager TM, Griffin RG. J Am Chem Soc. 2013;135:2935–2938. doi: 10.1021/ja312265x. [DOI] [PMC free article] [PubMed] [Google Scholar]
- 77.Comment A, Van Den Brandt B, Uffmann K, Kurdzesau F, Jannin S, Konter J, Hautle P, Wenckebach W, Gruetter R, Van Der Klink J. Concepts Magn Reson Part B. 2007;31:255–269. [Google Scholar]
- 78.Jensen PR, Karlsson M, Meier S, Duus JO, Lerche MH. Chemistry. 2009;15:10010–10012. doi: 10.1002/chem.200901042. [DOI] [PubMed] [Google Scholar]
- 79.Harris T, Bretschneider C, Frydman L. J Magn Reson. 2011;211:96–100. doi: 10.1016/j.jmr.2011.04.001. [DOI] [PMC free article] [PubMed] [Google Scholar]
- 80.Lumata L, Kovacs Z, Malloy C, Sherry AD, Merritt M. Phys Med Biol. 2011;56:N85–92. doi: 10.1088/0031-9155/56/5/N01. [DOI] [PMC free article] [PubMed] [Google Scholar]
- 81.Lumata L, Merritt ME, Malloy CR, Sherry AD, Kovacs Z. J Phys Chem A. 2012;116:5129–5138. doi: 10.1021/jp302399f. [DOI] [PMC free article] [PubMed] [Google Scholar]
- 82.Gabellieri C, Leach MO, Eykyn TR. Contrast Media Mol Imaging. 2009;4:143–147. doi: 10.1002/cmmi.272. [DOI] [PubMed] [Google Scholar]
- 83.Wilson DM, Keshari KR, Larson PE, Chen AP, Hu S, Van Criekinge M, Bok R, Nelson SJ, Macdonald JM, Vigneron DB, Kurhanewicz J. J Magn Reson. 2010;205:141–147. doi: 10.1016/j.jmr.2010.04.012. [DOI] [PMC free article] [PubMed] [Google Scholar]
- 84.Schroeder MA, Atherton HJ, Ball DR, Cole MA, Heather LC, Griffin JL, Clarke K, Radda GK, Tyler DJ. FASEB J. 2009;23:2529–2538. doi: 10.1096/fj.09-129171. [DOI] [PMC free article] [PubMed] [Google Scholar]
- 85.Keshari KR, Kurhanewicz J, Bok R, Larson PE, Vigneron DB, Wilson DM. Proc Natl Acad Sci U S A. 2011;108:18606–18611. doi: 10.1073/pnas.1106920108. [DOI] [PMC free article] [PubMed] [Google Scholar]
- 86.Bohndiek SE, Kettunen MI, Hu DE, Kennedy BW, Boren J, Gallagher FA, Brindle KM. J Am Chem Soc. 2011;133:11795–11801. doi: 10.1021/ja2045925. [DOI] [PMC free article] [PubMed] [Google Scholar]
- 87.Hurd RE, Yen YF, Mayer D, Chen A, Wilson D, Kohler S, Bok R, Vigneron D, Kurhanewicz J, Tropp J, Spielman D, Pfefferbaum A. Magn Reson Med. 2010;63:1137–1143. doi: 10.1002/mrm.22364. [DOI] [PMC free article] [PubMed] [Google Scholar]
- 88.Yu YM, Kim JB, Lee KW, Kim SY, Han PL, Lee JK. Stroke. 2005;36:2238–2243. doi: 10.1161/01.STR.0000181779.83472.35. [DOI] [PubMed] [Google Scholar]
- 89.Svensson J. Acta Radiol, Suppl. 2003;429:1–30. doi: 10.1034/j.1600-0455.44.s.429.1.x. [DOI] [PubMed] [Google Scholar]
- 90.Keshari KR, Wilson DM, Chen AP, Bok R, Larson PE, Hu S, Van Criekinge M, Macdonald JM, Vigneron DB, Kurhanewicz J. J Am Chem Soc. 2009;131:17591–17596. doi: 10.1021/ja9049355. [DOI] [PMC free article] [PubMed] [Google Scholar]
- 91.Urano S, Iida M, Otani I, Matsuo M. Biochem Biophys Res Commun. 1987;146:1413–1418. doi: 10.1016/0006-291x(87)90807-2. [DOI] [PubMed] [Google Scholar]
- 92.Cleland WW. Arch Biochem Biophys. 2005;433:2–12. doi: 10.1016/j.abb.2004.08.027. [DOI] [PubMed] [Google Scholar]
- 93.Khripach V, Zhabinskii V. Chem Rec. 2007;7:265–274. doi: 10.1002/tcr.20123. [DOI] [PubMed] [Google Scholar]
- 94.Pan Y, Konermann L. Analyst. 2010;135:1191–1200. doi: 10.1039/b924805f. [DOI] [PubMed] [Google Scholar]
- 95.Meier S, Jensen PR, Duus JO. FEBS Lett. 2011;585:3133–3138. doi: 10.1016/j.febslet.2011.08.049. [DOI] [PubMed] [Google Scholar]
- 96.Westheimer FH. Chem Rev. 1961;61:265–273. [Google Scholar]
- 97.Glad SS, Jensen F. J Am Chem Soc. 1997;119:227–232. [Google Scholar]
- 98.Lee I. Chem Soc Rev. 1995;24:223–229. [Google Scholar]
- 99.Storer JW, Raimondi L, Houk KN. J Am Chem Soc. 1994;116:9675–9683. [Google Scholar]
- 100.Stutz J, Ezell MJ, FinlaysonPitts BJ. J Phys Chem A. 1997;101:9187–9190. [Google Scholar]
- 101.Meier S, Karlsson M, Jensen PR, Lerche MH, Duus JO. Mol BioSyst. 2011;7:2834–2836. doi: 10.1039/c1mb05202k. [DOI] [PubMed] [Google Scholar]
- 102.Leadlay PF, Albery WJ, Knowles JR. Biochemistry. 1976;15:5617–5620. doi: 10.1021/bi00670a029. [DOI] [PubMed] [Google Scholar]
- 103.Pauwels EK, Ribeiro MJ, Stoot JH, McCready VR, Bourguignon M, Maziere B. Nucl Med Biol. 1998;25:317–322. doi: 10.1016/s0969-8051(97)00226-6. [DOI] [PubMed] [Google Scholar]
- 104.Glunde K, Bhujwalla ZM, Ronen SM. Nat Rev Cancer. 2011;11:835–848. doi: 10.1038/nrc3162. [DOI] [PMC free article] [PubMed] [Google Scholar]
- 105.Sarkar R, Comment A, Vasos PR, Jannin S, Gruetter R, Bodenhausen G, Hall H, Kirik D, Denisov VP. J Am Chem Soc. 2009;131:16014–16015. doi: 10.1021/ja9021304. [DOI] [PubMed] [Google Scholar]
- 106.Agut J, Font E, Sacristan A, Ortiz JA. Arzneimittel-forschung. 1983;33:1016–1018. [PubMed] [Google Scholar]
- 107.Allouche-Arnon H, Gamliel A, Barzilay CM, Nalbandian R, Gomori JM, Karlsson M, Lerche MH, Katz-Brull R. Contrast Media Mol Imaging. 2011;6:139–147. doi: 10.1002/cmmi.418. [DOI] [PubMed] [Google Scholar]
- 108.Johnson RJ, Perez-Pozo SE, Sautin YY, Manitius J, Sanchez-Lozada LG, Feig DI, Shafiu M, Segal M, Glassock RJ, Shimada M, Roncal C, Nakagawa T. Endocr Rev. 2009;30:96–116. doi: 10.1210/er.2008-0033. [DOI] [PMC free article] [PubMed] [Google Scholar]
- 109.Lim JS, Mietus-Snyder M, Valente A, Schwarz JM, Lustig RH. Nat Rev Gastroenterol Hepatol. 2010;7:251–264. doi: 10.1038/nrgastro.2010.41. [DOI] [PubMed] [Google Scholar]
- 110.Zamora-Leon SP, Golde DW, Concha II, Rivas CI, Delgado-Lopez F, Baselga J, Nualart F, Vera JC. Proc Natl Acad Sci U S A. 1996;93:1847–1852. doi: 10.1073/pnas.93.5.1847. [DOI] [PMC free article] [PubMed] [Google Scholar]
- 111.Allouche-Arnon H, Wade T, Waldner LF, Miller VN, Gomori JM, Katz-Brull R, McKenzie CA. Contrast Media Mol Imaging. 2013;8:72–82. doi: 10.1002/cmmi.1497. [DOI] [PubMed] [Google Scholar]
- 112.Meier S, Solodovnikova N, Jensen PR, Wendland J. ChemBioChem. 2012;13:2265–2269. doi: 10.1002/cbic.201200450. [DOI] [PubMed] [Google Scholar]
- 113.Becker A, Kabsch W. J Biol Chem. 2002;277:40036–40042. doi: 10.1074/jbc.M205821200. [DOI] [PubMed] [Google Scholar]
- 114.Wegener G, Krause U. Biochem Soc Trans. 2002;30:264–270. doi: 10.1042/. [DOI] [PubMed] [Google Scholar]
- 115.Teusink B, Passarge J, Reijenga CA, Esgalhado E, van der Weijden CC, Schepper M, Walsh MC, Bakker BM, van Dam K, Westerhoff HV, Snoep JL. Eur J Biochem. 2000;267:5313–5329. doi: 10.1046/j.1432-1327.2000.01527.x. [DOI] [PubMed] [Google Scholar]
- 116.Yen KE, Bittinger MA, Su SM, Fantin VR. Oncogene. 2010;29:6409–6417. doi: 10.1038/onc.2010.444. [DOI] [PubMed] [Google Scholar]
- 117.Daye D, Wellen KE. Semin Cell Dev Biol. 2012;23:362–369. doi: 10.1016/j.semcdb.2012.02.002. [DOI] [PubMed] [Google Scholar]
- 118.Gallagher FA, Kettunen MI, Day SE, Lerche M, Brindle KM. Magn Reson Med. 2008;60:253–257. doi: 10.1002/mrm.21650. [DOI] [PubMed] [Google Scholar]
- 119.Qu W, Zha Z, Lieberman BP, Mancuso A, Stetz M, Rizzi R, Ploessl K, Wise D, Thompson C, Kung HF. Acad Radiol. 2011;18:932–939. doi: 10.1016/j.acra.2011.05.002. [DOI] [PubMed] [Google Scholar]
- 120.Barb AW, Hekmatyar SK, Glushka JN, Prestegard JH. J Magn Reson. 2013;228:59–65. doi: 10.1016/j.jmr.2012.12.013. [DOI] [PMC free article] [PubMed] [Google Scholar]
- 121.Koelsch BL, Keshari KR, Peeters TH, Larson PE, Wilson DM, Kurhanewicz J. Analyst. 2013;138:1011–1014. doi: 10.1039/c2an36715g. [DOI] [PMC free article] [PubMed] [Google Scholar]
- 122.Zagdoun A, Rossini AJ, Conley MP, Gruning WR, Schwarzwalder M, Lelli M, Franks WT, Oschkinat H, Coperet C, Emsley L, Lesage A. Angew Chem Int Ed. 2013;52:1222–1225. doi: 10.1002/anie.201208699. [DOI] [PubMed] [Google Scholar]
- 123.Johansson E, Mansson S, Wirestam R, Svensson J, Petersson JS, Golman K, Stahlberg F. Magn Reson Med. 2004;51:464–472. doi: 10.1002/mrm.20013. [DOI] [PubMed] [Google Scholar]
- 124.Pocker Y, Meany JE, Nist BJ, Zadorojn C. J Phys Chem. 1969;73:2879–2882. [Google Scholar]
- 125.Doura T, Hata R, Nonaka H, Ichikawa K, Sando S. Angew Chem Int Ed. 2012;51:10114–10117. doi: 10.1002/anie.201202885. [DOI] [PubMed] [Google Scholar]
- 126.Feng Y, Davis RM, Warren WS. Nat Phys. 2012;8:831–837. doi: 10.1038/nphys2425. [DOI] [PMC free article] [PubMed] [Google Scholar]
- 127.Pileio G, Carravetta M, Levitt MH. Proc Natl Acad Sci U S A. 2010;107:17135–17139. doi: 10.1073/pnas.1010570107. [DOI] [PMC free article] [PubMed] [Google Scholar]
- 128.Laustsen C, Pileio G, Tayler MC, Brown LJ, Brown RC, Levitt MH, Ardenkjaer-Larsen JH. Magn Reson Med. 2012;68:1262–1265. doi: 10.1002/mrm.24430. [DOI] [PubMed] [Google Scholar]
- 129.Gallagher FA, Kettunen MI, Brindle KM. NMR Biomed. 2011;24:1006–1015. doi: 10.1002/nbm.1742. [DOI] [PubMed] [Google Scholar]
- 130.Dickinson BC, Peltier J, Stone D, Schaffer DV, Chang CJ. Nat Chem Biol. 2011;7:106–112. doi: 10.1038/nchembio.497. [DOI] [PMC free article] [PubMed] [Google Scholar]
- 131.Rautio J, Kumpulainen H, Heimbach T, Oliyai R, Oh D, Jarvinen T, Savolainen J. Nat Rev Drug Discovery. 2008;7:255–270. doi: 10.1038/nrd2468. [DOI] [PubMed] [Google Scholar]
- 132.Hilty C, Bowen S. Org Biomol Chem. 2010;8:3361–3365. doi: 10.1039/c004420m. [DOI] [PubMed] [Google Scholar]
- 133.Bowen S, Hilty C. Anal Chem. 2009;81:4543–4547. doi: 10.1021/ac900456q. [DOI] [PubMed] [Google Scholar]
- 134.Zeng H, Lee Y, Hilty C. Anal Chem. 2010;82:8897–8902. doi: 10.1021/ac101670n. [DOI] [PubMed] [Google Scholar]
- 135.Akke M. Biochem Soc Trans. 2012;40:419–423. doi: 10.1042/BST20110750. [DOI] [PubMed] [Google Scholar]
- 136.Calle LP, Canada FJ, Jimenez-Barbero J. Nat Prod Rep. 2011;28:1118–1125. doi: 10.1039/c0np00071j. [DOI] [PubMed] [Google Scholar]
- 137.Jenkins BG. Life Sci. 1991;48:1227–1240. doi: 10.1016/0024-3205(91)90517-f. [DOI] [PubMed] [Google Scholar]
- 138.Bellia F, La Mendola D, Pedone C, Rizzarelli E, Saviano M, Vecchio G. Chem Soc Rev. 2009;38:2756–2781. doi: 10.1039/b718436k. [DOI] [PubMed] [Google Scholar]
- 139.Warburg O. Science. 1956;123:309–314. doi: 10.1126/science.123.3191.309. [DOI] [PubMed] [Google Scholar]
- 140.Warburg O, Wind F, Negelein E. J Gen Physiol. 1927;8:519–530. doi: 10.1085/jgp.8.6.519. [DOI] [PMC free article] [PubMed] [Google Scholar]
- 141.Cairns RA, Harris IS, Mak TW. Nat Rev Cancer. 2011;11:85–95. doi: 10.1038/nrc2981. [DOI] [PubMed] [Google Scholar]
- 142.Ward PS, Thompson CB. Cancer Cell. 2012;21:297–308. doi: 10.1016/j.ccr.2012.02.014. [DOI] [PMC free article] [PubMed] [Google Scholar]
- 143.Theorell H, Chance B. Acta Chem Scand. 1951;5:1127–1144. [Google Scholar]
- 144.Witney TH, Kettunen MI, Brindle KM. J Biol Chem. 2011;286:24572–24580. doi: 10.1074/jbc.M111.237727. [DOI] [PMC free article] [PubMed] [Google Scholar]
- 145.Bonen A. Eur J Appl Physiol. 2001;86:6–11. doi: 10.1007/s004210100516. [DOI] [PubMed] [Google Scholar]
- 146.Halestrap AP, Price NT. Biochem J. 1999;343(Pt 2):281–299. [PMC free article] [PubMed] [Google Scholar]
- 147.Garcia CK, Goldstein JL, Pathak RK, Anderson RG, Brown MS. Cell. 1994;76:865–873. doi: 10.1016/0092-8674(94)90361-1. [DOI] [PubMed] [Google Scholar]
- 148.Harris T, Eliyahu G, Frydman L, Degani H. Proc Natl Acad Sci U S A. 2009;106:18131–18136. doi: 10.1073/pnas.0909049106. [DOI] [PMC free article] [PubMed] [Google Scholar]
- 149.Hertz L, Dienel GA. J Neurosci Res. 2005;79:11–18. doi: 10.1002/jnr.20294. [DOI] [PubMed] [Google Scholar]
- 150.Manning Fox JE, Meredith D, Halestrap AP. J Physiol. 2000;529(Pt 2):285–293. doi: 10.1111/j.1469-7793.2000.00285.x. [DOI] [PMC free article] [PubMed] [Google Scholar]
- 151.Ganapathy V, Thangaraju M, Prasad PD. Pharmacol Ther. 2009;121:29–40. doi: 10.1016/j.pharmthera.2008.09.005. [DOI] [PubMed] [Google Scholar]
- 152.Keshari KR, Sriram R, Koelsch BL, Van Criekinge M, Wilson DM, Kurhanewicz J, Wang ZJ. Cancer Res. 2013;73:529–538. doi: 10.1158/0008-5472.CAN-12-3461. [DOI] [PMC free article] [PubMed] [Google Scholar]
- 153.Keshari KR, Kurhanewicz J, Jeffries RE, Wilson DM, Dewar BJ, Van Criekinge M, Zierhut M, Vigneron DB, Macdonald JM. Magn Reson Med. 2010;63:322–329. doi: 10.1002/mrm.22225. [DOI] [PMC free article] [PubMed] [Google Scholar]
- 154.Ward CS, Venkatesh HS, Chaumeil MM, Brandes AH, Vancriekinge M, Dafni H, Sukumar S, Nelson SJ, Vigneron DB, Kurhanewicz J, James CD, Haas-Kogan DA, Ronen SM. Cancer Res. 2010;70:1296–1305. doi: 10.1158/0008-5472.CAN-09-2251. [DOI] [PMC free article] [PubMed] [Google Scholar]
- 155.Day SE, Kettunen MI, Gallagher FA, Hu DE, Lerche MH, Wolber J, Golman K, Ardenkjaer-Larsen JH, Brindle KM. Nat Med. 2007;13:1382–1387. doi: 10.1038/nm1650. [DOI] [PubMed] [Google Scholar]
- 156.Albers MJ, Bok R, Chen AP, Cunningham CH, Zierhut ML, Zhang VY, Kohler SJ, Tropp J, Hurd RE, Yen YF, Nelson SJ, Vigneron DB, Kurhanewicz J. Cancer Res. 2008;68:8607–8615. doi: 10.1158/0008-5472.CAN-08-0749. [DOI] [PMC free article] [PubMed] [Google Scholar]
- 157.Schroeder MA, Cochlin LE, Heather LC, Clarke K, Radda GK, Tyler DJ. Proc Natl Acad Sci U S A. 2008;105:12051–12056. doi: 10.1073/pnas.0805953105. [DOI] [PMC free article] [PubMed] [Google Scholar]
- 158.Lau AZ, Chen AP, Hurd RE, Cunningham CH. NMR Biomed. 2011;24:988–996. doi: 10.1002/nbm.1743. [DOI] [PubMed] [Google Scholar]
- 159.Dodd MS, Ball DR, Schroeder MA, Le Page LM, Atherton HJ, Heather LC, Seymour AM, Ashrafian H, Watkins H, Clarke K, Tyler DJ. Cardiovasc Res. 2012;95:69–76. doi: 10.1093/cvr/cvs164. [DOI] [PMC free article] [PubMed] [Google Scholar]
- 160.Ushio-Fukai M, Nakamura Y. Cancer Lett. 2008;266:37–52. doi: 10.1016/j.canlet.2008.02.044. [DOI] [PMC free article] [PubMed] [Google Scholar]
- 161.Balendiran GK, Dabur R, Fraser D. Cell Biochem Funct. 2004;22:343–352. doi: 10.1002/cbf.1149. [DOI] [PubMed] [Google Scholar]
- 162.Morgan B, Ezerina D, Amoako TN, Riemer J, Seedorf M, Dick TP. Nat Chem Biol. 2013;9:119–125. doi: 10.1038/nchembio.1142. [DOI] [PubMed] [Google Scholar]
- 163.Linster CL, Van Schaftingen E. FEBS J. 2007;274:1–22. doi: 10.1111/j.1742-4658.2006.05607.x. [DOI] [PubMed] [Google Scholar]
- 164.Keshari KR, Sai V, Wang ZJ, Vanbrocklin HF, Kurhanewicz J, Wilson DM. J Nucl Med. 2013;54:922–928. doi: 10.2967/jnumed.112.115402. [DOI] [PMC free article] [PubMed] [Google Scholar]
- 165.Kohler SJ, Yen Y, Wolber J, Chen AP, Albers MJ, Bok R, Zhang V, Tropp J, Nelson S, Vigneron DB, Kurhanewicz J, Hurd RE. Magn Reson Med. 2007;58:65–69. doi: 10.1002/mrm.21253. [DOI] [PubMed] [Google Scholar]
- 166.Lee P, Leong W, Tan T, Lim M, Han W, Radda GK. Hepatology. 2013;57:515–524. doi: 10.1002/hep.26028. [DOI] [PubMed] [Google Scholar]
- 167.Merritt ME, Harrison C, Sherry AD, Malloy CR, Burgess SC. Proc Natl Acad Sci U S A. 2011;108:19084–19089. doi: 10.1073/pnas.1111247108. [DOI] [PMC free article] [PubMed] [Google Scholar]
- 168.Hu S, Balakrishnan A, Bok RA, Anderton B, Larson PE, Nelson SJ, Kurhanewicz J, Vigneron DB, Goga A. Cell Metab. 2011;14:131–142. doi: 10.1016/j.cmet.2011.04.012. [DOI] [PMC free article] [PubMed] [Google Scholar]
- 169.Karlsson M, Jensen PR, in’t Zandt R, Gisselsson A, Hansson G, Duus JO, Meier S, Lerche MH. Int J Cancer. 2010;127:729–736. doi: 10.1002/ijc.25072. [DOI] [PubMed] [Google Scholar]
- 170.Butt SA, Sogaard LV, Magnusson PO, Lauritzen MH, Laustsen C, Akeson P, Ardenkjaer-Larsen JH. J Cereb Blood Flow Metab. 2012;32:1508–1514. doi: 10.1038/jcbfm.2012.34. [DOI] [PMC free article] [PubMed] [Google Scholar]
- 171.Zhou ZH, McCarthy DB, O’Connor CM, Reed LJ, Stoops JK. Proc Natl Acad Sci U S A. 2001;98:14802–14807. doi: 10.1073/pnas.011597698. [DOI] [PMC free article] [PubMed] [Google Scholar]
- 172.Merritt M, Harrison C, Storey C, Jeffrey FM, Sherry AD, Malloy CR. Proc Natl Acad Sci U S A. 2007;104:19773–19777. doi: 10.1073/pnas.0706235104. [DOI] [PMC free article] [PubMed] [Google Scholar]
- 173.Merritt ME, Harrison C, Storey C, Sherry AD, Malloy CR. Magn Reson Med. 2008;60:1029–1036. doi: 10.1002/mrm.21760. [DOI] [PMC free article] [PubMed] [Google Scholar]
- 174.Atherton HJ, Dodd MS, Heather LC, Schroeder MA, Griffin JL, Radda GK, Clarke K, Tyler DJ. Circulation. 2011;123:2552–2561. doi: 10.1161/CIRCULATIONAHA.110.011387. [DOI] [PMC free article] [PubMed] [Google Scholar]
- 175.Hu S, Yoshihara HA, Bok R, Zhou J, Zhu M, Kurhanewicz J, Vigneron DB. Magn Reson Imaging. 2012;30:1367–1372. doi: 10.1016/j.mri.2012.05.012. [DOI] [PMC free article] [PubMed] [Google Scholar]
- 176.Dodd MS, Ball V, Bray R, Ashrafian H, Watkins H, Clarke K, Tyler DJ. J Cardiovasc Magn Reson. 2013;15:19. doi: 10.1186/1532-429X-15-19. [DOI] [PMC free article] [PubMed] [Google Scholar]
- 177.Chen AP, Hurd RE, Schroeder MA, Lau AZ, Gu YP, Lam WW, Barry J, Tropp J, Cunningham CH. NMR Biomed. 2012;25:305–311. doi: 10.1002/nbm.1749. [DOI] [PMC free article] [PubMed] [Google Scholar]
- 178.Jitrapakdee S, St Maurice M, Rayment I, Cleland WW, Wallace JC, Attwood PV. Biochem J. 2008;413:369–387. doi: 10.1042/BJ20080709. [DOI] [PMC free article] [PubMed] [Google Scholar]
- 179.Liu YQ, Han J, Epstein PN, Long YS. Am J Physiol Endocrinol Metab. 2005;288:E471–478. doi: 10.1152/ajpendo.00427.2004. [DOI] [PubMed] [Google Scholar]
- 180.Martin RB. Biopolymers. 1998;45:351–353. [Google Scholar]
- 181.Kilshtain AV, Warshel A. Proteins. 2009;77:536–550. doi: 10.1002/prot.22466. [DOI] [PMC free article] [PubMed] [Google Scholar]
- 182.Bouchelouche K, Choyke PL, Capala J. Discov Med. 2010;9:55–61. [PMC free article] [PubMed] [Google Scholar]
- 183.Rahn KA, Watkins CC, Alt J, Rais R, Stathis M, Grishkan I, Crainiceau CM, Pomper MG, Rojas C, Pletnikov MV, Calabresi PA, Brandt J, Barker PB, Slusher BS, Kaplin AI. Proc Natl Acad Sci U S A. 2012;109:20101–20106. doi: 10.1073/pnas.1209934109. [DOI] [PMC free article] [PubMed] [Google Scholar]
- 184.Ghosh A, Heston WD. J Cell Biochem. 2004;91:528–539. doi: 10.1002/jcb.10661. [DOI] [PubMed] [Google Scholar]
- 185.Jamin Y, Gabellieri C, Smyth L, Reynolds S, Robinson SP, Springer CJ, Leach MO, Payne GS, Eykyn TR. Magn Reson Med. 2009;62:1300–1304. doi: 10.1002/mrm.22049. [DOI] [PubMed] [Google Scholar]
- 186.Oda Y. Pathol Int. 1999;49:921–937. doi: 10.1046/j.1440-1827.1999.00977.x. [DOI] [PubMed] [Google Scholar]
- 187.Lee KK, Workman JL. Nat Rev Mol Cell Biol. 2007;8:284–295. doi: 10.1038/nrm2145. [DOI] [PubMed] [Google Scholar]
- 188.Chen AP, Hurd RE, Gu YP, Wilson DM, Cunningham CH. NMR Biomed. 2011;24:514–520. doi: 10.1002/nbm.1618. [DOI] [PubMed] [Google Scholar]
- 189.Ferrannini E. Metabolism. 1988;37:287–301. doi: 10.1016/0026-0495(88)90110-2. [DOI] [PubMed] [Google Scholar]
- 190.Stocchi V, Magnani M, Canestrari F, Dacha M, Fornaini G. J Biol Chem. 1982;257:2357–2364. [PubMed] [Google Scholar]
- 191.Cao X, Bloomston M, Zhang T, Frankel WL, Jia G, Wang B, Hall NC, Koch RM, Cheng H, Knopp MV, Sun D. Clin Cancer Res. 2008;14:1831–1839. doi: 10.1158/1078-0432.CCR-07-1607. [DOI] [PubMed] [Google Scholar]
- 192.Podo F. NMR Biomed. 1999;12:413–439. doi: 10.1002/(sici)1099-1492(199911)12:7<413::aid-nbm587>3.0.co;2-u. [DOI] [PubMed] [Google Scholar]
- 193.Ackerstaff E, Glunde K, Bhujwalla ZM. J Cell Biochem. 2003;90:525–533. doi: 10.1002/jcb.10659. [DOI] [PubMed] [Google Scholar]
- 194.Keshari KR, Tsachres H, Iman R, Delos Santos L, Tabatabai ZL, Shinohara K, Vigneron DB, Kurhanewicz J. NMR Biomed. 2011;24:691–699. doi: 10.1002/nbm.1738. [DOI] [PMC free article] [PubMed] [Google Scholar]
- 195.Miyake T, Parsons SJ. Oncogene. 2012;31:1431–1441. doi: 10.1038/onc.2011.332. [DOI] [PMC free article] [PubMed] [Google Scholar]
- 196.Gallagher FA, Kettunen MI, Hu D-E, Jensen PR, in’t Zandt R, Karlsson M, Gisselsson A, Nelson SK, Witney TH, Bohndiek SE, Hansson G, Peitersen T, Lerche MH, Brindle KM. Proc Natl Acad Sci U S A. 2009;106:19801–19806. doi: 10.1073/pnas.0911447106. [DOI] [PMC free article] [PubMed] [Google Scholar]
- 197.Tripp BC, Smith K, Ferry JG. J Biol Chem. 2001;276:48615–48618. doi: 10.1074/jbc.R100045200. [DOI] [PubMed] [Google Scholar]
- 198.Supuran CT. Nat Rev Drug Discovery. 2008;7:168–181. doi: 10.1038/nrd2467. [DOI] [PubMed] [Google Scholar]
- 199.Gillies RJ, Galons JP, McGovern KA, Scherer PG, Lien YH, Job C, Ratcliff R, Chapa F, Cerdan S, Dale BE. NMR Biomed. 1993;6:95–104. doi: 10.1002/nbm.1940060115. [DOI] [PubMed] [Google Scholar]
- 200.Mancuso A, Fernandez EJ, Blanch HW, Clark DS. Biotechnology. 1990;8:1282–1285. doi: 10.1038/nbt1290-1282. [DOI] [PubMed] [Google Scholar]
- 201.Macdonald JM, Grillo M, Schmidlin O, Tajiri DT, James TL. NMR Biomed. 1998;11:55–66. doi: 10.1002/(sici)1099-1492(199804)11:2<55::aid-nbm502>3.0.co;2-f. [DOI] [PubMed] [Google Scholar]
- 202.DeBerardinis RJ, Mancuso A, Daikhin E, Nissim I, Yudkoff M, Wehrli S, Thompson CB. Proc Natl Acad Sci U S A. 2007;104:19345–19350. doi: 10.1073/pnas.0709747104. [DOI] [PMC free article] [PubMed] [Google Scholar]
- 203.Jeffries RE, Gamcsik MP, Keshari KR, Pediaditakis P, Tikunov AP, Young GB, Lee H, Watkins PB, Macdonald JM. Tissue Eng Part C. 2013;19:93–100. doi: 10.1089/ten.tec.2011.0629. [DOI] [PMC free article] [PubMed] [Google Scholar]
- 204.Hutchinson L, Kirk R. Nat Rev Clin Oncol. 2011;8:189–190. doi: 10.1038/nrclinonc.2011.34. [DOI] [PubMed] [Google Scholar]
- 205.Begley CG, Ellis LM. Nature. 2012;483:531–533. doi: 10.1038/483531a. [DOI] [PubMed] [Google Scholar]
- 206.Keshari KR, Sriram R, Van Criekinge M, Wilson DM, Wang ZJ, Vigneron DB, Peehl DM, Kurhanewicz J. Prostate. 2013;73:1171–1181. doi: 10.1002/pros.22665. [DOI] [PMC free article] [PubMed] [Google Scholar]
- 207.Harrison C, Yang C, Jindal A, DeBerardinis RJ, Hooshyar MA, Merritt M, Dean Sherry A, Malloy CR. NMR Biomed. 2012;25:1286–1294. doi: 10.1002/nbm.2801. [DOI] [PMC free article] [PubMed] [Google Scholar]
- 208.Zierhut ML, Yen YF, Chen AP, Bok R, Albers MJ, Zhang V, Tropp J, Park I, Vigneron DB, Kurhanewicz J, Hurd RE, Nelson SJ. J Magn Reson. 2010;202:85–92. doi: 10.1016/j.jmr.2009.10.003. [DOI] [PMC free article] [PubMed] [Google Scholar]
- 209.Larson PE, Kerr AB, Reed GD, Hurd RE, Kurhanewicz J, Pauly JM, Vigneron DB. IEEE Trans Med Imaging. 2012;31:265–275. doi: 10.1109/TMI.2011.2168235. [DOI] [PMC free article] [PubMed] [Google Scholar]
- 210.Gallagher FA, Kettunen MI, Hu DE, Jensen PR, Zandt RI, Karlsson M, Gisselsson A, Nelson SK, Witney TH, Bohndiek SE, Hansson G, Peitersen T, Lerche MH, Brindle KM. Proc Natl Acad Sci U S A. 2009;106:19801–19806. doi: 10.1073/pnas.0911447106. [DOI] [PMC free article] [PubMed] [Google Scholar]
- 211.Brindle KM, Bohndiek SE, Gallagher FA, Kettunen MI. Magn Reson Med. 2011;66:505–519. doi: 10.1002/mrm.22999. [DOI] [PubMed] [Google Scholar]
- 212.Viale A, Aime S. Curr Opin Chem Biol. 2010;14:90–96. doi: 10.1016/j.cbpa.2009.10.021. [DOI] [PubMed] [Google Scholar]
- 213.Hurd RE, Yen YF, Chen A, Ardenkjaer-Larsen JH. J Magn Reson Imaging. 2012;36:1314–1328. doi: 10.1002/jmri.23753. [DOI] [PubMed] [Google Scholar]
- 214.Witney TH, Kettunen MI, Day SE, Hu DE, Neves AA, Gallagher FA, Fulton SM, Brindle KM. Neoplasia. 2009;11:574–582. 571. doi: 10.1593/neo.09254. following 582. [DOI] [PMC free article] [PubMed] [Google Scholar]
- 215.Tyler DJ. Curr Cardiovasc Imaging Rep. 2011;4:108–115. doi: 10.1007/s12410-011-9066-8. [DOI] [PMC free article] [PubMed] [Google Scholar]
- 216.Chaumeil MM, Ozawa T, Park I, Scott K, James CD, Nelson SJ, Ronen SM. Neuroimage. 2012;59:193–201. doi: 10.1016/j.neuroimage.2011.07.034. [DOI] [PMC free article] [PubMed] [Google Scholar]
- 217.Schroeder MA, Ali MA, Hulikova A, Supuran CT, Clarke K, Vaughan-Jones RD, Tyler DJ, Swietach P. Proc Natl Acad Sci U S A. 2013;110:E958–E967. doi: 10.1073/pnas.1213471110. [DOI] [PMC free article] [PubMed] [Google Scholar]
- 218.Martinovich GG, Martinovich IV, Cherenkevich SN, Sauer H. Cell Biochem Biophys. 2010;58:75–83. doi: 10.1007/s12013-010-9090-3. [DOI] [PubMed] [Google Scholar]
- 219.Schafer FQ, Buettner GR. Free Radical Biol Med. 2001;30:1191–1212. doi: 10.1016/s0891-5849(01)00480-4. [DOI] [PubMed] [Google Scholar]
- 220.Ardenkjaer-Larsen JH, Laustsen C, Pullinger B, Kadlecek SJ, Emami K, Rizi RR. Proc Intl Soc Mag Reson Med 19 Montreal Canada. 2011 [Google Scholar]
- 221.Chiavazza E, Kubala E, Gringeri CV, Duwel S, Durst M, Schulte RF, Menzel MI. J Magn Reson. 2013;227:35–38. doi: 10.1016/j.jmr.2012.11.016. [DOI] [PubMed] [Google Scholar]
- 222.Merritt ME, Harrison C, Mander W, Malloy CR, Sherry AD. J Magn Reson. 2007;189:280–285. doi: 10.1016/j.jmr.2007.09.011. [DOI] [PMC free article] [PubMed] [Google Scholar]
- 223.Jensen PR, Meier S, Ardenkjaer-Larsen JH, Duus JO, Karlsson M, Lerche MH. Chem Commun. 2009:5168–5170. doi: 10.1039/b910626j. [DOI] [PubMed] [Google Scholar]
- 224.Jensen PR, Peitersen T, Karlsson M, In’t Zandt R, Gisselsson A, Hansson G, Meier S, Lerche MH. J Biol Chem. 2009;284:36077–36082. doi: 10.1074/jbc.M109.066407. [DOI] [PMC free article] [PubMed] [Google Scholar]
- 225.Hu S, Zhu M, Yoshihara HA, Wilson DM, Keshari KR, Shin P, Reed G, von Morze C, Bok R, Larson PE, Kurhanewicz J, Vigneron DB. Magn Reson Imaging. 2011;29:1035–1040. doi: 10.1016/j.mri.2011.07.001. [DOI] [PMC free article] [PubMed] [Google Scholar]
- 226.Colombo Serra S, Karlsson M, Giovenzana GB, Cavallotti C, Tedoldi F, Aime S. Contrast Media Mol Imaging. 2012;7:469–477. doi: 10.1002/cmmi.1474. [DOI] [PubMed] [Google Scholar]
- 227.Chen AP, Kurhanewicz J, Bok R, Xu D, Joun D, Zhang V, Nelson SJ, Hurd RE, Vigneron DB. Magn Reson Imaging. 2008;26:721–726. doi: 10.1016/j.mri.2008.01.002. [DOI] [PMC free article] [PubMed] [Google Scholar]
- 228.Bowen S, Hilty C. Angew Chem Int Ed. 2008;47:5235–5237. doi: 10.1002/anie.200801492. [DOI] [PubMed] [Google Scholar]
- 229.Gore JC, Kennan RP. In: Magn Reson Imaging. 3. Stark DD, Bradley WG, editors. Vol. 1 Mosby; St. Louis: 1999. [Google Scholar]