

Abstract
Elevated rate of age-related decline in white matter integrity, indexed by fractional anisotropy (FA) from diffusion tensor imaging, was reported in patients with schizophrenia. Its etiology is unknown. We hypothesized that a decline of blood perfusion to the white matter may underlie the accelerated age-related reduction in FA in schizophrenia. Resting white matter perfusion and FA were collected using pseudo-continuous arterial spin labeling and high-angular-resolution diffusion tensor imaging, respectively, in 50 schizophrenia patients and 70 controls (age=18-63 years). Main outcome measures were the diagnosis-by-age interaction on whole-brain white matter perfusion, and FA. Significant age-related decline in brain white matter perfusion and FA were present in both groups. Age-by-diagnosis interaction was significant for FA (p<0.001) but not white matter perfusion. Age-by-diagnosis interaction for FA values remained significant even after accounting for age-related decline in perfusion. Therefore, we replicated the finding of an increased rate of age-related white matter FA decline in schizophrenia, and observed a significant age-related decline in white matter blood perfusion, although the latter did not contribute to the accelerated age-related decline in FA. The results suggest that factors other than reduced perfusion account for the accelerated age-related decline in white matter integrity in schizophrenia.
Keywords: ASL, perfusion, aging, white matter, schizophrenia
Introduction
An increased rate of age-related decline in white matter (WM) integrity has been demonstrated in schizophrenia patients in several (Friedman et al 2008; Kochunov et al 2012b; Mori et al 2007) but not all studies (Chiapponi et al 2013). The accelerated rate of WM change coincides with schizophrenia patients’ increased rates in somatic diseases such as cardiovascular illnesses, hypertension and diabetes (Hennekens et al 2005), all of which are known to increase in occurrence with normal aging. Schizophrenia patients also have an increased mortality rate and shorter (by as much as twenty years) average lifespan, even after accounting for suicide (Brown 1997; Kirkpatrick et al 2008; Saha et al 2007; Tsuang and Woolson 1978). The finding of accelerated decline in WM integrity was one of the first evidence of the abnormally higher rate of the aging process in the brain structure of schizophrenia patients. Its biological basis is obscure.
Declining cerebrovascular health is a risk factor for WM integrity during normal aging (He W. et al 2006; Kennedy and Raz 2009; Kochunov et al 2011; Maclullich et al 2009; Nitkunan et al 2008) and schizophrenia is associated with an increased rate of cardiovascular illnesses (Hennekens et al 2005). Cerebral WM is perfused via long penetrating arterioles that originate at the surface of the brain (Brown and Thore 2011). This renders WM more vulnerable than gray matter (GM) for small vessel disorders (Kochunov et al 2011; Kochunov et al 2012a; Wardlaw et al 2013). Associative WM tracts, which show the highest rate of accelerated aging in schizophrenia (Kochunov et al 2012b), are especially susceptible to declining vascular health due to their location in the watershed areas (Minkner et al 2005). In addition, oligodendrocytes of the associative frontal WM are among the most metabolically active neural cells, which contribute to the high vulnerability to hypoperfusion in these WM areas (Bartzokis et al 2004). Therefore, an increased rate of age-related decline in WM perfusion, if found in schizophrenia, may impact oligodendrocytes and WM integrity, and provide an explanation to the accelerated decline of the WM integrity in schizophrenia patients.
Perfusion refers to microcirculation of blood to supply tissues with nutrients and remove metabolic waste, and when measured during resting state, is thought to be coupled with basal glucose utilization and metabolism (Biagi et al 2007). Findings of cerebral blood flow (CBF) in schizophrenia concentrated on the reports of cortical differences between patients and controls and relationship between CBF and symptom severity (Andreasen et al 1996; Pinkham et al 2011; Scheef et al 2010; Vita et al 1995). We hypothesized that reduced CBF will detrimentally impact WM more than GM, due to less compensatory blood supply. The reduced WM CBF may contribute to the reduced WM integrity, as assessed with DTI, in participants with schizophrenia and drive its accelerated decline with age. Therefore, we tested if WM perfusion contributes to the accelerated age-related decline of WM integrity observed in schizophrenia.
Previously, we compared cerebral WM FA aging trends in schizophrenia and normal control cohorts, and found that the age-related decline in the whole-brain FA values was approximately twice as fast in patients compared with controls (Kochunov et al 2012b). The current study pursued two aims to follow-up this finding. The primary aim was to test if accelerated age-related decline in WM integrity in participants with schizophrenia, compared with controls, is associated with an increased rate of age-related decline in WM blood perfusion. The secondary aim was to re-examine and replicate the finding of accelerated aging of the cerebral WM in schizophrenia in an independent cohort using a more modern DTI sequence.
Methods
Participants
Fifty (age=36.9±13.4 years) individuals with schizophrenia and seventy (age=38.9±13.7 years) healthy controls participated in the study. All participants gave written informed consent approved by the University of Maryland Internal Review Board. All participants were evaluated using the Structured Clinical Interview for the DSM-IV. Patients were individuals with an Axis I diagnosis of schizophrenia or schizoaffective disorder, recruited through the Maryland Psychiatric Research and neighboring mental health clinics. Controls were participants without Axis I psychiatric diagnosis. Controls were recruited through media advertisements. Additional clinical and epidemiological information is provided in Table 1. Individuals who participated in the previous study of DTI and accelerated aging (Kochunov et al 2012b) were excluded. The exclusion criteria included hypertension, hyperlipidemia, type 2 diabetes, heart disorders, and major neurological events, such as stroke or transient ischemic attack. Illicit substance and alcohol abuse and dependence were exclusion criteria. Except for seven medication-free participants, schizophrenia patients were on antipsychotic medications: ten were on first-generation antipsychotics and the rest were on either second-generation or combined first- and second-generation antipsychotics.
Table 1.
Demographic and clinical characteristics. BMI: body mass index.
| Sex (female:male) |
Age (years) | Age of onset (years) |
Duration (years) |
BMI | Current Smokers |
|
|---|---|---|---|---|---|---|
| Patients | 19/31 | 36.9±13.4 | 19.1±8.1 | 19.1±12.9 | 30.0±6.2 | 34% |
| Controls | 29/41 | 38.9±13.7 | N/A | N/A | 29.9±5.3 | 23% |
| Group difference, p- | 0.55 | 0.45 | 0.42 | 0.18 |
Diffusion Tensor Imaging (DTI)
All imaging was performed at the University of Maryland Center for Brain Imaging Research using a Siemens 3T TRIO MRI (Erlangen, Germany) system equipped with a 32-channel phase array head coil. The high-angular resolution diffusion imaging (HARDI) DTI data were collected using a single-shot, echo-planar, single refocusing spin-echo, T2-weighted sequence with a spatial resolution of 1.7×1.7×3.0 mm. The sequence parameters were: TE/TR=87/8000ms, FOV=200mm, axial slice orientation with 50 slices and no gaps, five b=0 images and 64 isotropically distributed diffusion weighted directions with b= 700 s/mm2. These parameters maximized the contrast to noise ratio for FA measurements (Kochunov et al 2012b). A tract-based spatial statistics (TBSS) method, distributed as a part of FMRIB Software Library (FSL) package, was used for tract-based analysis of diffusion anisotropy (Smith et al 2006). First, fractional anisotropy (FA) images were created by fitting the diffusion tensor to the motion and eddy current diffusion data. RMSDIFF (Smith et al 2004) was used to estimate the root mean square (RMS) movement distance between diffusion sensitized and b=0 images. All data passed QA control of <3mm accumulated motion during the scan. There were no difference in the average motion per TR between patients and controls (0.42±0.21 vs. 0.43±0.20, for patients and controls, respectively). In the next step, all FA images were globally spatially normalized to the Johns Hopkins University (JHU) atlas that is distributed with the FSL package, version 5.0.1 (Wakana et al 2004) and then nonlinearly aligned to a group-wise, minimal-deformation target (MDT) brain as detailed elsewhere (Jahanshad et al 2013). The global spatial normalization was performed using a method distributed with FSL package (FLIRT) (Smith et al 2006) with 12 degrees of freedom. This step was performed to reduce the global intersubject variability in brain volumes prior to non-linear alignment. The group’s MDT brain was identified by warping all individual brain images in the group to each other (Kochunov et al 2001). The MDT was selected as the image that minimizes the amount of the required deformation from other images in the group. Next, individual FA images were averaged to produce a group-average anisotropy image. This image was used to create a group-wise skeleton of WM tracts. The skeletonization procedure was a morphological operation, which extracts the medial axis of an object. This procedure was used to encode the medial trajectory of the WM fiber-tracts with one-voxel thin sheaths. Finally, FA images were thresholded at FA=0.20 level to eliminate non-WM voxels and FA values were projected onto the group-wise skeleton of WM structures. This step accounts for residual misalignment among individual WM tracts. FA values were assigned to each point along a skeleton using the peak value found within a designated range perpendicular to the skeleton. The FA values vary rapidly perpendicular to the tract direction but vary slowly along the tract direction. By assigning the peak value to the skeleton, this procedure effectively maps the center of individual WM tracts onto the skeleton. This processing was performed under two constraints. First, a distance map was used to establish search borders for individual tracts. The borders were created by equally dividing the distance between two nearby tracts. Secondly, a multiplicative 20mm full width at half-max Gaussian weighting was applied during the search to limit maximum projection distance from the skeleton.
Pseudo-continuous arterial spin labeling imaging (pCASL)
Detection of WM perfusion using ASL techniques was challenging in the past due to reduced volume coverage, low spatial resolution and low signal to noise ratio (van Gelderen et al 2008). However, recent technical developments in pulse sequence design and more sensitive phase-array coils have greatly improved the usefulness of this technique in clinical research (Wang et al 2005; Wang and Licht 2006). Here we used a state-of-the-art pCASL sequence that provided full brain coverage with high spatial resolution and excellent WM SNR ratio (SNR>15). Specifically, we used a pCASL EPI with TE/TR = 16/4000 ms, labeling duration = 2100 ms, 24 contiguous slices with 5 mm thickness, matrix = 64 × 64, 3.4 × 3.4 × 5 mm resolution (FOV = 220mm) labeling gradient of 0.6 G/cm, bandwidth=1594 Hz/pixel, 136 measurements, labeling offset = 90 mm, labeling duration of 1.85 s, post labeling delay of 0.93s. A total of 68 alternating labeled and unlabeled image pairs were collected. Equilibrium magnetization (M0) images were collected using a long TR=10s protocol. T1-weighted images were collected using a protocol optimized to resolve the cortical ribbon using isotropic spatial sampling of 0.8mm, voxel size =0.5mm3. T1-weighted contrast was achieved using a magnetization prepared sequence with an adiabatic inversion contrast-forming pulse (scan parameters: TE/TR/TI=3.04/2100/785 ms, flip angle=11 degrees). ASL data were processed using the pipeline described elsewhere (http://www.mccauslandcenter.sc.edu/CRNL/tools/asl). In short, labeled and unlabeled ASL images were independently motion-corrected and a combined mean image was computed and co-registered to the spatially normalized T1-weighted anatomical image. T1-weighted image was tissue classified to produce the gray and WM tissue map. Perfusion weighted images were calculated by voxel-wise subtractions of unlabeled and labeled images resulting in a mean perfusion weighted image.
Absolute WM perfusion or WM cerebral blood flow (CBFWM) (blood flow and perfusion are interchangeable terms here) quantification was calculated in native space from the mean perfusion images. Voxel-wise perfusion, in mL per 100 g per minute, was calculated under the assumption that the post label delay was longer than average transfer time (Wang et al 2002) where labeling efficiency was set at 0.99, the mean transit time set to 0.7s based on empirical data (Wey et al 2012).
Regional FA and ASL WM measurement
DTI data was processed using a tract-based spatial statistics (TBSS) method and the population-based, 3D, DTI cerebral WM tract atlas developed at Johns Hopkins University (JHU) and distributed with the FSL package was used to calculate population average FA values along the spatial course of twelve major WM tracts (Glahn et al 2011; Kochunov et al 2012c; Wakana et al 2004). The average perfusion maps were registered to the common FSL space using their corresponding T1-weighted images. A GM perfusion map was calculated by multiplying the average perfusion mask by the participant’s binary GM tissue map. The WM perfusion map was calculated by applying a participant’s binary WM tissue map that was eroded with a 10-mm spherical kernel to reduce contamination of WM CBF due to partial voxel averaging to the average perfusion map (Mutsaerts et al 2013). Tract-wise ROIs from the JHU atlas were used to calculate average CBFWM and FA values along the spatial course of the twelve major WM tracts. Per-tract average values were then calculated by averaging the values along the tracts in both hemispheres. The whole-brain WM average FA value was calculated by averaging across the entire skeleton. The whole-brain WM average CBF value was calculated by averaging across the entire eroded WM map.
Statistical analysis
All imaging data were processed blind to group information. We used the same statistical approach in an effort to replicate the previously reported study diagnosis-by-age interaction on the age-related FA trends (Kochunov et al 2012b). Given the known nonlinear age-related trajectory of FA, we examined both linear (eq. 1) and quadratic (eq. 2) effects of age on WM perfusion (CBFWM) and FA measurements(Kochunov et al 2012b). CBFWM and FA values were separately modeled where diagnosis and age were the predictors. The age × diagnosis interaction term examined the presence of disease-specific aging effect on CBFWM or FA.
| (1) |
| (2) |
Where dx is the diagnosis, A is the constant CBFWM (or FA) term and β is the standardized regression coefficient for each of the predictors.
Next, we expanded models 1 and 2 by adding CBFWM to the predictors (models 3 and 4).
| (3) |
| (4) |
These analyses re-examined the age and age × diagnosis effect on FA after accounting for the effect of CBFWM. The modeling was performed with the R package (R-Development-Core-Team 2009) using the general linear model library and the maximum likelihood estimation algorithm. All modeling was performed on age-centered data by subtracting the mean for the both groups (38.13 years old) from the age of the participants. The statistics of the age-by-diagnosis interaction terms from each model tested the primary hypothesis of accelerated aging effect in schizophrenia.
Results
Patient-control differences in FA and perfusion
Group comparisons of the whole-brain average WM FA and CBF were performed using two-tailed t-tests. Patients showed significantly reduced average WM FA (p=0.01) but no significant differences in the whole brain average CBF values (p=0.40) (Figure 1). Likewise, there were also no group differences in whole-brain (WM+GM) or GM perfusion (p=0.61 and 0.32, respectively). The FA values were significantly correlated with WM perfusion in the combined sample (n=120, r=0.29, p=0.005), with no significant differences in the correlations between patients and controls (p=0.35) (Figure 2). FA values were not significantly correlated with either the whole-brain perfusion or GM perfusion in the combined sample (r=0.08 and 0.05, respectively; all p>0.5) or either of the groups (all p>0.4).
Figure 1.
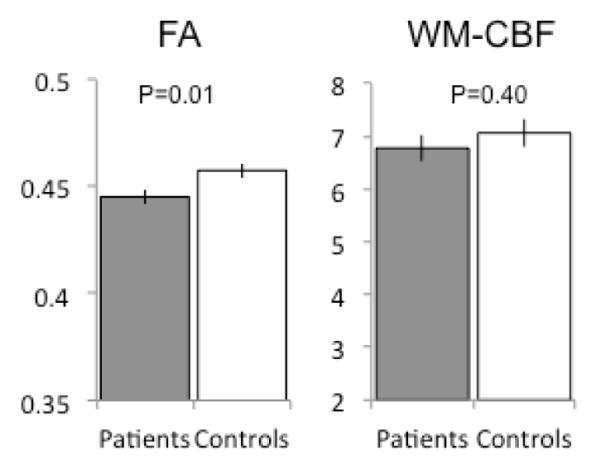
Comparisons of whole brain white matter fractional anisotropy (FA) versus white matter cerebral blood flow (WM-CBF) or perfusion in schizophrenia compared with controls; error bars are standard error.
Figure 2.
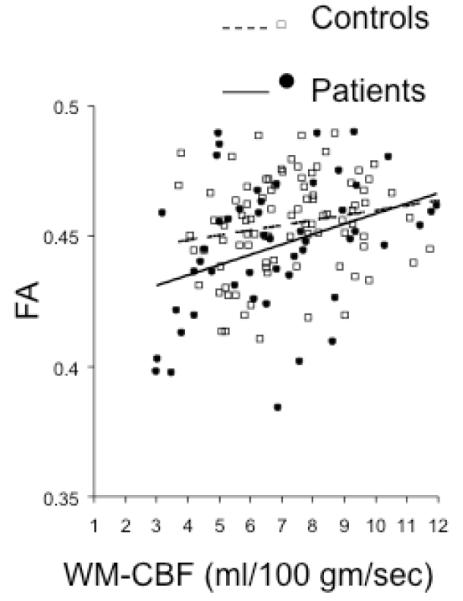
Correlation of whole brain white matter FA values versus whole-brain white matter perfusion values in schizophrenia and controls.
Age and diagnosis effects for the average WM FA and perfusion
Linear and quadratic models (eq. 1 and 2) were highly significant for the WM FA values (p=2.63 ×10⁻⁹ and 6.7 ×10⁻¹⁰, respectively) (Table 2). The linear and quadratic effects of age-by-diagnosis interactions were both highly significant (p=0.001 and 0.0008, respectively) and rendered diagnostic status to be a non-significant covariate (Table 2 and Figure 3). The magnitude of the diagnosis-by-age coefficients indicated that the rate of age-related decline in patients was about twice the aging rate in the controls.
Table 2.
Linear (model 1) and quadratic (model 2) modeling of the effect of age, diagnosis, and age × diagnosis interaction on whole-brain white matter FA and perfusion, based on Eq1 and Eq2, respectively. Statistically significant (p<0.05) age effects or age × diagnosis effects are in bold font. The primary measure for hypothesis testing is the age-by-diagnosis effect in the linear and quadratic models.
| Model 1 | Intercept | βage± sd (p) |
βdx± sd (p) |
βage* dx± sd (p) |
r2/F3,116 (p) |
|---|---|---|---|---|---|
| White matter FA | 0.47±0.001 | −2.8±1.3 ×10⁻⁴ (0.04) |
−0.02±0.01 (0.10) |
−8.8±2.1×10⁻⁵ (0.001) |
0.29/17.3 (2.63 ×10⁻⁹) |
| White matter CBF | 9.21±0.59 | −0.05±0.01 (0.001) |
−0.31±0.99 (0.76) |
−0.01±0.02 (0.46) |
0.17/8.0 (7.07 ×10⁻⁵) |
| Model 2 | Intercept | βage2± sd (p) |
βdx± sd (p) |
βage2* dx± sd (p) |
r2/F3,116 (p) |
| White matter FA | 0.047±0.003 | −4.1 ±1.9 ×10⁻⁶ (0.03) |
−2.5 ±5.9 ×10⁻³ (0.71) |
−1.1 ±0.3 ×10⁻⁵ (0.0008) |
0.30/18.5 (6.7 ×10⁻¹⁰) |
| White matter CBF | 8.14±0.37 | −6.3±2.1×10⁻⁴ (0.003) |
−0.03±0.62 (0.96) |
−2.7±3.4 × 10⁻⁴ (0.41) |
0.15/6.9 (2.4 ×10⁻⁴) |
Figure 3.

Age effect on whole brain white matter FA and perfusion values in schizophrenia compared with controls. The top plots are based on the quadratic models. The bottom plots chart the z-normalized residual values so that the regression line across age (x-axis) is horizontal for the controls, for easy visual comparison. Note the age of intersection (bottom left) for FA values at around 23 years of age.
Linear and quadratic models (eq. 1 and 2) were significant for whole brain WM perfusion (p=7.07 ×10⁻⁵ and 2.4 ×10⁻⁴, respectively). A significant age effect was present. However, the diagnosis-by-age interactions were not significant (Table 2 and Figure 3). An exploration of the whole-brain (GM+WM) and GM perfusion also showed significant aging but no significant diagnosis or age-by-diagnosis effects (all p>0.4).
Testing of models 3 and 4 (eq. 3 and 4) that included WM perfusion as a predictor also supported that WM perfusion did not account for accelerated age-related decline of the average FA in schizophrenia, because age × diagnosis and age2 × diagnosis interactions remained significant (p=0.002 and 0.001, respectively) (Table 3).
Table 3.
After accounting for white matter perfusion, linear (model 3) and quadratic (model 4) modeling of the whole brain white matter FA values using general linear model (Eq 3 and 4) still showed significant age × diagnosis effects (in bold font), further suggesting no contribution of white matter perfusion to the accelerated FA decline in schizophrenia.
| Model 3 | Intercept | βCBF± sd (p) |
βage± sd (p) |
βdx± sd (p) |
βage* dx± sd (p) |
r2/F4,115 (p) |
|---|---|---|---|---|---|---|
| White matter FA | 0.47±0.01 | 4.6±8.42 ×10⁻⁴ (0.57) |
−2.9±1.6 ×10⁻⁴ (0.06) |
0.01±0.01 (0.14) |
−7.8±2.4×10⁻⁵ (0.002) |
0.32/13.6 (4.5×10⁻⁹) |
| Model 4 | Intercept | βCBF± sd (p) |
βage2± sd (p) |
βdx± sd (p) |
βage2* dx± sd (p) |
r2/F4,31 (p) |
| White matter FA | 0.46±0.03 | 4.9±8.7 ×10⁻⁴ (0.56) |
−4.2 ±1.9 ×10⁻⁶ (0.03) |
1.3 ±5.9 ×10⁻³ (0.81) |
−9.9±3.1 ×10⁻⁶ (0.001) |
0.34/14.6 (1.66 ×10⁻⁹) |
Age and diagnosis effects for regional WM FA and perfusion
We also explored tract-specific FA effects using the same linear and quadratic models (eq. 1 and 2). Significant effects were determined by correcting for multiple (N=12 tracts) comparisons. All models were highly significant for regional FA measurements (all p<0.0042). Age-by-diagnosis interactions were significant (p<0.0042) for FA in three WM tracts, the body of corpus callosum (p= 9.97×10⁻⁵), cingulum (p=2.95×10⁻⁴), corona radiata (p=0.001); in these tracts there were also significant age2-by-diagnosis interactions (all three p<0.0042). In comparison, no significant age-by-diagnosis tract-specific perfusion effect was found using linear or quadratic models (all p>0.01). Testing of models 3 and 4 (eq. 3 and 4) demonstrated that even when perfusion from the same region was included, the FA diagnosis-by-age and diagnosis-by-age2 interactions in the body of corpus callosum, cingulum, and corona radiata remained significant (all p<0.0042).
Discussion
With an independent sample, an improved DTI sequence and a different scanner, this study replicated the finding of an accelerated age-related decline in the WM integrity in participants with schizophrenia. Age-related declines in WM perfusion were similarly present in both groups, with no evidence of accelerated rate of decline in one group. Further evaluation of the data showed that a significantly faster decline in DTI-FA in participants with schizophrenia remained even after regressing out the effect of perfusion. Exploration of tract-specific differences also replicated previously reported patterns of schizophrenia-related accelerated aging in FA values. Age × diagnosis interactions were significant for three WM tracts. Perfusion of specific tracts, while showing pronounced decline with age, was similar in both groups and did not contribute to accelerated FA decline in schizophrenia. Overall, we have to reject the hypothesis that accelerated aging-related decline in FA values in patients is secondary to accelerated age-related decline in the resting state WM perfusion.
In agreement with prior studies (Friedman et al 2008; Kochunov et al 2012b; Mori et al 2007), participants with schizophrenia begin to show lower FA in the third decade of life due to higher slopes of aging-related decline in FA. In the current study, this replication was performed in an independent sample using a more advanced HARDI protocol. The age × diagnosis interaction in this study was more robust (p≤0.001) compared with that in the initial report (p=0.04) (Kochunov et al 2012b), possibly due to improved signal-to-noise ratio of the imaging techniques yielding a more precise detection of the aging trends. The age at which participants with schizophrenia began to show evidence for accelerated decline (24.4±10.9 years of age) was earlier but not significantly different (p=0.3) from what was reported in our prior study group (32.4±11.9) and that reported by Mori and colleagues (27 years of age) (Mori et al 2007). In addition, all three studies reported a similar rate (twice) of accelerated age-related decline (ratio of the βage coefficients) in schizophrenia participants compared with controls.
Several previous studies used PET, SPECT and ASL imaging and showed CBF hypoperfusion (most studies focused on GM) in schizophrenia (Andreasen et al 1996; Erkwoh et al 1999a; Erkwoh et al 1999b; Scheef et al 2010; Vita et al 1995) although findings of no change or increased perfusion were also reported (Gonul et al 2003). Our results are similar to these reported by a recent study by Pinkham and colleagues who reported on voxel-wise difference in CBF in a small (30/24, patients/controls) group of participants (Pinkham et al 2011). Pinkham and colleagues observed only small regional differences in subcortical perfusion between patients and controls, including evidence for reduced CBF in the parietal lobe and elevated CBF in the caudate regions. Likewise, we observed that the average resting WM perfusion was slightly lower in patients, but that this difference was not significant. We observed a significant decline in WM perfusion with age, which is in agreement with prior findings (Chen et al 2011; Gupta et al 2012; Hartkamp et al 2013; Liu et al 2012; Stoquart-ElSankari et al 2007; Wagner et al 2012). The age-related decline in perfusion had been attributed to multifactorial age-related vascular degeneration etiologies including endothelial dysfunction, calcium deposition, oxidative stress, and pulsation-induced trauma (Gupta et al 2012; Kochunov et al 2010; Kochunov et al 2011; Kochunov et al 2012a). We found that only WM perfusion (Figure 2), not GM perfusion or whole brain perfusion, was significantly associated with WM integrity, an effect that was observed in two independent (patients and controls) samples. Therefore, WM perfusion was significantly related to WM FA. However, we detected no evidence for accelerated age-related decline in WM perfusion in schizophrenia participants compared to controls. Therefore, while WM perfusion was clearly affected by aging, this process affected both groups equally. In other words, WM perfusion appeared to age “normally” in schizophrenia while the aging of WM integrity, as measured by DTI-FA, was accelerated. We believe that this evidence suggests that resting state cerebrovascular perfusion of the WM is unlikely to be the primary culprit of the increased rate of age-related decline in WM FA.
The biological basis of the accelerated decline in FA values in schizophrenia therefore likely reflects neuropathology other than that of vascular nature. Potential causes of accelerated decline in FA values may include loss of axonal myelination and/or loss of glial cell density that are caused by etiology other than hypoperfusion (Abe et al 2002; Gao et al 2009; Roussos et al 2012). Post-mortem studies in schizophrenia lend support by demonstrating a reduced expression of key oligodendrocyte/myelination genes (Davis et al 2003; Mitkus et al 2008) and reductions in the density of oligodendrocytes, specifically in the associative fiber tracts that connect prefrontal cortices (Hof et al 2003; Uranova et al 2004). Specifically, the accelerated aging of the WM in this disorder could be the product of gene × diagnosis × age interaction. For instance, mutation a candidate gene for schizophrenia TP53 (Lung et al 2009; Ni et al 2005), is also central to reduced ability of DNA repair, oligodendrocyte senescence and apoptosis (Molina et al 2011).
This report is our second attempt to evaluate evidence for accelerated brain aging in schizophrenia, and also to initiate mechanistic inquiry into the possible etiology. Using cross-sectional studies to infer longitudinal changes have significant limitations (Kraemer et al 2000). Although a replicated finding supports the validity of our observation, confirmation of the finding requires a longitudinal study design (Thompson et al 2011). We cannot fully rule out effects from chronic antipsychotic exposure in schizophrenia. However, the correlation between whole brain FA and current antipsychotic medication daily dose, as calculated by daily chlorpromazine equivalent (CPZ: mean±s.d.= 629 ± 653 mg/day), was not significant (r=0.02; p=0.9). The correlation between WM perfusion and CPZ was also not significant (r=-0.02; p=0.9). However, CPZ is likely an overly simplified approach to assess antipsychotic medication exposure. A lack of relationship with CPZ should not be viewed as proof of the lack of impact of antipsychotic medication exposure on these imaging measures. Smoking is also a potential confound in neuroimaging studies. To estimate potential influence from smoking, we re-analyzed the data in non-smoker schizophrenia patients vs. non-smoker controls, and found that patients still had twice the rate of age-related decline of controls in FA (βage*dx: t = −2.61, p=0.011) but not in perfusion (βage*dx: t = −0.42, p=0.67). Another potential limitation in interpreting the finding is the exclusion of medical conditions such as hypertension, heart disorders, and diabetes. They were excluded in order to examine the relationship between white matter FA and white matter perfusion without the overt influence from these diseases. However, these co-morbid conditions are known to be more common in patients with schizophrenia and may contribute to small vessel disease and changes in blood perfusion. Therefore, the exclusion of participants with these conditions may limit the generalizability of our findings.
Our understanding of the role of WM in the pathophysiology of schizophrenia is rapidly evolving, supported by imaging techniques including DTI but also increasingly new techniques that probe the underlying pathology (Cronenwett and Csernansky 2013; Du et al 2013; Kochunov et al 2013). Replicating our previous finding of WM FA accelerated aging in schizophrenia with an independent participant sample, using a different scanner and a higher resolution DTI protocol, lends strong support to the importance of this observation. Ruling out the direct perfusion effect is critical in our first attempt to investigate its etiology and provides motivations to seek alternative explanations to account for the accelerated WM integrity decline in schizophrenia.
Acknowledgements
This research was supported by National Institute of Health grants R01EB015611, R01DA027680, R01MH085646, and T32MH067533
Footnotes
Publisher's Disclaimer: This is a PDF file of an unedited manuscript that has been accepted for publication. As a service to our customers we are providing this early version of the manuscript. The manuscript will undergo copyediting, typesetting, and review of the resulting proof before it is published in its final citable form. Please note that during the production process errors may be discovered which could affect the content, and all legal disclaimers that apply to the journal pertain.
References
- Abe O, Aoki S, Hayashi N, Yamada H, Kunimatsu A, Mori H, Yoshikawa T, Okubo T, Ohtomo K. Normal aging in the central nervous system: quantitative MR diffusion-tensor analysis. Neurobiol Aging. 2002;23:433–41. doi: 10.1016/s0197-4580(01)00318-9. [DOI] [PubMed] [Google Scholar]
- Andreasen NC, O’Leary DS, Cizadlo T, Arndt S, Rezai K, Ponto LL, Watkins GL, Hichwa RD. Schizophrenia and cognitive dysmetria: a positron-emission tomography study of dysfunctional prefrontal-thalamic-cerebellar circuitry. Proc Natl Acad Sci U S A. 1996;93:9985–90. doi: 10.1073/pnas.93.18.9985. [DOI] [PMC free article] [PubMed] [Google Scholar]
- Bartzokis G, Sultzer D, Lu PH, Nuechterlein KH, Mintz J, Cummings JL. Heterogeneous age-related breakdown of white matter structural integrity: implications for cortical “disconnection” in aging and Alzheimer’s disease. Neurobiol Aging. 2004;25:843–51. doi: 10.1016/j.neurobiolaging.2003.09.005. [DOI] [PubMed] [Google Scholar]
- Biagi L, Abbruzzese A, Bianchi MC, Alsop DC, Del Guerra A, Tosetti M. Age dependence of cerebral perfusion assessed by magnetic resonance continuous arterial spin labeling. J Magn Reson Imaging. 2007;25:696–702. doi: 10.1002/jmri.20839. [DOI] [PubMed] [Google Scholar]
- Brown S. Excess mortality of schizophrenia. A meta-analysis. Br J Psychiatry. 1997;171:502–8. doi: 10.1192/bjp.171.6.502. [DOI] [PubMed] [Google Scholar]
- Brown WR, Thore CR. Review: cerebral microvascular pathology in ageing and neurodegeneration. Neuropathol Appl Neurobiol. 2011;37:56–74. doi: 10.1111/j.1365-2990.2010.01139.x. [DOI] [PMC free article] [PubMed] [Google Scholar]
- Chen JJ, Rosas HD, Salat DH. Age-associated reductions in cerebral blood flow are independent from regional atrophy. NeuroImage. 2011;55:468–78. doi: 10.1016/j.neuroimage.2010.12.032. [DOI] [PMC free article] [PubMed] [Google Scholar]
- Chiapponi C, Piras F, Fagioli S, Caltagirone C, Spalletta G. Cortical grey matter and subcortical white matter brain microstructural changes in schizophrenia are localised and age independent: a case-control diffusion tensor imaging study. PLoS One. 2013;8:e75115. doi: 10.1371/journal.pone.0075115. [DOI] [PMC free article] [PubMed] [Google Scholar]
- Cronenwett WJ, Csernansky JG. Diving deep into white matter to improve our understanding of the pathophysiology of schizophrenia. Biol Psychiatry. 2013;74:396–7. doi: 10.1016/j.biopsych.2013.07.007. [DOI] [PubMed] [Google Scholar]
- Davis KL, Stewart DG, Friedman JI, Buchsbaum M, Harvey PD, Hof PR, Buxbaum J, Haroutunian V. White matter changes in schizophrenia: evidence for myelin-related dysfunction. Arch Gen Psychiatry. 2003;60:443–56. doi: 10.1001/archpsyc.60.5.443. [DOI] [PubMed] [Google Scholar]
- Du F, Cooper AJ, Thida T, Shinn AK, Cohen BM, Ongur D. Myelin and axon abnormalities in schizophrenia measured with magnetic resonance imaging techniques. Biol Psychiatry. 2013;74:451–7. doi: 10.1016/j.biopsych.2013.03.003. [DOI] [PMC free article] [PubMed] [Google Scholar]
- Erkwoh R, Sabri O, Willmes K, Steinmeyer EM, Bull U, Sass H. [Aspects of cerebral connnectivity in schizophrenia. A comparative CBF study on treated schizophrenics before and after medication] Fortschr Neurol Psychiatr. 1999a;67:318–26. doi: 10.1055/s-2007-994982. [DOI] [PubMed] [Google Scholar]
- Erkwoh R, Sabri O, Willmes K, Steinmeyer EM, Bull U, Sass H. Active and remitted schizophrenia: psychopathological and regional cerebral blood flow findings. Psychiatry research. 1999b;90:17–30. doi: 10.1016/s0925-4927(99)00005-0. [DOI] [PubMed] [Google Scholar]
- Friedman JI, Tang C, Carpenter D, Buchsbaum M, Schmeidler J, Flanagan L, Golembo S, Kanellopoulou I, Ng J, Hof PR, Harvey PD, Tsopelas ND, Stewart D, Davis KL. Diffusion tensor imaging findings in first-episode and chronic schizophrenia patients. Am J Psychiatry. 2008;165:1024–32. doi: 10.1176/appi.ajp.2008.07101640. [DOI] [PubMed] [Google Scholar]
- Gao W, Lin W, Chen Y, Gerig G, Smith JK, Jewells V, Gilmore JH. Temporal and spatial development of axonal maturation and myelination of white matter in the developing brain. AJNR Am J Neuroradiol. 2009;30:290–6. doi: 10.3174/ajnr.A1363. [DOI] [PMC free article] [PubMed] [Google Scholar]
- Glahn DC, Curran JE, Winkler AM, Carless MA, Kent JW, Jr., Charlesworth JC, Johnson MP, Goring HH, Cole SA, Dyer TD, Moses EK, Olvera RL, Kochunov P, Duggirala R, Fox PT, Almasy L, Blangero J. High Dimensional Endophenotype Ranking in the Search for Major Depression Risk Genes. Biol Psychiatry. 2011;71:6–14. doi: 10.1016/j.biopsych.2011.08.022. [DOI] [PMC free article] [PubMed] [Google Scholar]
- Gonul AS, Kula M, Esel E, Tutus A, Sofuoglu S. A Tc-99m HMPAO SPECT study of regional cerebral blood flow in drug-free schizophrenic patients with deficit and non-deficit syndrome. Psychiatry research. 2003;123:199–205. doi: 10.1016/s0925-4927(03)00067-2. [DOI] [PubMed] [Google Scholar]
- Gupta A, Nair S, Schweitzer AD, Kishore S, Johnson CE, Comunale JP, Tsiouris AJ, Sanelli PC. Neuroimaging of cerebrovascular disease in the aging brain. Aging Dis. 2012;3:414–25. [PMC free article] [PubMed] [Google Scholar]
- Hartkamp NS, Petersen ET, De Vis JB, Bokkers RP, Hendrikse J. Mapping of cerebral perfusion territories using territorial arterial spin labeling: techniques and clinical application. NMR Biomed. 2013;26:901–12. doi: 10.1002/nbm.2836. [DOI] [PubMed] [Google Scholar]
- He W, Sengupta M, Velkoff V, DeBarros K. Current population reports. Special studies. 65+ in the United States: 2005. US Census Report. 2006 http://www.census.gov/prod/2006pubs/p23-209.pdf.
- Hennekens CH, Hennekens AR, Hollar D, Casey DE. Schizophrenia and increased risks of cardiovascular disease. Am Heart J. 2005;150:1115–21. doi: 10.1016/j.ahj.2005.02.007. [DOI] [PubMed] [Google Scholar]
- Hof PR, Haroutunian V, Friedrich VL, Jr., Byne W, Buitron C, Perl DP, Davis KL. Loss and altered spatial distribution of oligodendrocytes in the superior frontal gyrus in schizophrenia. 2003;53:1075–85. doi: 10.1016/s0006-3223(03)00237-3. [DOI] [PubMed] [Google Scholar]
- Jahanshad N, Kochunov P, Sprooten E, Mandl RC, Nichols TE, Almassy L, Blangero J, Brouwer RM, Curran JE, de Zubicaray GI, Duggirala R, Fox PT, Hong LE, Landman BA, Martin NG, McMahon KL, Medland SE, Mitchell BD, Olvera RL, Peterson CP, Starr JM, Sussmann JE, Toga AW, Wardlaw JM, Wright MJ, Hulshoff Pol HE, Bastin ME, McIntosh AM, Deary IJ, Thompson PM, Glahn DC. Multi-site genetic analysis of diffusion images and voxelwise heritability analysis: A pilot project of the ENIGMA-DTI working group. Neuroimage. 2013 doi: 10.1016/j.neuroimage.2013.04.061. doi:pii: S1053-8119(13)00408-4.10.1016/j.neuroimage.2013.04.061. [DOI] [PMC free article] [PubMed] [Google Scholar]
- Kennedy KM, Raz N. Pattern of normal age-related regional differences in white matter microstructure is modified by vascular risk. Brain Res. 2009;1297:41–56. doi: 10.1016/j.brainres.2009.08.058. [DOI] [PMC free article] [PubMed] [Google Scholar]
- Kirkpatrick B, Messias E, Harvey PD, Fernandez-Egea E, Bowie CR. Is schizophrenia a syndrome of accelerated aging? Schizophr Bull. 2008;34:1024–32. doi: 10.1093/schbul/sbm140. [DOI] [PMC free article] [PubMed] [Google Scholar]
- Kochunov P, Lancaster JL, Thompson P, Woods R, Mazziotta J, Hardies J, Fox P. Regional spatial normalization: toward an optimal target. J Comput Assist Tomogr. 2001;25:805–16. doi: 10.1097/00004728-200109000-00023. [DOI] [PubMed] [Google Scholar]
- Kochunov P, Glahn D, Lancaster J, Winkler A, Kent J, Olvera R, Cole S, Dyer T, Almasy L, Duggirala R, Fox P, Blangero J. Whole Brain and Regional Hyperintense White Matter Volume and Blood Pressure: Overlap of Genetic Loci produced by Bivariate, Whole-Genome Linkage Analyses. Stroke. 2010;41:2137–42. doi: 10.1161/STROKEAHA.110.590943. [DOI] [PMC free article] [PubMed] [Google Scholar]
- Kochunov P, Glahn DC, Lancaster J, Winkler A, Karlsgodt K, Olvera RL, Curran JE, Carless MA, Dyer TD, Almasy L, Duggirala R, Fox PT, Blangero J. Blood pressure and cerebral white matter share common genetic factors in Mexican Americans. Hypertension. 2011;57:330–5. doi: 10.1161/HYPERTENSIONAHA.110.162206. [DOI] [PMC free article] [PubMed] [Google Scholar]
- Kochunov P, Glahn DC, Hong LE, Lancaster J, Curran JE, Johnson MP, Winkler AM, Holcomb HH, Kent JW, Jr., Mitchell B, Kochunov V, Olvera RL, Cole SA, Dyer TD, Moses EK, Goring H, Almasy L, Duggirala R, Blangero J. P-selectin Expression Tracks Cerebral Atrophy in Mexican-Americans. Front Genet. 2012a;3:65. doi: 10.3389/fgene.2012.00065. [DOI] [PMC free article] [PubMed] [Google Scholar]
- Kochunov P, Glahn DC, L.M. R, Olvera R, Wincker P, Yang D, Sampath H, Carpenter W, Duggirala R, Curran J, Blangero J, Hong LE. Testing the hypothesis of accelerated cerebral white matter aging in schizophrenia and major depression. Biol Psychiatry. 2012b doi: 10.1016/j.biopsych.2012.10.002. DOI:10.1016/j.biopsych.2012.10.002. [DOI] [PMC free article] [PubMed] [Google Scholar]
- Kochunov P, Williamson DE, Lancaster J, Fox P, Cornell J, Blangero J, Glahn DC. Fractional anisotropy of water diffusion in cerebral white matter across the lifespan. Neurobiol Aging. 2012c;33:9–20. doi: 10.1016/j.neurobiolaging.2010.01.014. [DOI] [PMC free article] [PubMed] [Google Scholar]
- Kochunov P, Chiappelli J, Hong LE. Permeability-diffusivity modeling vs. fractional anisotropy on white matter integrity assessment and application in schizophrenia. NeuroImage: Clinical. 2013;3:18–26. doi: 10.1016/j.nicl.2013.06.019. [DOI] [PMC free article] [PubMed] [Google Scholar]
- Kraemer HC, Yesavage JA, Taylor JL, Kupfer D. How can we learn about developmental processes from cross-sectional studies, or can we? Am J Psychiatry. 2000;157:163–71. doi: 10.1176/appi.ajp.157.2.163. [DOI] [PubMed] [Google Scholar]
- Liu Y, Zhu X, Feinberg D, Guenther M, Gregori J, Weiner MW, Schuff N. Arterial spin labeling MRI study of age and gender effects on brain perfusion hemodynamics. Magnetic resonance in medicine : official journal of the Society of Magnetic Resonance in Medicine / Society of Magnetic Resonance in Medicine. 2012;68:912–22. doi: 10.1002/mrm.23286. [DOI] [PubMed] [Google Scholar]
- Lung FW, Shu BC, Kao WT, Chen CN, Ku YC, Tzeng DS. Association of DRD4 uVNTR and TP53 codon 72 polymorphisms with schizophrenia: a case-control study. BMC Med Genet. 2009;10:147. doi: 10.1186/1471-2350-10-147. [DOI] [PMC free article] [PubMed] [Google Scholar]
- Maclullich AM, Ferguson KJ, Reid LM, Deary IJ, Starr JM, Seckl JR, Bastin ME, Wardlaw JM. Higher systolic blood pressure is associated with increased water diffusivity in normal-appearing white matter. Stroke. 2009;40:3869–71. doi: 10.1161/STROKEAHA.109.547877. [DOI] [PubMed] [Google Scholar]
- Minkner K, Lovblad KO, Yilmaz H, Alimenti A, Sekoranja L, Delavelle J, Sztajzel R, Rufenacht DA. White matter lesions in watershed territories studied with MRI and parenchymography: a comparative study. Neuroradiology. 2005;47:425–30. doi: 10.1007/s00234-005-1358-8. [DOI] [PubMed] [Google Scholar]
- Mitkus SN, Hyde TM, Vakkalanka R, Kolachana B, Weinberger DR, Kleinman JE, Lipska BK. Expression of oligodendrocyte-associated genes in dorsolateral prefrontal cortex of patients with schizophrenia. Schizophr Res. 2008;98:129–38. doi: 10.1016/j.schres.2007.09.032. [DOI] [PMC free article] [PubMed] [Google Scholar]
- Molina V, Papiol S, Sanz J, Rosa A, Arias B, Fatjo-Vilas M, Calama J, Hernandez AI, Becker J, Fananas L. Convergent evidence of the contribution of TP53 genetic variation (Pro72Arg) to metabolic activity and white matter volume in the frontal lobe in schizophrenia patients. Neuroimage. 2011;56:45–51. doi: 10.1016/j.neuroimage.2011.01.076. [DOI] [PubMed] [Google Scholar]
- Mori T, Ohnishi T, Hashimoto R, Nemoto K, Moriguchi Y, Noguchi H, Nakabayashi T, Hori H, Harada S, Saitoh O, Matsuda H, Kunugi H. Progressive changes of white matter integrity in schizophrenia revealed by diffusion tensor imaging. Psychiatry Res. 2007;154:133–45. doi: 10.1016/j.pscychresns.2006.09.004. [DOI] [PubMed] [Google Scholar]
- Mutsaerts HJMM, Richard E, Heijtel DFR, van Osch MJP, Majoie CBLM, Nederveen AJ. Gray matter contamination in arterial spin labeling white matter perfusion measurements in patients with dementia. NeuroImage: Clinical. 2013;4:139–44. doi: 10.1016/j.nicl.2013.11.003. [DOI] [PMC free article] [PubMed] [Google Scholar]
- Ni X, Trakalo J, Valente J, Azevedo MH, Pato MT, Pato CN, Kennedy JL. Human p53 tumor suppressor gene (TP53) and schizophrenia: case-control and family studies. Neurosci Lett. 2005;388:173–8. doi: 10.1016/j.neulet.2005.06.050. [DOI] [PubMed] [Google Scholar]
- Nitkunan A, Charlton RA, McIntyre DJ, Barrick TR, Howe FA, Markus HS. Diffusion tensor imaging and MR spectroscopy in hypertension and presumed cerebral small vessel disease. Magn Reson Med. 2008;59:528–34. doi: 10.1002/mrm.21461. [DOI] [PubMed] [Google Scholar]
- Pinkham A, Loughead J, Ruparel K, Wu WC, Overton E, Gur R. Resting quantitative cerebral blood flow in schizophrenia measured by pulsed arterial spin labeling perfusion MRI. Psychiatry Res. 2011;194:64–72. doi: 10.1016/j.pscychresns.2011.06.013. [DOI] [PMC free article] [PubMed] [Google Scholar]
- R-Development-Core-Team R: A Language and Environment for Statistical Computing. 2009 http://www.R-project.org.
- Roussos P, Katsel P, Davis KL, Bitsios P, Giakoumaki SG, Jogia J, Rozsnyai K, Collier D, Frangou S, Siever LJ, Haroutunian V. Molecular and genetic evidence for abnormalities in the nodes of ranvier in schizophrenia. Arch Gen Psychiatry. 2012;69:7–15. doi: 10.1001/archgenpsychiatry.2011.110. [DOI] [PubMed] [Google Scholar]
- Saha S, Chant D, McGrath J. A systematic review of mortality in schizophrenia: is the differential mortality gap worsening over time? Arch Gen Psychiatry. 2007;64:1123–31. doi: 10.1001/archpsyc.64.10.1123. [DOI] [PubMed] [Google Scholar]
- Scheef L, Manka C, Daamen M, Kuhn KU, Maier W, Schild HH, Jessen F. Resting-state perfusion in nonmedicated schizophrenic patients: a continuous arterial spin-labeling 3.0-T MR study. Radiology. 2010;256:253–60. doi: 10.1148/radiol.10091224. [DOI] [PubMed] [Google Scholar]
- Smith SM, Jenkinson M, Woolrich MW, Beckmann CF, Behrens TE, Johansen-Berg H, Bannister PR, De Luca M, Drobnjak I, Flitney DE, Niazy RK, Saunders J, Vickers J, Zhang Y, De Stefano N, Brady JM, Matthews PM. Advances in functional and structural MR image analysis and implementation as FSL. Neuroimage. 2004;23(Suppl 1):S208–19. doi: 10.1016/j.neuroimage.2004.07.051. [DOI] [PubMed] [Google Scholar]
- Smith SM, Jenkinson M, Johansen-Berg H, Rueckert D, Nichols TE, Mackay CE, Watkins KE, Ciccarelli O, Cader MZ, Matthews PM, Behrens TE. Tract-based spatial statistics: Voxelwise analysis of multi-subject diffusion data. Neuroimage. 2006;31:1487–505. doi: 10.1016/j.neuroimage.2006.02.024. [DOI] [PubMed] [Google Scholar]
- Stoquart-ElSankari S, Baledent O, Gondry-Jouet C, Makki M, Godefroy O, Meyer ME. Aging effects on cerebral blood and cerebrospinal fluid flows. Journal of cerebral blood flow and metabolism : official journal of the International Society of Cerebral Blood Flow and Metabolism. 2007;27:1563–72. doi: 10.1038/sj.jcbfm.9600462. [DOI] [PubMed] [Google Scholar]
- Thompson WK, Hallmayer J, O’Hara R. Design considerations for characterizing psychiatric trajectories across the lifespan: application to effects of APOE-epsilon4 on cerebral cortical thickness in Alzheimer’s disease. Am J Psychiatry. 2011;168:894–903. doi: 10.1176/appi.ajp.2011.10111690. [DOI] [PMC free article] [PubMed] [Google Scholar]
- Tsuang MT, Woolson RF. Excess mortality in schizophrenia and affective disorders. Do suicides and accidental deaths solely account for this excess? Arch Gen Psychiatry. 1978;35:1181–5. doi: 10.1001/archpsyc.1978.01770340031002. [DOI] [PubMed] [Google Scholar]
- Uranova NA, Vostrikov VM, Orlovskaya DD, Rachmanova VI. Oligodendroglial density in the prefrontal cortex in schizophrenia and mood disorders: a study from the Stanley Neuropathology Consortium. Schizophr Res. 2004;67:269–75. doi: 10.1016/S0920-9964(03)00181-6. [DOI] [PubMed] [Google Scholar]
- van Gelderen P, de Zwart JA, Duyn JH. Pittfalls of MRI measurement of white matter perfusion based on arterial spin labeling. Magn Reson Med. 2008;59:788–95. doi: 10.1002/mrm.21515. [DOI] [PubMed] [Google Scholar]
- Vita A, Bressi S, Perani D, Invernizzi G, Giobbio GM, Dieci M, Garbarini M, Del Sole A, Fazio F. High-resolution SPECT study of regional cerebral blood flow in drug-free and drug-naive schizophrenic patients. The American journal of psychiatry. 1995;152:876–82. doi: 10.1176/ajp.152.6.876. [DOI] [PubMed] [Google Scholar]
- Wagner M, Jurcoane A, Volz S, Magerkurth J, Zanella FE, Neumann-Haefelin T, Deichmann R, Singer OC, Hattingen E. Age-related changes of cerebral autoregulation: new insights with quantitative T2′-mapping and pulsed arterial spin-labeling MR imaging. AJNR American journal of neuroradiology. 2012;33:2081–7. doi: 10.3174/ajnr.A3138. [DOI] [PMC free article] [PubMed] [Google Scholar]
- Wakana S, Jiang H, Nagae-Poetscher LM, van Zijl PC, Mori S. Fiber tract-based atlas of human white matter anatomy. Radiology. 2004;230:77–87. doi: 10.1148/radiol.2301021640. [DOI] [PubMed] [Google Scholar]
- Wang J, Alsop DC, Li L, Listerud J, Gonzalez-At JB, Schnall MD, Detre JA. Comparison of quantitative perfusion imaging using arterial spin labeling at 1.5 and 4.0 Tesla. Magnetic resonance in medicine : official journal of the Society of Magnetic Resonance in Medicine / Society of Magnetic Resonance in Medicine. 2002;48:242–54. doi: 10.1002/mrm.10211. [DOI] [PubMed] [Google Scholar]
- Wang J, Zhang Y, Wolf RL, Roc AC, Alsop DC, Detre JA. Amplitude-modulated continuous arterial spin-labeling 3.0-T perfusion MR imaging with a single coil: feasibility study. Radiology. 2005;235:218–28. doi: 10.1148/radiol.2351031663. [DOI] [PubMed] [Google Scholar]
- Wang J, Licht DJ. Pediatric perfusion MR imaging using arterial spin labeling. Neuroimaging Clin N Am. 2006;16:149–67. ix. doi: 10.1016/j.nic.2005.10.002. [DOI] [PubMed] [Google Scholar]
- Wardlaw JM, Smith C, Dichgans M. Mechanisms of sporadic cerebral small vessel disease: insights from neuroimaging. Lancet Neurol. 2013;12:483–97. doi: 10.1016/S1474-4422(13)70060-7. [DOI] [PMC free article] [PubMed] [Google Scholar]
- Wey HY, Wang DJ, Duong TQ. Baseline CBF, and BOLD, CBF, and CMRO2 fMRI of visual and vibrotactile stimulations in baboons. J Cereb Blood Flow Metab. 2012;31:715–24. doi: 10.1038/jcbfm.2010.154. [DOI] [PMC free article] [PubMed] [Google Scholar]