

Abstract
Purpose
Magnetic resonance imaging (MRI) is an important tool for characterizing invasive breast cancer but has proven to be more challenging in the setting of ductal carcinoma in situ (DCIS). We investigated whether MRI features of DCIS reflect differences in biology and pathology.
Patients and Methods
Forty five of 100 patients with biopsy-proven DCIS who underwent MRI and had sufficient tissue to be characterized by pathologic (nuclear grade, presence of comedo necrosis, size, and density of disease) and immunohistochemical (IHC) findings (proliferation, Ki67; angiogenesis, CD34; and inflammation, CD68). Pathology and MRI features (enhancement patterns, distribution, size, and density) were analyzed using pairwise and canonical correlations.
Results
Histopathologic and IHC variables correlated with MRI features (r = 0.73). The correlation was largely due to size, density (by either MRI or pathology), and inflammation (P < .05). Most small focal masses were estrogen receptor-positive. MRI enhancement patterns that were clumped were more likely than heterogeneous patterns to be high-grade lesions. Homogenous lesions were large, high grade, and rich in macrophages. Presence of comedo necrosis and size could be distinguished on MRI (P < .05). MRI was most likely to over-represent the size of less dense, diffuse DCIS lesions.
Conclusion
The heterogeneous presentation of DCIS on MRI reflects underlying histopathologic differences.
INTRODUCTION
The optimal management of ductal carcinoma in situ (DCIS) is not well established.1 DCIS, a preinvasive condition that encompasses a spectrum of lesions, is characterized by the proliferation of malignant ductal epithelial cells that are confined within the basement membrane.2,3 Because of this, regardless of the heterogeneity of disease among individuals, DCIS is essentially curable with mastectomy.1 Some features of DCIS, such as tumor size, histologic grade, presence of comedo necrosis, ability to be resected with wide margins, and patient age, allow some degree of risk stratification for recurrence.4–8
Although natural history data for DCIS is poor, it is thought that approximately 60% of women with DCIS, on average, will progress to invasive cancer over an 8- to 10-year period.9 Women treated by surgery alone have highly variable rates of recurrence, ranging from 5% to 40%.10,11 It is exactly this variability and the uncertainty surrounding the risk and timing for progression that have led to a fairly aggressive treatment approach to DCIS, including mastectomy, to prevent invasive breast cancer.12–14
As our understanding of invasive breast cancer has progressed, we have learned that it is a heterogeneous disease, encompassing different phenotypic categories that arise from a range of biologic processes.15 DCIS, a preinvasive cancer, is a variable disease as well. A tool we have used to demonstrate differences in size and extent, especially in the context of neoadjuvant interventions, to measure response to therapy of invasive cancer, is magnetic resonance imaging (MRI).16 However, we have not systematically studied the use of MRI in DCIS.
Surgical and innovative treatment approaches would benefit tremendously from a tool that can reliably capture the size and extent of DCIS and reflect the underlying pathology.16,17 Mammography detects the presence of DCIS but detects the calcifications or residue left inside ducts from necrosis in the ducts, not the disease itself. Some patterns, such as linear ductal, are highly diagnostic of DCIS and usually reflect the size accurately. Accurate diagnosis and sizing is more challenging for other calcification patterns.
Determining DCIS size on pathology is also a challenge. Careful complete sectioning of inked specimens is required to obtain a complete estimate of lesion extent in the tissue, and it is difficult to accurately reconstruct the three-dimensional extent using two-dimensional pathology slides.
MRI offers a global picture of extent of disease in the breast and is useful in the local staging of invasive cancer.18–20 However, its use in DCIS has been impeded by the difficulty in distinguishing DCIS from benign and atypical proliferative processes (false positives).21
We have previously shown that MRI is useful for identifying the presence of invasive cancer in patients diagnosed with DCIS by core biopsy and that it is more accurate in determining the extent of disease than mammography.19,22 We have also observed that there is a spectrum of DCIS lesions that show considerable differences in MRI characteristics.23 Because DCIS grade, size, hormone receptor expression, and the presence of comedo necrosis are key drivers in predicting recurrence,7 we wondered whether pathologic features of DCIS could be correlated with features of DCIS on MRI. To answer this question, we analyzed the pathologic and imaging features of women with a known diagnosis of DCIS who underwent MRI. We hypothesized that inflammation, angiogenesis, proliferation, and density of disease would be the pathologic characteristics most likely differentiated on MRI.
PATIENTS AND METHODS
Patient Identification
The study protocol was reviewed and approved by the University of California, San Francisco institutional review board. Between 1994 and 2002, 100 patients diagnosed with DCIS agreed to undergo MRI before surgery. Of these, 45 patients had both electronically archived images for review (n = 66) as well as sufficient tissue on which to perform biomarker studies (n = 57); these patients composed our patient population.
MRI Protocol
MRI was performed on a 1.5 Tesla GE scanner (GE Healthcare, Waukesha, WI) using a three-dimensional, fat-suppressed, fast-gradient echo technique. The symptomatic breast was imaged in the sagittal orientation using an 18- to 20-cm field of view, 60 sections, 2-mm section thickness, repetition time of 8.2 msec, echo time of 4.2 msec, flip angle of 20 degrees, two signal averages, anterior/posterior frequency direction, and no phase-wrap option. Fat suppression was applied using a periodic, spectrally selective inversion recovery pulse, with a resulting total scan time of 5 minutes. Images were acquired once before and twice after contrast injection. Gadolinium-diethyltriaminepentaacetic acid was injected at a dose of 0.1 mmol/kg body weight at a rate of 1 mL/sec, beginning with the start of the second data acquisition time point. Contrast injection was followed by a 10-mL saline flush.
Assessment of Tumor Size and Percentage of Breast Involving DCIS
The percentage of breast tissue occupied by the DCIS was assessed visually by a single radiologist (J.L.). Maximum-intensity projection images were created in the lateral-medial and cranial-caudal directions from the first postcontrast image series and used to estimate extent of breast involved. The composite views were also used to determine tumor size. Using this view, the following three lesion measurements of the enhancing region were obtained: the maximum anterior-posterior, cranial-caudal, and transverse diameters. The largest lesion diameter among the three measurements was recorded as the breast MRI tumor size. Although individual (slice) images were also evaluated, for consistency, final measurements were made using the maximum-intensity projection images. The patterns were evaluated based on assessment of the entire cases, using all of the images on the digital archiving system. For this reason, patients whose studies were not on the digital archiving system were not included.
Breast MRI Characterization of Tumor
The American College of Radiology Breast Imaging Reporting and Data System (ACR-BIRADS) lexicon was used to describe tumor distribution (Fig 1) and enhancement patterns (Fig 2).24 Descriptions of mass lesions were not applicable.
Figure 1.
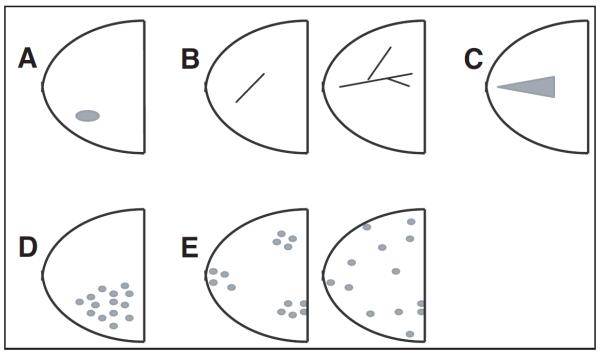
Geographic distribution of magnetic resonance imaging patterns: (A) focal = nonmass enhancement organized towards a center; (B) linear (left) ductal (right) = traces pattern of a duct or a branch; (C) segmental = triangular enhancement, apex points towards the nipple, suggesting ductal distribution; (D) regional = single quadrant enhancement not conforming to duct distribution; (E) multiregional (left, patchy; right, diffuse) = areas of enhancement in = two quadrants.
Figure 2.
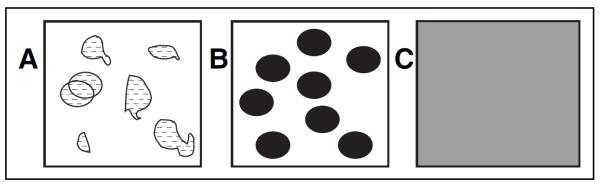
Patterns of gadolinium enhancement: (A) heterogeneous = nonspecific, nonuniform, between regions of nonenhancement; (B) clumped = cobblestone-like; (C) homogeneous = confluent uniform.
Breast MRI Tumor Density
An MRI lesion density score based on compactness of pixels was assigned based on visual assessment of the first postcontrast image series, with a score of 1 (low pixel density) indicating sparse, stippled enhancement; a score of 2 (medium pixel density) indicating clumped enhancement; and a score of 3 (high pixel density) indicating solid, mass-like enhancement (Fig 3).
Figure 3.
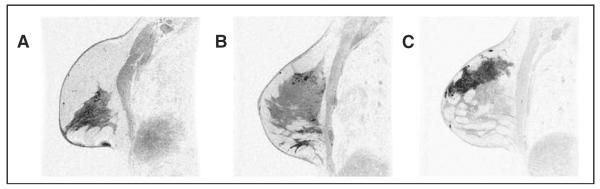
Magnetic resonance imaging (MRI) pixel density score (contrast-enhanced, three-dimensional, gradient-echo breast MRI, sagittal projection, with fat saturation). (A) Score 1 = subtle clumped enhancement in upper breast; (B) score 2 = more concentrated nodular, clumped enhancement in the upper breast; (C) score 3 = dense confluent homogeneous enhancement.
Pathologic Analysis
Two pathologists (Y.-Y.C. and A.A.) reviewed all cases. The following features of DCIS were evaluated: nuclear grade, architectural pattern, comedo necrosis, size, and density. Pathologic size of DCIS was based on the number of contiguous sections that contained disease or the largest diameter on a single given slide, whichever was larger.
Pathologic Density
We developed a method to capture the density, or compactness, of malignant ducts. A score of 1 to 3 was assigned based on how tightly packed the ducts appeared in a low-power field (Fig 4).
Figure 4.
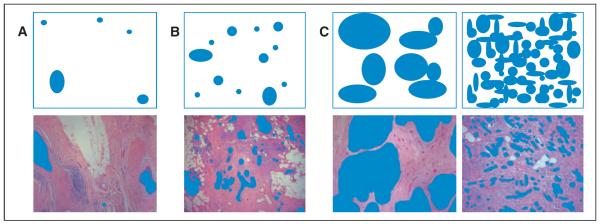
Pathology compactness score. Pathology specimens were scored by the space lesions occupied on ×40 field and the distance between individual lesions. (A) Score 1 = less than 25%, sparsely distributed, > 5 mm apart; (B) score 2 = 25% to 50%, 2 to 5 mm apart; (C) score 3 = more than 50%, densely packed, < 2 mm apart.
Lesions with DCIS foci that were ≥ 5 mm apart with intervening normal terminal duct lobular units and/or ducts were given a score of 1. Lesions with DCIS more than 2 and less than 5 mm apart or foci ≤ 2 mm apart or with continuous DCIS were given a score of 2 and 3, respectively.
Immunohistochemistry Biomarkers
Paraffin blocks of the most representative sections of DCIS were studied with estrogen receptor (ER), CD34, Ki67, and CD68 (DakoCytomation, Carpinteria, CA) using the Dako Autostainer according to the manufacturer's instructions (Dako). For Ki67 and CD68, immunohistochemical (IHC) labeling using the avidin-biotin-peroxidase complex technique and 3′,3′-diaminobenzidine as the chromagen was performed. For ER and CD34 double staining, the DAKO Envision Double Stain System (Dako) was used, with ER marked by 3′,3′-diaminobenzidine chromagen and CD34 highlighted with Vector Red (Vector Laboratories Inc, Burlingame, CA).
To evaluate angiogenesis using CD34, slides were screened at ×40 magnification to identify regions of the highest vascular density (hot spot). Vessels were counted in three fields of the highest density at ×200 (1.13 mm2 per field), and the mean was obtained. Distribution of staining was categorized as peritumoral, scattered, or other, and location was scored relative to tumor as adjacent, distant, or intermixed.
ER expression of the DCIS cells was evaluated using the combined proportion score (range, 0 to 5) and intensity score (range, 0 to 3), as described.25 Total score was the sum of the proportion score and intensity score. DCIS with a total score of 3 or more was reported as positive.25
CD68 stain was used to evaluate the tumor-associated macrophages. This was achieved by selecting the hot spot area at ×40 magnification (Fig 5A) and then counting the number of CD68+ cells at ×400 magnification from three different hot spot areas. The mean number of tumor-associated macrophages was calculated. Ki67 labeling index was determined by the percentage of at least 500 tumor cells showing nuclear staining (Fig 5B).
Figure 5.

Biomarkers of inflammation (CD68) and proliferation (Ki67) in ductal carcinoma in situ at ×40. (A) Low-density and (B) high-density staining of tumor-associated macrophages, highlighted by macrophage marker CD68 (brown) immunostain. (C) Low-proliferation and (D) high-proliferation indices demonstrated by nuclear proliferation antigen Ki67 (brown) immunostain.
Statistical Analysis
Pairwise correlations between MRI-derived and standard pathologic variables were calculated, using both Pearson and Spearman rank correlation coefficients, and were tested for statistical significance using Fisher's logarithmic transformation. Highly correlated pairs of variables were plotted for visual confirmation. Analysis of variance was also used to determine an association between imaging variables and each biologic marker. We used a multivariate statistical method, canonical correlation, to find two composite linear scores, one using MRI features and another using a combination of histopathologic and IHC features, that maximized the correlation between the two composite scores.
RESULTS
The 45 patients included in this study ranged in age from 37 to 72 years (mean, 50 years; median, 49 years). Tumor size ranged from 9 to 90 mm. Patient characteristics and the characteristics of the DCIS lesions are listed in Table 1.
Table 1.
Patient and Ductal Carcinoma In Situ Tumor Characteristics
| Characteristic | No. of Patients (N = 45) | % |
|---|---|---|
| Patient characteristics | ||
| Age, years | ||
| < 35 | 0 | 0 |
| 35–44 | 11 | 24 |
| 45–54 | 24 | 53 |
| 55–64 | 8 | 18 |
| > 65 | 2 | 4 |
| Race | ||
| White | 37 | 82 |
| Black | 2 | 4 |
| Asian | 4 | 9 |
| Hispanic | 0 | 0 |
| Other/none | 2 | 4 |
| Tumor characteristics | ||
| Grade | ||
| Low | 3 | 7 |
| Intermediate | 13 | 29 |
| High | 18 | 40 |
| Mixed | 11 | 24 |
| Low-medium | 5 | 11 |
| Medium-high | 5 | 11 |
| Low-high | 1 | 2 |
| Size, mm | ||
| 1–15 | 12 | 27 |
| 16–30 | 11 | 24 |
| 31–45 | 3 | 7 |
| 45–60 | 3 | 7 |
| > 60 | 3 | 7 |
| Multifocal or not applicable | 13 | 29 |
| Comedo | ||
| Yes | 25 | 56 |
| No | 20 | 44 |
Biomarker Versus Pathologic Features
The biomarkers included in this study were proliferation as measured by Ki67, angiogenesis as measured by CD34, inflammation as measured by CD68, and ER score. Table 2 shows biomarkers correlation with the following pathologic features: DCIS grade, presence/degree of comedo necrosis, pathologic size, and pathologic density. As expected, higher grade lesions and the presence of comedo necrosis correlated strongly with high Ki67 (proliferative rates). CD34 and ER score did not correlate strongly with grade, comedo necrosis, size, or density, although higher ER scores were less likely to be associated with high-grade lesions. CD68, a macrophage marker, was particularly strongly associated with large, pathologically dense, high-grade lesions with comedo necrosis.
Table 2.
Pathologic and Biomarker Correlation (continuous variables)
| Nuclear Grade |
Comedo Necrosis |
Pathologic Size |
Pathologic Density |
|||||
|---|---|---|---|---|---|---|---|---|
| Biomarker | P | r | P | r | P | r | P | r |
| Ki67 | .016* | 0.36 | .027* | 0.33 | .682 | 0.06 | .185 | −0.20 |
| CD68 | .098 | 0.25 | .002* | 0.44 | .001* | 0.50 | .021* | 0.34 |
| CD34 | .054 | 0.29 | .964 | 0.01 | .557 | −0.09 | .939 | −0.01 |
| Estrogen receptor | .203 | −0.19 | .411 | −0.13 | .069 | −0.27 | .370 | 0.14 |
P < .05.
Imaging Features Versus Pathologic/IHC Features
Table 3 lists pairwise comparisons. Of note, MRI size and percentage of breast involved strongly correlated with pathologic size. Pathologic density score significantly correlated with MRI density and enhancement pattern (P < .01).
Table 3.
Pairwise Correlations Among MRI and Pathology or Immunohistochemistry Features
| Pathology Variables |
Immunohistochemistry Variables |
|||||||
|---|---|---|---|---|---|---|---|---|
| MRI Variable | Size | Density | Nuclear Grade | Comedo | Ki67 | CD68 | CD34 | ER Score |
| Size | ||||||||
| r | 0.55 | 0.20 | 0.15 | 0.23 | 0.00 | 0.40 | −0.20 | −0.20 |
| P | .0001* | .1823 | .3284 | .1264 | .9747 | .0061* | .1946 | .1852 |
| % of breast involved | ||||||||
| r | 0.52 | 0.32 | 0.12 | 0.21 | −0.06 | 0.46 | −0.18 | −0.16 |
| P | .0003* | .0315* | .4396 | .1654 | .6843 | .0014* | .2484 | .3009 |
| Density | ||||||||
| r | 0.12 | 0.45 | −0.13 | 0.25 | −0.12 | 0.47 | −0.23 | −0.06 |
| P | .4204 | .0021* | .4126 | .0927 | .435 | .0012* | .1275 | .7097 |
| Enhancement pattern | ||||||||
| r | −0.19 | −0.37 | −0.18 | −0.20 | −0.03 | −0.15 | 0.09 | 0.01 |
| P | .2187 | .0122* | .2474 | .1867 | .8602 | .3341 | .5709 | .9643 |
Abbreviations: MRI, magnetic resonance imaging; ER, estrogen receptor.
P < .05.
Despite the overall correlation between pathologic density and MRI variables, neither nuclear grade nor Ki67 was significantly correlated with any single imaging variable. There was a strong correlation between CD68 and MRI size, percentage of breast involved, and MRI density (P < .01), suggesting that macrophages are abundant in single, large, dense tumors. Although comedo necrosis alone was not significantly correlated with any imaging variables, it was strongly correlated with CD68 staining, which was strongly correlated with imaging variables.
Canonical Correlation Among Imaging and Pathology Variables
The canonical correlation is derived from linear combinations among two sets of variables. In our study, imaging and pathologic features correlated well (r = 0.73), suggesting that MRI measures the same overall set of characteristics that pathologists see in DCIS tumors.
Combining ACR-BIRADS Features to Describe DCIS Lesions
When we separated DCIS lesions into distinguishable imaging categories based on MRI tumor distribution and enhancement characteristics (Fig6), the grouping described in Table 4 corresponded best with trends in pathologic features. Table 4 also lists the means, standard deviations, and ranges for Ki67, CD68, CD34, ER, MRI size, and pathologic size and density across the spectrum of the MRI distribution and enhancement patterns. Patient cases clustered according to the biomarkers we selected, with particularly strong separation of the cases with Ki67 and CD68. Focal lesions were small, low-grade, ER-positive tumors, whereas linear ductal lesions had high proliferation but low inflammation and necrosis. Heterogeneous lesions tended to be ER positive with a low inflammatory component. Clumped regional lesions were large, ER negative, and highly proliferative. Segmental lesions had high inflammatory and proliferative components, as did homogeneous lesions, which were also large and ER negative.
Figure 6.

Example magnetic resonance images from each group: (A) focal = small, low-grade, estrogen receptor (ER) –positive tumors; (B) linear ductal = high proliferation, low inflammation, low necrosis; (C) heterogeneous = ER positive, low inflammatory component; (D) clumped regional = large, ER negative, highly proliferative; (E) segmental = high inflammatory and proliferative components, as did (F) homogeneous = large, ER negative.
Table 4.
Biomarkers Versus Imaging/Size
| MRI Classification |
Distribution | Enhancement | No. of Patients |
Ki67 (%) |
CD68 (No.) |
CD34 (No.) |
ER Score |
MRI Size (mm) |
Pathologic Size (mm) |
Pathologic Density Score |
|---|---|---|---|---|---|---|---|---|---|---|
| Group 1 | Focal | All | 8 | |||||||
| Mean | 22.3 | 24.8 | 67 | 3.5 | 22.1 | 15.4 | 1.8 | |||
| SD | 18 | 11.3 | 35.6 | 3.3 | 24.1 | 4 | 0.7 | |||
| Range | 5.3–55.2 | 8–45 | 27–140 | 0–8 | 4–77 | 9–20 | 1–3 | |||
| Group 2 | Linear ductal | All | 7 | |||||||
| Mean | 38.9 | 29 | 80.3 | 3.5 | 26.9 | 34.9 | 1.3 | |||
| SD | 18 | 7.6 | 77.2 | 3 | 19.2 | 47.2 | 0.5 | |||
| Range | 17.2–71 | 20–42 | 15–198 | 0–8 | 9–60 | 9–140 | 1–2 | |||
| Group 3 | Segmental, regional, multiregional | Heterogeneous | 12 | |||||||
| Mean | 24.1 | 29 | 69 | 4.4 | 49.3 | 21.9 | 1.7 | |||
| SD | 16.2 | 16.3 | 35.4 | 2.5 | 25.1 | 16.3 | 0.8 | |||
| Range | 0.9–53 | 13–73 | 21–122 | 0–8 | 18–93 | 4–50 | 1–3 | |||
| Group 4 | Regional, multiregional | Clumped | 8 | |||||||
| Mean | 26.3 | 62.8 | 50.8 | 2.1 | 71.6 | 41.9 | 2.3 | |||
| SD | 11.9 | 49.5 | 28.5 | 3 | 40.1 | 31.8 | 0.5 | |||
| Range | 8.1–43.2 | 20–145 | 28–117 | 0–7 | 36–158 | 14–90 | 2–3 | |||
| Group 5 | Segmental | Clumped | 7 | |||||||
| Mean | 30.5 | 63.5 | 64.9 | 3.4 | 56.6 | 43.7 | 2.9 | |||
| SD | 13.6 | 51.9 | 22.6 | 3.3 | 9.5 | 12.8 | 0.4 | |||
| Range | 15.4–47.6 | 14–166 | 17–87 | 0–7 | 40–70 | 24–60 | 2–3 | |||
| Group 6 | Segmental, regional, multiregional | Homogeneous | 3 | |||||||
| Mean | 29.4 | 99.7 | 70 | 1 | 71.7 | 53 | 2.3 | |||
| SD | 14.5 | 61.2 | 12.5 | 1.7 | 47.6 | 35.6 | 0.6 | |||
| Range | 14.5–43.4 | 34–155 | 60–84 | 0–3 | 21–114 | 19–90 | 2–3 |
Abbreviations: MRI, magnetic resonance imaging; ER, estrogen receptor; SD, standard deviation.
Figure 7 shows MRI size plotted against the pathology size. Each patient is coded by the categories of MRI enhancement and distribution described in Table 4. Although the overall correlation was modest (r = 0.55, P = .0001), examination of the patients for whom MRI size is significantly greater than pathology size is impressive. MRI overestimated 12 patients (23%) by more than two-fold. Interestingly, all but one of the patients were heterogeneous (groups 3 and 4). MRI underestimated size by half in two patients (9%).21
Figure 7.
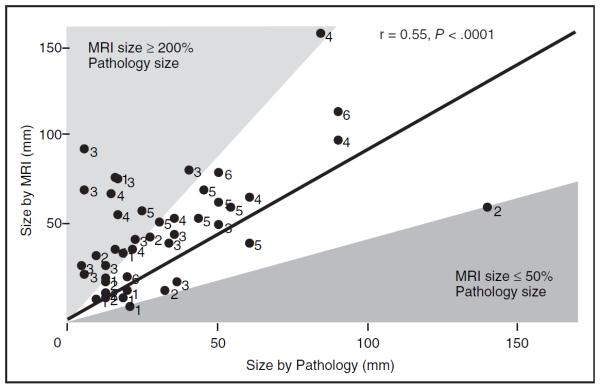
Correlation of magnetic resonance imaging (MRI) size (mm) and pathology size (mm) of ductal carcinoma in situ, labeled by MRI group, shows moderately strong correlation (r = 0.55). Solid line represents 1:1 association. Outliers where MRI size was 200% that of pathology size were predominantly in groups 3 and 4.
DISCUSSION
MRI and pathologic examination demonstrate that there is a range of DCIS lesions that vary significantly in size, distribution, and enhancement patterns. These lesions do not look the same under the microscope; they also do not look the same on MRI. Our findings suggest that the picture of DCIS revealed by MRI reflects differences in histopathologic features, giving us the potential opportunity to preoperatively characterize DCIS lesions. This is important not only because it may be helpful in surgical planning for certain patients, but because it may facilitate the introduction and evaluation of perioperative, neoadjuvant, and nonoperative treatment strategies that will help us evaluate the best strategies to prevent invasive breast cancer.
We have previously published an article on the sensitivity and specificity of size correlation among mammography, MRI, and pathology.25 In the present, detailed study, MRI estimates of size are only modestly correlated with pathologic size. However, most of the discrepancy arises from heterogeneous, ER-positive lesions. Size based on pathologic examination is difficult to measure because ducts are three dimensional and histology sections are two dimensional. In this in-depth study, we carefully estimated size based on the total number of tissue sections, their thickness, and presence of DCIS in consecutive sections. It is harder to measure scattered DCIS, which is one possible explanation for the discrepancy in the heterogeneous patients (groups 3 and 4). Another explanation is that heterogeneous DCIS lesions are more often associated with benign proliferative lesions, such as sclerosing adenosis, atypia, and proliferative fibrocystic change.21 Although MRI provides a three-dimensional representation of what enhances, the borders between DCIS and its surrounding benign processes are often blurred, especially when DCIS is sparsely scattered.21,26
The compactness of DCIS on a given histopathology slide was correlated with the density of pixels enhancing on MRI. When DCIS lesions are measured, either the greatest extent on a given slide or the number of adjacent sections that involve DCIS, relative to the size of the excised specimen, is used to generate a size estimate. A better estimate of DCIS volume is likely to come from assessing both the extent of disease in the breast and the density (ie, how tightly packed the involved ducts are over the extent of disease). To capture this aspect of DCIS pathology, we measured the space between the ducts involved with disease. Sparse lesions could reliably be distinguished from lesions that were tightly packed. One feature of this schema that could be improved is to distinguish extensive involvement of ducts that are small and closely packed from single contiguous ducts widely distended with DCIS. We have added this modification to our density scheme and are testing it for prognostic value in a large population-based study of DCIS.
Of the IHC stains, CD68 correlated best with MRI features. CD68 also correlates with markers known to be associated with higher recurrence (ie, high nuclear grade and the presence of comedo necrosis). The more clumped the enhancement and the denser and larger the lesion, the higher the CD68 staining. Thus, CD68 seems to separate out a different type of high-grade lesion. We are designing a study to test the relationship of both CD68 and pathology density to outcomes in a population-based paired set of DCIS patients and recurrences with 10-year follow-up.
Although MRI enhancement reflects vascularization of lesions, we did not find a correlation between microvessel counts (CD34) and MRI types, DCIS grade, MRI density, or pathologic density. CD34 counts are elevated relative to normal breast tissue but lower than in DCIS.27 However, we did not see a distinction among DCIS types. Ki67 values were highly variable and ranged from low (1%) to high (71%). This range is even broader than for invasive cancer lesions.28 Ki67 alone was not associated with individual MRI features.
The recently described ACR-BIRADS MRI lexicon provides a nomenclature to allow more standard ways to describe DCIS. Although individually, neither the ACR-BIRADS terms for enhancement nor those for distribution patterns were strongly associated with pathologic features, the combination of all of the imaging features and the pathology features were strongly correlated. Perhaps more importantly, these standard terms provide a starting point or common language for radiologists and surgeons to describe DCIS lesions and help anticipate what they will find with surgical excision.
Some important distinctions emerge when stratifying lesions by MRI. Heterogeneous regional and multiregional lesions (group 3) scattered over larger regions of the breast tended to be ER positive but were not highly proliferative and did not have significant macrophage infiltration. These lesions were prone to ≥ 200% MRI size overestimation.21 Although we have proposed that segmental distribution (group 5) may be different from regional or multiregional distribution, we have too few patients to have any assurance that there is a meaningful difference between these categories. However, we can say that large, homogenous lesions (group 6) have both high Ki67 and high CD68 and have extensive comedo necrosis. Biologically, these lesions are more aggressive,29 and they certainly have a distinct appearance that can be distinguished on MRI. It is interesting to note that larger lesions that are heterogeneous and not as densely packed have lower Ki67 and CD68 rates and higher ER scores than the homogenous lesions that have low ER score, high Ki67, and high CD68. We hope that these observations will provide a platform for standardizing, refining, and improving the classification of known DCIS lesions.
Because we excluded patients who did not have additional tissue to cut for biomarker staining, we lacked a representative sample of small lesions, which included many low-grade patients. Because this is a descriptive study designed to find MRI and pathologic associations, these observations and attempts at classification will need to be prospectively validated using a separate data set.
Based on our results, we have begun to develop quantitative measures to assess tumor volume and enhancement characteristics to improve the ability to standardize criteria for DCIS versus high-risk lesions and to distinguish biologic subtypes of DCIS. We are using these MRI features to predict response in our neoadjuvant hormone trial. Over time, understanding of how DCIS appears on MRI will facilitate neoadjuvant studies30 and may change how clinicians approach the treatment of this heterogeneous preinvasive condition.
MRI clearly has the capability of providing a three-dimensional map of DCIS. Lesion size on MRI correlates with lesion size at the time of pathologic examination, but heterogeneous lesions are overestimated, perhaps reflecting the presence of a continuum of proliferative changes in noncomedo DCIS lesions. Interestingly, the density of the pixels that enhance correlates with how tightly packed the DCIS appears on representative histologic tissue sections. Strong canonical correlation suggests that MRI variables capture a similar set of characteristics that pathology and biomarker analyses provide. This in-depth analysis demonstrates the imaging heterogeneity of DCIS lesions and that imaging features provide information about the underlying biology of the DCIS. As we improve our ability to noninvasively characterize DCIS, we may be able to use imaging to assess the effect of perioperative and neoadjuvant treatment.
Acknowledgment
We thank Jessica Gibbs for her technical assistance in preparing the magnetic resonance figures.
Supported by Department of Defense Breast Cancer Research Program US Army Materiel Command Grant No. DAMD 17-03-0481; American Cancer Society Grant No. RPG-97-036-EDT; and the Breast Cancer Research Foundation.
Footnotes
Authors' Disclosures of Potential Conflicts of Interest The authors indicated no potential conflicts of interest.
Author ContributionsConception and design: Laura J. Esserman, Dulcy Wolverton, Nola M. Hylton Financial support: Laura J. Esserman, Nola M. Hylton Administrative support: Laura J. Esserman, Alex F. Herrera, Alfred Au, Yunn-Yi Chen, Daniel F. Chen, Jennifer Hellawell, Nola M. Hylton Provision of study materials or patients: Laura J. Esserman, Alex F. Herrera, Jessica Leung, Alfred Au, Yunn-Yi Chen, E. Shelley Hwang, Nola M. Hylton Collection and assembly of data: Laura J. Esserman, Anjali S. Kumar, Alex F. Herrera, Jessica Leung, Alfred Au, Yunn-Yi Chen, Daniel F. Chen, Jennifer Hellawell, Dulcy Wolverton, E. Shelley Hwang, Nola M. Hylton Data analysis and interpretation: Laura J. Esserman, Anjali S. Kumar, Alex F. Herrera, Alfred Au, Dan H. Moore, Daniel F. Chen, E. Shelley Hwang, Nola M. Hylton Manuscript writing: Laura J. Esserman, Anjali S. Kumar, Alex F. Herrera, Jessica Leung, Yunn-Yi Chen, Dan H. Moore, E. Shelley Hwang, Nola M. Hylton Final approval of manuscript: Laura J. Esserman, Anjali S. Kumar, Alex F. Herrera, Jessica Leung, Alfred Au, Yunn-Yi Chen, Dan H. Moore, Daniel F. Chen, Jennifer Hellawell, Dulcy Wolverton, E. Shelley Hwang, Nola M. Hylton
REFERENCES
- 1.Morrow M, Strom EA, Bassett LW, et al. Standard for the management of ductal carcinoma in situ of the breast (DCIS) CA Cancer J Clin. 2002;52:256–276. doi: 10.3322/canjclin.52.5.256. [DOI] [PubMed] [Google Scholar]
- 2.Schnitt SJ, Connolly JL. Classification of ductal carcinoma in situ: Striving for clinical relevance in the era of breast conserving therapy. Hum Pathol. 1997;28:877–880. doi: 10.1016/s0046-8177(97)90000-9. [DOI] [PubMed] [Google Scholar]
- 3.Allred DC, O'Connell P, Fuqua SA, et al. Immunohistochemical studies of early breast cancer evolution. Breast Cancer Res Treat. 1994;32:13–18. doi: 10.1007/BF00666202. [DOI] [PubMed] [Google Scholar]
- 4.Fisher ER, Dignam J, Tan-Chiu E, et al. Pathologic findings from the National Surgical Adjuvant Breast Project (NSABP) eight-year update of Protocol B-17: Intraductal carcinoma. Cancer. 1999;86:429–438. doi: 10.1002/(sici)1097-0142(19990801)86:3<429::aid-cncr11>3.0.co;2-y. [DOI] [PubMed] [Google Scholar]
- 5.Hetelekidis S, Collins L, Silver B, et al. Predictors of local recurrence following excision alone for ductal carcinoma in situ. Cancer. 1999;85:427–431. [PubMed] [Google Scholar]
- 6.Jensen RA, Page DL. Ductal carcinoma in situ of the breast: Impact of pathology on therapeutic decisions. Am J Surg Pathol. 2003;27:828–831. doi: 10.1097/00000478-200306000-00015. [DOI] [PubMed] [Google Scholar]
- 7.Silverstein MJ, Lagios MD, Groshen S, et al. The influence of margin width on local control of ductal carcinoma in situ of the breast. N Engl J Med. 1999;340:1455–1461. doi: 10.1056/NEJM199905133401902. [DOI] [PubMed] [Google Scholar]
- 8.Vicini FA, Kestin LL, Goldstein NS, et al. Relationship between excision volume, margin status, and tumor size with the development of local recurrence in patients with ductal carcinoma-in-situ treated with breast-conserving therapy. J Surg Oncol. 2001;76:245–254. doi: 10.1002/jso.1041. [DOI] [PubMed] [Google Scholar]
- 9.Sanders ME, Schuyler PA, Dupont WD, et al. The natural history of low-grade ductal carcinoma in situ of the breast in women treated by biopsy only revealed over 30 years of long-term follow-up. Cancer. 2005;103:2481–2484. doi: 10.1002/cncr.21069. [DOI] [PubMed] [Google Scholar]
- 10.Frykberg ER, Bland KI. Overview of the biology and management of ductal carcinoma in situ of the breast. Cancer. 1994;74:350–361. doi: 10.1002/cncr.2820741321. [DOI] [PubMed] [Google Scholar]
- 11.Sakorafas GH, Tsiotou AG. Ductal carcinoma in situ (DCIS) of the breast: Evolving perspectives. Cancer Treat Rev. 2000;26:103–125. doi: 10.1053/ctrv.1999.0149. [DOI] [PubMed] [Google Scholar]
- 12.Ernster VL. Prophylactic mastectomy in women with a high risk of breast cancer. N Engl J Med. 1999;340:1838. [PubMed] [Google Scholar]
- 13.Ernster VL, Barclay J, Kerlikowske K, et al. Incidence of and treatment for ductal carcinoma in situ of the breast. JAMA. 1996;275:913–918. [PubMed] [Google Scholar]
- 14.Kumar AS, Bhatia V, Henderson IC. Overdiagnosis and overtreatment of breast cancer: Rates of ductal carcinoma in situ—A US perspective. Breast Cancer Res. 2005;7:271–275. doi: 10.1186/bcr1346. [DOI] [PMC free article] [PubMed] [Google Scholar]
- 15.Gabrielson E, Argani P. Heterogeneity in the pathology and molecular biology of breast cancer. Current Genomics. 2002;3:477–488. [Google Scholar]
- 16.Hwang ES, Esserman L. Neoadjuvant hormonal therapy for ductal carcinoma in situ: Trial design and preliminary results. Ann Surg Oncol. 2004;11(suppl 1):37S–43S. doi: 10.1007/BF02524794. [DOI] [PubMed] [Google Scholar]
- 17.Kumar AS, Esserman LJ. Statins: Health-promoting agents show promise for breast cancer prevention. Clin Breast Cancer. 2005;6:455–459. doi: 10.3816/CBC.2005.n.051. [DOI] [PubMed] [Google Scholar]
- 18.Zuiani C, Francescutti GE, Londero V, et al. Ductal carcinoma in situ: Is there a role for MRI? J Exp Clin Cancer Res. 2002;21:89–95. [PubMed] [Google Scholar]
- 19.Hylton N. Magnetic resonance imaging of the breast: Opportunities to improve breast cancer management. J Clin Oncol. 2005;23:1678–1684. doi: 10.1200/JCO.2005.12.002. [DOI] [PubMed] [Google Scholar]
- 20.Esserman L, Hylton N, Yassa L, et al. Utility of magnetic resonance imaging in the management of breast cancer: Evidence for improved preoperative staging. J Clin Oncol. 1999;17:110–119. doi: 10.1200/JCO.1999.17.1.110. [DOI] [PubMed] [Google Scholar]
- 21.Kumar AS, Chen DF, Au A, et al. Biologic significance of false positive MRI enhancement in the setting of DCIS. Am J Surg. doi: 10.1016/j.amjsurg.2006.07.003. in press. [DOI] [PMC free article] [PubMed] [Google Scholar]
- 22.Hiramatsu H, Ikeda T, Mukai M, et al. MRI of ductal carcinoma in situ of the breast: Patterns of findings and evaluation of disease extent. Nippon Igaku Hoshasen Gakkai Zasshi. 2000;60:205–209. [PubMed] [Google Scholar]
- 23.Ikeda DM, Hylton NM, Kinkel K, et al. Development, standardization, and testing of a lexicon for reporting contrast-enhanced breast magnetic resonance imaging studies. J Magn Reson Imaging. 2001;13:889–895. doi: 10.1002/jmri.1127. [DOI] [PubMed] [Google Scholar]
- 24.ACR BI-RADS . Breast Imaging and Reporting Data System-Magnetic Resonance Imaging. American College of Radiology; Reston, VA: 2004. pp. 1–114. [Google Scholar]
- 25.Hwang ES, Kinkel K, Esserman LJ, et al. Magnetic resonance imaging in patients diagnosed with ductal carcinoma-in-situ: Value in the diagnosis of residual disease, occult invasion, and multicentricity. Ann Surg Oncol. 2003;10:381–388. doi: 10.1245/aso.2003.03.085. [DOI] [PubMed] [Google Scholar]
- 26.Kneeshaw PJ, Lowry M, Manton D, et al. Differentiation of benign from malignant breast disease associated with screening detected microcalcifications using dynamic contrast enhanced magnetic resonance imaging. Breast. 2006;15:29–38. doi: 10.1016/j.breast.2005.05.002. [DOI] [PubMed] [Google Scholar]
- 27.Esserman L, Hylton N, George T, et al. Contrast-enhanced magnetic resonance imaging to assess tumor histopathology and angiogenesis in breast carcinoma. Breast J. 1999;5:13–21. doi: 10.1046/j.1524-4741.1999.005001013.x. [DOI] [PubMed] [Google Scholar]
- 28.Mylonas I, Makovitzky J, Jeschke U, et al. Expression of Her2/neu, steroid receptors (ER and PR), Ki67 and p53 in invasive mammary ductal carcinoma associated with ductal carcinoma in situ (DCIS) versus invasive breast cancer alone. Anticancer Res. 2005;25:1719–1723. [PubMed] [Google Scholar]
- 29.Kerlikowske K, Molinaro A, Cha I, et al. Characteristics associated with recurrence among women with ductal carcinoma in situ treated by lumpectomy. J Natl Cancer Inst. 2003;95:1692–1702. doi: 10.1093/jnci/djg097. [DOI] [PubMed] [Google Scholar]
- 30.Esserman L, Sepucha K, Ozanne E, et al. Applying the neoadjuvant paradigm to ductal carcinoma in situ. Ann Surg Oncol. 2004;11(suppl 1):28S–36S. doi: 10.1007/BF02524793. [DOI] [PubMed] [Google Scholar]