

Abstract
This study sought to differentiate alcoholism-related changes in judgments of emotional stimuli from those of other populations in which such changes have been documented. Two sets of visual stimuli, one containing words and the other containing drawings of faces (representing a range of emotional content), were presented to abstinent alcoholic adults with and without Korsakoff’s syndrome, as well as to a healthy control group and four groups of patients with other neurobehavioral disorders: Parkinson’s disease, schizophrenia, depression, and posttraumatic stress disorder. Participants rated the stimuli according to emotional valence and intensity of emotion. Results implicated bi-hemispheric frontal and subcortical involvement in the abnormalities of emotion identification associated with alcoholism, and they also support the notion of age-related vulnerabilities in conjunction with alcoholism.
Keywords: alcoholism, aging, Korsakoff’s syndrome, emotion, neurobehavioral disorders
Emotional changes that accompany long-term chronic alcoholism cover a broad spectrum (National Institute of Alcohol Abuse and Alcoholism, 1997) and have significant social and interpersonal significance (Kornreich et al., 2002). Among the abnormalities are affective processing deficits such as a diminished ability to recognize facial expressions of emotion (Howard, Oscar-Berman, Marinkovic, O’Reilly, & Harris, 2003; Kornreich et al., 2002; Philippot et al., 1999; Townshend & Duka, 2003) and reduced ability to decipher affective prosody in spoken language (Monnot, Nixon, Lovallo, & Ross, 2001). The abnormalities in emotional perception have been attributed to a combination of underlying factors, for example, visuospatial deficits, abnormal processing of social information, poor inhibitory control, and interpersonal stress (Moselhy, Georgiou, & Kahn, 2001; Philippot et al., 1999). Brain changes associated with these deficits include pathology of frontosubcortical and limbic systems or disturbances in the functioning of the right hemisphere (Bowirrat & Oscar-Berman, 2005; Oscar-Berman, 2000; Sullivan, 2000). For example, it has been suggested that alcoholic individuals’ tendencies to overestimate facial emotions could be related to interference with frontally mediated disinhibition processes that cause a bias toward exaggerating emotions (Townshend & Duka, 2003). Likewise, there may be changes in functioning of the amygdala, a limbic structure essential for processing of facial expressions of emotion (Townshend & Duka, 2003). Tendencies to misidentify negative emotions have been related to right hemisphere disruptions, because of the right hemisphere’s role in visuospatial abilities (Ellis & Oscar-Berman, 1989) and in processing negative stimuli (Adolphs, Jansari, & Tranel, 2001).
Numerous studies have demonstrated abnormalities in affective functioning in other patient populations with known neuroanatomical involvement of frontosubcortical or limbic systems, e.g., Parkinson’s disease (PD), schizophrenia (SZ), depressive disorders, and posttraumatic stress disorder (PTSD). For example, Dujardin et al. (2004) reported that patients with PD were less accurate than healthy participants in perceiving angry, sad, and disgusted facial expressions. SZ patients also have been reported to display emotional facial expression decoding impairments (Hempel, Hempel, Schonknecht, Stippich, & Schroder, 2003; Mandal, Pandey, & Prasad, 1998; Sachs, Steger-Wuchse, Kryspin-Exner, Gur, & Katschnig, 2004), which have been related to abnormal activation of the cingulate gyrus and of the amygdala–hippocampal complex (Hempel et al., 2003). Changes in affect recognition have been noted in patients with depression (Hale, 1998; Persad & Polivy, 1993) and have been related to right-hemisphere dysfunction (Mikhailova, Vladimirova, Iznak, Tsusulkovskaya, & Sushko, 1996), to abnormalities in the activation of the left amygdala (Sheline et al., 2001), and to abnormalities in activation of hippocampal/parahippocampal regions (Lawrence et al., 2004). Emotion recognition difficulties have been noted in persons with PTSD (Shin et al., 2005). One study showed increased initial amygdala response to trauma-related negative stimuli (Protopopescu et al., 2005), and another study showed exaggerated amygdala activation, and diminished medial prefrontal cortex activation, in response to fearful versus happy facial expressions (Shin et al., 2005).
Collectively, results of numerous studies have demonstrated that within neural systems involved in affective functioning, different neuroanatomical loci or circuitry contributes to the recognition of different emotions and, further, that various neuropathological changes and conditions can result in distinct disruptions of these circuits leading to specific patterns of deficits. Accordingly, an examination of affect recognition abilities across multiple patient populations is likely to prove beneficial in the identification of the underlying neural regions that give rise to these deficits in alcoholic individuals. However, studies comparing affective functioning in alcoholic individuals with emotional changes associated with other neuropsychological disorders are uncommon. Two studies by Kornreich and colleagues examined the performance of alcoholic individuals in comparison with other clinical populations; one study examined the emotion perception abilities of recovered alcoholic individuals and patients with obsessive-compulsive disorder (Kornreich, Blairy, Philippot, Dan, et al., 2001), and the other compared alcoholic individuals with persons having opiate addictions (Kornreich et al., 2003). In both studies, alcoholic persons showed clear deficits in facial affect recognition.
The present study was designed to differentiate abnormalities in emotional perception by alcoholic individuals from those of four groups of neurobehavioral patients with related pathologies. In addition, because chronic alcohol consumption exaggerates neurobehavioral and brain volumetric effects of normal chronological aging (Kubota et al., 2001; Oscar-Berman, 2000; Pfefferbaum, Sullivan, Mathalon, & Lim, 1997), we were interested in examining the possible synergistic (i.e., additive) effects of alcoholism and aging on affective judgments. We presented two sets of emotional stimuli, consisting of drawings of faces and printed words, representing a range of positive, neutral, and negative emotions, to alcoholic individuals (with and without Korsakoff’s syndrome) and to healthy age-equivalent control participants, as well as to individuals who fell into one of the following diagnostic categories: PD, SZ, PTSD, or major depressive disorder (MDD). We hypothesized that the patterns of impairment would differ among the groups and that the compounded effects of aging and alcoholism would render larger deficits in older than in younger alcoholic individuals (when compared with their respective age-equivalent healthy control groups), as predicted by the premature aging hypothesis of alcoholism (Ellis & Oscar-Berman, 1989; Noonberg, Goldstein, & Page, 1985; Oscar-Berman & Schendan, 2000; Parsons, Butters & Nathan, 1987). Further, we reasoned that patients with alcoholic Korsakoff’s syndrome (KS) would show an even greater distinction from healthy control participants than would the non-Korsakoff’s alcoholic individuals in their judgments of affective stimuli, as the former are known to suffer greater pathologic changes in frontolimbic brain regions. Lastly, because we presented stimuli representing both linguistic (words) and nonlinguistic (pictures of faces) modalities, we were able to investigate abnormalities in emotional perceptions that may emerge specific to each type of stimulus presentation. As such, we were able to evaluate the right-hemisphere hypothesis, which would posit that alcoholism is associated more with deficits in viewing emotional faces (greater right-hemisphere input) than with reading emotional words (greater left-hemisphere input).
Method
Participants
One hundred and sixty-three men and women were included in this study. All of the participants were right-handed, native English speakers. They consisted of the following seven groups: 47 abstinent alcoholic individuals without KS (AL); 14 KS patients; 7 patients with PD; 9 SZ patients; 9 patients with MDD; 7 PTSD patients; and 70 healthy nonalcoholic control adults (NC). In examining group differences and when making comparisons that concerned age, we conducted separate analyses on two subgroups of participants according to age, that is, young and old. In these analyses, NC and AL participants were considered to be “young” if they were age 49 or younger and “old” if they were age 50 years or older. The young and old subgroups consisted of the following diagnostic categories: (a) young normal control participants (YNC), young alcoholic participants (YAL), MDD, PTSD, and SZ groups and (b) old normal control participants (ONC), old alcoholic participants (OAL), KS, and PD groups. Tables 1 and 2 provide information about the participant groups.
Table 1.
Characteristics of the “Young” Patient and Control Subgroups
| Subgroup | Young normal control n = 33 (19 F, 14 M) |
Young alcoholic patients n = 14 (7 F, 7 M) |
Patients with major depressive disorder n = 9 (6 F, 3 M) |
Patients with PTSD n = 7 (5 F, 2 M) |
Schizophrenic patients n = 9 (6 F, 3 M) |
||||||||||
|---|---|---|---|---|---|---|---|---|---|---|---|---|---|---|---|
| M | SD | Range | M | SD | Range | M | SD | Range | M | SD | Range | M | SD | Range | |
| Age (years) | 31.15 | 11.03 | 18–49 | 40.50 | 6.05 | 30–49 | 44.56 | 7.60 | 33–54 | 45.71 | 12.38 | 28–67 | 38.44 | 9.17 | 21–48 |
| Education (years) | 16.00 | 1.68 | 12–20 | 15.21 | 2.55 | 12–19 | 16.44 | 2.01 | 13–19 | 16.43 | 1.40 | 14–18 | 13.78 | 3.35 | 8–19 |
| Full-scale IQ | 118.97 | 13.82 | 95–145 | 109.57 | 15.05 | 75–130 | 112.44 | 18.15 | 87–143 | 109.71 | 6.87 | 99–121 | 100.11 | 18.46 | 75–122 |
Note. PTSD = posttraumatic stress disorder. Group means and standard deviations are listed for age, education, and full scale IQ. The subgroups were statistically equivalent with respect to the above measures (α = .05 assessed by the Tukey’s honestly significant difference post hoc procedure).
Table 2.
Characteristics of the “Old” Patient and Control Subgroups
| Variable | Old normal controls n = 37 (12 F, 25 M) |
Old patients with alcoholism n = 33 (8 F, 25 M) |
Korsakoff’s patients n = 14 (1 F, 13 M) |
Parkinson’s disease patients n = 7 (0 F, 7 M) |
||||||||
|---|---|---|---|---|---|---|---|---|---|---|---|---|
| M | SD | Range | M | SD | Range | M | SD | Range | M | SD | Range | |
| Age (years) | 65.00 | 9.76 | 50–82 | 60.79 | 8.26 | 50–80 | 68.57 | 10.68 | 50–80 | 61.71 | 6.70 | 49–69 |
| Education (years) | 15.73a,b | 2.68 | 11–24 | 14.03a | 2.56 | 7–18 | 12.29b,c | 2.67 | 8–17 | 16.43c | 2.94 | 12–21 |
| Full-scale IQ | 114.62a | 15.60 | 69–150 | 107.27b | 15.71 | 80–147 | 92.71a,b | 13.00 | 74–122 | 110.57 | 11.70 | 98–132 |
Note. Within rows, means with the same subscripts are significantly different at α = .05 assessed by the Tukey’s honestly significant difference post hoc procedure between the listed subgroups.
The participants were recruited from Boston University Medical Center, the Department of Veterans Affairs (VA) Healthcare System’s Boston campus, and VA aftercare programs in the Boston area, as well as from newspaper advertisements and posters placed in local sites. The research was approved by the Institutional Review Boards of the Boston University School of Medicine and the Boston VA, and all research participants signed informed consent forms, as did responsible representatives for KS patients. Complete evaluation of each participant typically required from 7 to 9 hr of testing over a minimum of 2 days, although the KS patients often required more time. The participants were given frequent breaks, and a session was discontinued and rescheduled if a participant indicated fatigue. Participants were reimbursed for time and travel expenses.
A medical history interview, a handedness questionnaire, a vision test, an IQ test (Wechsler Adult Intelligence Scale [WAIS]—Revised; Wechsler, 1981, or the WAIS—III; Wechsler, 1997), and the Hamilton Depression Scale (Hamilton, 1960) were administered as part of a battery used to evaluate the participants. Additionally, detailed information regarding past and current drinking history was ascertained for AL and NC participants, and all participants except for those in the KS, PD, and SZ groups were given a computer-assisted, shortened version of the Diagnostic Interview Schedule (DIS; Robins, 1989), which provided lifetime psychiatric diagnoses according to the criteria of the Diagnostic and Statistical Manual of Mental Disorders (DSM–IV; American Psychiatric Association, 1994).
Participants were excluded if any source (i.e., DIS scores, hospital records, referrals, or personal interviews) indicated that they had one of the following: uncorrected abnormal vision or hearing, a history of serious learning disability or dyslexia, a history of extensive illicit drug dependence or abuse, clinical evidence of active hepatic disease, neurological dysfunction (e.g., major head injury with loss of consciousness greater than 15 min, stroke, epilepsy, or seizures unrelated to alcohol withdrawal), electroconvulsive therapy, or current use of psychoactive medication. Participants in the PD, SZ, MDD, and PTSD groups were included while on medication for their specific disorder. All participants except for those in the SZ group were excluded if they were diagnosed with comorbid major psychiatric disorder other than those specific to a study group. In the SZ group, 3 participants were comorbid for depression and 3 had been diagnosed with schizoaffective disorder prior to being diagnosed with SZ. Participants in the PD, SZ, MDD, PTSD, or NC groups also were excluded if they had a history of binge drinking, defined as 15 or more drinks per week. The AL group had a history of a minimum of 5 years of drinking at least 21 drinks per week, a sobriety period of at least 4 weeks immediately before the time of testing, and a DSM–IV diagnosis of alcohol abuse and dependence. The KS, PD, and SZ participants were diagnosed by the Neurology, Psychiatry, and Medical Services of the participating institutions. With the exception of the KS patients, none of the participants were residing permanently in an institution.
Stimulus Materials
The stimulus materials consisted of 54 black-and-white line drawings of faces and 54 single words (see Appendixes A and B). The facial stimulus set was developed with images from The Clip Art Book (Quinn, 1990) and from Mostly Happy! Clip Art of the Thirties, Forties and Fifties (Jankowski, 1992–1995). Many of the stimuli were modified, and some were created by a local artist. All images were approximately 0.75 in. × 1 in. (about 1.9 ×2.5 cm). The 54 facial stimuli were selected from a larger set on the basis of emotional valence. The stimuli had been evaluated by an independent group of 15 college students and laboratory assistants who were asked to rate each drawing on a 7-point scale, with 1 being most negative, 4 representing neutral, and 7 most positive. Eighteen of the 54 faces expressed positive emotions, 18 expressed negative emotions, and 18 had neutral expressions. Half of the stimuli depicted male faces and half depicted female faces. The faces were arranged vertically on three standard size pages, each having three columns to a page, with each column containing six stimuli.
The verbal stimuli consisted of three- to five-letter words in black Times New Roman type, font size 12 point. The words were chosen on the basis of previous work conducted in our laboratory (Hutner & Oscar-Berman, 1996); they had been selected from a list compiled by Paivio, Yuille, and Madigan (1968). Frequency ratings, abstractness– concreteness ratings, and emotionality and goodness ratings were obtained from this list and from norms compiled by Rubin and Friendly (1986). Eighteen of the 54 words were neutral, 18 had positive valence, and 18 had negative valence. Stimuli across categories were similar in word length, mean ratings, and number of syllables. The word stimuli were presented in a fashion similar to that of the facial stimuli; words were arranged on a single standard size page, in three columns, each containing 18 stimuli.
Procedure
Because alcoholism has been associated with abnormal perception of the intensity of facial expressions of emotion (Kornreich et al., 2002), we asked participants to judge the extent to which each of the face stimuli contained emotion— on a scale ranging from 1 to 7— by writing a number next to each face. A score of 7 represented high emotional intensity, 4 represented a medium amount of emotion, and 1 signified no emotion (neutral). We termed these rating scores “contains emotion” (CE). Following the intensity ratings, a measure of the perceived valence of each of the stimuli was obtained. In these ratings, termed “kind of emotion” (KE), a fresh copy of the same set of drawings, arranged in the same sequence, was presented. The participants were asked to rate the kind of emotion that was expressed in the image, with 7 being positive, 4 indicating neutral, and 1 representing negative emotion. The applicable rating scale was kept in view for each condition. The same rating sequence was conducted with the word stimuli, with the judgments for CE preceding those for KE. Presentation of facial and word stimulus sets was counterbalanced. Participants were required to ascribe a judgment to each stimulus on each of the rating scales.
Results
Analyses of the data were performed using SAS Version 8 (SAS Institute, 1998) and/or SPSS (Version 13.0, 2004). Effect size estimates were evaluated with Cohen’s d, the standardized distance between group means (Devilly, 2005). To evaluate the groups on comparable scales with respect to age, education, and gender, we used analyses of covariance (ANCOVAs) that automatically adjusted for differences in sample size performed through regression analyses, controlling for these covariates where indicated. Our major interest centered on comparisons involving alcoholic individuals (with and without KS). Therefore, our first regression analyses involved comparisons among AL and NC groups. In the next set of regression analyses we selected subgroups of participants to maximize age-range overlap. One set of comparisons involved participants in the young subgroups and included YAL, YNC, MDD, PTSD, and SZ participants. Another set of comparisons involved the old subgroups and included KS, OAL, ONC, and PD participants. In analyses involving more than two groups, to control for multiple comparisons, we first examined the overall significance of the model at the .05 alpha level and the group effect at the same level. We proceeded to test the individual effects only if the two former tests were significant. A similar strategy was adopted comparing AL and NC groups, without the middle step. In the results reported below, we provide F statistics for the overall models, as well as multiple partial t or F statistics for significant variables. Table 3 gives a summary of the findings.
Table 3.
Summary of Findings: Regression Model Outcomes for Ratings of Emotional Intensity (Contains Emotion, CE) and Emotional Valence (Kind of Emotion, KE) of Face and Word Stimuli
| Type of rating/comparison | Factor | ||
|---|---|---|---|
| Valence ratings of faces: KE | Negative factor | Neutral factor | Positive factor |
| AL–NC comparisons | *In the AL group, the amount of negativity ascribed to negative faces decreased as a function of age (see Figure 1). | ns | Combined effect of group and gender: A trend was seen for AL participants to attribute less positivity to positive faces, and for women to attribute more positivity to positive faces. |
| Old subgroup comparisons: OAL, ONC, KS, PD | Group differences driven by education; those with higher education rated negative faces as more negative. | Group differences driven by age; participants with a higher age rated neutral faces as more positive. | ns |
| Young subgroup comparisons: YAL, YNC, MDD, PTSD, SZ | ns | ns | *YAL ascribed less positivity to Positive faces than YNC (see Figure 2). Group differences were also driven by education level. Across the younger subgroups, those with more education tended to ascribe more positivity to the positive faces. |
|
| |||
| Intensity ratings of faces: CE | Negative factor | Neutral factor | Positive factor |
| AL–NC comparisons | ns | ns | ns |
| Old subgroup comparisons: OAL, ONC, KS, PD | ns | ns | ns |
| Young subgroup comparisons: YAL, YNC, MDD, PTSD, SZ | ns | ns | ns |
|
| |||
| Valence ratings of words: KE | Negative factor | Neutral factor | Positive factor |
| AL–NC comparisons | Group differences driven by age and education. Older AL and NC participants attributed more neutrality to negative words. AL and NC participants with greater education ascribed more negativity to negative words. | *The AL group attributed more positivity to Neutral words than did the NC group (see Figure 4). An effect of age and education was also seen, in that older AL and NC participants attributed more negativity to Neutral words, and those with more education ascribed more positivity to Neutral words. |
Combined effects of age, education, and gender: Older respondents ascribed more positivity to Positive words, more educated participants attributed greater negativity to the Positive words, and women attributed more positivity to the Positive words. |
| Old subgroup comparisons: OAL, ONC, KS, PD | ns | *The KS group ascribed more positivity to neutral words than did the ONC subgroup (see Figure 5). | ns |
| Young subgroup comparisons: YAL, YNC, MDD, PTSD, SZ | *The PTSD group attributed less negativity to negative words than any of the other Young subgroups (see Figure 3). | ns | ns |
|
| |||
| Intensity ratings of words: CE | Negative factor | Weak factor | Strong factor |
| AL–NC comparisons | *The AL group ascribed more emotion than the NC group to neutral words (see Figure 6); this effect decreased in those AL participants with higher education levels. | ns | Group differences driven by education; those with higher education attributed more emotion to Strong words. |
| Old subgroup comparisons: OAL, ONC, KS, PD | *KS patients attributed more emotion to neutral words than did the OAL and ONC subgroups (see Figure 7). *The MDD group ascribed more emotion to neutral words than did the YNC and PTSD subgroups. |
ns | ns |
| Young subgroup comparisons: YAL, YNC, MDD, PTSD, SZ | *The SZ group ascribed more emotion to neutral words than did the YAL, YNC, and PTSD subgroups (see Figure 8). | ns | ns |
Note. Asterisks indicate those comparisons that yielded significant findings driven by participant groups. AL = patients with alcoholism; NC = normal controls; ONC = old normal controls; OAL = old patients with alcoholism; KS = Korsakoff’s patients; PD = Parkinson’s disease patients; YNC = young normal controls; YAL = young alcoholics; MDD = major depressive disorder; PTSD = posttraumatic stress disorder; SZ = schizophrenics. ns = nonsignificant.
Evaluation of Emotional Facial Expressions
The KE and CE data were analyzed independently. Factor analyses on the responses of the NC group were used to reduce the number of stimuli to three factors (supported by the Scree test; SAS Version 8; SAS Institute, 1998). The criterion for inclusion of a stimulus into any factor was a loading of 0.4 or more after Promax rotation (Cureton & D’Agostino, 1983). Estimates dictate that, conservatively, a variable should share at least 15% of its variance with a specific factor (Stevens, 1996); a loading of 0.4 adequately satisfies this requirement (yielding 0.16, or 16%). On the basis of this criterion, 20 face stimuli were eliminated from the KE data, and 7 face stimuli were eliminated from the CE data. We labeled the resultant three factors for both data types “Neutral,” “Positive,” and “Negative.” These factors formed the basis of our comparisons among the various groups.
Kind of emotion: Valence ratings
In comparing the AL and NC groups, we found that the regression model for the Negative factor was significant, F(4, 111) = 4.80, p = .001, d = 0.42. Controlling for education in the model, we obtained a significant interaction between group and age, t(111) = 2.52, p = .01, d = 0.48, such that the judgment of negativity ascribed to the negative faces by the AL group decreased as a function of age (see Figure 1). This effect was not observed in the NC group, whose judgments of negativity remained unchanged as a function of age. Significant results were also observed in the comparisons of the older subgroups’ responses to the negative faces, F(5, 84) = 4.93, p < .001, d = 0.48; however, the significance in this model was driven more by education than by group membership (education, t(84) = 8.47, p < .01, d = 1.85), in that those with more education rated the stimuli to be more negative than did those with less education. Additionally, in the PD group alone, Spearman correlations revealed a significant relationship between Hamilton scores and negative judgments (r = .97, p < .05); higher depression scores were associated with more perceived negativity. There were no significant intergroup differences in comparisons among the young subgroups.
Figure 1.
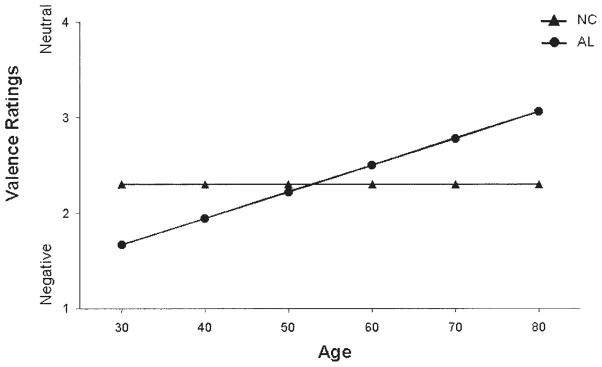
Mean scores for judgments of emotional valence (kind of emotion) for negative face stimuli by alcoholic (AL) and normal control (NC) groups as a function of age (controlling for education). The graph shows judgment scores of the stimuli within the Negative factor, with education fixed at 15 years. Stimuli were rated on a scale ranging from 1 (negative) to 7 (positive), with 4 being neutral. Judgments of the AL group became less negative with age, whereas judgments of the NC group remained constant.
For the Neutral factor, no significant differences were observed between the AL and NC groups. However, significant differences were observed in comparisons among the old subgroups, F(5, 84) = 2.66, p < .05, d = .36, which were driven by age, t(84) = 9.62, p < .01, d = 2.10. These results indicated that with increasing age, neutral facial stimuli were judged to be increasingly positive by all groups alike. Results from the regression model for comparisons among the young subgroups on this factor were statistically insignificant.
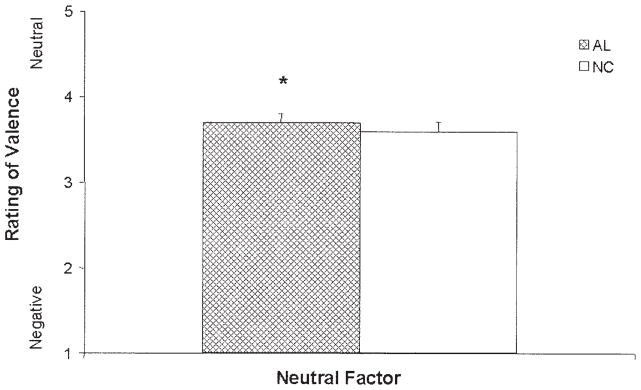
The regression model for the comparison of AL and NC groups on the Positive factor was significant, F(3, 112) = 3.00, p < .05, d = 0.33; however, the influence of group effects in this analysis did not reach significance, t(112) = −1.89, p = .061, d = −0.36. The tendency for AL participants to attribute less positivity to positive faces was accompanied by a tendency for women to ascribe greater positivity than men to the positive stimuli. Comparisons among the old subgroups on the Positive factor were insignificant. The regression model resulting from comparisons of the young subgroups was significant, F(6, 65) = 2.55, p < .05, d = 0.40, and appeared to be driven by education, t(65) = 5.10, p < .05, d = 1.27, and by differences between the responses of the YAL and YNC subgroups, t(65) = 3.07, p < .05, d = 0.76. These findings indicated that the YAL subgroup attributed less positivity to positive faces than did the YNC subgroup (see Figure 2) and that among the younger subgroups of participants, those with more education attributed more positivity to the positive stimuli.
Figure 2.

Mean (+ standard error of the mean) judgments of emotional valence (kind of emotion) for Positive face stimuli by the young subgroups: young alcoholic participants (YAL), young normal control participants (YNC), and participants with major depressive disorder (MDD), posttraumatic stress disorder (PTSD), or schizophrenia (SZ). Stimuli were rated on a scale ranging from 1 (negative) to 4 (neutral) to 7 (positive). Judgments of the positive stimuli made by the YAL group were significantly less positive than those by the YNC group (*p < .05).
Contains emotion: Intensity ratings
No significant main effects or interactions were observed in the regression analyses for CE. Spearman correlations indicated that the MDD group’s Hamilton scores correlated with intensity of positive judgments (r = .94, p < .05) and that the PTSD group’s Hamilton scores were inversely related to judgments of the neutral stimuli (r = −1.00, p < .05). In other words, for the MDD group, higher depression scores were associated with more intensely perceived positivity in the faces, and for the PTSD group, higher depression scores were associated with less perceived neutrality.
Evaluation of Emotional Words
Factor analyses on the responses of the NC group to the word dataset were used to reduce the number of stimuli to three factors (supported by the Scree test; SAS Version 8; SAS Institute, 1998) for the KE and the CE results separately. The criterion for inclusion of a stimulus in any factor was a loading of 0.4 or more after promax rotation. Accordingly, one stimulus from the KE dataset and eight from the CE dataset were removed from the analyses. The three factors that emerged in the KE results were Negative, Neutral, and Positive. The factors in the CE analysis were observed to be grouped on the basis of the amount or degree of emotion expressed and were thus termed Strong, Neutral, and Weak. As with the analyses of the facial stimuli, these factors formed the basis of our comparisons among the various groups.
Kind of emotion: Valence ratings
The regression model based on the ratings on the Negative factor obtained from the AL and NC participants combined indicated that a significant difference existed within the responses, driven by age and education, F(3, 112) = 5.96, p < .001, d = 0.46. Specifically, older AL and NC respondents perceived words in the Negative factor to be more neutral (age, t(112) = 2.16, p < .05, d = 0.41), and participants with greater education rated words in this factor to be more negative (education, t(112) = −3.30, p < .01, d = −0.62). Comparisons among the old subgroups on this factor showed all of the subgroups to be statistically equivalent in their judgments. For the young subgroups, the regression analysis of responses to negative words was significant, F(6, 64) = 4.17, p < .01, d = 0.51. This result was driven by the PTSD group’s performance (group, t(64) = 5.84, p < .01, d = 1.46) and indicated that the PTSD patients attributed significantly less negativity to the negative stimuli than did any of the other young subgroups (see Figure 3).
Figure 3.

Mean (+ standard error of the mean) judgments of emotional valence (kind of emotion) for negative words by the young subgroups: young alcoholic participants (YAL), young normal control participants (YNC), and participants with major depressive disorder (MDD), posttraumatic stress disorder (PTSD), or schizophrenia (SZ). Stimuli were rated on a scale ranging from 1 (negative) to 4 (neutral) to 7 (positive). Judgments of the negative stimuli by the PTSD group were significantly less negative than those made by any other young subgroup (*p < .05).
Comparisons of the AL and NC groups on the Neutral factor revealed a significant group difference on this factor, F(3, 112) = 8.37, p < .001, d = 0.55; group, t(112) = 2.00, p < .05, d = 0.38; the AL group perceived neutral stimuli as more positive (see Figure 4). These results were also driven by age and education (age, t(112) = −3.81, p < .001, d = −0.72; education, t(112) = 2.64, p < .01, d = 0.50), such that older respondents ascribed more negativity to neutral words, whereas those with more education attributed more positivity to neutral words. Significant group differences in the comparisons among the old subgroups also were observed, F(5, 85) = 3.14, p = .01, d = 0.38, and were driven by differences in performances between the KS and ONC groups. The KS group attributed more positivity to the stimuli in the Neutral factor than did the ONC subgroup (see Figure 5). No differences were noted in comparisons among the young subgroups.
Figure 4.
Mean scores (+ standard error of the mean) for judgments of emotional valence (kind of emotion) for neutral words by the alcoholic (AL) and normal control (NC) groups. Stimuli were rated on a scale ranging from 1 (negative) to 4 (neutral) to 7 (positive). Judgments of the neutral stimuli by the AL group were significantly more positive than those by the NC group (*p < .05).
Figure 5.

Mean (+ standard error of the mean) judgments of emotional valence (kind of emotion) for neutral words by the old subgroups: old alcoholic participants (OAL), old normal control participants (ONC), participants with Korsakoff’s syndrome (KS), and participants with Parkinson’s disease (PD). Stimuli were rated on a scale ranging from 1 (negative) to 4 (neutral) to 7 (positive). Judgments of the neutral stimuli by the KS group were significantly more positive than those made by the ONC group (*p < .05).
In comparisons of the AL and NC groups on the Positive factor, the between-subjects group effect was not statistically significant; however, the model for this factor was significant, F(4, 111) = 2.58, p < .05, d = 0.30, consequent to the combined effects of age, education, and gender (age, t(111) = 1.87, p = .064, d = 0.35; education, t(111) = −1.85, p = .066, d = −0.35; gender, t(111) = 1.97, p = .05, d = 0.37). These results indicated a trend for older participants to attribute more positivity to the positive words, more educated respondents to attribute more negativity to the positive words, and women to ascribe greater positivity to the positive words. No significant differences were observed in comparisons among the old subgroups nor in comparisons among the young subgroups.
Contains emotion: Intensity ratings
The regression models for comparisons of the AL and NC groups, the old subgroups, and the young subgroups on the Weak emotion factor resulted in insignificant findings. On the Strong factor, the regression model for the comparison of AL and NC groups was significant, F(4, 111) = 2.99, p < .05, d = 0.33. However, the significance in this model was driven by education, indicating that differences in performance between the AL and NC groups were attributable to this characteristic alone and that those with higher education attributed more emotion to strong words. Comparisons among the young subgroups and among the old subgroups on this factor revealed no significant findings.
The regression model resulting from AL and NC ratings of stimuli in the Neutral factor was significant, F(4, 111) = 6.59, p < .001, d = 0.49. This significance was driven by the AL group’s performance, as well as by an interaction between the AL group and education, (group, t(111) = 3.30, p < .01, d = 0.63; Group × Education, t(111) = −3.29, p < .01, d = −0.62), indicating that the AL group perceived significantly more emotion in the neutral words than the NC group (see Figure 6); however, this effect decreased with an increase in the education level of the AL participants. In the comparisons among the old subgroups, the regression model was significant, F(5, 84) = 5.08, p < .001, d = 0.49 (education, t(84) = 4.55, p < .05, d = .47; group, t(84) = 2.79, p < .05, d = 0.36), and driven by the performance of the KS patients, who attributed more emotion than did the OAL and ONC subgroups to the stimuli in this Neutral factor (see Figure 7). In analyses of the young subgroup’s responses, significant differences among the groups’ ratings were noted, F(6, 65) = 3.20, p < .01, d = 0.44; group, t(65) = 4.64, p < .01, d = 0.53. The MDD group attributed significantly more emotion to neutral words than did the YNC or PTSD groups (see Figure 8). The SZ group attributed significantly more emotion to the neutral words than did the YAL, YNC, or PTSD groups (see Figure 8).
Figure 6.
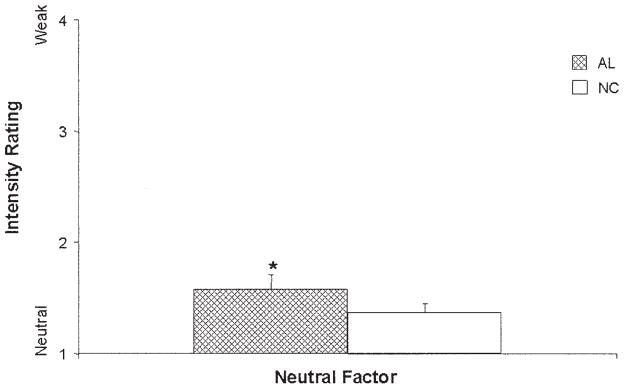
Mean (+ standard error of the mean) judgments of the intensity of emotions (contains emotion) for neutral words by the alcoholic (AL) and normal control (NC) groups. Stimuli were rated for intensity on a scale ranging from 1 (no emotion) to 4 (medium) to 7 (high). Judgments of the neutral words by the AL group were significantly more positive than those by the NC group (*p < .05).
Figure 7.

Mean (+ standard error of the mean) judgments of the intensity of emotion (contains emotion) for neutral words by the old subgroups: old alcoholic participants (OAL), old normal control participants (ONC), participants with Korsakoff’s syndrome (KS), and participants with Parkinson’s disease (PD). Stimuli were rated for intensity on a scale ranging from 1 (no emotion) to 4 (medium) to 7 (high). Judgments of the neutral words by the KS group were significantly more positive than those made by the OAL and ONC groups (*p < .05).
Figure 8.
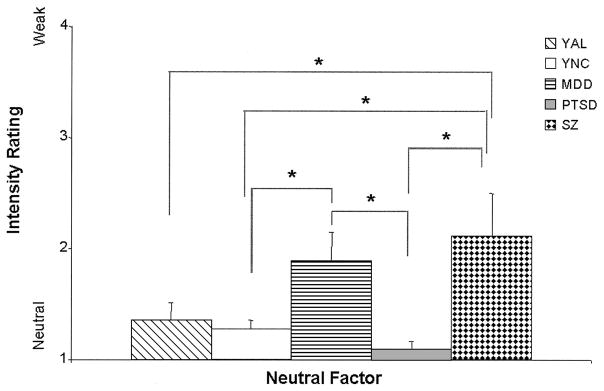
Mean (+ standard error of the mean) judgments of the intensity of emotion (contains emotion) for neutral words by the young subgroups: young alcoholic participants (YAL), young normal control participants (YNC), and participants with major depressive disorder (MDD), posttraumatic stress disorder (PTSD), or schizophrenia (SZ). Stimuli were rated on level of intensity on a scale ranging from 1 (no emotion) to 4 (medium) to 7 (high). Judgments of the neutral words by the MDD group were significantly higher than those by the YNC and PTSD groups (*p < .05), and the SZ group attributed significantly more emotion to the neutral words than did the YAL, YNC, or PTSD groups (*p < .05).
Discussion
The present study sought to differentiate the abnormal affective judgments of individuals with alcoholism from those of patients with diverse pathologies by comparing emotional perceptions of AL individuals (with and without KS) with those of NC participants and four additional groups of individuals with known neurological or psychiatric dysfunctions: those with PD, SZ, MDD, and PTSD. In doing so, we were able to examine three hypotheses relating to the neuropathological impact of alcoholism: premature aging, hemispheric laterality, and the involvement of frontosubcortical and limbic system circuits. Our results confirmed other findings that alcoholic individuals display abnormalities in their perceptions of facial and linguistic emotional stimuli (e.g., Howard et al., 2003; Monnot et al., 2001; Oscar-Berman et al., 1990; Philippot et al., 1999). We found that AL participants differed from NC participants on valence ratings of positive facial stimuli, negative facial stimuli, and neutral words and on intensity ratings of words having low emotional content (see Table 3 for a summary of findings). In general, the alcoholic patients’ profile of emotional judgments most resembled that of the MDD group. Our results also confirmed that some differences between AL and NC groups were driven by age (Hutner & Oscar-Berman, 1996; Noonberg et al., 1985; Oscar-Berman, 2000). In the following sections, we discuss our findings as they relate to (a) the possible synergistic neurodegenerative effects associated with alcoholism and aging, (b) the vulnerability of right hemispheric functions to alcoholism, and (c) the involvement of brain circuits contributing to emotional changes in neurobehavioral disorders. That discussion will be followed by a brief comment on the influence of gender and education on the emotional ratings of our participants.
Alcoholism and Aging
Investigators concerned with neuropsychological changes in alcoholic individuals frequently make reference to the large body of work on the neuropsychology of aging. Anatomically, the neuropathological changes seen in aging are similar to those associated with alcoholism (Courville, 1966; Wilkinson & Carlen, 1982). In normal chronological aging, as in alcoholism, loss of cerebral white matter may be more prolific than that of gray matter (Jernigan et al., 2001). Additionally, the greatest cortical loss and white matter changes can be found in the frontal lobes (Oscar-Berman & Marinkovic, 2003). Whereas Jernigan et al. (2001) did not report any changes in the amygdala related to aging, other investigators have found amygdala involvement (e.g., Mu, Xie, Wen, Weng, & Shuyun, 1999). In older adults (Albert & Knoefel, 1994; Jenike, 1988), as in individuals with alcoholism (Grant & Harford, 1995), affective changes frequently occur, with depression and apathy being common symptoms. Abnormalities in the ability to recognize emotional facial expressions (Calder et al., 2003; Oscar-Berman et al., 1990), and differential activation patterns in response to these expressions (Iidaka et al., 2002), also have been reported in older adults. Thus, an accumulation of evidence appears to suggest the possible involvement of frontal and limbic brain systems in the abnormal processing of facial affect that is seen in alcoholism, as well as in aging.
The synergistic effects of alcoholism and aging have long been debated, and two main models of the premature aging hypothesis of alcoholism (Ellis & Oscar-Berman, 1989; Noonberg et al., 1985; Oscar-Berman & Schendan, 2000; Parsons et al., 1987) have been introduced: the age sensitivity (or increased vulnerability) model and the accelerated aging model. The age sensitivity model suggests that older adults suffer greater impairments after consuming excessive quantities of alcohol than do their younger counterparts due to brain changes associated with aging, which make older adults vulnerable to neurodegenerative effects of chronic alcoholism (Ellis & Oscar-Berman, 1989; Mulinga, 1999). As such, one would expect that younger alcoholic individuals would not differ significantly from younger nonalcoholic persons on measures of affect ratings, whereas older alcoholics would be expected to differ from older nonalcoholic individuals on such measures. Consequently, the age sensitivity model dictates that alcoholic/nonalcoholic group differences are driven by age. In vivo neuroimaging evidence (Pfefferbaum et al., 1997; Sullivan, 2000) and, to a lesser extent, behavioral evidence (Oscar-Berman, 2000) for synergistic effects of alcoholism and aging has provided support for the age sensitivity model. The accelerated aging model presupposes that alcoholism induces precocious or accelerated aging, that is, that aging speeds up. With continued drinking, those with chronic alcoholism continue to undergo hastened aging processes into later life. Thus, the accelerated aging hypothesis predicts that young alcoholic individuals and young control participants would show different affective ratings on our measures, as would older alcoholic individuals and their older nonalcoholic counterparts.
In the present study, our analyses yielded several comparisons indicating that group differences were partly driven by age. Older AL and NC raters, regardless of diagnostic category, showed a tendency to categorize negative words as more neutral and positive words as more positive. In addition, older raters across diagnostic categories tended to evaluate neutral faces as more positive. With the exception of the finding that older AL and NC participants rated neutral words as more negative, we observed a general tendency for older participants to perceive less negativity in stimuli. This trend may be related to findings showing that older adults tend to experience less negative affect as they age (e.g., Gross et al., 1997; Mroczek, 2001) and, as such, could then also perceive less negativity in stimuli.
In addition to the impact of aging on the participants’ ratings, evidence from the present study also provides some support for the view that alcoholism and aging act synergistically to influence judgments of emotional stimuli. That is, our comparisons of the AL group with the NC group not only showed significant group differences on ratings of valence and intensity of neutral words, but importantly, they showed that the AL participants also perceived the valence of negative facial stimuli to be more neutral as a function of age (Figure 1). These latter results lend support to the existence of age-related vulnerabilities in conjunction with alcoholism, in that we observed differences in the AL group’s emotional ratings that were driven by age. In addition, we found that the YAL subgroup displayed differences in comparison with the YNC subgroup on ratings of valence for positive emotional stimuli; the YAL subgroup judged positive faces to be more positive than did the YNC subgroup. In sum, these findings offer behavioral evidence of the development of age-related changes associated with alcoholism that are in line with the accelerated aging model of the premature aging hypothesis (Noonberg et al., 1985).
Our findings also support the view that KS patients’ abnormalities are not exaggerated with aging (Oscar-Berman & Evert, 1997; Wilkinson & Carlen, 1982). The KS group rated the intensity of neutral words as significantly more emotional than did the ONC and OAL comparison subgroups. Like non-Korsakoff’s alcoholics, however, the KS group also perceived the valence of neutral words to be significantly more positive than did the nonalcoholic control group. Presumably, KS patients already have suffered maximal damage to frontosubcortical and limbic systems, such that age-related cortical cell loss becomes functionally irrelevant (Oscar-Berman, Kirkley, Gansler, & Couture, 2004; Wilkinson & Carlen, 1982). In any case, the KS group’s deficits in emotional judgment were not unexpected, because the brain regions damaged by the disorder are important for normal affective functioning.
Alcoholism and the Right Hemisphere
Research concerning the processing of affective stimuli in healthy individuals has resulted in the prevailing but far from unanimous view that the left hemisphere is attuned to positive emotions, whereas the right hemisphere is more proficient in processing negative stimuli (Adolphs et al., 2001; for reviews see Borod, 2000; Heilman & Valenstein, 1993; Hugdahl & Davidson, 2004; Silberman & Weingartner, 1986). Further supporting this notion are reports that damage to the right hemisphere leaves people unduly indifferent to negative concerns, whereas left-hemisphere damage frequently leads to a catastrophic attitude (Narushima, Kosier, & Robinson, 2003); however, some have questioned the justification of this proposition (Aben et al., 2001; Carson et al., 2000).
Investigations into the neuropsychology of alcoholism have suggested that functions subserved by the right hemisphere are more adversely affected by alcoholism than those carried out by left-hemisphere functions. Although this notion is derived primarily from observations that visuospatial deficits in those with alcoholism can be detected (Ellis & Oscar-Berman, 1989; Oscar-Berman & Schendan, 2000), given the nature of alcoholic individuals’ emotion recognition difficulties, the right hemisphere hypothesis remains plausible. However, the development of a hemisphere-specific deficit in alcoholism has been questioned (Ellis & Oscar-Berman, 1989; Oscar-Berman, 1988, 1992; Oscar-Berman & Schendan, 2000). Although the specific hemispheric contributions to the processing of emotional stimuli of different valences are somewhat debatable, it is generally accepted that the right hemisphere is more involved with the processing of visuo-spatial and emotional stimuli, whereas the left hemisphere is preferentially active in the processing of linguistic materials. Although the right hemisphere may be involved in the processing of emotional words, faces, and prosody (e.g., Borod, Zgaljardic, Tabert, & Koff, 2001; Cicero et al., 1999), left-hemispheric involvement is implicated in the processing of emotional words. Some have shown that although emotional processing of facial and prosodic stimuli appears to involve the right hemisphere, a purely right-hemisphere hypothesis of emotional perception of lexical material is equivocal (Borod et al., 2001). Further, studies of emotional perception of linguistic material have suggested that it can be difficult to parse emotional from verbal aspects of the task (Borod, Bloom, & Hayward, 1998). Thus, perception of emotional words can be conceptualized as being shared between both left and right hemispheres and thereby requiring more left-hemispheric activation than is required by a facial emotion perception task. Hence, our use of the two classes of stimuli—pictures of faces and words—allowed us to investigate abnormalities in emotional perceptions that may arise specific to each type of stimuli.
We observed that AL participants had deficits in identifying the valence of both facial and linguistic materials. In comparisons between the AL and NC groups on ratings of the valence of emotional stimuli, we observed that the AL group displayed abnormalities in rating negative faces and neutral words. For faces, the AL group ascribed less negativity to negative faces as a function of age. In rating the valence of neutral words, the AL group perceived these stimuli as more positive than did the NC group. Additionally, the AL and NC groups differed in their ratings of the intensity of neutral words, as the AL group perceived these words to be more emotional. These findings support a bi-hemispheric origin of abnormal alcoholism-related emotional perceptions.
Emotional Changes in the Neurobehavioral Disorders
Neuroanatomical studies of alcoholic individuals indicate that many of the neuropathological changes associated with long-term alcoholism occur in regions that are responsible for the recognition and interpretation of affective stimuli. Neural activation related to facial emotion recognition is thought to vary depending on the emotion being analyzed (Sprengelmeyer, Rausch, Eysel, & Przuntek, 1998), but in general, this capacity is believed to involve activation of frontal cortices, which are particularly involved in the final processing of emotional stimuli, as well as the anterior cingulate, insula, amygdala, and basal ganglia (Adolphs, 2002; Hornak, Rolls, & Wade, 1996; Luan Phan, Wager, Taylor, & Liberzon, 2002). Neuronal loss and consequently brain atrophy are noted effects of long-term alcoholism (Kril, Halliday, Svoboda, & Cartwright, 1997), most notably frontal association cortex (Kril et al., 1997), limbic system structures (see Harper, 1998; Sullivan, Marsh, Mathalon, Lim, & Pfefferbaum, 1995), and the cerebellum (Sullivan, Deshmukh, Desmond, Lim, & Pfefferbaum, 2000).
Our final hypothesis dealt with the performances of the various participant groups and posited a different behavioral profile for the AL group compared with the NC group and the other patient groups. Similarly, we anticipated that we would find disparate affective abnormalities among the patient groups. As expected, the AL participants differed from NC participants on several measures: valence judgments of negative facial stimuli and neutral words and intensity ratings of words having low emotional content. In addition, the YAL subgroup differed from the YNC subgroup on valence judgments of positive facial stimuli. The KS patients differed from the ONC subgroup on valence ratings of neutral words, and they also differed from the OAL and ONC subgroups on intensity ratings of words with low emotional content. We also noted that among the older subgroups, only in the PD patients were depression scores correlated with perceived negativity of negative faces. Among the younger subgroups, the PTSD participants differed from YAL, YNC, SZ, and MDD subgroups on ratings of the valence of negative words, and the PTSD group’s depression scores were inversely correlated with their judgments of the intensity of neutral faces. The MDD group rated the intensity of words with low emotional content differently from the YNC and PTSD subgroups, whereas the SZ group rated these stimuli differently from YAL, YNC, and PTSD groups.
In contrast to our expectations, age-equivalent YAL and MDD subgroups did not differ in their ratings of the emotional stimuli used in our study. Perhaps these two groups have similar emotional decoding deficits, and the neuropathological changes in regions involved in the judgments of affective stimuli by the two groups may be similar. However, we also compared the groups on Hamilton Depression Scale scores, and found that the MDD subgroup was significantly more depressed than the YAL subgroup (and the YNC, PTSD, and SZ subgroups). When we further examined the correlations between Hamilton scores and performance on our emotional tasks, we found that the MDD group’s depression scores correlated only with the intensity with which they perceived positive facial expressions. In other words, with increased depression scores, MDD patients perceived positive faces to be more positive, but this was not a significant factor for the YAL participants (nor for any other group). It appears, therefore, that commonalities related to depression and depressed affect alone were not the sole reasons for the lack of difference between the ratings of AL and MDD participants. Moreover, there was no evidence in our study to support the notion that similarities in depressive symptoms can account for the similarities in judgments among these groups.
Neural disruptions associated with the development of MDD have not been fully elucidated, but it is generally thought that frontal and subcortical regions are disrupted (for review see Soares & Mann, 1997). Studies utilizing structural neuroimaging methods have revealed volume reductions in the prefrontal cortex in patients with MDD (Coffey et al., 1993; Goodwin et al., 1997), as well as in orbitofrontal regions (Bremner et al., 2002), the hippocampus (Bremner et al., 2000; Sheline, Sanghavi, Mintun, & Gado, 1999), the caudate nucleus (Krishnan et al., 1992), the putamen (Husain et al., 1991), and the amygdala (Sheline, Gado, & Price, 1998). Abnormalities of the right hemisphere have also been implicated in MDD, and although this concept is not unequivocally supported (e.g., Carson et al., 2000), many studies have reported that MDD is associated with a functional disruption of the right hemisphere (for reviews, see Rotenberg, 2004; Shenal, Harrison, & Demaree, 2003). However, abnormalities specific to the left hemisphere also have been noted. Research in patients with stroke-related mood disorders suggests that lesions of the left basal ganglia may be related to increased severity of depressive symptoms (Starkstein, Robinson, Berthier, Parikh, & Price, 1988). In AL patients, volumes of gray and white matter are significantly reduced. Regions known to be affected by chronic alcoholism include the frontal and temporal cortex (Kril et al., 1997; Sullivan, Marsh, Mathalon, Lim, & Pfefferbaum, 1996), corpus callosum (Estruch et al., 1997; Pfefferbaum, Lim, Desmond, & Sullivan, 1996), hippocampus (Sullivan et al., 1995), diencephalon (Sullivan, Rosenbloom, Serventi, Deshmukh, & Pfefferbaum, 2003), caudate and putamen (Sullivan, Deshmukh, De Rosa, Rosen-bloom, & Pfefferbaum, 2005), and cerebellum (Sullivan et al., 2000). It is plausible that similar regions of neuropathology overlap in the AL and MDD groups, resulting in abnormal emotional changes common to both disorders.
A Comment on Gender and Education
Our findings provided evidence that women had a tendency to attribute greater positive affect to positive facial and word stimuli than did men. Such findings are consistent with those showing that, compared with men, women tend to rate facial expressions as being more strongly representative of the emotion being expressed (Hall & Matsumoto, 2004). These researchers hypothesized that women, being more adept in identifying emotions than men (Hall, Carter, & Horgan, 2000; Thayer & Johnsen, 2000), may have more easily ascertained the expressed emotion and may have been more confident in their perceptions. These researchers further posited that higher levels of confidence may have led women to attribute more intense (and more precise) emotional ratings to the faces than did men, who may have preferred to rate the images with caution. In the present study, however, we saw no gender-related differences in judgments of negative stimuli.
The impact of education was less clearly indicated in our study. In some comparisons, more years of education were associated with increased intensity of emotional ratings (e.g., comparisons of the old subgroup on KE ratings of negative faces, young subgroup on KE ratings of positive faces, and AL–NC comparisons of KE ratings of negative words), whereas in other comparisons, higher education was associated with less extreme ratings of stimuli characteristics (e.g., KE ratings of positive words made by AL and NC participants). This would suggest that our findings are somewhat limited in their ability to speak to the influence of education on emotional judgments. Nevertheless, an overall trend was observed in which higher education levels were associated with more extreme ratings of emotional stimuli. One reason for this trend may be that participants with greater education levels possessed better developed emotional concepts, given that lower rates of alexithymia, a trait associated with compromised emotion identification abilities, have been associated with higher education levels (Honkalampi, Saarinen, Hintikka, Virtanen, & Viinamäki, 1999). If this finding can be extrapolated to the participants in our study, one can posit that those participants with higher education levels may have been less conservative in their ratings as a result of being more confident in their perceptions and, therefore, rated the stimuli in a slightly more extreme manner.
Conclusions
Our findings are consistent with prior results that have identified changes in affect recognition abilities resulting from alcoholism. We also observed synergistic effects of alcoholism and aging that are consistent with the view that some neuropathological changes in association with alcoholism not only may begin early in the onset of the disorder but are compounded later in life by the effects of chronological aging. Our results further indicated that alcoholism-related changes impact emotional processes that may involve both the right and the left hemispheres, given that we observed abnormal ratings of both facial and word stimuli. As such, our results support the view that the neuropathological impact of alcoholism is bi-hemispheric. Finally, comparisons of the emotional ratings by the AL group with the four other patient groups support the view that long-term chronic alcoholism is associated with disruptions of frontal and subcortical regions, and further, that these disruptions are likely responsible for many changes in emotional perception associated with alcoholism. Although a more refined analysis of the specific areas within these regions that contribute to the observed affective changes is not possible given our methodologies, the accumulation of evidence suggests that limbic regions, basal ganglia structures, and frontal cortices are involved.
Acknowledgments
This research was supported by funds from the U.S. Department of Health and Human Services, National Institute on Alcohol Abuse and Alcoholism (R37-AA07112 and K05-AA00219) and the Medical Research Service of the U.S. Department of Veterans Affairs to Marlene Oscar-Berman. Funding was provided by the U.S. Department of Health and Human Services, Substance Abuse and Mental Health Services Administration (T06 SM13833) to Uraina S. Clark. We thank Gail Greenberg for her helpful insights and comments.
Appendix A. An Example of the Stimuli That Were Utilized in the Judgments of Facial Stimuli
Figure A1.

The chart shows the format used for judgments of intensity. Facial stimuli are from Quinn (1990) and Jankowski (1992–1995).
Appendix B. An Example of the Stimuli That Were Utilized in the Judgments of Word Stimuli
Figure B1.

The chart shows the format used for judgments of intensity. Verbal stimuli were chosen on the basis of Hutner and Oscar-Berman (1996) from a list compiled by Paivio, Yuille, and Madigan (1996).
Contributor Information
Uraina S. Clark, Boston University
Marlene Oscar-Berman, Boston University School of Medicine and U.S. Department of Veterans Affairs Healthcare System, Boston Campus.
Barbara Shagrin, U.S. Department of Veterans Affairs Healthcare System, Boston Campus.
Michael Pencina, Boston University.
References
- Aben I, Verhey F, Honig A, Lodder J, Lousberg R, Maes M. Research into the specificity of depression after stroke: A review on an unresolved issue. Progress in Neuro-Psychopharmacology & Biological Psychiatry. 2001;25:671–689. doi: 10.1016/s0278-5846(01)00158-0. [DOI] [PubMed] [Google Scholar]
- Adolphs R. Neural systems for recognizing emotion. Current Opinions in Neurobiology. 2002;12:169–177. doi: 10.1016/s0959-4388(02)00301-x. [DOI] [PubMed] [Google Scholar]
- Adolphs R, Jansari A, Tranel D. Hemispheric perception of emotional valence from facial expressions. Neuropsychology. 2001;15:516–524. [PubMed] [Google Scholar]
- Albert ML, Knoefel JE. Clinical neurology of aging. 2. New York: Oxford University Press; 1994. [Google Scholar]
- American Psychiatric Association. Diagnostic and statistical manual of mental disorders. 4. Washington, DC: Author; 1994. [Google Scholar]
- Borod JC, editor. The neuropsychology of emotion. New York: Oxford University Press; 2000. [Google Scholar]
- Borod JC, Bloom R, Hayward CS. Verbal aspects of emotional communication. In: Beeman M, Chiarello C, editors. Right hemisphere language comprehension: Perspectives from cognitive neuroscience. Hillsdale, NJ: Erlbaum; 1998. pp. 285–307. [Google Scholar]
- Borod JC, Zgaljardic DJ, Tabert M, Koff E. Asymmetries of emotional communication in normal adults. In: Boller F, Grafman J, Gainotti G, editors. Handbook of neuropsychology: Emotional behavior and its disorders. Oxford, England: Elsevier; 2001. pp. 181–205. [Google Scholar]
- Bowirrat A, Oscar-Berman M. Relationship between dopaminergic neurotransmission, alcoholism, and reward deficiency syndrome. American Journal of Medical Genetics: Neuropsychiatric Genetics. 2005;132B:29–37. doi: 10.1002/ajmg.b.30080. [DOI] [PubMed] [Google Scholar]
- Bremner JD, Narayan M, Anderson ER, Staib LH, Miller HL, Charney DS. Hippocampal volume reduction in major depression. American Journal of Psychiatry. 2000;157:115–118. doi: 10.1176/ajp.157.1.115. [DOI] [PubMed] [Google Scholar]
- Bremner JD, Vythilingam M, Vermetten E, Nazeer A, Adil J, Khan S, et al. Reduced volume of orbitofrontal cortex in major depression. Biological Psychiatry. 2002;51:273–279. doi: 10.1016/s0006-3223(01)01336-1. [DOI] [PubMed] [Google Scholar]
- Calder AJ, Keane J, Manly T, Sprengelmeyer R, Scott S, Nimmo-Smith IW, et al. Facial expression recognition across the adult life span. Neuropsychologia. 2003;41:195–202. doi: 10.1016/s0028-3932(02)00149-5. [DOI] [PubMed] [Google Scholar]
- Carson AJ, MacHale S, Allen K, Lawrie SM, Dennis M, House A, et al. Depression after stroke and lesion location: A systematic review. Lancet. 2000;356:122–126. doi: 10.1016/S0140-6736(00)02448-X. [DOI] [PubMed] [Google Scholar]
- Cicero BA, Borod JC, Santschi C, Erhan HM, Obler LK, Agosti RM, et al. Emotional versus nonemotional lexical perception in patients with right and left brain damage. Neuropsychiatry, Neuropsychology, and Behavioral Neurology. 1999;12:255–264. [PubMed] [Google Scholar]
- Coffey CE, Wilkinson WE, Weiner RD, Parashos IA, Djang WT, Webb MC, et al. Quantitative cerebral anatomy in depression: A controlled magnetic resonance imaging study. Archives of General Psychiatry. 1993;50:7–16. doi: 10.1001/archpsyc.1993.01820130009002. [DOI] [PubMed] [Google Scholar]
- Courville CB. Effects of alcohol on the nervous system of man. Los Angeles: San Lucas Press; 1966. [Google Scholar]
- Cureton EE, D’Agostino RB. Factor analysis: An applied approach. Hillsdale, NJ: Erlbaum; 1983. [Google Scholar]
- Devilly GJ. ClinTools Software for Windows: Version 3.5 [computer program] Melbourne, Australia: Brain Sciences Institute, Swinburne University, and Psytek; 2005. [Google Scholar]
- Dujardin K, Blairy S, Defebvre L, Duhem S, Noel Y, Hess U, et al. Deficits in decoding emotional facial expressions in Parkinson’s disease. Neuropsychologia. 2004;42:239–250. doi: 10.1016/s0028-3932(03)00154-4. [DOI] [PubMed] [Google Scholar]
- Ellis RJ, Oscar-Berman M. Alcoholism, aging, and functional cerebral asymmetries. Psychological Bulletin. 1989;106:128–147. doi: 10.1037/0033-2909.106.1.128. [DOI] [PubMed] [Google Scholar]
- Estruch R, Nicolas JM, Salamero M, Aragon C, Sacanella E, Fernandez-Sola J, et al. Atrophy of the corpus callosum in chronic alcoholism. Journal of Neurological Sciences. 1997;146:145–151. doi: 10.1016/s0022-510x(96)00298-5. [DOI] [PubMed] [Google Scholar]
- Goodwin GM, Cavanagh JT, Glabus MF, Kehoe RF, O’Carroll RE, Ebmeier KP. Uptake of 99 mTc-exametazime shown by single photon emission computed tomography before and after lithium withdrawal in bipolar patients: Associations with mania. British Journal of Psychiatry. 1997;170:426– 430. doi: 10.1192/bjp.170.5.426. [DOI] [PubMed] [Google Scholar]
- Grant BF, Harford TC. Comorbidity between DSM–IV alcohol use disorders and major depression: Results of a national survey. Drug and Alcohol Dependence. 1995:197–206. doi: 10.1016/0376-8716(95)01160-4. [DOI] [PubMed] [Google Scholar]
- Gross JJ, Carstensen LL, Pasupathi M, Tsai J, Skorpen CG, Hsu AY. Psychology and Aging. 1997;12:590–599. doi: 10.1037//0882-7974.12.4.590. [DOI] [PubMed] [Google Scholar]
- Hale WW., III Judgment of facial expressions and depression persistence. Psychiatry Research. 1998;80:265–274. doi: 10.1016/s0165-1781(98)00070-5. [DOI] [PubMed] [Google Scholar]
- Hall JA, Carter JD, Horgan TG. Gender differences in the nonverbal communication of emotion. In: Fischer AH, editor. Gender and emotion: Social psychological perspectives. Paris: Cambridge University Press; 2000. pp. 97–117. [Google Scholar]
- Hall JA, Matsumoto D. Gender differences in judgments of multiple emotions from facial expressions. Emotion. 2004;4:201–206. doi: 10.1037/1528-3542.4.2.201. [DOI] [PubMed] [Google Scholar]
- Hamilton MA. A rating scale for depression. Journal of Neurology, Neurosurgery, and Psychiatry. 1960;23:56– 62. doi: 10.1136/jnnp.23.1.56. [DOI] [PMC free article] [PubMed] [Google Scholar]
- Harper C. The neuropathology of alcohol-specific brain damage, or does alcohol damage the brain? Journal of Neuropathology and Experimental Neurology. 1998;57:101–110. doi: 10.1097/00005072-199802000-00001. [DOI] [PubMed] [Google Scholar]
- Heilman KM, Valenstein E, editors. Clinical neuropsychology. New York: Oxford University Press; 1993. [Google Scholar]
- Hempel A, Hempel E, Schonknecht P, Stippich C, Schroder J. Impairment in basal limbic function in schizophrenia during affect recognition. Psychiatry Research. 2003;122:115–124. doi: 10.1016/s0925-4927(02)00126-9. [DOI] [PubMed] [Google Scholar]
- Honkalampi K, Saarinen P, Hintikka J, Virtanen V, Viinamäki H. Factors associated with alexithymia in patients suffering from depression. Psychotherapy and Psychosomatics. 1999;68:270–275. doi: 10.1159/000012343. [DOI] [PubMed] [Google Scholar]
- Hornak J, Rolls ET, Wade D. Face and voice expression identification in patients with emotional and behavioral changes following ventral frontal lobe damage. Neuropsychologia. 1996;34:247–261. doi: 10.1016/0028-3932(95)00106-9. [DOI] [PubMed] [Google Scholar]
- Howard J, Oscar-Berman M, Marinkovic K, O’Reilly C, Harris G. Affective and cognitive changes in alcoholism: Recognition of faces and words. Program No. 419.15. Abstract Viewer/Itinerary Planner; Poster presented at the annual meeting of the Society for Neuroscience; New Orleans, LA. 2003. Nov, [Google Scholar]
- Hugdahl K, Davidson RJ, editors. The asymmetrical brain. Cambridge, MA: MIT Press; 2004. [Google Scholar]
- Husain MM, McDonald WM, Doraiswamy PM, Figiel GS, Na C, Escalona PR, et al. A magnetic resonance imaging study of putamen nuclei in major depression. Psychiatry Research. 1991;40:95–99. doi: 10.1016/0925-4927(91)90001-7. [DOI] [PubMed] [Google Scholar]
- Hutner N, Oscar-Berman M. Visual laterality patterns for the perception of emotional words in alcoholic and aging individuals. Journal of Studies on Alcohol. 1996;57:144–154. doi: 10.15288/jsa.1996.57.144. [DOI] [PubMed] [Google Scholar]
- Iidaka T, Okada T, Murata T, Omori M, Kosaka H, Sadato N, et al. Age-related differences in the medial temporal lobe responses to emotional faces as revealed by fMRI. Hippocampus. 2002;12:352–362. doi: 10.1002/hipo.1113. [DOI] [PubMed] [Google Scholar]
- Jankowski J, editor. Mostly happy! Clip art of the thirties, forties and fifties. New York: Art Direction Book Company; 1992–1995. [Google Scholar]
- Jenike M. Depression and other psychiatric disorders. In: Albert MS, Moss MB, editors. Geriatric neuropsychology. New York: Guilford Press; 1988. pp. 115–144. [Google Scholar]
- Jernigan TL, Archibald SL, Fennema-Notestine C, Gamst AC, Stout JC, Bonner J, et al. Effects of age on tissues and regions of the cerebrum and cerebellum. Neurobiology of Aging. 2001;22:581–594. doi: 10.1016/s0197-4580(01)00217-2. [DOI] [PubMed] [Google Scholar]
- Kornreich C, Blairy S, Philippot P, Dan B, Foisy M, Hess, et al. Impaired emotional facial expression recognition in alcoholism compared with obsessive-compulsive disorder and normal controls. Psychiatry Research. 2001;102:235–248. doi: 10.1016/s0165-1781(01)00261-x. [DOI] [PubMed] [Google Scholar]
- Kornreich C, Foisy ML, Philippot P, Dan B, Tecco J, Noel X, et al. Impaired emotional facial expression recognition in alcoholics, opiate dependence subjects, methadone-maintained subjects and mixed alcohol-opiate antecedents subjects compared with normal controls. Psychiatry Research. 2003;119:251–260. doi: 10.1016/s0165-1781(03)00130-6. [DOI] [PubMed] [Google Scholar]
- Kornreich C, Philippot P, Foisy ML, Blairy S, Raynaud E, Dan B, et al. Impaired emotional facial expression recognition is associated with interpersonal problems in alcoholism. Alcohol & Alcoholism. 2002;37:394– 400. doi: 10.1093/alcalc/37.4.394. [DOI] [PubMed] [Google Scholar]
- Kril JJ, Halliday GM, Svoboda MD, Cartwright H. The cerebral cortex is damaged in chronic alcoholics. Neuroscience. 1997;79:983–998. doi: 10.1016/s0306-4522(97)00083-3. [DOI] [PubMed] [Google Scholar]
- Krishnan KR, McDonald WM, Escalona PR, Doraiswamy PM, Na C, Husain MM, et al. Magnetic resonance imaging of the caudate nuclei in depression. Preliminary observations. Archives of General Psychiatry. 1992;49:553–557. doi: 10.1001/archpsyc.1992.01820070047007. [DOI] [PubMed] [Google Scholar]
- Kubota M, Nakazaki S, Hirai S, Saeki N, Yamamura A, Kusaka T. Alcohol consumption and frontal lobe shrinkage: Study of 1432 non-alcoholic subjects. Journal of Neurology, Neurosurgery, and Psychiatry. 2001;71:104–106. doi: 10.1136/jnnp.71.1.104. [DOI] [PMC free article] [PubMed] [Google Scholar]
- Lawrence NS, Williams AM, Surguladze S, Giampietro V, Brammer MJ, Andrew C, et al. Subcortical and ventral prefrontal cortical neural responses to facial expressions distinguish patients with bipolar disorder and major depression. Biological Psychiatry. 2004;55:578–587. doi: 10.1016/j.biopsych.2003.11.017. [DOI] [PubMed] [Google Scholar]
- Luan Phan KL, Wager T, Taylor SF, Liberzon I. Functional neuroanatomy of emotion: A meta-analysis of emotion activation studies in PET and fMRI. Neuroimage. 2002;16:331–348. doi: 10.1006/nimg.2002.1087. [DOI] [PubMed] [Google Scholar]
- Mandal MK, Pandey R, Prasad AB. Facial expressions of emotions and schizophrenia: A review. Schizophrenia Bulletin. 1998;24:399–412. doi: 10.1093/oxfordjournals.schbul.a033335. [DOI] [PubMed] [Google Scholar]
- Mikhailova ES, Vladimirova TV, Iznak AF, Tsusulkovskaya EJ, Sushko NV. Abnormal recognition of facial expression of emotions in depressed patients with major depression disorder and schizotypal personality disorder. Biological Psychiatry. 1996;40:697–705. doi: 10.1016/0006-3223(96)00032-7. [DOI] [PubMed] [Google Scholar]
- Monnot M, Nixon SJ, Lovallo W, Ross E. Altered emotional perception in alcoholics: Deficits in affective prosody comprehension. Alcoholism: Clinical and Experimental Research. 2001;25:362–369. [PubMed] [Google Scholar]
- Moselhy HF, Georgiou G, Kahn A. Frontal lobe changes in alcoholism: A review of the literature. Alcohol and Alcoholism. 2001;36:357–368. doi: 10.1093/alcalc/36.5.357. [DOI] [PubMed] [Google Scholar]
- Mroczek DK. Age and emotion in adulthood. Current Directions in Psychological Science. 2001;10:87–90. [Google Scholar]
- Mu Q, Xie J, Wen Z, Weng Y, Shuyun Z. A quantitative MR study of the hippocampal formation, the amygdala, and the temporal horn of the lateral ventricle in healthy subjects 40 to 90 years of age. American Journal of Neuroradiology. 1999;20:207–211. [PMC free article] [PubMed] [Google Scholar]
- Mulinga JD. Elderly people with alcohol-related problems: Where do they go? International Journal of Geriatric Psychiatry. 1999;14:564–566. [PubMed] [Google Scholar]
- Narushima K, Kosier JT, Robinson RG. A reappraisal of poststroke depression, intra- and inter-hemispheric lesion location using meta-analysis. Journal of Neuropsychiatry & Clinical Neurosciences. 2003;15:422– 430. doi: 10.1176/jnp.15.4.422. [DOI] [PubMed] [Google Scholar]
- National Institute of Alcohol Abuse and Alcoholism. NIAAA Ninth Special Report to the U.S. Congress on Alcohol and Health. Bethesda, MD: Author; 1997. [Google Scholar]
- Noonberg A, Goldstein G, Page HA. Premature aging in male alcoholics: “Accelerated aging” or “increased vulnerability”? Alcoholism: Clinical and Experimental Research. 1985;9:334–338. doi: 10.1111/j.1530-0277.1985.tb05555.x. [DOI] [PubMed] [Google Scholar]
- Oscar-Berman M. Normal functional asymmetries in alcoholism? Aphasiology. 1988;2:369–374. [Google Scholar]
- Oscar-Berman M. The contributions of emotional and motivational abnormalities to cognitive deficits in alcoholism and aging. In: Squire LR, Butters N, editors. Neuropsychology of memory. New York: Guilford Press; 1992. pp. 81–94. [Google Scholar]
- Oscar-Berman M. Neuropsychological vulnerabilities in chronic alcoholism. In: Noronha A, Eckardt MJ, Warren K, editors. Review of NIAAA’s neuroscience and behavioral research portfolio. Bethesda, MD: U.S. Department of Health and Human Services; 2000. pp. 437–471. Research Monograph No. 34. [Google Scholar]
- Oscar-Berman M, Evert D. Alcoholic Korsakoff’s syndrome. In: Nussbaum PD, editor. Handbook of neuropsychology and aging. New York: Plenum Press; 1997. pp. 201–215. [Google Scholar]
- Oscar-Berman M, Hancock M, Mildworf B, Hutner N. Emotional perception and memory in alcoholism and aging. Alcoholism: Clinical and Experimental Research. 1990;14:383–393. doi: 10.1111/j.1530-0277.1990.tb00491.x. [DOI] [PubMed] [Google Scholar]
- Oscar-Berman M, Kirkley SM, Gansler DA, Couture A. Comparisons of Korsakoff and non-Korsakoff alcoholics on neuropsychological tests of prefrontal brain functioning. Alcoholism: Clinical and Experimental Research. 2004;28:667– 675. doi: 10.1097/01.alc.0000122761.09179.b9. [DOI] [PMC free article] [PubMed] [Google Scholar]
- Oscar-Berman M, Marinkovic K. Alcoholism and the brain: An overview. Alcohol Research & Health. 2003;27:125–133. [PMC free article] [PubMed] [Google Scholar]
- Oscar-Berman M, Schendan HE. Asymmetries of brain function in alcoholism: Relationship to aging. In: Obler L, Connor LT, editors. Neurobehavior of language and cognition: Studies of normal aging and brain damage. New York: Kluwer Academic; 2000. pp. 213–240. [Google Scholar]
- Paivio A, Yuille JC, Madigan SA. Concreteness, imagery, and meaningfulness values for 925 nouns. Journal of Experimental Psychology. 1968;76:1–25. doi: 10.1037/h0025327. [DOI] [PubMed] [Google Scholar]
- Parsons OA, Butters N, Nathan P, editors. Neuropsychology of Alcoholism: Implications for diagnosis and treatment. New York: Guilford Press; 1987. [Google Scholar]
- Persad SM, Polivy J. Differences between depressed and nondepressed individuals in the recognition of and response to facial emotional cues. Journal of Abnormal Psychology. 1993;102:358–368. doi: 10.1037//0021-843x.102.3.358. [DOI] [PubMed] [Google Scholar]
- Pfefferbaum A, Lim KO, Desmond JE, Sullivan EV. Thinning of the corpus callosum in older alcoholic men: A magnetic resonance imaging study. Alcoholism: Clinical and Experimental Research. 1996;20:752–757. doi: 10.1111/j.1530-0277.1996.tb01682.x. [DOI] [PubMed] [Google Scholar]
- Pfefferbaum A, Sullivan EV, Mathalon DH, Lim KO. Frontal lobe volume loss observed with magnetic resonance imaging in older chronic alcoholics. Alcoholism: Clinical and Experimental Research. 1997;21:521–529. doi: 10.1111/j.1530-0277.1997.tb03798.x. [DOI] [PubMed] [Google Scholar]
- Philippot P, Kornreich C, Blairy S, Baert I, Den Dulk A, Le Bon O, et al. Alcoholics’ deficits in the decoding of emotional facial expression. Alcoholism: Clinical and Experimental Research. 1999;23:1031–1038. [PubMed] [Google Scholar]
- Protopopescu X, Pan H, Tuescher O, Cloitre M, Goldstein M, Engelien, et al. Differential time courses and specificity of amygdala activity in posttraumatic stress disorder subjects and normal control subjects. Biological Psychiatry. 2005;57:464–473. doi: 10.1016/j.biopsych.2004.12.026. [DOI] [PubMed] [Google Scholar]
- Quinn G, editor. The clip art book. New York: Crescent Books; 1990. [Google Scholar]
- Robins LN. Diagnostic grammar and assessment: Translating criteria into questions. Psychological Medicine. 1989;19:57– 68. doi: 10.1017/s0033291700011028. [DOI] [PubMed] [Google Scholar]
- Rotenberg VS. The peculiarity of the right-hemisphere function in depression: Solving the paradoxes. Progress in Neuro-Psychopharmacology and Biological Psychiatry. 2004;28:1–13. doi: 10.1016/S0278-5846(03)00163-5. [DOI] [PubMed] [Google Scholar]
- Rubin DC, Friendly M. Predicting which words get recalled: Measures of free recall, availability, goodness, emotionality, and pronounceability for 925 nouns. Memory & Cognition. 1986;14:79–94. doi: 10.3758/bf03209231. [DOI] [PubMed] [Google Scholar]
- Sachs G, Steger-Wuchse D, Kryspin-Exner I, Gur RC, Katschnig H. Facial recognition deficits and cognition in schizophrenia. Schizophrenia Research. 2004;68:27–35. doi: 10.1016/S0920-9964(03)00131-2. [DOI] [PubMed] [Google Scholar]
- SAS Institute. System Software, Version 8. Cary, NC: SAS Institute; 1998. [Google Scholar]
- Sheline YI, Barch DM, Donnelly JM, Ollinger JM, Snyder AZ, Mintun MA. Increased amygdala response to masked emotional faces in depressed subjects resolves with antidepressant treatment: An fMRI study. Biological Psychiatry. 2001;50:651– 658. doi: 10.1016/s0006-3223(01)01263-x. [DOI] [PubMed] [Google Scholar]
- Sheline YI, Gado MH, Price JL. Amygdala core nuclei volumes are decreased in recurrent major depression. Neuroreport. 1998;9:2023–2028. doi: 10.1097/00001756-199806220-00021. [DOI] [PubMed] [Google Scholar]
- Sheline YI, Sanghavi M, Mintun MA, Gado MH. Depression duration but not age predicts hippocampal volume loss in medically healthy women with recurrent major depression. Journal of Neuroscience. 1999;19:5034–5043. doi: 10.1523/JNEUROSCI.19-12-05034.1999. [DOI] [PMC free article] [PubMed] [Google Scholar]
- Shenal BV, Harrison DW, Demaree HA. The neuropsychology of depression: A literature review and preliminary model. Neuropsychology Review. 2003;13:33– 42. doi: 10.1023/a:1022300622902. [DOI] [PubMed] [Google Scholar]
- Shin LM, Wright CI, Cannistraro PA, Wedig MM, McMullin K, Martis B, et al. A functional magnetic resonance imaging study of amygdala and medial prefrontal cortex responses to overtly presented fearful faces in posttraumatic stress disorder. Archives of General Psychiatry. 2005;62:273–281. doi: 10.1001/archpsyc.62.3.273. [DOI] [PubMed] [Google Scholar]
- Silberman EK, Weingartner H. Hemispheric lateralization of functions related to emotion. Brain and Cognition. 1986;5:322–353. doi: 10.1016/0278-2626(86)90035-7. [DOI] [PubMed] [Google Scholar]
- Soares JC, Mann JJ. The anatomy of mood disorders –review of structural neuroimaging studies. Biological Psychiatry. 1997;41:86–106. doi: 10.1016/s0006-3223(96)00006-6. [DOI] [PubMed] [Google Scholar]
- Sprengelmeyer R, Rausch M, Eysel UT, Przuntek H. Neural structures associated with recognition of facial expressions of basic emotions. Proceedings of the Royal Society of London B. 1998;265:1927–1931. doi: 10.1098/rspb.1998.0522. [DOI] [PMC free article] [PubMed] [Google Scholar]
- Starkstein SE, Robinson RG, Berthier ML, Parikh RM, Price TR. Differential mood changes following basal ganglia vs. thalamic lesions. Archives of Neurology. 1988;45:725–730. doi: 10.1001/archneur.1988.00520310031013. [DOI] [PubMed] [Google Scholar]
- Stevens J. Multivariate Statistics for the Social Sciences. Mahwah, NJ: Lawrence Erlbaum Associates, Inc; 1996. [Google Scholar]
- Sullivan EV. Human brain vulnerability to alcoholism: Evidence from neuroimaging studies. In: Noronha A, Eckardt M, Warren K, editors. Review of NIAAA’s Neuroscience and Behavioral Research Portfolio. Bethesda, MD: 2000. pp. 473–508. NIAAAA Res. Monograph No. 34. [Google Scholar]
- Sullivan EV, Deshmukh A, De Rosa E, Rosenbloom MJ, Pfefferbaum A. Striatal and forebrain nuclei volumes: Contribution to motor function and working memory deficits in alcoholism. Biological Psychiatry. 2005;57:768–776. doi: 10.1016/j.biopsych.2004.12.012. [DOI] [PubMed] [Google Scholar]
- Sullivan EV, Deshmukh A, Desmond JE, Lim KO, Pfefferbaum A. Cerebellar volume decline in normal aging, alcoholism, and Korsakoff’s syndrome: Relation to ataxia. Neuropsychology. 2000;14:341–352. doi: 10.1037//0894-4105.14.3.341. [DOI] [PubMed] [Google Scholar]
- Sullivan EV, Marsh L, Mathalon DH, Lim KO, Pfefferbaum A. Anterior hippocampal volume deficits in nonamnesic, aging chronic alcoholics. Alcoholism: Clinical and Experimental Research. 1995;19:110–122. doi: 10.1111/j.1530-0277.1995.tb01478.x. [DOI] [PubMed] [Google Scholar]
- Sullivan EV, Marsh L, Mathalon DH, Lim KO, Pfefferbaum A. Relationship between alcohol withdrawal seizures and temporal lobe white matter volume deficits. Alcoholism: Clinical and Experimental Research. 1996;20:348–354. doi: 10.1111/j.1530-0277.1996.tb01651.x. [DOI] [PubMed] [Google Scholar]
- Sullivan EV, Rosenbloom MJ, Serventi KL, Deshmukh A, Pfefferbaum A. The effects of alcohol dependence comorbidity and anti-psychotic medication on volumes of the thalamus and pons in schizophrenia. American Journal of Psychiatry. 2003;160:1110–1116. doi: 10.1176/appi.ajp.160.6.1110. [DOI] [PubMed] [Google Scholar]
- Thayer JF, Johnsen BH. Sex differences in judgement of facial affect: A multivariate analysis of recognition errors. Scandinavian Journal of Psychology. 2000;41:243–246. doi: 10.1111/1467-9450.00193. [DOI] [PubMed] [Google Scholar]
- Townshend JM, Duka T. Mixed emotions: Alcoholics’ impairments in the recognition of specific emotional facial expressions. Neuropsychologia. 2003;41:773–782. doi: 10.1016/s0028-3932(02)00284-1. [DOI] [PubMed] [Google Scholar]
- Wechsler D. WAIS-R manual: Wechsler Adult Intelligence Scale—Revised. San Antonio, TX: Psychological Corporation; 1981. [Google Scholar]
- Wechsler D. Weschsler Adult Intelligence Scale—III. San Antonio, TX: Psychological Corporation; 1997. [Google Scholar]
- Wilkinson DA, Carlen PL. Morphological abnormalities in the brains of alcoholics: Relationship to age, psychological test scores and patient type. In: Wood WG, Elias MF, editors. Alcoholism and aging: Advances in research. Boca Raton, FL: CRC Press; 1982. pp. 61–77. [Google Scholar]