Summary
Glycosyltransferases (GTs) are a large family of enzymes that specifically transfer sugar moieties to a diverse range of substrates. The process of bacterial glycosylation (such as biosynthesis of glycolipids, glycoproteins, and polysaccharides) has been studied extensively, yet the majority of GTs involved remains poorly characterized. Besides predicting enzymatic parameters of GTs, the resolution of three-dimensional structures of GTs can help to determine activity, donor sugar binding, and acceptor substrate binding sites. It also facilitates amino acid sequence-based structural modeling and biochemical characterization of their homologues. Here we describe a general procedure to accomplish expression and purification of soluble and active recombinant GTs. Enzymatic characterization, and crystallization of GTs, and data refinement for structural analysis are also covered in this protocol.
Keywords: Glycosyltransferases, protein purification, glycosyltransferase assays, crystallization and data refinement
1. Introduction
Glycosyltransferases (GTs) are a large family of enzymes that catalyze the transfer of activated sugars to a variety of acceptor molecules; they are important in all domains of life for the biosynthesis of complex carbohydrates and glycoconjugates. Such glycosylation reactions in bacteria are crucial for many fundamental biological processes, including adhesion, signaling and cell wall biosynthesis (1). Most characterized bacterial glycoproteins are virulence factors of medically important pathogens (2). As key players of the glycosylation process, GTs are potential molecular targets in chemical biology and drug discovery. Thus, study of GTs will provide useful information to identify new targets for potential therapeutic and prophylactic measures.
Primary amino acid sequences have been used to predict and classify GTs (3). Some operationally simple bioassays have been developed to determine enzymatic activity in the past few years (4), however many putative GTs remain uncharacterized since the number of predicated GTs are enormous. Few structural studies have been reported for this large family of enzymes. Only limited numbers of 3D structures from different GT families have been documented. Among these GTs, some catalyze the synthesis of secondary metabolites (5) and others mediate biogenesis of bacterial cell walls or polysaccharides (6, 7). Several studies reported structures of bacterial GTs that are involved in protein glycosylation. Other than predicting the enzymatic parameters, the resolved high-resolution 3-D structure can be used to determine activity of GTs, donor sugar binding, and substrate binding sites and facilitate amino acid sequence-based structure and functional analysis.
Serine-rich repeat glycoproteins (SRRPs) are a growing family of bacterial adhesins found in many streptococci, staphylococci and other Gram-positive bacteria (2). They have been shown to play important roles in bacterial biofilm formation and pathogenesis (8). Glycosylation of this family of adhesins is essential for their biogenesis. A number of glycosyltransferases has been implicated in glycosylation of Fap1, a SRRP from an oral streptococcus, Streptococcus parasanguinis. Glycosylation of Fap1 is initiated by transferring GlcNAc residues to the Fap1 polypeptide by a two enzyme complex Gtf1 and Gtf2 (9,10). A glucosyltransferase (Gtf3) catalyzes the second step of glycosylation of Fap1. Here we use Gtf3 (8, 10) as an example to describe a general procedure to express and purify large quantities of active recombinant GTs for protein crystallization, and structural data refinement.
2. Materials
Prepare all solutions using ultrapure water (prepared by purifying deionized water to attain a sensitivity of 18.6 M Ω cm at 25 °C) and analytical grade reagents. Prepare and store all reagents at 4 °C(unless indicated otherwise). Diligently follow all waste disposal regulations when disposing waste materials. All the procedures for protein purification need to be carried out at 4°C unless indicated.
2.1 Recombinant protein expression components
Plasmid vectors: pET28a-SUMO (8).
KOD DNA polymerase kit (EMD Chemicals, Westbury, NY, USA).
Restriction enzymes (Promega, Madison, WI, USA).
T4 DNA ligase kit (Promega).
E. coli BL21-Gold competent cell (Invitrogen, Grand Island, NY, USA) (see Note 1).
LB (Luria-Bertani) broth: add 20 g of LB Broth (Fisher Scientific, Rockford, Il, USA) to 1 liter of water and autoclave for 30 min.
LB agar plates: add 20 g of LB Broth and 15 g agar to 1 L of water. Autoclave for 30 min. Allow LB agar to cool to 55 °C and then add appropriate antibiotics at designated concentrations. Dispense the mixture into sterile Petri dishes at room temperature. Store the plates at 4 °C after they are cooled and solidified.
Kanamycin sulfate (Fisher Scientific).
IPTG (Isopropyl β-D-1-thiogalactopyranoside) (Fisher Scientific).
SDS-PAGE: 4–20 % (wt/vol) Tris-glycine gel, 1 mm × 15 well (Invitrogen).
2.2 Protein purification components
Tris-HCl (Fisher Scientific).
NaCl.
Imidazole (Fisher Scientific).
DTT (Dithiothreitol) (Fisher Scientific).
TCEP (Tris (2-carboxyethyl) phosphine) (Fisher Scientific).
Binding buffer: 20 mM Tris-HCl pH 8.0, 500 mM NaCl, and 25 mM imidazole.
Elution buffer: 20 mM Tris-HCl pH 8.0, 500 mM NaCl, and 500 mM imidazole.
Buffer A: 20 mM Tris-HCl, pH 8.0, 100 mM NaCl, 0.3 mM TCEP.
Buffer B: 20 mM Tris-HCl, pH 8.0, 1 M NaCl, 0.3 mM TCEP.
Buffer G:10 mM Tris-HCl, pH8.0, 100 mM NaCl, 0.2 mM DTT.
SUMO Protease (Life Sensors, MA, USA).
Emulsiflex C3 high-pressure homogenizer (Avestin, Gilead, CA, USA).
Misonix sonicator 3000 (Fisher scientific).
Spectra molecular porous membrane tubing (Spectrum).
AKTA purifier FPLC (GE Healthcare, Piscataway, NJ, USA ).
HisTrap™ HP column (Ni affinity) (GE Healthcare).
HiTrap™ Q HP column (GE Healthcare).
HiLoad 16/600 Superdex™ 75 pg (see Note 2) (GE Healthcare).
2.3 Enzymatic assay components
Vector to produce recombinant Fap1 substrate, fap1-pGEX-6p1 (10).
Vector to modify initial Fap1 glycosylation, gtf1/gtf2-pVPT (11).
Bacterial host, E. coli Top 10 (Invitrogen).
Activated sugar donor, UDP-[3H]-glucose (Amersham Biosciences, Piscataway, NJ, USA).
Glutathione sepharose beads (GE Healthcare).
In vitro glycosylation buffer: 50 mM HEPES, pH7.0, 10 mM MnCl2, 0.01% bovine serum albumin.
Wash buffer: 50 mM HEPES, pH7.0, 10 mM MnCl2, 0.1% NP40.
NETN buffer: 20 mM Tris-HCl pH7.2, 0.1 M NaCl, 1 mM EDTA, 0.5% NP-40, and protease inhibitor cocktail [1:20, vol/vol].
Beckman LS6500 liquid scintillation counter.
2.4 Protein crystal screening components
Screening instrumentation, Crystal Phoenix (Art Robbins Instruments, Sunnyvale, CA, USA).
Intelli-Plate 96-well flat-bottomed clear polypropylene plates (Hampton Research, Aliso Viejo, CA, USA).
Protein crystallization film for 96-well plates (Hampton Research).
24-well crystallization plate (Hampton Research).
Natrix, Crystal Screen, Crystal Screen II (Hampton Research).
Wizard I, Wizard II, Wizard III (Emerald Biosystem, Bedford, MA, USA).
Pre-Crystallization Test kit (PCT) (Hampton Research).
3. Methods
3.1 Plasmid construction and protein expression
Amplify the full-length gene gtf3 from genomic DNA of S. parasanguinis FW213 using primer set Gtf3-HindIII-1F and Gtf3-XhoI-987R (10).
Purify the PCR product and clone it into pET28a-SUMO (8).
Transform the resulting plasmid pET-SUMO-gtf3 into E. coli BL21 Gold (DE3) competent cells using standard transformation protocol.
Select the transformants on LB plate with kanamycin (50 μg/ml) and further verify the transformants by PCR and sequencing analysis.
Inoculate a single colony into the 10 ml LB medium with kanamycin (50 μg/ml) and grow the culture overnight with shaking (250 rpm) at 37 °C.
Inoculate the 10 ml overnight culture into the large flask with 1L LB medium with kanamycin (50 μg/ml). Grow the bacteria at 37 °C with shaking at 250 rpm, to an OD600 of 0.7-0.8. (see Note 3)
Add IPTG to a final concentration of 0.1 mM and allow the culture grow at 18 °C overnight to induce protein expression. (see Note 4)
3.2 Protein purification
Harvest bacterial cells by centrifugation (15 min at 7000 rpm 4 °C). Discard supernatant and resuspend cell pellet in binding buffer, and lyse the cells under high pressure, or sonicate the cells 360 rounds of 1 second pulse using automatic sonicator with power output 40 W. (see Note 5)
Centrifuge the lysates at 16,500 rpm for 1 h and filter the supernatant with 0.45 nm filter. (see Note 6)
Apply the filtered supernatant to HisTrap™ Column that is pre-equilibrated with 5 bed volumes of binding buffer.
After washing with binding buffer (5 bed volumes), elute proteins from the affinity resin by elution buffer using a linear gradient.
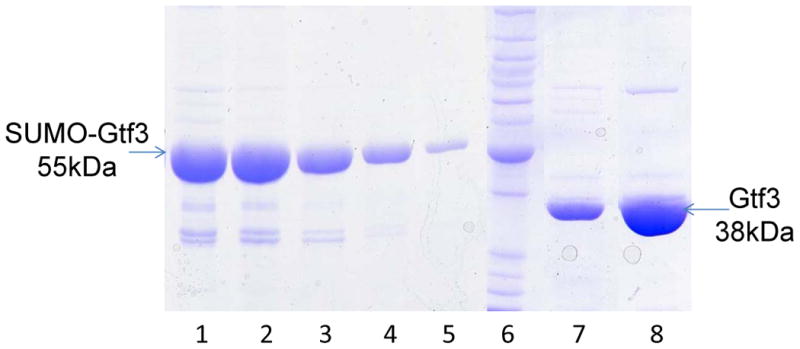
Check the elution by SDS-PAGE and pool the fractions that contain most of the target proteins (Fig.1). Cleave the N-terminal His-SUMO tag by incubating the pooled fractions with SUMO Protease during overnight dialysis at 4 °C against 20 mM Tris-HCl pH 8.0, 500 mM NaCl (see Note 7).
Reapply dialyzed protein samples to HisTrap™ Column to remove SUMO Protease, the cleaved SUMO tag and uncleaved proteins (see Note 8).
Collect flow through and apply the harvested protein to anion exchange chromatography on a HiTrap™ Q column equilibrated with Q buffer A.
Elute protein samples with Q buffer B using a linear gradient.
Collect the fractions containing the target proteins, concentrate them and apply to HiLoad 16/60 SuperdexTM 75 preparation grade column which is connected to an AKTA-purifier FPLC system. Set the flow rate at 1 ml/min. Equilibrate the column with buffer G prior to protein loading. Elute fractions using buffer G and collect the fraction every 2 ml using a fraction collector.
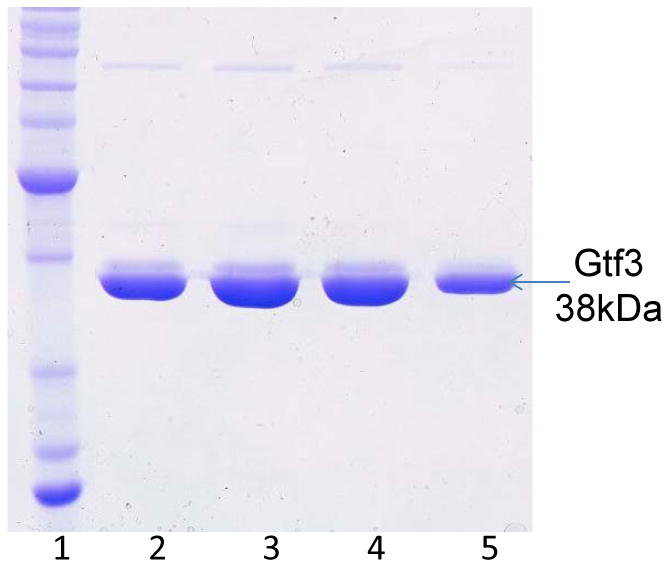
Analyze protein purity by running fraction samples on SDS-PAGE (Fig.2). Pool peak fractions and concentrate them to 30 mg/ml for crystallization screen subsequently (see Note 9).
Fig.1. SDS-PAGE analysis of recombinant Gtf3 protein after purification by HisTrap™ Column and HiTrap™ Q column.

6XHis tagged recombinant Gtf3 was purified on HisTrap™ Column and eluted (Lanes 1 to 5) as described in the section 3.2. Cleavage and dialysis were performed overnight at 4 °C with SUMO protease. Following the dialysis, 6xHis-SUMO and 6xHis tagged SUMO protease were removed from the flow through by passing through a HisTrap™ Column. The flow through (Lane 7) was further purified using HiTrap™ Q column and eluted (Lane 8). Protein samples were analyzed on SDS-PAGE after each step (small aliquots were used). Lane 6, BenchMark™ Protein Ladder.
Fig.2. SDS-PAGE analysis of final Gtf3 protein samples used for crystallization.

Peak fractions (Lanes, 2-5) collected from gel filtration were examined by SDS-PAGE and stained with Commassie Blue. Lane 1, BenchMark™ Protein Ladder
3.3 Protein enzymatic activity assay
The substrates, metal ions (for metal-dependent GTs) and specific sugar donors are important elements for successful glycosyltransferase enzymatic assays.
The substrate of Gtf3 is GlcNAc modified Fap1 (10, 11). Purify the substrate GlcNAc-modified Fap1 using glutathione sepharose beads from E. coli Top 10 (see Note 10). Specific sugar donor for Gtf3 is UDP-[3H]-glucose.
Wash 20 μg substrate Fap1-GlcNAc bound to glutathione sepharose beads five times with the glycosylation buffer.
After the last wash, discard the supernatant and suspend the beads in 200 μl glycosylation buffer.
Add 2 μg of purified Gtf3 protein and 50 nM of UDP-[3H]-glucose to the glycosylation reaction sequentially and incubate the mixture in an orbital shaker at 60 rpm for 1 h at 37°C.
Wash the beads three times with wash buffer and then transfer the beads to scintillation vials and mix with 5 ml scintillation cocktail.
Measure radioactivity transferred to the GlcNAc modified Fap1 substrate from the radiolabeled activated glucose (10) using a scintillation counter (see Note 11).
3.4 Crystallization and data collection
Set up initial crystallization screening at room temperature utilizing a Phoenix Crystallization robot and commercially available screening kits such as Natrix, Crystal Screen, Crystal Screen II, Wizard I, Wizard II, and Wizard III by the sitting-drop vapor-diffusion method (see Note 12).
Optimize the crystallization conditions that produce single crystal hits during initial screening, by modifying the pH and the concentrations of metal ions and precipitants (see Note 13).
Mount a single crystal by first soaking for about 10 seconds in an empirically determined cryoprotectant, and then flash freeze the crystal by plunging it into liquid nitrogen (see Note 14).
Collect the data using a MAR 300 CCD detector at the Argonne National Laboratory beam line SER-CAT ID-22 (see Note 15).
3.5. Model building and structure refinement
Utilize Phenix software package for model building and structure refinement. Use molecular replacement (12) to solve structures when a known homologous structure is available.
Adjust the autobuilt model manually with Coot software. Then refine the structure with Phenix. Repeat that process until the R-work reaches about 0.2 and R-free (multiplied by 10) is the same as or lower than the resolution (see Note 16).
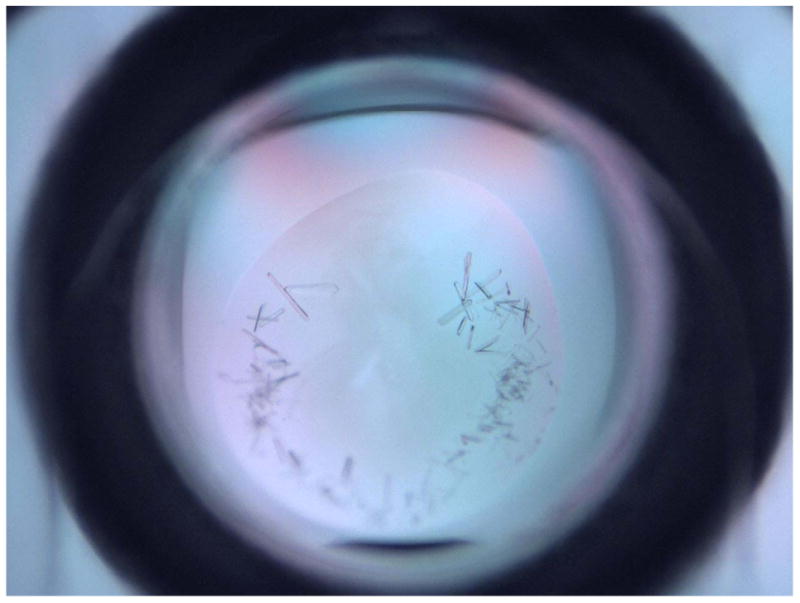
Fig.3. Crystals obtained from the initial screening of Gtf3.

Crystals appeared at one condition from Index screening kit (Hampton Research). The condition contained 0.1 M Succinic Acid pH7.0, 15% Polyethylene glycol 3,350, and 15mg/ml Gtf3. The crystals were obtained after overnight incubation at 20 °C.
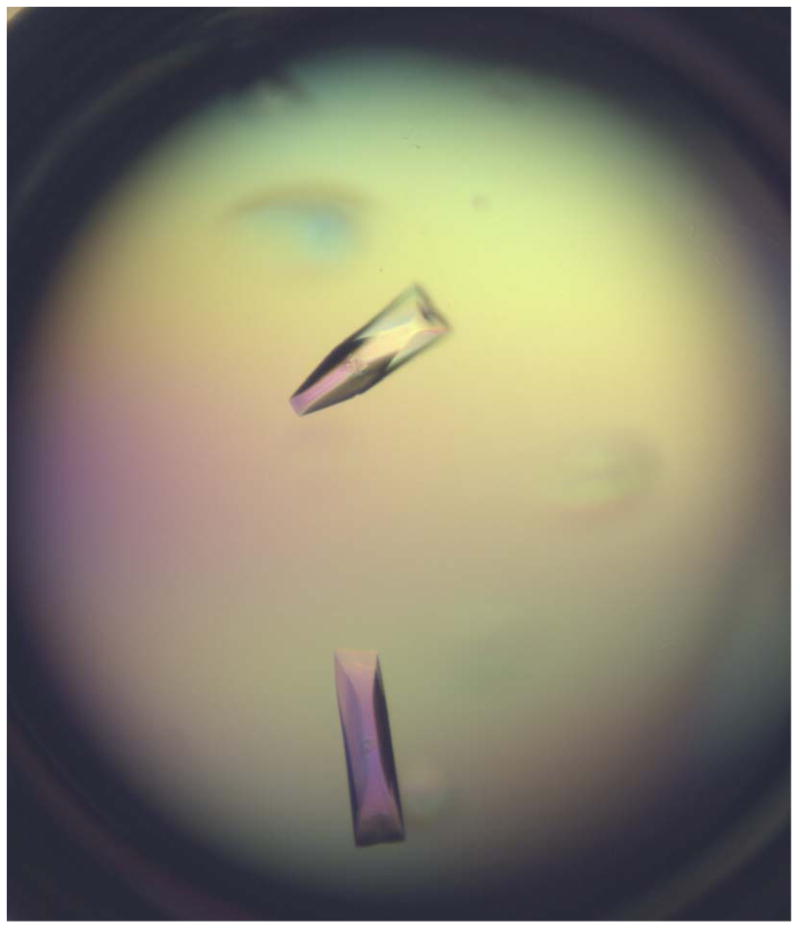
Fig.4. Crystals obtained after optimization.

Single and large crystals were obtained from the condition containing 0.1 M Succinic Acid, pH7.0, 13% Polyethylene glycol 3,350 and 10% glycerol.
Acknowledgments
We thank Dr. Heidi Erlandsen for critical reading of the manuscript. The work was supported by NIH/NIDCR grant R01DE017954 (HW).
Footnotes
BL21-Gold competent cell is not only good for pET28-SUMO vector expression in LB and also good for protein expression in the minimal medium, which is needed for Seleno-methionine-substituted method (see Note 16).
These columns listed were used in the Gtf3 example; other proteins may need different columns based on the properties of target proteins.
It will take approximately 2.5 h to reach the OD value. OD between 0.7 and 0.9 is acceptable. OD higher than 1.0 or lower than 0.6 is not good for protein expression.
Cool down the culture first and then add IPTG, which will prevent the production of insoluble proteins in inclusion bodies.
It is optional to wash the pellet with PBS once before cell lysis.
Filtering the supernatant will eliminate most debris that can clog the affinity column.
Check the efficiency of SUMO protease by SDS-PAGE analysis and use an appropriate amount of SUMO protease accordingly.
Step 7 & 8 are optional. Continue to step 9 if the purity of the protein from the flow through is good. And for each step, select appropriate column based on biochemical properties of the target protein.
A Pre-Crystallization Test (PCT) kit can be used to select the appropriate protein concentration for crystallization screening.
Purify GST fusion proteins using glutathione Sepharose 4B Beads following the manufacturer's instructions. Induce E. coli carrying vectors fap1-pGEX-6p1 and gtf1/gtf2-pVPT to express GlcNAc modified recombinant Fap1 and then lyse the induced cells as described above (see section 3.2.1). Wash 400 μl of glutathione sepharose bead slurry with 1 ml NETN buffer and then mix the lysed supernatant with washed beads and incubate at 4 °C for 3 hours. Wash the beads bound with GST fusion Fap1-GlcNAc with 10 ml NETN buffer four times.
Optimal reaction pH, temperature, and buffer can be tested empirically to establish a better enzymatic reaction system.
Any crystallization system can be used based on availability. Crystal Phoenix from Art Robbins instruments is used for our initial screening. There are also other screening kits from Qiagen, which can be used for screening (http://www.qiagen.com/products/protein/crystallization/default.aspx#ScreeningSuites). We usually place the screening plates at 20 °C at the very beginning but different temperatures can be tested if there is no indication of crystal growth at 20 °C .
It is hard to keep every step identical manually during each optimization. In addition, the reservoir from the screening plates will evaporate during the protein crystallization process that will alter the condition; therefore it is important to grow crystals at diverse ranges of pH values or precipitant as you may not be able to obtain the crystals of the same quality at the same condition. For instance, at the initial screening of Gtf3, one condition (0.1 M Succinic Acid pH 7.0, 15% Polyethylene glycol 3,350) gave rise to single crystals (Fig.3). After optimization, we obtained better crystals from the condition containing 0.1 M Succinic Acid, pH 7.0, 13% Polyethylene glycol 3,350 and 10% glycerol (Fig.4).
We usually use glycerol as cryoprotectant. The cryoprotectant used for Gtf3 was 25% of glycerol added into 0.1 M Succinic Acid, pH 7.0, 13% Polyethylene glycol 3,350. More concentrated cryoprotectant is needed if the concentration of precipitant is low.
Depending on availability, other synchrotron sources, beamlines and methods can be used to collect data. It is empirical to set up data collection parameters since every crystal is different. Comparing to higher resolution crystals, lower resolution crystals need longer distance away from the detector when the detector size and X-ray wavelength are set. We usually collect one image per angle until a Phi range of 360° is collected. But for bigger unit cell we use smaller angle range. Pre-processing the data during the data collection using HKL 2000 is recommended. One advantage of doing so is to ensure the collected data are useful for structural analysis. The quality of the data can be determined by whether the majority of reflections are covered when integrating the images, and the value of Rsym. Rsym is an internal measure of the errors within a data set. It will be generated after the data are scaled. Rsym ≤ 0.05 indicates that the data are good. Rsym around 0.1 means that the data are acceptable. The data are not acceptable if Rsym ≥ 0.15. Another advantage of pre-processing the data is that the space group obtained from the scale will provide some hints about how wide the angle should be to solve a structure. Thus, sufficient data can be collected prior to crystal decay because of long period of exposure to X-Ray.
Before attempting to solve a protein structure, it is necessary to check if the target protein has any homologous structure solved and what the identity is. If there is a homolog with 50 % or higher identity, the homologous structure can be used to solve target protein structure by molecular replacement. However if there is no homologous structure or the identity is lower than 30 %, single-wavelength anomalous diffraction (SAD) or multi-wavelength anomalous diffraction (MAD) (13-15) with metal labeled-residues should be used to solve structure. Seleno-methionine-substituted method is often used. Seleno-methionine-substituted (Se-Met) Gtf3 was produced using a similar protocol, except that a complete amino acid medium with Se-Met substituted the LB medium (16), and that the induction was carried out at 25 °C overnight. Other heavy metals can be used to label crystals if the percentage of methionine is lower than 1 %. Se-Met data are analyzed by Autosol first and then used for autobuilding the protein structure (17). In the process of solving structures, some important parameters should be taken into consideration such as R-factor and FOM (Figure of merit). The R-factor will be obtained after molecular replacement or autosol. Normally R-factor should be lower than 0.4. FOM should be around 0.5 (FOM lower than 0.2 indicates that it's impossible to solve the structure). PHENIX and COOT are the common softwares used to solve structure, and there are other softwares such as MIRAS, SHARP(18), and CNSsolve (19) that can be used.
References
- 1.Drickamer K, Taylor ME. Evolving views of protein glycosylation. Trends Biochem Sci. 1998;23:321–324. doi: 10.1016/s0968-0004(98)01246-8. [DOI] [PubMed] [Google Scholar]
- 2.Zhou M, Wu H. Glycosylation and biogenesis of a family of serine-rich bacterial adhesins. Microbiology. 2009;155:317–327. doi: 10.1099/mic.0.025221-0. [DOI] [PubMed] [Google Scholar]
- 3.Campbell JA, Davies GJ, Bulone V, Henrissat B. A classification of nucleotide-diphospho-sugar glycosyltransferases based on amino acid sequence similarities. Biochem J. 1997;326(Pt 3):929–939. doi: 10.1042/bj3260929u. [DOI] [PMC free article] [PubMed] [Google Scholar]
- 4.Wagner GK, Pesnot T. Glycosyltransferases and their assays. Chembiochem. 2010;11:1939–1949. doi: 10.1002/cbic.201000201. [DOI] [PubMed] [Google Scholar]
- 5.Mulichak AM, Losey HC, Walsh CT, Garavito RM. Structure of the UDP-glucosyltransferase GtfB that modifies the heptapeptide aglycone in the biosynthesis of vancomycin group antibiotics. Structure. 2001;9:547–557. doi: 10.1016/s0969-2126(01)00616-5. [DOI] [PubMed] [Google Scholar]
- 6.Hu Y, Chen L, Ha S, Gross B, Falcone B, Walker D, Mokhtarzadeh M, Walker S. Crystal structure of the MurG:UDP-GlcNAc complex reveals common structural principles of a superfamily of glycosyltransferases. Proc Natl Acad Sci U S A. 2003;100:845–849. doi: 10.1073/pnas.0235749100. [DOI] [PMC free article] [PubMed] [Google Scholar]
- 7.Yuan Y, Barrett D, Zhang Y, Kahne D, Sliz P, Walker S. Crystal structure of a peptidoglycan glycosyltransferase suggests a model for processive glycan chain synthesis. Proc Natl Acad Sci U S A. 2007;104:5348–5353. doi: 10.1073/pnas.0701160104. [DOI] [PMC free article] [PubMed] [Google Scholar]
- 8.Zhu F, Erlandsen H, Ding L, Li J, Huang Y, Zhou M, Liang X, Ma J, Wu H. Structural and functional analysis of a new subfamily of glycosyltransferases required for glycosylation of serine-rich streptococcal adhesins. J Biol Chem. 2011;286:27048–27057. doi: 10.1074/jbc.M110.208629. [DOI] [PMC free article] [PubMed] [Google Scholar]
- 9.Wu R, Wu H. A molecular chaperone mediates a two-protein enzyme complex and glycosylation of serine-rich streptococcal adhesins. J Biol Chem. 2011;286:34923–34931. doi: 10.1074/jbc.M111.239350. [DOI] [PMC free article] [PubMed] [Google Scholar]
- 10.Zhou M, Zhu F, Dong S, Pritchard DG, Wu H. A novel glucosyltransferase is required for glycosylation of a serine-rich adhesin and biofilm formation by Streptococcus parasanguinis. J Biol Chem. 2010;285:12140–12148. doi: 10.1074/jbc.M109.066928. [DOI] [PMC free article] [PubMed] [Google Scholar]
- 11.Wu R, Zhou M, Wu H. Purification and characterization of an active N-acetylglucosaminyltransferase enzyme complex from Streptococci. Appl Environ Microbiol. 2010;76:7966–7971. doi: 10.1128/AEM.01434-10. [DOI] [PMC free article] [PubMed] [Google Scholar]
- 12.Dodson E. The befores and afters of molecular replacement. Acta Crystallogr D Biol Crystallogr. 2008;64:17–24. doi: 10.1107/S0907444907049736. [DOI] [PMC free article] [PubMed] [Google Scholar]
- 13.McRee DE. Practical Protein Crystallography (Second edition ) 2. Academic Press; 1999. [Google Scholar]
- 14.Hendrickson WA, Horton JR, LeMaster DM. Selenomethionyl proteins produced for analysis by multiwavelength anomalous diffraction (MAD): a vehicle for direct determination of three-dimensional structure. EMBO J. 1990;9:1665–1672. doi: 10.1002/j.1460-2075.1990.tb08287.x. [DOI] [PMC free article] [PubMed] [Google Scholar]
- 15.Hendrickson WA, Horton JR, Murthy HM, Pahler A, Smith JL. Multiwavelength anomalous diffraction as a direct phasing vehicle in macromolecular crystallography. Basic Life Sci. 1989;51:317–324. doi: 10.1007/978-1-4684-8041-2_28. [DOI] [PubMed] [Google Scholar]
- 16.Doublie S. Preparation of selenomethionyl proteins for phase determination. Methods Enzymol. 1997;276:523–530. [PubMed] [Google Scholar]
- 17.Terwilliger TC, Grosse-Kunstleve RW, Afonine PV, Moriarty NW, Zwart PH, Hung LW, Read RJ, Adams PD. Iterative model building, structure refinement and density modification with the PHENIX AutoBuild wizard. Acta Crystallogr D Biol Crystallogr. 2008;64:61–69. doi: 10.1107/S090744490705024X. [DOI] [PMC free article] [PubMed] [Google Scholar]
- 18.Messerschmidt A. X-Ray Crystallography of Biomacromolecules: A Practical Guide. 1. Wiley-VCH; 2007. p. 318. [Google Scholar]
- 19.Brunger AT, Adams PD, Clore GM, DeLano WL, Gros P, Grosse-Kunstleve RW, Jiang JS, Kuszewski J, Nilges M, Pannu NS, Read RJ, Rice LM, Simonson T, Warren GL. Crystallography & NMR system: A new software suite for macromolecular structure determination. Acta Crystallogr D Biol Crystallogr. 1998;54:905–921. doi: 10.1107/s0907444998003254. [DOI] [PubMed] [Google Scholar]


