

Abstract
Traumatic brain injury (TBI) is a leading cause of sustained impairment in military and civilian populations. However, mild TBI (mTBI) can be difficult to detect using conventional MRI or CT. Injured brain tissues in mTBI patients generate abnormal slow-waves (1–4 Hz) that can be measured and localized by resting-state magnetoencephalography (MEG). In this study, we develop a voxel-based whole-brain MEG slow-wave imaging approach for detecting abnormality in patients with mTBI on a single-subject basis. A normative database of resting-state MEG source magnitude images (1–4 Hz) from 79 healthy control subjects was established for all brain voxels. The high-resolution MEG source magnitude images were obtained by our recent Fast-VESTAL method. In 84 mTBI patients with persistent post-concussive symptoms (36 from blasts, and 48 from non-blast causes), our method detected abnormalities at the positive detection rates of 84.5%, 86.1%, and 83.3% for the combined (blast-induced plus with non-blast causes), blast, and non-blast mTBI groups, respectively. We found that prefrontal, posterior parietal, inferior temporal, hippocampus, and cerebella areas were particularly vulnerable to head trauma. The result also showed that MEG slow-wave generation in prefrontal areas positively correlated with personality change, trouble concentrating, affective lability, and depression symptoms. Discussion is provided regarding the neuronal mechanisms of MEG slow-wave generation due to deafferentation caused by axonal injury and/or blockages/limitations of cholinergic transmission in TBI. This study provides an effective way for using MEG slow-wave source imaging to localize affected areas and supports MEG as a tool for assisting the diagnosis of mTBI.
Keywords: Magnetoencephalography, Traumatic brain injury, Slow-wave, Blast, Axonal injury
Highlights
-
•
A voxel-based whole-brain MEG slow-wave source imaging method for mild TBI.
-
•
The new approach showed 84.5% positive detection rate in 84 mild TBI patients.
-
•
The new approach detected loci of injury in mild TBI patients on a single-subject basis.
-
•
MEG slow-wave source imaging revealed brain areas vulnerable to mild TBI.
-
•
MEG slow-wave generations correlated with mild TBI symptoms.
1. Introduction
Traumatic brain injury (TBI) is a leading cause of sustained physical, cognitive, emotional, and behavioral deficits in the civilian population (due to motor vehicle accidents, sports, falls, and assaults) and military personnel (with blast injury as an additional cause). An estimated 5.3 million Americans live with disabilities associated with a TBI (Thurman et al., 1999). The majority of TBIs are in the “mild” range of severity. Mild TBI (mTBI) accounts for 75% of civilian TBIs (Centers for Disease Control, Prevention, National Center for Injury Prevention, Control, 2003), and 89% of active-duty military personnel and Veterans wounded in combat in Iraq and Afghanistan with combat-related TBIs (MacGregor et al., 2011). However, the pathophysiology of mTBI is not completely understood and the long-term effects of mTBI are controversial. Post-concussive symptoms (PCSs) in mTBI often resolve within three months after injury in the majority of individuals (Levin et al., 1987, Rutherford, 1989). However about 20% (varying from 8 to 33%) of mTBI patients show persistent long-term cognitive and/or behavioral impairments (Alexander, 1995, Binder, 1986, Binder, 1997, Bohnen et al., 1992, Rimel et al., 1981, Rutherford, 1989). At present, it is unclear why similar acute mTBI events can lead to dramatic neurobehavioral decompensation with persistent PCS in some individuals, but not in others (Jeter et al., 2013). It is also unclear what the optimal rehabilitation treatments are for mTBIs, partially due to the limited or lack of information about the loci of the injury.
Conventional neuroimaging techniques have limited sensitivity to detect physiological alterations caused by mTBI and are usually not used to assess the efficacy of mTBI treatments. Mild (and some moderate) TBI can be difficult to detect because the injuries are often not visible on conventional acute MRI or CT (Bigler and Orrison, 2004, Johnston et al., 2001, Kirkwood et al., 2006). Approximately 80% of all civilian patients with TBI do not show visible lesions using conventional MRI or CT (Alexander, 1995). Intracranial lesions in mTBI were detected by conventional neuroimaging techniques in only 4%, 16%, and 28% of civilian patients with Glasgow Coma Scale (GCS) scores (Teasdale and Jennett, 1974) of 15, 14, and 13, respectively (Culotta et al., 1996). The diagnosis of combat-related mTBI is also based primarily on the characteristics of the acute clinical sequelae following the injury; and subtle, scattered and varied lesion(s) that usually go undetected by conventional CT (Van Boven et al., 2009). The absence of abnormalities on conventional neuroimaging techniques in the majority of mTBI patients, even with persistent PCS and cognitive and/or behavioral deficits highlights the limited diagnostic and prognostic value of conventional CT and MRI.
Usually, diffuse axonal injury (DAI) is a major contributor to the PCS and cognitive deficits in mTBI patients. DAI is commonly induced by sudden acceleration–deceleration or by rotational forces. In a rodent TBI model, a silver staining technique revealed that axonal injury was the most prominent feature following blast exposure (Garman et al., 2011). In humans, the subsequent tissue injury is characterized by axonal stretching, inflammation, disruption, and separation of nerve fibers in white matter (WM), although complete axotomy has been found to be relatively rare in even severe TBI (Adams et al., 1989, Basser and Pierpaoli, 1996, Gennarelli et al., 1982, Niogi et al., 2008a, Niogi et al., 2008b, Xu et al., 2007). Conventional CT and MRI are primarily sensitive to blood from nearby torn capillaries, and less sensitive to axonal damage itself, hence they underestimate the presence of DAI, especially in mTBI cases.
Magnetoencephalography (MEG) is a non-invasive functional imaging technique that directly measures the neuronal current in gray matter (GM) with high temporal resolution (< 1 ms) and spatial localization accuracy (2–3 mm at cortical level) (Leahy et al., 1998). MEG studies from Lewine et al., and our laboratory showed that MEG is highly sensitive to abnormal slow-wave signals (delta-band 1–4 Hz, and extends to theta-band 5–7 Hz) resulting from axonal injuries (Huang et al., 2009, Huang et al., 2012, Lewine et al., 1999, Lewine et al., 2007). Neurophysiological studies in animals have established a solid connection between pathological delta-wave generation in GM and axonal injuries in WM (Ball et al., 1977, Gloor et al., 1977), showing that cortical deafferentation caused by axonal injury in WM is an important factor in delta-wave production in GW. We have reported that abnormal MEG slow-waves in mTBI are related to diffusion tensor injury (DTI) abnormalities in underlying WM tracts (Huang et al., 2009). Using a region of interest (ROI) automated approach, we also detected abnormal slow-waves in 87% of patients with persistent PCS in chronic and sub-acute phases of mTBI (Huang et al., 2012). The main limitations of the ROI-based MEG approach were: 1) the limited spatial resolution defined by the size of the ROIs, and 2) the volume of the ROI varied considerably which caused variable sensitivity in detecting abnormal slow-waves in mTBI.
Voxel-based source imaging approach has the potential of overcoming the limitation of the ROI-based approach. In a study by Wienbruch (2007), a voxel-based dipole location density function approach with Z-score statistics was used for assessing resting-state MEG brain rhythms in human. Building upon previous work in this area, the present study introduces a new automated voxel-based whole-brain MEG slow-wave imaging approach for detecting abnormality on a single-subject basis for individuals with mTBI. The voxel-based MEG source images are obtained using our recent Fast-VESTAL method (i.e., Fast VEctor-based Spatio-Temporal Analysis of L1-minimum) (Huang et al., 2014) for analyzing resting-state MEG data. The goals for the present study are to: 1) establish and evaluate a normative database for the voxel-based whole-brain MEG slow-wave imaging approach; 2) examine the positive detection rates of this new approach for its ability to detect abnormality in patients with mTBI on a single-subject-basis; and 3) study the spatial distribution of abnormal MEG slow-wave loci in both individual patients and on a group basis to identify the brain areas that are particularly vulnerable to mTBI.
2. Methods and materials
2.1. Research subjects
Eighty-four (84) mTBI patients who had a chronic/sub-acute TBI (4 weeks to 5 years, mean 8.7 ± 7.3 months post-injury) with persistent ongoing PCS participated in this study. The mTBI patients were divided into two groups: the mild blast-induced TBI group consisted of 36 mTBI patients (active-duty military service members and OEF/OIF Veterans) with injuries caused by blast exposure during combat (age 28.3 ± 5.4 years, all males) while the non-blast mTBI group comprised 48 mTBI civilian patients injured due to non-blast causes (i.e., motor vehicle accidents, sports, and falls; age 30.2 ± 10.2 years, 34 males). One essential step in identifying individual TBI patients with abnormal MEG slow-waves is to first create an age-matched normative database (see below). For that purpose, 79 healthy control subjects (68 civilians and 11 active-duty military service members) with no significant history of concussion were recruited into the study (age 28.4 ± 8.7 years, 67 males). There were no statistically significant age differences between the healthy control group and either of the TBI groups. All participants gave written informed consent for study procedures, which were reviewed and approved by institutional review boards of the VA San Diego Healthcare System and Naval Health Research Center at San Diego. The informed consent followed the ethical guidelines of the Declarations of Helsinki (sixth revision, 2008) and additional research requirements for active-duty military personnel and veterans.
All mTBI patients were evaluated in a clinical interview to document the nature of the injuries and on-going PCS. The diagnosis and classification of mTBI patients were based on standard VA/DOD diagnostic criteria. Inclusion in the mTBI patient group required a TBI that met the following criteria: 1) a loss of consciousness (LOC) < 30 min or transient confusion, disorientation, or impaired consciousness immediately after the trauma; 2) post-traumatic amnesia (PTA) < 24 h; 3) an initial Glasgow Coma Scale (GCS) (Teasdale and Jennett, 1974) between 13 and 15 (if available). Since the GCS assessment was often not available in theater, military personnel (and some civilians) with missing GCS, but who met other inclusion criteria, were also recruited.
We examined PCS in all mTBI patients (based on a clinical interview). The symptoms were coded as “1” for the existence of symptoms and “0” for the absence of symptoms in 21 categories, modified slightly from the Head Injury Symptom Checklist (HISC, (McLean et al., 1984): 1) headaches, 2) dizziness, 3) fatigue, 4) memory difficulty, 5) irritability, lack of patience, lose temper easily, 6) anxiety, 7) trouble with sleep, 8) hearing difficulties, 9) blurred vision or other visual difficulties, 10) personality changes (e.g., social problems), 11) apathy, 12) lack of spontaneity, 13) affective lability (quickly-changing emotions), 14 depression, 15) trouble concentrating, 16) bothered by noise, 17) bothered by light, 18) coordination and balance problems, 19) motor difficulty, 20) difficulty with speech, 21) numbness/tingling.
Tertiary injuries were common in patients with blast-related mTBI. The tertiary injuries involved a fall, hitting other objects (e.g., hitting parts of vehicle when the driving vehicle was hit by an IED), or being hit by other flying objects following the initial blast (Cernak and Noble-Haeusslein, 2010, Elder et al., 2010). Among our 36 blast mTBI patients, 25 also reported having tertiary injuries; 5 reported no-tertiary injuries; 6 were unsure. We use the term “blast-induced mTBI” or simple “blast mTBI” throughout this study to represent the group with combined primary blast and tertiary injuries. In the mTBI group, 2 patients had positive findings on conventional MRI (nonspecific mild white-matter T2-prolongation, not definitely related to trauma) and none had evidence of intracranial hemorrhage/hemosiderin during the chronic phase (i.e., > 6 months post-injury). No healthy control subjects showed positive findings on conventional MRI. Among all mTBI patients, 27 had multiple TBIs (14 from the blast group and 13 from the non-blast group). It is not our intention in this study to use MEG to distinguish new from old neuronal injuries due to multiple TBIs. Patients with multiple TBIs were included in the analysis, and a history of the most recent and all prior TBIs was documented for further exploration. It is possible that in patients with multiple TBIs, both the old and new injuries contributed to deafferentation, thus generating abnormal MEG slow-waves.
Exclusion criteria for study participation were as follows: 1) other neurological, developmental or psychiatric disorders (e.g., brain tumor, stroke, epilepsy, Alzheimer disease, or schizophrenia, bipolar disorder, or history of learning disability). Additionally, participants with a diagnosis of post-traumatic stress disorder (PTSD) or major depression disorder (MDD) were excluded based on DSV-5 criteria and for PTSD, a Clinician Administered PTSD scale score ≥ 30; 2) substance or alcohol abuse according to DSM-V criteria within the six months prior to the study; 3) history of metabolic or other diseases known to affect the central nervous system (see Dikmen et al., 1995 for similar criteria); 4) extensive metal dental hardware (e.g., braces and large metal dentures; fillings are OK) or other metal objects in the head, neck, or face areas that cause non-removable artifacts in the MEG data; 5) participants taking certain medications (e.g., some sedative neuroleptics and hypnotics) known to increase delta-wave power (Niedermeyer and Lopes da Silva, 2005) were excluded from participation; 6) potential subjects were administered the Beck Depression Inventory (BDI-II) to evaluate level of depressive symptoms, and suicidal ideation; any participant who reports a “2” or “3” on the BDI-II: item 9 (suicidal thoughts or wishes) were also excluded. However, depression symptoms following mTBI are common (Rapoport, 2012); therefore, in this study, we included subjects with depression symptoms reported after their injury, but not serious enough to be diagnosed with MDD.
2.2. MEG data acquisition and signal pre-processing to remove artifacts
Resting-state MEG data (spontaneous recording for detecting MEG slow-wave signals) were collected using the VectorView™ whole-head MEG system (Elekta-Neuromag, Helsinki, Finland) with 306 MEG channels in upright position inside a multi-layer magnetically-shielded room (IMEDCO-AG) (Cohen et al., 2002) at the UCSD MEG Center. The recording was divided into three 5-minute blocks with eyes closed, alternating with three 5-minute blocks with eyes open. In the eyes-closed condition, the subject was instructed to keep the eyes closed and empty his/her mind. In the eyes-open condition, the subject was instructed to fix the eyes on a fixation point and empty his/her mind. The order of blocks was counter-balanced between subjects. Data were sampled at 1000 Hz and were run through a high-pass filter with a 0.1 Hz cut-off, and a low-pass filter with a 330 Hz cut-off. Eye blinks, eye movements, and heart signals were monitored. Precautions were taken to ensure head stability; foam wedges were inserted between the subject's head and the inside of the unit, and a Velcro strap was placed under the subject's chin and anchored in superior and posterior axes. Head movement across different sessions was about 2–3 mm. Since the MEG eyes-open data were contaminated with eye-blinks in many subjects, we focused on analyzing the eyes-closed data in the present study.
To help ensure that subjects were alert during the MEG recordings, prior to all of the study sessions, participants completed a questionnaire about the number of hours they slept the previous night, how rested they felt, and if there was any reason that they might not be attentive and perform to the best of their abilities (due to headache, pain, etc.). Participants were scheduled early in the day to avoid fatigue from performing daily activities. In addition, eyes closed sessions were rotated with eyes open sessions to monitor the amount of eye blinking and eye movement, which MEG technicians monitor online to gage the cognitive state of subjects. MEG technicians also monitored online the amount of alpha band oscillations, which is consistently associated with tonic alertness. Participants were viewed on a camera, which also allowed for MEG technicians to monitor alertness of each subject.
MEG eyes-closed data were first run through MaxFilter, also known as signal space separation, (Song et al., 2008, Taulu et al., 2004a, Taulu et al., 2004b) to remove external interferences (magnetic artifacts due to metal objects, strong cardiac signals, environment noises, etc.), and to co-register the MEG data by removing the small head movements across the three 5-min eyes-closed sessions. Next, residual artifacts near the sensor array due to eye movements and residual cardiac signals were removed using Independent Component Analysis. The software is our customized version of ICALAB (bsp.brain.riken.jp/ICALAB/).
2.3. Structural MRI, MEG-MRI registration, BEM forward calculation
Structural MRI of the subject's head was collected using a General Electric 1.5T Excite MRI scanner. The acquisition contains a standard high-resolution anatomical volume with a resolution of 0.94×0.94×1.2 mm3 using a T1-weighted 3D-IR-FSPGR pulse sequence. To co-register the MEG with MRI coordinate systems, three anatomical landmarks (i.e., left and right pre-auricular points, and nasion) were measured for each subject using the Probe Position Identification system (Polhemus, USA). By identifying the same three points on the subject's MR images using MRILAB (Elekta/Neuromag), a transformation matrix involving both rotation and translation between the MEG and MR coordinate systems was generated. To increase the reliability of the MEG-MR co-registration, approximately 80 points on the scalp were digitized with the Polhemus system, in addition to the three landmarks, and those points were co-registered onto the scalp surface of the MR images. The T1-weighted images were also used to extract the brain volume and innermost skull surface (SEGLAB software developed by Elekta/Neuromag). Realistic Boundary Element Method (BEM) head model was used for MEG forward calculation (Huang et al., 2007, Mosher et al., 1999). The BEM mesh was constructed by tessellating the inner skull surface from the T1-weighted MRI into ~ 6000 triangular elements with ~ 5 mm size. A cubic source grid with 5 mm size was used for calculating the MEG gain (i.e., lead-field) matrix, which leads to a grid with ~ 10,000 nodes covering the whole brain. Other conventional MRI sequences typical for identifying structural lesions in TBI patients were also performed: 1) Axial T2*-weighted; 2) axial fast spin-echo T2-weighted; and 3) axial FLAIR; These conventional MRIs were carefully reviewed by a Board-certified neuroradiologist (R.R. Lee) to determine if the subject had visible lesions on MRI.
2.4. MEG slow-wave source magnitude imaging using Fast-VESTAL
The voxel-based MEG source magnitude images were obtained using our recent high-resolution Fast-VESTAL MEG source imaging method (Huang et al., 2014). The Fast-VESTAL technique consists of two steps. First, L1-minimum-norm MEG source images were obtained for the dominant spatial (i.e., eigen-) modes of sensor-waveform covariance matrix. Next, accurate source time-courses were obtained using an inverse operator constructed from the spatial source images of Step 1. This approach has been successfully used to obtain comprehensive MEG source-magnitude images covering the entire brain for different frequency bands of resting-state brain rhythms (Huang et al., 2014).
In the present study, each of the artifact-free, 5-minute long, eyes-closed, resting-state MEG sensor-space data were run through a band-pass filter with the passing band at 1–4 Hz (delta-frequency band). After concatenating the three sets of 5-minute band-passed filtered MEG signal, the sensor-waveform covariance matrix was calculated. Using such a covariance matrix, MEG slow-wave source magnitude images that cover the whole brain were obtained for each subject following the Fast-VESTAL procedure (Huang et al., 2014). An Objective Pre-whitening Method was applied to remove correlated environmental noise and objectively select the dominant eigen-modes of sensor-waveform covariance matrix (Huang et al., 2014).
2.5. Establishing voxel-based normative database for MEG slow-wave magnitude imaging
The MEG data processing stream in healthy control subjects includes the following steps: 1) MEG source magnitude imaging volumes obtained from Fast-VESTAL that cover the whole brain for the 1–4 Hz signals from each of the 79 healthy control subjects were first spatially smoothed using a Gaussian kernel with pre-defined full width half maximum (FWHM), and then co-registered to an MNI-152 brain-atlas template with 2 mm voxel size using FLIRT program in FSL software package (www.fmrib.ox.ac.uk/fsl/). 2) For each voxel in the MNI space, the MEG source magnitude data were first run through a logarithm transformation and then fit with a linear regression model for age and gender. The linear fitting parameters for age and gender were saved for each voxel, as parts of the normative database. 3) After adjusting for the age and gender variables, mean values and standard deviations (SD) were calculated for each voxel to form the key features of the normative database. Kolmogorov–Smirnov (K–S) tests were performed for each voxel to test for Gaussian distribution in the normative database. A “normative mask” containing all voxels that survived the K–S Gaussian distribution tests was created for the normative database. Voxels outside such a mask were not included for further analysis. 4) The source magnitude images were then converted into Z-score images using the mean values and SDs from the normative database. 5) A standard cluster analysis was performed for each Z-score imaging volume to control for family-wise errors, using “3dFWHMx” and “3dClustSim” functions in AFNI (http://afni.nimh.nih.gov). A voxel in subject's brain was considered to have statistically abnormal slow-waves if it was part of a Z-score cluster (Z > 2 for all voxels in the cluster) with the size equal or greater than the thresholding cluster-size (Rc) provided by “3dClustSim”. The cluster-size associated with a corrected p = 0.01 threshold was used in the analysis. 6) For each voxel, a cluster-wise Z-score (Zc) which was the mean value of Z-score across all neighboring voxels within Rc was calculated. The maximum value of the cluster-wise Z-score (Zcmax) across the whole brain volume was obtained for each subject. Investigations were conducted to determine the optimal smoothing factor in the pre-defined FWHM, which affected Rc and Zcmax.
2.6. Detecting single-subject-based abnormal MEG slow-waves in mTBI patients
We developed an approach to identify areas that generate abnormal MEG slow-wave on a single-subject basis. For each mTBI patient (blast or non-blast), the MEG source-magnitude-imaging volume was processed following Steps 1 and 2 in previous section. Then the result was run through the normative mask and then processed to adjust for the age and gender using the previously saved linear fitting parameters from normative database. Next, the resulting imaging volume was converted into a Z-score imaging volume using the mean values and SDs from the healthy control database (Step 4 in previous section). Clusters of voxels with abnormal slow-wave generations were identified using Steps 5 and 6 in previous section, and Zcmax across the whole brain volume was obtained for each subject. Since the brain areas injured by TBI are highly heterogeneous with high variability across individuals, and often without global effect. Using the Zcmax value (across the whole brain) is equivalent to examining the hypothesis that at least one area shows abnormal slow-waves.
We assessed the sensitivity and specificity of MEG using the Zcmax measure and estimated its optimal cutoff. The standard Youden's index (i.e., sensitivity + specificity − 1) (YOUDEN, 1950) was used to calculate the optimal cutoff point (threshold of Zcmax) for diagnosing mTBI using MEG slow-wave measure. The optimal cutoff is usually around the peak of a curve in which the Youden's index was plotted against different cutoff values.
2.7. Assessing the spatial distribution of abnormal MEG slow-wave generation to identify the brain areas that are vulnerable to mTBI
In addition to the single-subject-based analysis, we also performed an analysis to identify common brain areas that were likely to generate abnormal MEG slow-waves in mTBI. In this approach, MEG source imaging volume in MNI space from each mTBI patient was converted to a binary imaging volume: value “1” was assigned to the voxels showing statistically significance based on cluster-analysis in a single-subject-based analysis, and “0” to the rest of the voxels. The binary imaging volumes from all mTBI patients were summed up in the MNI space, and then the result was divided by the total number of mTBI patients to create a spatial map for the likelihood of the abnormal MEG slow-wave generation.
2.8. Assessing the effect of different spatial smoothing factors
The spatial smoothing with a Gaussian smoothing kernel may also play an important role to the positive detection rates of abnormal MEG slow-wave source imaging. Due to the nature of high heterogeneity for the location of the abnormal slow-wave generators in mTBI, overly smoothing the MEG Fast-VESTAL result is expected to decrease the sensitivity (i.e., positive detection rate) of the method. On the other hand, under-smoothing or no-smoothing may cause many voxels of the brain in the healthy control database to fail the K–S test for Gaussian distribution, thus miss some key areas of abnormal slow-wave generation in mTBI patients. The best smoothing factor is the one that can balance the above two factors, i.e., having the majority of the voxels in the healthy control database that pass the K–S test for Gaussian distribution, while maintaining high positive detection rates for abnormal MEG slow-waves in patients with mTBI.
2.9. Correlational analyses of MEG slow-wave measures and PCS
Correlation analyses were performed to examine the neuronal correlates of MEG slow-wave generation and PCS scores in patients with mTBI. The MEG slow-wave measures include the Zcmax value and voxel-based MEG source magnitude Z values in MNI-152 atlas coordinates, after correction for age and gender. The PCS scores were the HISC symptom categories. The voxel-based analysis may provide important spatial information of the slow-wave generation related to each PCS category. False discovery rate (FDR) controlled family-wise error (Benjamini and Hochberg, 1995) with corrected p < .05. To examine potential differences between blast versus non-blast causes, correlational analyses were performed separately for the blast mTBI and non-blast mTBI groups.
3. Results
3.1. Positive detection rates of MEG slow-wave imaging for different groups of mTBI patients
MEG source magnitude images obtained from Fast-VESTAL in the 79 healthy control subjects were used to establish the voxel-based whole-brain normative database in MNI space. We examined the effects of different spatially smoothing factors by applying Gaussian smoothing kernels with different FWHMs at 2 mm, 3 mm, and 8 mm respectively. Logarithm transformation was performed for the MEG source magnitude images, and the effects of age and gender were regressed out when constructing the normative database (see Methods and materials section). Fig. 1 showed all brain voxels in the normative databases with different smoothing factors that survived the K–S test for Gaussian distribution with the alpha value of 0.05. For a smoothing kernel of 2 mm FWHM, many cortical voxels did not meet the requirement of K–S test for Gaussian distribution, indicating under-smoothing. In contrast, for a smoothing kernel of 3 mm FWHM, the majority of brain areas in the normative database met the requirements of the K–S test. Some deep brain areas did not satisfy the requirement of Gaussian distribution for this smoothing kernel. This smoothing kernel provided the best positive detection rates of abnormal MEG slow-waves in mTBI (see below). For a smoothing kernel of 8 mm FWHM, almost the entire brain met the requirement of K–S test for Gaussian distribution. However, the detection rates of MEG abnormal slow-waves decreased using such a kernel (see result below), which indicated over-smoothing.
Fig. 1.

Brain voxels that survived the K–S test for Gaussian distribution in the normative MEG slow-wave database. Top row (yellow) was for 2 mm FWHM, middle row (green) for 3 mm FWHM, and bottom row (blue) for 8 mm FWHM. Left column (transverse plane), middle column (coronal plane), right column (sagittal plane).
Fig. 2 shows the Zcmax values (see Methods and materials section) obtained from MEG source magnitude source imaging, plotted separately for 1) healthy control, 2) mild blast-induced TBI, and 3) mild non-blast TBI. There was minimal overlap of the Zcmax values between each TBI group and the healthy control group, with the patients in all TBI groups showing markedly higher slow-wave Zcmax values than the healthy control subjects. Such results provide the foundation for assessing abnormality in mTBI using MEG slow-wave source imaging on a single-subject basis.
Fig. 2.

Zcmax values obtained from MEG source imaging for 1–4 Hz are plotted separately for 1) healthy control, 2) mild blast-induced TBI, and 3) mild non-blast-induced TBI, groups respectively. The embedded plot: the Youden index is plotted as a function of the Zcmax cutoff. The solid and dashed lines in both plots indicate cutoff values of 2.50 and 2.35, respectively.
The optimal cutoff (threshold) for Zcmax was obtained from the Youden's index curve (embedded plot in Fig. 2) using 79 healthy controls and 84 mTBI patients (blast plus non-blast). The cutoff value associated with the peak of the Youden's index was 2.35 (dashed lines in Fig. 2 and embed) which corresponded to specificity (1 — false-positive rate) of 98.7%. We chose a little more conservative cutoff value of 2.50 (solid lines in Fig. 2 and embed) which corresponded to specificity of 100% (i.e., 0 false positive rate, no healthy control subjects showed Zcmax value above this threshold). With this threshold (solid horizontal line in Fig. 2), the positive detection rates (i.e., sensitivity values) were 86.1%, 83.3%, and 84.5% for blast-induced, non-blast, and combined (blast-induced plus non-blast) mTBI groups, respectively.
With such positive detection rates of the MEG slow-wave source imaging approach, the difference between each mTBI group and the healthy control group was expected to be highly significant (but not necessarily among different mTBI groups). Two-tailed t-tests confirmed that in comparison to the healthy control group, the Zcmax values are indeed significantly higher in the mild blast-induced TBI (t = 9.3, p < 10− 14), and in the mild non-blast TBI (t = 10.4, p < 10− 17) groups. However, there were no significant differences in the Zcmax values between the two mTBI groups.
3.2. Results from individual mTBI cases using single-subject-based analysis
Although the analysis using Zcmax provides crucial information for positive detection rate that may assist in diagnosis, it does not address the loci and characteristics of abnormal slow-wave generation in individual TBI patients. The voxel-based framework based on Fast-VESTAL MEG source images (see Methods and materials section) provides a viable single-subject-based analysis for identifying the sources of abnormal MEG slow-wave generation in individual mTBI patients. Fig. 3 shows the results of single-subject-based analysis revealing statistically abnormal MEG slow-wave generation from 6 representative mTBI cases. The results were shown in MNI space. The abnormal MEG slow-wave sources were heterogeneous in locations across these mTBI patients. In Case 1, single-subject-based analysis showed abnormal MEG slow-waves from two right superior frontal areas. In Case 2, the abnormal slow-waves were from right dorsal–lateral pre-frontal cortex (DLPFC) and right ventral temporal pole areas. In Case 3, bilateral frontal pole, DLPFC, and right occipital areas showed abnormal slow-waves. In Case 4, two areas within left DLPFC and one area in ventral posterior temporal lobe generated abnormal MEG slow-waves. In Case 5, posterior parietal lobe, DLPFC, frontal pole (FP), and cerebellum, all in right hemisphere generated abnormal slow-waves. Finally, bilateral inferior temporal lobe and midline orbital frontal cortex (OFC) showed abnormal slow-waves in Case 6.
Fig. 3.

Single-subject-based analysis showing statistically abnormal MEG source-wave sources in representative mTBI cases. Left column (transverse plane), middle column (coronal plane), right column (sagittal plane).
3.3. Percent likelihood maps of abnormal MEG slow-wave generation in mTBI
Although the location of slow-wave generation is highly heterogeneous in locations across mTBI patients, analysis was performed to identify common brain areas that likely generate abnormal MEG slow-waves in mTBI, by following the procedure described previously in Methods and materials section. The percent likelihood maps of abnormal MEG slow-wave generation shown in Fig. 4 revealed that the overall percent likelihood level from any specific brain area was low (5%–15%, see color scale). However, the following areas showed higher likelihood than the rest of the brain for generating abnormal slow-waves: bilateral DLPFC, bilateral ventral lateral prefrontal cortex (VLPFC), bilateral FP, right OFC, left inferior–lateral–posterior parietal lobe, bilateral inferior temporal lobes, right hippocampus, and bilateral cerebella.
Fig. 4.

Voxel-based maps showing the percent likelihood of abnormal MEG slow-wave generation across the whole brain.
3.4. The effects of over-smoothing
In the previous section we observed that the under-smoothing with a Gaussian a kernel of 2 mm FWMH resulted in many voxels not surviving the K–S test for Gaussian distribution in the normative database. Here, we examined the impact of the over-smoothing to the positive detection rates in MEG slow-wave source imaging approach, using a smoothing kernel of 8 mm FWMH. With this smoothing kernel and cutoff value chosen at 100% specificity, the positive detection rates of MEG slow-wave imaging as measured by Zcmax decreased to 27.7% for the blast mTBI group, 31.3% for the non-blast mTBI group, and 29.8% for the combined mTBI group. These values are markedly lower than those obtained using the 3 mm FWMH Gaussian smoothing kernel reported in previous section. Nevertheless, even with this 8 mm FWMH smoothing kernel, both the blast mTBI and non-blast mTBI groups still showed significantly higher Zcmax than the healthy control group: t = 3.8, p < 10− 3 for blast mTBI patients versus control subjects; t = 5.1, p < 10− 5 for non-blast mTBI patients versus control subjects. There was no significant group difference in Zcmax between blast and non-blast mTBI groups with the 8 mm smoothing kernel.
3.5. MEG slow-wave measures correlated with PCS in mTBI
Correlational analyses of MEG slow-wave measures and PCS were performed in the blast as well as non-blast mTBI groups. In the blast mTBI group, the Zcmax values positively correlated with anxiety (r = 0.41, p < 0.05 uncorrected), and apathy (r = 0.37, p < 0.05 uncorrected). In the non-blast mTBI group, the Zcmax values positively correlated with trouble with sleep (r = 0.29, p < 0.05, uncorrected). However, none of the correlations survived FDR correction.
In contrast, significant correlations (Fig. 5) were found with the voxel-based correlational analysis between MEG source magnitude (Z values in MNI-152 coordinates) and PCS scores. In the blast mTBI group, personality change symptoms (e.g., social problems) positively correlated with MEG slow-wave generation in bilateral OFC and ventromedial prefrontal cortex (vmPFC); trouble concentrating and affective lability (quickly-changing emotions) symptoms both positively correlated with slow-wave generation in right OFC; blurred vision or other visual difficulties symptoms positively correlated with slow-wave generation in right fusiform gurus. Fig. 5 also shows that in the non-blast mTBI group, depression symptoms positively correlated with slow-wave generation in anterior cingulate cortex (ACC). When combining the blast and non-blast mTBI groups, only MEG source magnitude from the right OFC was positively correlated with the symptoms of trouble concentrating in the combined pool (not shown). The threshold of the voxel-based analyses was at the corrected p = 0.05 by FDR.
Fig. 5.
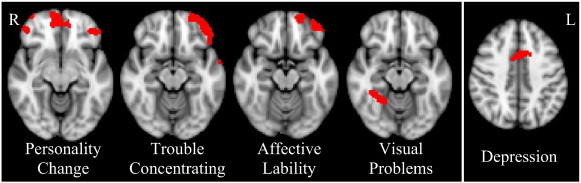
MEG slow-wave source magnitude significantly correlated with PCS in blast mTBI group (first 4 panels) and non-blast mTBI group (last panel). FDR corrected p < 0.05.
4. Discussion
4.1. Detection sensitivity on an individual level
Using the automated voxel-based MEG source imaging approach (Fig. 2), we found abnormal delta-waves in 86.1% of blast mTBI, 83.3% the non-blast mTBI, and 84.5% for all mild TBI patients (blast-induced plus non-blast causes). All mTBI patients were symptomatic with ongoing PCS at the time of the MEG exam. These positive detection rates were markedly higher than the < 10% rate using the conventional neuroimaging approach (i.e., MRI) in the same mTBI patients. Furthermore, the positive MRI findings in our mTBI patients could not be attributed to the head trauma alone because similar MRI abnormalities were also shown in subjects without a history of TBI. Our results are consistent with findings from previous MEG studies in mTBI using dipole fit to hand-selected slow-wave epochs (Lewine et al., 1999, Lewine et al., 2007). The resting-state MEG recording procedure is spontaneous, requires minimal effort from TBI patients, and is thus insensitive to patients' performance and effort. We controlled for any other factors that may increase slow-wave power such as neuroleptic, sedative, or hypnotic medications, sleep deprivation, as well as other neurological disorders (stroke, epilepsy, brain tumor, etc.). These results corroborate well-documented EEG findings reporting that focal delta-waves signify the presence of brain injury in alert, awake adults (Fisch, 1999, Rowan and Tolunsky, 2003). Thus, our findings underscore the diagnostic utility of our automated and voxel-based MEG slow-wave source imaging, based on Fast-VESTAL, particularly for mTBI.
4.2. MEG slow-wave activity associated with PCS
It is also interesting that the voxel-based correlational analyses (Fig. 5) showed that slow-wave generation in areas that are part of the ventral prefrontal cortex (i.e., OFC and vmPFC) positively correlated with personality change, trouble concentrating, and affective lability symptoms in the blast mTBI group. In addition, slow-wave generation from the ACC positively correlated with depression in the non-blast mTBI group. Many of these symptoms are psychiatric-based risk factors. Present findings are consistent with studies showing that mTBI increases the likelihood of developing psychiatric-based symptoms, or in some patients, is associated with the development of psychiatric disorders (for reviews, see Bryant et al., 2010, Schwarzbold et al., 2008).
Present findings are also consistent with knowledge that damage to the prefrontal areas may affect executive functions, emotion, mood, as well social behavior regulation (Carlson, 2013, Kandel et al., 2000). This may be because these areas have rich connections to many cortical and subcortical areas. For example, the vmPFC is connected to and receives input from the ventral tegmental area, amygdala, temporal lobe, olfactory system, and dorsomedial thalamus. In turn, the vmPFC sends signals to amygdala, temporal lobe, lateral hypothalamus, hippocampal formation, cingulate cortex, and other regions of the prefrontal cortex (Carlson, 2013). On the other hand, the OFC shares extensive reciprocal connections with primary and associated somatosensory, auditory, and visual cortices, as well as areas in the limbic system (e.g., hippocampus, amygdala, thalamus, hypothalamus, and cingulate gyrus), and projects to the motor areas reflecting integration for executive motor control (Carlson, 2013). The abnormal slow-wave generation from the OFC that was associated with trouble concentrating may suggest a deficit of sensory integration due to mTBI. In addition, the association between slow-wave generation from the right fusiform gyrus and the symptoms of blurred vision or other visual difficulties in the blast mTBI group is consistent with studies showing that the fusiform gyrus is important in face, object, and body recognition and processing (Downing et al., 2001, Kanwisher et al., 1997, Sergent et al., 1992, Weiner and Grill-Spector, 2010). A meta-analysis showing that facial affect recognition difficulty is common after TBI (Babbage et al., 2011) is also consistent with present findings.
Using the dipole location density method, Wienbruch (2007) examined healthy subjects and reported that male subjects had significantly higher frontal-central MEG slow-wave generation near ACC than female subjects. The present study corrected for both age and gender when calculating the Fast-VESTAL source-magnitude Z scores. As such, our finding of ACC MEG slow-wave activity positively correlation with depression in the non-blast mTBI group was controlled for gender and age. Nevertheless, there were more males than females (67 versus 12) in our healthy control group (same for the two mTBI groups) when constructing our normative database. This was because we needed to balance our blast mTBI group which contained all males by using the same normative database for assessing patients in both the blast and non-blast mTBI groups. Future study with symmetrical design (more females) in all three groups will be needed to thoroughly address if and how gender modulates these findings.
Using the same dipole location density method, Rockstroh and colleagues examined MEG slow-waves in inpatients with schizophrenia and affective disorders (Rockstroh et al., 2007). They found that inpatients with schizophrenia had more slow-wave generators with maxima in frontal and central areas, whereas inpatients with affective disorder had fewer slow-wave generators in similar frontal and central regions. In the present study, MEG slow-wave activity in ACC positively correlated with depression symptoms in the non-blast mTBI patients. Although depression is a common symptom across schizophrenia, affective disorders, and mTBI, direct comparison between findings from the study by Rockstroh and colleagues and the present study is difficult due to the following two factors: 1) these are three different brain disorders; 2) all subjects with schizophrenia and affective disorder in the study by Rockstroh and colleagues were inpatients treated by a variety of medications including the neuroleptics, whereas all of our mTBI outpatients were free of sedative, neuroleptic, and hypnotic medications (see exclusion criteria). Future studies in which the effects of medications are controlled will be needed to address the correlation between abnormal slow-wave generation and common symptomology (such as depression) across different disorders.
It is not clear what accounts for the different correlation patterns between MEG slow-wave source imaging and TBI symptomatology in the blast versus non-blast mTBI groups (Fig. 5). In particular, it is not clear why more brain areas showed a significant correlation between MEG and mTBI symptoms in the blast mTBI group than in the non-blast mTBI group. We speculate that as a common cause in the former group, blast may contribute to our findings. However, future study is needed to confirm or disprove this hypothesis.
4.3. Diffused nature and “vulnerable” regions for mTBI
The present study also revealed the diffuse nature of the neuronal injuries in TBI patients (Fig. 3, Fig. 4). Such findings are consistent with the mechanism of diffuse axonal injury in TBI due to a combination of linear and rotational acceleration and deceleration (Adams et al., 1989, Arfanakis et al., 2002, Basser, 1995, Huisman et al., 2004, Niogi and Mukherjee, 2010, Niogi et al., 2008a, Xu et al., 2007). The results are also consistent with our previous findings that abnormal MEG slow-waves are generated from cortical gray-matter areas that connect to white-matter fibers with reduced DTI fractional anisotropy due to axonal injury in patients with mTBI (Huang et al., 2009). The diffuse nature of MEG slow-wave generation is also consistent with a DTI study in blast mTBI subjects which showed reduced FA in a diffuse, widespread, and spatially variable pattern (Davenport et al., 2012).
Although the location of slow-wave generation is highly variable across mTBI patients (see Fig. 3), in the present study analysis was performed to identify common brain areas that likely generate abnormal MEG slow-waves in mTBI (see Fig. 4). Multiple regions in the frontal lobes (i.e., DLPFC, VLPFC, FP, and OFC) were more likely than other brain regions to generate abnormal MEG slow-waves, which suggested that the frontal lobe is probably the most vulnerable lobe to head trauma. In addition, the posterior parietal lobe, inferior temporal lobes, hippocampus, and cerebella also have a relatively higher likelihood for generating abnormal MEG slow-waves than other brain areas, indicating that these regions are also particularly vulnerable to head trauma. A forthcoming study that correlates the MEG slow-wave with cognitive functions in mTBI will examine the connection of slow-wave generation and abnormal brain function (Robb et al., in preparation).
4.4. Neuronal mechanisms of abnormal slow-waves
Neurophysiological studies in animals have shown that cortical deafferentation caused by axonal lesions in WM is an important factor in pathological delta-wave production in GW (Ball et al., 1977, Gloor et al., 1977). We believe that the cortical deafferentation caused by axonal injury is the main mechanism for abnormal MEG slow-wave generation in mTBI. However, pathological delta-wave production can also be induced by deafferentation following the administration of atropine in WM in animals (Schaul et al., 1978). It is known that atropine is a competitive antagonist of acetylcholine receptors and can block and/or limit the cholinergic pathway. So the electrophysiological similarity of lesion-induced and atropine-induced slow waves raises the possibility that a defect in cholinergic pathways plays a role in pathological slow-wave generation (Schaul, 1998). It is possible that the abnormal MEG slow-waves in mTBI from the present study were partially due to blockage and/or limitation of cholinergic transmission after TBI, in addition to axonal injury in WM. In the human brain, the projections of cholinergic pathways highly overlap with the WM fiber tracts (Selden et al., 1998), which make the cholinergic pathways similarly susceptible as WM tracts to rotational forces during head trauma. Like axonal injury, blockage and/or limitation of cholinergic transmission may result in cortical deafferentation and pathological slow waves that are expected to affect human brain function in mTBI patients.
Abnormal slow waves are not the only abnormal findings in TBI. A recent MEG study in a group with mixing mild, moderate, and severe TBI patients showed reduced functional connectivity primarily in bilateral frontal and left greater than right parieto-temporo-occipital regions as well as the right thalamus (Tarapore et al., 2013). Another recent MEG study in sensor space also showed a reduced level of complexity in mild TBI patients (Luo et al., 2013). In a future study, we will examine the relationships between MEG slow-wave generation and functional connectivity in different frequency bands in mTBI.
4.5. Voxel-based versus ROI approaches
The MEG results using the new voxel-based Fast-VESTAL approach were similar to our previous ROI-approach frequency-domain VESTAL which showed positive detection rate of 87% (Huang et al., 2012), however larger groups of mTBI patients were examined in the present study. Furthermore, the voxel-based Fast-VESTAL approach overcomes the main limitations of variable sensitivity associated with our previous ROI-based approach using frequency-domain VESTAL (Huang et al., 2012). The spatial-sensitivity of the voxel-based approach is more uniformly distributed across the brain volume whereas the sizes of 96 cortical ROIs in previous ROI-based approach varied substantially from one ROI to another. Second, as shown in Fig. 3, the voxel-based MEG source images can be informative, with good spatial resolution, in assessing the abnormal slow-waves on a single-subject-basis. In mTBI patients, it was common that multiple regions generated abnormal slow-waves. It has been shown that VESTAL and Fast-VESTAL approaches can localize neuronal sources with a variety of spatial profiles (e.g., focal, multi-focal, dipolar, and distributed) and a variety of temporal profiles (e.g., uncorrelated, partially-correlated, and 100% correlated source time-courses) (Huang et al., 2006, Huang et al., 2014). Generators of abnormal slow-waves in mTBI patients can be in one or more of the above spatial-and-temporal profiles (Huang et al., 2009), and Fast-VESTAL based MEG source imaging is ideal to handle such variability. Third, the voxel-based framework of MEG source imaging using Fast-VESTAL (Huang et al., 2014) allows us to implement many imaging-processing and statistical-analysis tools from existing software packages (FSL, AFNI, Freesurfer, etc.) that were previously designed for other functional (e.g., fMRI and PET) or structural neuroimaging techniques.
4.6. Effect of spatial-smoothing factor
In the present study we have shown that the spatial smoothing factor in MEG source imaging plays an important role in the positive detection rate of abnormal slow waves. Although group differences were preserved, high spatial smoothing using 8 mm FWHM kernel markedly reduced the positive detection rate of abnormal slow waves compared with the result using the 3 mm smoothing kernel. This finding suggests that the abnormal MEG slow-wave generation may be more of a local effect, and MEG source analysis methods with high spatial resolution may be essential in detecting abnormal slow waves in mTBI. In the present study, a MEG source imaging method with high spatial resolution (i.e., Fast-VESTAL) was used to analyze resting-state MEG data in mTBI. Previous MEG studies by Lewine and colleagues used dipole modeling (another MEG source analysis with focal source modeling) and found abnormal slow waves in 65%-86% of mTBI patients (Lewine et al., 1999, Lewine et al., 2007). Despite the robust group differences in scalp EEG, the positive detection rate of abnormal slow-waves using scalp EEG was substantially lower than that with MEG (Lewine et al., 1999). Differences in positive detection rates may be due to the smearing effect of the skull tissue, which with its poor conductivity substantially distorted the electric fields and reduced the spatial resolution of the EEG signal during scalp recording; whereas, head tissues are essentially transparent to MEG signals.
4.7. MEG source imaging with Fast-VESTAL versus other approaches
In the present study, Fast-VESTAL method plays an essential role in assessing the source magnitude differences in mTBI. It was shown that Fast-VESTAL can: 1) provide high resolution source images for multiple correlated sources; 2) faithfully recover source time-courses; 3) perform robustly in poor SNR conditions; 4) handle correlated brain noise; and 5) effectively create resting-state MEG source images that are highly consistent with known neurophysiology findings (Huang et al., 2014). We have also shown that for resting-state MEG signals, the source magnitude images obtained with beamformer technique (a popular MEG source analysis method) were not as consistent with neurophysiology findings as those from Fast-VESTAL (Huang et al., 2014). This is likely due to beamformer's intrinsic limitation which assumes that the neuronal sources are uncorrelated (Robinson and Vrba, 1999, Sekihara et al., 2001, Van Veen et al., 1997), a questionable assumption when dealing with resting-state MEG signals.
Wienbruch introduced a different voxel-based resting-state MEG source analysis approach, in which a sequential single dipole model was used to fit MEG signal for each time point (i.e., single equivalent current dipoles were fitted for each time point). The dipoles with goodness-of-fit (GoF) > 0.9 were kept. Then, voxel-based dipole location density measure was used to establish a normative database, and a Z-score statistics was used to assess abnormalities. Our Fast-VESTAL source imaging approach improves upon the seminal work in this area by Wienbruch (2007) in two ways. First, the approach by Wienbruch is less able to handle time points where multiple sources contribute simultaneously to the MEG measures. For example, in many such cases, the GoF with a single sequential dipole model would be less than the 0.9 threshold, and such that those time points would be discarded from further analysis in Wienbruch's approach. With the Fast-VESTAL approach, all time points free of artifacts are used in the analysis since Fast-VESTAL is designed to model multiple highly correlated sources simultaneously. Second, the dipole location density measure from Wienbruch's approach does not directly take into consideration of the strength differences in the sequential dipoles. For example, two dipoles with different strengths (e.g., one is twice as strong as the other) that both meet the GoF threshold would contribute equally to the dipole location density measure. In contrast, Fast-VESTAL directly assesses the source magnitude differences at all grid locations, which is also a key feature that differentiates the MEG signals from one subject to another.
In the dipole-fitting approach, the basic assumption is that the neuronal generators of MEG signals are focal and can be modeled by one or a few dipoles. The dipole location and dipole moment parameters are determined by an over-determined non-linear optimization procedure. In fact, an automated multi-dipole approach “multi-start spatio-temporal” method was developed in our lab in the past to model multiple dipoles without the requirements of the initial guess of the dipole locations (Huang et al., 1998, Huang et al., 2005). However, all dipole modeling techniques require the number of dipoles to be pre-estimated, and the non-linear optimization procedure becomes extremely high in computational cost and may be trapped into local minima when the number of dipoles increases. Usually, 8–10 dipoles are the upper limit that the dipole-fitting methods can handle (Huang et al., 2005).
In the Fast-VESTAL approach, the brain volume, or just the cortex is pre-divided into a source grid with several thousand nodes, and a dipole is assigned to each grid node. Fast-VESTAL fits the MEG sensor waveforms while minimizing the total current across all grid nodes to reduce the ambiguity of the multiple plausible solutions. Fast-VESTAL identifies the grid nodes with neuronal activity with high resolution, and suppresses the magnitude at the grid nodes without neuronal activity to essentially zero (Huang et al., 2014). The Fast-VESTAL procedure is efficient in computational cost, can handle many correlated as well as uncorrelated dipolar sources, and is not trapped in the “local minima”. Robust control mechanisms were built into the Fast-VESTAL algorithm to fit the brain signal and to prevent the algorithm from fitting correlated and/or uncorrelated noise (Huang et al., 2014).
In the MEG responses that are known to contain a few focal neuronal generators (e.g., in the case of human somatosensory responses evoked by median-nerve stimuli), both Fast-VESTAL and multiple-dipole fitting approaches produced sparse solutions that are very similar in location and source time-course, and both solutions are consistent with previous neurophysiological findings (Huang et al., 2005, Huang et al., 2014). In a sense, Fast-VESTAL is a more effective and improved way in finding a sparse solution over the multiple-dipole fit. However, systematic comparisons of Fast-VESTAL, dipole-fitting methods including the single-sequential-dipole fit (Wienbruch, 2007) and multiple-dipole fit (Huang et al., 1998, Huang et al., 2005), and physiology approaches are an interesting research topic for the future, but are currently beyond the scope of the present study.
In summary, the present study examined the sensitivity of our new automated voxel-based whole-brain MEG slow-wave imaging approach based on Fast-VESTAL for detecting abnormality in patients with mild TBI on a single-subject basis. The results show that this MEG slow-wave source imaging method achieves a positive detection rate of 84.5% for the mTBI group (blast-induced plus non-blast) with the threshold chosen at a zero false positive rate. The results showed that although abnormal MEG slow-wave generations in individual mTBI patients were highly variable in space with a diffuse characteristic, the prefrontal lobe, posterior parietal lobe, inferior temporal lobe, hippocampus, and cerebella were particularly vulnerable to head trauma. The result also showed that MEG slow-wave generation in prefrontal areas positively correlated with personality change, trouble concentrating, affective lability, and depression symptoms. In addition, we found that a high spatial smoothing factor can reduce the positive detection rate of abnormal MEG slow-waves in mTBI, which suggests that MEG source analysis methods with high spatial resolution may be essential for mTBI study. We believe the potential neuronal mechanisms of MEG slow-wave generation were the deafferentations caused by axonal injury and/or blockages/limitations of cholinergic transmission in TBI. This study provides support for using MEG slow-wave source imaging to localize affected areas and highlights the potential use of this methodology for the clinical diagnosis of mTBI.
Acknowledgments
This work was supported in part by Merit Review Grants from the Department of Veterans Affairs to M.X. Huang (I01-CX000499, NURC-022-10F, NEUC-044-06S), D.L. Harrington (I01-CX000146), National Football League Charity Grant (20105076, M.X. Huang and R.R. Lee), McDonnell Foundation via Brain Trauma Foundation (220020185, PI: J. Ghajar, site PIs: R.R. Lee and M.X. Huang), and MRS-II (Navy BUMED contract #N62645-11-C-4037) from Headquarters Marine Corps (D.G. Baker, M.A. Geyer, M.X. Huang, V.B. Risbrough). We acknowledge the MRS-II administrative core, Anjana Patel, Andrew De La Rosa, and members of the MRS-II Team, including logistic coordinators, clinician–interviewers, and data collection staff. We thank the staff at the Veterans Medical Research Foundation (VRMF). We also thank the Marine and veteran volunteers for military service and participation in this study.
References
- Adams J.H., Doyle D., Ford I., Gennarelli T.A., Graham D.I., McLellan D.R. Diffuse axonal injury in head injury: definition, diagnosis and grading. Histopathology. 1989;15:49–59. doi: 10.1111/j.1365-2559.1989.tb03040.x. [DOI] [PubMed] [Google Scholar]
- Alexander M.P. Mild traumatic brain injury: pathophysiology, natural history, and clinical management. Neurology. 1995;45:1253–1260. doi: 10.1212/wnl.45.7.1253. [DOI] [PubMed] [Google Scholar]
- Arfanakis K., Haughton V.M., Carew J.D., Rogers B.P., Dempsey R.J., Meyerand M.E. Diffusion tensor MR imaging in diffuse axonal injury. AJNR Am. J. Neuroradiol. 2002;23:794–802. [PMC free article] [PubMed] [Google Scholar]
- Babbage D.R., Yim J., Zupan B., Neumann D., Tomita M.R., Willer B. Meta-analysis of facial affect recognition difficulties after traumatic brain injury. Neuropsychology. 2011;25:277–285. doi: 10.1037/a0021908. [DOI] [PubMed] [Google Scholar]
- Ball G.J., Gloor P., Schaul N. The cortical electromicrophysiology of pathological delta waves in the electroencephalogram of cats. Electroencephalogr. Clin. Neurophysiol. 1977;43:346–361. doi: 10.1016/0013-4694(77)90258-9. [DOI] [PubMed] [Google Scholar]
- Basser P.J. Inferring microstructural features and the physiological state of tissues from diffusion-weighted images. NMR Biomed. 1995;8:333–344. doi: 10.1002/nbm.1940080707. [DOI] [PubMed] [Google Scholar]
- Basser P.J., Pierpaoli C. Microstructural and physiological features of tissues elucidated by quantitative-diffusion-tensor MRI. J. Magn. Reson., Ser. B. 1996;111:209–219. doi: 10.1006/jmrb.1996.0086. [DOI] [PubMed] [Google Scholar]
- Benjamini Y., Hochberg Y. Controlling the false positive rate: a practical and powerful approach to multiple testing. J. R. Stat. Soc. Ser. B. 1995;57:289–300. [Google Scholar]
- Bigler E.D., Orrison W.W. Neuroimaging in sports-related brain injury. In: Lovell M.R., Echemendia R.J., Barth J.T., Collins M.W., editors. Traumatic Brain Injury in Sports: An International Perspective. Lisse, Netherlands; Swets and Zeitlinger: 2004. pp. 71–94. [Google Scholar]
- Binder L.M. Persisting symptoms after mild head injury: a review of the postconcussive syndrome. J. Clin. Exp. Neuropsychol. 1986;8:323–346. doi: 10.1080/01688638608401325. [DOI] [PubMed] [Google Scholar]
- Binder L.M. A review of mild head trauma. Part II: clinical implications. J.Clin.Exp.Neuropsychol. 1997;19:432–457. doi: 10.1080/01688639708403871. [DOI] [PubMed] [Google Scholar]
- Bohnen N., Jolles J., Twijnstra A. Neuropsychological deficits in patients with persistent symptoms six months after mild head injury. Neurosurgery. 1992;30:692–695. [PubMed] [Google Scholar]
- Bryant R.A., O'Donnell M.L., Creamer M., McFarlane A.C., Clark C.R., Silove D. The psychiatric sequelae of traumatic injury. Am. J. Psychiatry. 2010;167:312–320. doi: 10.1176/appi.ajp.2009.09050617. [DOI] [PubMed] [Google Scholar]
- Carlson N.R. 11 ed. Pearson; Boston: 2013. Physiology of Behavior. [Google Scholar]
- Centers for Disease Control, Prevention, National Center for Injury Prevention, Control . Report to Congress on Mild Traumatic Brain Injury in the United States: Steps to Prevent a Serious Public Health Problem. Centers for Disease Control and Prevention; Atlanta, GA, USA: 2003. [Google Scholar]
- Cernak I., Noble-Haeusslein L.J. Traumatic brain injury: an overview of pathobiology with emphasis on military populations. J. Cereb. Blood Flow Metab. 2010;30:255–266. doi: 10.1038/jcbfm.2009.203. [DOI] [PMC free article] [PubMed] [Google Scholar]
- Cohen D., Schläpfer U., Ahlfors S., Hämäläinen M., Halgren E. New six-layer magnetically-shielded room for MEG. In: Nowak H.H.J., Gießler F., editors. Proceedings of the 13th International Conference on Biomagnetism. VDE Verlag; Jena, Germany: 2002. pp. 919–921. [Google Scholar]
- Culotta V.P., Sementilli M.E., Gerold K., Watts C.C. Clinicopathological heterogeneity in the classification of mild head injury. Neurosurgery. 1996;38:245–250. doi: 10.1097/00006123-199602000-00002. [DOI] [PubMed] [Google Scholar]
- Davenport N.D., Lim K.O., Armstrong M.T., Sponheim S.R. Diffuse and spatially variable white matter disruptions are associated with blast-related mild traumatic brain injury. Neuroimage. 2012;59:2017–2024. doi: 10.1016/j.neuroimage.2011.10.050. [DOI] [PubMed] [Google Scholar]
- Dikmen S.S., Ross B.L., Machamer J.E., Temkin N.R. One year psychosocial outcome in head injury. J. Int. Neuropsychol. Soc. 1995;1:67–77. doi: 10.1017/s1355617700000126. [DOI] [PubMed] [Google Scholar]
- Downing P.E., Jiang Y., Shuman M., Kanwisher N. A cortical area selective for visual processing of the human body. Science. 2001;293:2470–2473. doi: 10.1126/science.1063414. [DOI] [PubMed] [Google Scholar]
- Elder G.A., Mitsis E.M., Ahlers S.T., Cristian A. Blast-induced mild traumatic brain injury. Psychiatr. Clin. North Am. 2010;33:757–781. doi: 10.1016/j.psc.2010.08.001. [DOI] [PubMed] [Google Scholar]
- Fisch B.J. Elsevier; 1999. Fisch and Spehlmann's EEG Primer: Basic Principles of Digital and Analog EEG. [Google Scholar]
- Garman R.H., Jenkins L.W., Switzer R.C., III, Bauman R.A., Tong L.C., Swauger P.V., Parks S.A., Ritzel D.V., Dixon C.E., Clark R.S., Bayir H., Kagan V., Jackson E.K., Kochanek P.M. Blast exposure in rats with body shielding is characterized primarily by diffuse axonal injury. J. Neurotrauma. 2011;28:947–959. doi: 10.1089/neu.2010.1540. [DOI] [PubMed] [Google Scholar]
- Gennarelli T.A., Thibault L.E., Adams J.H., Graham D.I., Thompson C.J., Marcincin R.P. Diffuse axonal injury and traumatic coma in the primate. Ann. Neurol. 1982;12:564–574. doi: 10.1002/ana.410120611. [DOI] [PubMed] [Google Scholar]
- Gloor P., Ball G., Schaul N. Brain lesions that produce delta waves in the EEG. Neurology. 1977;27:326–333. doi: 10.1212/wnl.27.4.326. [DOI] [PubMed] [Google Scholar]
- Huang M., Aine C.J., Supek S., Best E., Ranken D., Flynn E.R. Multi-start downhill simplex method for spatio-temporal source localization in magnetoencephalography. Electroencephalogr. Clin. Neurophysiol. 1998;108:32–44. doi: 10.1016/s0168-5597(97)00091-9. [DOI] [PubMed] [Google Scholar]
- Huang M.X., Lee R.R., Miller G.A., Thoma R.J., Hanlon F.M., Paulson K.M., Martin K., Harrington D.L., Weisend M.P., Edgar J.C., Canive J.M. A parietal–frontal network studied by somatosensory oddball MEG responses, and its cross-modal consistency. Neuroimage. 2005;28:99–114. doi: 10.1016/j.neuroimage.2005.05.036. [DOI] [PubMed] [Google Scholar]
- Huang M.X., Dale A.M., Song T., Halgren E., Harrington D.L., Podgorny I., Canive J.M., Lewis S., Lee R.R. Vector-based spatial–temporal minimum L1-norm solution for MEG. Neuroimage. 2006;31:1025–1037. doi: 10.1016/j.neuroimage.2006.01.029. [DOI] [PubMed] [Google Scholar]
- Huang M.X., Song T., Hagler D.J., Jr., Podgorny I., Jousmaki V., Cui L., Gaa K., Harrington D.L., Dale A.M., Lee R.R., Elman J., Halgren E. A novel integrated MEG and EEG analysis method for dipolar sources. Neuroimage. 2007;37:731–748. doi: 10.1016/j.neuroimage.2007.06.002. [DOI] [PMC free article] [PubMed] [Google Scholar]
- Huang M.X., Theilmann R.J., Robb A., Angeles A., Nichols S., Drake A., D'Andrea J., Levy M., Holland M., Song T., Ge S., Hwang E., Yoo K., Cui L., Baker D.G., Trauner D., Coimbra R., Lee R.R. Integrated imaging approach with MEG and DTI to detect mild traumatic brain injury in military and civilian patients. J. Neurotrauma. 2009;26:1213–1226. doi: 10.1089/neu.2008.0672. [DOI] [PubMed] [Google Scholar]
- Huang M.X., Nichols S., Robb A., Angeles A., Drake A., Holland M., Asmussen S., D'Andrea J., Chun W., Levy M., Cui L., Song T., Baker D.G., Hammer P., McLay R., Theilmann R.J., Coimbra R., Diwakar M., Boyd C., Neff J., Liu T.T., Webb-Murphy J., Farinpour R., Cheung C., Harrington D.L., Heister D., Lee R.R. An automatic MEG low-frequency source imaging approach for detecting injuries in mild and moderate TBI patients with blast and non-blast causes. Neuroimage. 2012;61:1067–1082. doi: 10.1016/j.neuroimage.2012.04.029. [DOI] [PubMed] [Google Scholar]
- Huang M.X., Huang C.W., Robb A., Angeles A., Nichols S.L., Baker D.G., Song T., Harrington D.L., Theilmann R.J., Srinivasan R., Heister D., Diwakar M., Canive J.M., Edgar J.C., Chen Y.H., Ji Z., Shen M., El-Gabalawy F., Levy M., McLay R., Webb-Murphy J., Liu T.T., Drake A., Lee R.R. MEG source imaging method using fast L1 minimum-norm and its applications to signals with brain noise and human resting-state source amplitude images. Neuroimage. 2014;84:585–604. doi: 10.1016/j.neuroimage.2013.09.022. [DOI] [PMC free article] [PubMed] [Google Scholar]
- Huisman T.A., Schwamm L.H., Schaefer P.W., Koroshetz W.J., Shetty-Alva N., Ozsunar Y., Wu O., Sorensen A.G. Diffusion tensor imaging as potential biomarker of white matter injury in diffuse axonal injury. AJNR Am. J. Neuroradiol. 2004;25:370–376. [PMC free article] [PubMed] [Google Scholar]
- Jeter C.B., Hergenroeder G.W., Hylin M.J., Redell J.B., Moore A.N., Dash P.K. Biomarkers for the diagnosis and prognosis of mild traumatic brain injury/concussion. J. Neurotrauma. 2013;30:657–670. doi: 10.1089/neu.2012.2439. [DOI] [PubMed] [Google Scholar]
- Johnston K.M., Ptito A., Chankowsky J., Chen J.K. New frontiers in diagnostic imaging in concussive head injury. Clin. J. Sport Med. 2001;11:166–175. doi: 10.1097/00042752-200107000-00007. [DOI] [PubMed] [Google Scholar]
- Kandel E.R., Schwartz J.H., Jessell T.M. 4 ed. McGraw-Hill; New York: 2000. Principles of Neural Science. [Google Scholar]
- Kanwisher N., McDermott J., Chun M.M. The fusiform face area: a module in human extrastriate cortex specialized for face perception. J. Neurosci. 1997;17:4302–4311. doi: 10.1523/JNEUROSCI.17-11-04302.1997. [DOI] [PMC free article] [PubMed] [Google Scholar]
- Kirkwood M.W., Yeates K.O., Wilson P.E. Pediatric sport-related concussion: a review of the clinical management of an oft-neglected population. Pediatrics. 2006;117:1359–1371. doi: 10.1542/peds.2005-0994. [DOI] [PubMed] [Google Scholar]
- Leahy R.M., Mosher J.C., Spencer M.E., Huang M.X., Lewine J.D. A study of dipole localization accuracy for MEG and EEG using a human skull phantom. Electroencephalogr. Clin. Neurophysiol. 1998;107:159–173. doi: 10.1016/s0013-4694(98)00057-1. [DOI] [PubMed] [Google Scholar]
- Levin H.S., Amparo E., Eisenberg H.M., Williams D.H., High W.M., Jr., McArdle C.B., Weiner R.L. Magnetic resonance imaging and computerized tomography in relation to the neurobehavioral sequelae of mild and moderate head injuries. J. Neurosurg. 1987;66:706–713. doi: 10.3171/jns.1987.66.5.0706. [DOI] [PubMed] [Google Scholar]
- Lewine J.D., Davis J.T., Sloan J.H., Kodituwakku P.W., Orrison W.W., Jr. Neuromagnetic assessment of pathophysiologic brain activity induced by minor head trauma. AJNR Am. J. Neuroradiol. 1999;20:857–866. [PMC free article] [PubMed] [Google Scholar]
- Lewine J.D., Davis J.T., Bigler E.D., Thoma R., Hill D., Funke M., Sloan J.H., Hall S., Orrison W.W. Objective documentation of traumatic brain injury subsequent to mild head trauma: multimodal brain imaging with MEG, SPECT, and MRI. J. Head Trauma Rehabil. 2007;22:141–155. doi: 10.1097/01.HTR.0000271115.29954.27. [DOI] [PubMed] [Google Scholar]
- Luo Q., Xu D., Roskos T., Stout J., Kull L., Cheng X., Whitson D., Boomgarden E., Gfeller J., Bucholz R.D. Complexity analysis of resting state magnetoencephalography activity in traumatic brain injury patients. J. Neurotrauma. 2013;30:1702–1709. doi: 10.1089/neu.2012.2679. [DOI] [PMC free article] [PubMed] [Google Scholar]
- MacGregor A.J., Dougherty A.L., Galarneau M.R. Injury-specific correlates of combat-related traumatic brain injury in operation Iraqi freedom. J. Head Trauma Rehabil. 2011;26:312–318. doi: 10.1097/HTR.0b013e3181e94404. [DOI] [PubMed] [Google Scholar]
- McLean A., Jr., Dikmen S., Temkin N., Wyler A.R., Gale J.L. Psychosocial functioning at 1 month after head injury. Neurosurgery. 1984;14:393–399. doi: 10.1227/00006123-198404000-00001. [DOI] [PubMed] [Google Scholar]
- Mosher J.C., Leahy R.M., Lewis P.S. EEG and MEG: forward solutions for inverse methods. IEEE Trans. Biomed. Eng. 1999;46:245–259. doi: 10.1109/10.748978. [DOI] [PubMed] [Google Scholar]
- Niedermeyer E., Lopes da Silva F.H. 5th ed. Lippincott Williams & Wilkins; Philadelphia, Baltimore, New York, London, Buenos Aires, Hong Kong, Sydney, Tokyo: 2005. Electroencephalography: Basic Principles, Clinical Applications, and Related Fields. [Google Scholar]
- Niogi S.N., Mukherjee P. Diffusion tensor imaging of mild traumatic brain injury. J. Head Trauma Rehabil. 2010;25:241–255. doi: 10.1097/HTR.0b013e3181e52c2a. [DOI] [PubMed] [Google Scholar]
- Niogi S.N., Mukherjee P., Ghajar J., Johnson C., Kolster R.A., Sarkar R., Lee H., Meeker M., Zimmerman R.D., Manley G.T., McCandliss B.D. Extent of microstructural white matter injury in postconcussive syndrome correlates with impaired cognitive reaction time: a 3T diffusion tensor imaging study of mild traumatic brain injury. AJNR Am. J. Neuroradiol. 2008;29:967–973. doi: 10.3174/ajnr.A0970. [DOI] [PMC free article] [PubMed] [Google Scholar]
- Niogi S.N., Mukherjee P., Ghajar J., Johnson C.E., Kolster R., Lee H., Suh M., Zimmerman R.D., Manley G.T., McCandliss B.D. Structural dissociation of attentional control and memory in adults with and without mild traumatic brain injury. Brain. 2008;131:3209–3221. doi: 10.1093/brain/awn247. [DOI] [PubMed] [Google Scholar]
- Rapoport M.J. Depression following traumatic brain injury: epidemiology, risk factors and management. CNS Drugs. 2012;26:111–121. doi: 10.2165/11599560-000000000-00000. [DOI] [PubMed] [Google Scholar]
- Rimel R.W., Giordani B., Barth J.T., Boll T.J., Jane J.A. Disability caused by minor head injury. Neurosurgery. 1981;9:221–228. [PubMed] [Google Scholar]
- Robinson S.E., Vrba J. Functional neuroimaging by synthetic aperture magnetometry (SAM) In: Yoshimoto T., Kotani M., Kuriki S., Karibe H., Nakasato N., editors. Recent Advances in Biomagnetism. Tohoku University Press; Sendai, Japan: 1999. pp. 302–305. [Google Scholar]
- Rockstroh B.S., Wienbruch C., Ray W.J., Elbert T. Abnormal oscillatory brain dynamics in schizophrenia: a sign of deviant communication in neural network? BMC. Psychiatry. 2007;7:44. doi: 10.1186/1471-244X-7-44. [DOI] [PMC free article] [PubMed] [Google Scholar]
- Rowan A.J., Tolunsky E. Butterworth Heinemann; 2003. Primer of EEG with a Mini-Atlas. [Google Scholar]
- Rutherford W.H. Postconcussion symptoms: relationship to acute neurological indices, individual differences, and circumstances of injury. In: Levin H., Eisenberg H., Benton A.L., editors. Mild Head Injury. Oxford University Press; New York: 1989. pp. 217–228. [Google Scholar]
- Schaul N. The fundamental neural mechanisms of electroencephalography. Electroencephalogr. Clin. Neurophysiol. 1998;106:101–107. doi: 10.1016/s0013-4694(97)00111-9. [DOI] [PubMed] [Google Scholar]
- Schaul N., Gloor P., Ball G., Gotman J. The electromicrophysiology of delta waves induced by systemic atropine. Brain Res. 1978;143:475–486. doi: 10.1016/0006-8993(78)90358-x. [DOI] [PubMed] [Google Scholar]
- Schwarzbold M., Diaz A., Martins E.T., Rufino A., Amante L.N., Thais M.E., Quevedo J., Hohl A., Linhares M.N., Walz R. Psychiatric disorders and traumatic brain injury. Neuropsychiatr. Dis. Treat. 2008;4:797–816. doi: 10.2147/ndt.s2653. [DOI] [PMC free article] [PubMed] [Google Scholar]
- Sekihara K., Nagarajan S.S., Poeppel D., Marantz A., Miyashita Y. Reconstructing spatio-temporal activities of neural sources using an MEG vector beamformer technique. IEEE Trans. Biomed. Eng. 2001;48:760–771. doi: 10.1109/10.930901. [DOI] [PubMed] [Google Scholar]
- Selden N.R., Gitelman D.R., Salamon-Murayama N., Parrish T.B., Mesulam M.M. Trajectories of cholinergic pathways within the cerebral hemispheres of the human brain. Brain. 1998;121(Pt 12):2249–2257. doi: 10.1093/brain/121.12.2249. [DOI] [PubMed] [Google Scholar]
- Sergent J., Ohta S., MacDonald B. Functional neuroanatomy of face and object processing. A positron emission tomography study. Brain. 1992;115(Pt 1):15–36. doi: 10.1093/brain/115.1.15. [DOI] [PubMed] [Google Scholar]
- Song T., Gaa K., Cui L., Feffer L., Lee R.R., Huang M. Evaluation of signal space separation via simulation. Med. Biol. Eng. Comput. 2008;46:923–932. doi: 10.1007/s11517-007-0290-y. [DOI] [PubMed] [Google Scholar]
- Tarapore P.E., Findlay A.M., Lahue S.C., Lee H., Honma S.M., Mizuiri D., Luks T.L., Manley G.T., Nagarajan S.S., Mukherjee P. Resting state magnetoencephalography functional connectivity in traumatic brain injury. J. Neurosurg. 2013;118:1306–1316. doi: 10.3171/2013.3.JNS12398. [DOI] [PMC free article] [PubMed] [Google Scholar]
- Taulu S., Kajola M., Simola J. Suppression of interference and artifacts by the signal space separation method. Brain Topogr. 2004;16:269–275. doi: 10.1023/b:brat.0000032864.93890.f9. [DOI] [PubMed] [Google Scholar]
- Taulu S., Simola J., Kajola M. MEG recordings of DC fields using the signal space separation method (SSS) Neurol. Clin. Neurophysiol. 2004;2004:35. [PubMed] [Google Scholar]
- Teasdale G., Jennett B. Assessment of coma and impaired consciousness. A practical scale. Lancet. 1974;2:81–84. doi: 10.1016/s0140-6736(74)91639-0. [DOI] [PubMed] [Google Scholar]
- Thurman D.J., Alverson C., Dunn K.A., Guerrero J., Sniezek J.E. Traumatic brain injury in the United States: a public health perspective. J. Head Trauma Rehabil. 1999;14:602–615. doi: 10.1097/00001199-199912000-00009. [DOI] [PubMed] [Google Scholar]
- Van Boven R.W., Harrington G.S., Hackney D.B., Ebel A., Gauger G., Bremner J.D., D'Esposito M., Detre J.A., Haacke E.M., Jack C.R., Jr., Jagust W.J., Le B.D., Mathis C.A., Mueller S., Mukherjee P., Schuff N., Chen A., Weiner M.W. Advances in neuroimaging of traumatic brain injury and posttraumatic stress disorder. J. Rehabil. Res. Dev. 2009;46:717–757. doi: 10.1682/jrrd.2008.12.0161. [DOI] [PMC free article] [PubMed] [Google Scholar]
- Van Veen B.D., van D.W., Yuchtman M., Suzuki A. Localization of brain electrical activity via linearly constrained minimum variance spatial filtering. IEEE Trans. Biomed. Eng. 1997;44:867–880. doi: 10.1109/10.623056. [DOI] [PubMed] [Google Scholar]
- Weiner K.S., Grill-Spector K. Sparsely-distributed organization of face and limb activations in human ventral temporal cortex. Neuroimage. 2010;52:1559–1573. doi: 10.1016/j.neuroimage.2010.04.262. [DOI] [PMC free article] [PubMed] [Google Scholar]
- Wienbruch C. Abnormal slow wave mapping (ASWAM)—a tool for the investigation of abnormal slow wave activity in the human brain. J. Neurosci. Methods. 2007;163:119–127. doi: 10.1016/j.jneumeth.2007.02.018. [DOI] [PubMed] [Google Scholar]
- Xu J., Rasmussen I.A., Lagopoulos J., Haberg A. Diffuse axonal injury in severe traumatic brain injury visualized using high-resolution diffusion tensor imaging. J. Neurotrauma. 2007;24:753–765. doi: 10.1089/neu.2006.0208. [DOI] [PubMed] [Google Scholar]
- YOUDEN W.J. Index for rating diagnostic tests. Cancer. 1950;3:32–35. doi: 10.1002/1097-0142(1950)3:1<32::aid-cncr2820030106>3.0.co;2-3. [DOI] [PubMed] [Google Scholar]