

Abstract
AIM: To evaluate the clinical and biochemical profile of patients with non alcoholic fatty liver disease (NAFLD) and to assess their histological severity at presentation.
METHODS: Consecutive patients presenting to the liver clinic of All India Institute of Medical Sciences (AIIMS) with raised transaminases to at least 1.5 times upper limit of normal, and histologically confirmed non-alcoholic fatty liver disease were included. Patients who had significant alcohol intake or positive markers of other liver diseases or who were taking drugs known to produce fatty liver were excluded. The clinical, biochemical and histological profile of this group was studied.
RESULTS: Fifty-one patients with NAFLD formed the study population. Their median age and BMI were 34(17-58) years and 26.7(21.3-32.5) kg/m2 respectively and 46 (90.1%) were males. The majority of the patients had mild inflammation, either grade 1 [32 (63%)] or grade 2 [16 (31%)] and only 3 (6%) patients had severe (grade 3) inflammation. Twenty-three (45%), 19 (37%), 8(16%) and 1(2%) patient had stage 0, 1, 2 and 3 fibrosis respectively on index biopsy and none had cirrhosis. On univariate analysis, triglyceride levels more than 150 mg % (OR = 7.1; 95% CI: 1.6-31.5, P = 0.002) and AST/ALT ratio > 1 (OR = 14.3; 95% CI: 1.4-678.5, P = 0.008) were associated with high grades of inflammation and none was associated with advanced fibrosis. On multivariate logistic regression analysis, hypertriglyceridemia >150 mg% was the only factor independently associated with presence of high grade of inflammation (OR = 1.6; 95% CI: 1.3-22.7, P = 0.02), while none was associated with advanced fibrosis. Triglyceride levels correlated positively with inflammatory grade (r = 0.412; P = 0.003).
CONCLUSION: NAFLD in North Indian patients is a disease of young over-weight males, most of whom are insulin resistant and they tend to have a mild histological disease at presentation.
Keywords: Inflammation, Fibrosis, Triglycerides, Non alcoholic steatohepatitis
INTRODUCTION
With the increasing awareness and early recognition of asymptomatic patients with raised transaminases and the ongoing epidemic of the metabolic syndrome, non alcoholic fatty liver disease (NAFLD) has become a common cause of referral to hepatology clinics[1]. NAFLD can be divided into 4 histological types (types 1 to 4)[2]. Studies from the west have demonstrated that NAFLD, especially NAFLD type 3 and 4 can progress over a variable period, in 25%-40% patients, to cirrhosis and can contribute to liver-related mortality[2,3]. Recently there have been reports linking the development of hepatocellular carcinoma to non alcoholic steatohepatitis (NASH)[4,5]. Studies from Europe and United States have demonstrated that up to 40% patients with NAFLD have advanced fibrosis and a proportion even have cirrhosis on the index biopsy[6,7].
The prevalence of fatty liver in the general population of India has been shown to be as high as 24%[8], which is similar to that reported from some of the western countries, where it parallels the prevalence of obesity[9,10]. Despite the high prevalence of NAFLD in India and rapidly rising incidence of type 2 diabetes mellitus in this country, data on hepatic morphology, to indicate the severity of NAFLD is limited[11-13]. The above-mentioned 3 studies reported demographic and biochemical profile of patients with NAFLD. Histological parameters were studied in only a small number of patients. By now it is clear that histological type 3 and 4 NAFLD are associated with progressive liver disease and therefore needs therapeutic interventions. The present prospective study was designed to assess the magnitude of advanced liver damage and fibrosis among consecutive patients with biopsy proven NAFLD.
MATERIALS AND METHODS
Study design
It is a cross sectional study to evaluate the clinical, biochemical and histological profile of patients with NAFLD. The study was approved by the ethics committee of the All India Institute of Medical Sciences(AIIMS), New Delhi.
Patients
Inclusion criteria: Consecutive patients presenting to the liver clinic of AIIMS, with raised transaminases to at least 1.5 times upper limit of normal, and histologically confirmed NAFLD, were included.
Exclusion criteria: Patients in whom alcohol intake exceeded 20 grams per day (history of alcohol intake was taken separately from the patients and the closest relatives), patients with positive markers for other liver diseases (hepatitis viruses A through E, autoimmune, Wilson’s disease, alpha 1 anti-trypsin deficiency, hemochromatosis) and patients who were on medications known to induce fatty liver such as methotrexate, estrogens, amiodarone and tamoxifen were excluded.
Methods
All patients were evaluated with a thorough history and examination especially to exclude intake of significant amounts of alcohol and to exclude intake of potentially hepatotoxic drugs. Anthropometric measurements were taken at the initial visit. These included the weight, height, waist and hip circumferences. Body mass index (BMI) and waist hip ratios were calculated as weight/height2. After an overnight fast, 10 mL of blood was collected for a complete blood count and biochemical investigations including a liver function profile, lipid profile, fasting serum insulin and fasting blood glucose.
Hepatitis virus serologies included hepatitis B surface antigen (HBsAg), total antibodies to hepatitis B core antigen (total anti-HBc) and antibodies to hepatitis C virus (anti-HCV). Anti-HCV was done using a sensitive commercial ELISA (Xcyton, Bangalore, India)[12] and the remaining viral serologies were done using commercial ELISA kits (Organon Teknika, Boxtel, The Netherlands). Serum ferritin and 24-h urinary copper estimation were done using conventional biochemical techniques[13,14]. Alpha one anti-trypsin (α1AT) phenotyping was done using isoelectric focusing (PHAST system; Pharmacia Biotech, Uppsala, Sweden)[15]. The anti-nuclear antibodies (ANA), anti- smooth muscle antibodies (ASMA) and anti-liver kidney and microsomal antibodies (anti-LKM1) were carried out using the immunofluorescence technique. Hepatitis C virus RNA was detected using the polymerase chain reaction method as standardized at our laboratory[15] .
Liver biopsy was done after an informed consent in all patients suspected to have NAFLD, using an 18-gauge Menghini’s aspiration needle. Each biopsy specimen, after being fixed in 10% formalin, had routine hematoxylin-eosin stains and special stains such as reticulin, Masson’s trichrome, Perl’s iron stain and Orcein stain for copper and periodic acid Schiff after digestion with diastase. Immunoperoxidase staining to detect HBsAg and hepatitis B core antigen (HBcAg) was carried out in all patients to exclude the presence of chronic viral hepatitis. The classification given by Brunt et al was used to grade and stage NASH[16].
An ultrasonography scan of the upper abdomen was done in all patients in order to examine presence of fatty liver and to exclude any obstructive biliary pathology or the presence of any hepatic space occupying lesion.
Fasting serum insulin values were used along with simultaneous fasting blood glucose measurements to calculate HOMA-IR (homeostasis model assessment) according to the formula given below.
HOMA-IR = (fasting serum insulin (μIU/mL)×fasting plasma glucose (mg%))/(22.5 ×18)
Value of HOMA-IR more than 1.64 implied the presence of abnormally high insulin resistance[17].
Definitions
Diabetes was regarded to be present if the fasting venous plasma glucose was more than 126 mg%[18] . Patients with BMI of more than 23 were seen to be overweight and those with a BMI of >25 were labeled as obese (Asian standards)[19]. Hypertriglyceridemia was defined as a fasting serum triglyceride level of more than 150 mg%. Patients who had at least three of the following five components: hyperglycemia (fasting blood sugar >110 mg% or known type 2 diabetes mellitus, central obesity (as defined by a higher waist-hip ratio), hypertension, hypertriglyceridemia (serum triglyceride > 150 mg%), and low HDL cholesterol levels (< 50 for women and < 40 for men), were labeled to have the metabolic syndrome. Since we did not have waist hip ratio in a large number of patients, we used obesity (BMI > 25 kg/m2) as a surrogate for high waist hip ratio, as one of the component of the metabolic syndrome[1,20].
Statistical analysis
The results were expressed as median (range) for continuous variables and as frequencies (proportions) for categorical variables. Factors suspected to influence the severity of grade and stage were tested in a univariate and multivariate logistic regression analysis. For the univariate and multivariate analyses, the dependent variable was the presence of mild inflammation (grades 0, 1) or severe inflammation (grades 2, 3) for assessing the association with inflammatory grade and mild fibrosis (stages 0, 1) or severe fibrosis (stages 2, 3, 4) for assessing association with fibrosis stage. The independent variables were age>35, sex, BMI > 25 kg/m2, AST/ALT ratio >1, cholesterol >200 mg%, triglycerides >150 mg%, HOMA-IR >1.64, presence or absence of hypertension and metabolic syndrome. Correlation between histological severity and the above mentioned independent variables was carried out using Spearman’s correlation. For skewed data, non-parametric tests were used wherever necessary. All data were analyzed using the SAS 8.0 statistical package.
RESULTS
From January 1999 to June 2005, 51 patients with histologically proven NAFLD were registered at the liver clinic of AIIMS. This number formed 2.6% of all liver clinic referrals during this time period.
The median age of this cohort of patients was 34 (17-58) years, the BMI was 26.7 (21.3-32.5) kg/m2 and 46 (90.1%) were males. Median AST/ALT ratio was 0.63 (0.31-2.61). Table 1 gives the baseline demographic and biochemical profile of the patients.
Table 1.
Baseline demographic and biochemical parameters of the cohort
| Parameters | Value |
| Age (yr) | |
| n | 51 |
| Median | 34 |
| (Range) | (16-58) |
| Sex ratio (males/females) | 46/5 |
| Body mass index (kg/m2) | |
| n | 49 |
| Median | 26.7 |
| (Range) | (21.3-32.5) |
| Bilirubin (mg%) | |
| n | 51 |
| Median | 0.8 |
| (Range) | (0.5-13.0) |
| Aspartate aminotransferase (IU/L) | |
| n | 51 |
| Median | 66 |
| (Range) | (29-230) |
| Alanine aminotransferase (IU/L) | |
| n | 51 |
| Median | 98 |
| (Range) | (52-349) |
| Alkaline phosphatase (IU/L) | |
| n Median | 51 159 |
| (Range) | (87-372) |
| Albumin (gm%) | |
| n | 47 |
| Median | 4.6 |
| (Range) | (3-5.4) |
| Cholesterol (mg%) | |
| n | 49 |
| Median | 180 |
| (Range) | (96-323) |
| Triglycerides (mg%) | |
| n | 49 |
| Median | 145 |
| (Range) | (48-339) |
| HDL cholesterol (mg%) | |
| n | 44 |
| Median | 41 |
| (Range) | (28-65) |
| Fasting plasma glucose (mg%) | |
| n | 49 |
| Median | 90 |
| (Range) | (70-150) |
| Fasting serum insulin (μIU/L) | |
| n | 45 |
| Median | 10.4 |
| (Range) | (1.6-28.4) |
| HOMA-IR | |
| n | 45 |
| Median | 2.4 |
| (Range) | (0.3-6.0) |
HDL: High density lipoprotein, HOMA-IR: Homeostasis model assessment for insulin resistance.
Prevalence of features of metabolic syndrome
Table 2 depicts the prevalence of individual features of the metabolic syndrome in these patients. Eighty percent patients had high HOMA-IR, while 69.4%, 40.8%, 36.4%, 11.8% and 10% had obesity, hypertriglyceridemia, low HDL cholesterol, hypertension and diabetes respectively. All the investigations and clinical features required for diagnosing the metabolic syndrome were available in 43 patients. Of these, 9(20.9%) patients fulfilled the criteria for a diagnosis of metabolic syndrome (presence of 3 or more components of the metabolic syndrome).
Table 2.
Prevalence of individual components of metabolic syndrome
| Component of metabolic syndrome | n (%) |
| Obesity | 34 (69.4) |
| Hypertriglyceridemia | 20 (40.8) |
| Low HDL cholesterol | 16 (36.4) |
| High HOMA-IR | 36 (80) |
| Hypertension | 6 (11.8) |
| Diabetes | 5 (9.8) |
| Metabolic syndrome | 9 (20.9) |
HDL: high density lipoprotein; HOMA-IR: Homeostasis model assessment for insulin resistance.
Histological severity and factors associated with severe disease
Twenty-eight (55%) patients had NASH (type 3 or 4 NAFLD) whereas the rest had only fatty liver with or without spotty necrosis without evidence of either necrosis or fibrosis (type 1 or 2 NAFLD).
Inflammatory grade: The majority of the patients had mild inflammation, either grade 1 [32 (63%)] or grade 2 [16 (31%)]. Only 3(6%) patients had severe or grade 3 inflammation.
We evaluated factors which could have been associated with moderate to severe inflammation (grade 2 or 3) versus those with mild inflammation (grade 0 or 1). On univariate analysis, triglyceride levels more than 150 mg % (OR = 7.1; 95% CI: 1.6-31.5, P = 0.002) and AST/ALT ratio > 1 (OR = 14.3; 95% CI: 1.4-678.5, P = 0.008) were significantly associated with high grades of inflammation. Presence of metabolic syndrome was more common among patients who had severe inflammation although it did not reach the significant value (Table 3). On multivariate logistic regression analysis, hypertriglyceridemia more than 150 mg% was the only factor independently associated with presence of high grade of inflammation on index biopsy (OR = 1.6; 95% CI: 1.3-22.7, P = 0.02). There was also positive correlation between the triglyceride levels and inflammatory grade (r = 0.412; P = 0.003) (Figure 1)
Table 3.
Factors associated with advanced grade of inflammation
| Variables | Grade 0/1 (n/N) | Grade 2/3 (n/N) | P |
| Male | 29/32 | 17/19 | 1.0 |
| Age >35 years | 13/32 | 10/19 | 0.40 |
| BMI >25 kg/m2 | 18/30 | 16/19 | 0.11 |
| AST/ALT ratio > 1 | 1/32 | 6/19 | 0.008 |
| Cholesterol > 200 mg% | 9/30 | 5/19 | 1.0 |
| Triglycerides >150 mg% | 7/30 | 13/19 | 0.002 |
| HOMA-IR >1.64 | 21/26 | 15/19 | 1.0 |
| Hypertension | 4/32 | 2/19 | 1.0 |
| Metabolic syndrome | 3/30 | 6/19 | 0.07 |
BMI: body mass index; AST: Aspartate aminotransferase; ALT: Alanine aminotransferase; HOMA-IR: homeostasis model assessment for insulin resistance; Univariate analyses; P value on chi-square or Fisher’s exact test.
Figure 1.
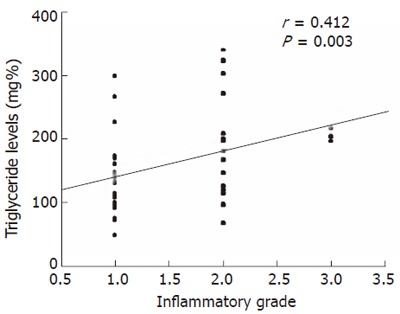
Scatter plot demonstrating positive correlation between triglyceride levels and inflammatory grade. [Coefficient of correlation (r) = 0.412; P = 0.003 using spearman’s correlation].
Fibrosis stage: Most of the patients had either no or minimal fibrosis. Twenty-three (45%) and 19 (37%) patients had stage 0 and stage 1 fibrosis respectively on liver biopsy. Eight (16%) had stage 2 and 1 (2%) had stage 3 fibrosis. No patient had cirrhosis on index biopsy. On evaluation of factors, which could have been associated with severe fibrosis (stages 2, 3, 4 versus stages 0,1), metabolic syndrome (OR = 5.6; 95% CI: 0.7-36.5, P = 0.04) and AST/ALT ratio > 1 (P = 0.09) were more commonly present among patients with advanced fibrosis but failed to reach significance (Table 4).
Table 4.
Factors associated with advanced stage of fibrosis
| Variables | Stage 0/1 (n/N) | Stage 2/3/4 (n/N) | P |
| Male sex | 4/42 | 1/9 | 1.0 |
| Age >35 years | 17/42 | 6/9 | 0.26 |
| BMI >25 kg/m2 | 26/42 | 8/9 | 0.24 |
| AST/ALT ratio > 1 | 4/42 | 3/9 | 0.09 |
| Cholesterol > 200 mg% | 13/40 | 1/9 | 0.41 |
| Triglycerides >150 mg% | 14/40 | 6/9 | 0.13 |
| HOMA-IR >1.64 | 28/36 | 8/9 | 0.66 |
| Hypertension | 5/42 | 1/9 | 1.0 |
| Metabolic syndrome | 5/40 | 4/9 | 0.04 |
BMI: body mass index; AST: Aspartate aminotransferase; ALT: Alanine aminotransferase; HOMA-IR: Homeostasis Model assessment for insulin resistance; Univariate analyses; P value on chi-square and fisher’s exact test.
DISCUSSION
Although NAFLD has been demonstrated to be present in almost one quarter of the general population[10] and has been shown to be responsible for one third of patients with asymptomatic transaminitis in India, little is known about the baseline clinical, biochemical and histological profile of these patients. The present study described the baseline profile in North Indian patients with biopsy proven NAFLD.
Our study demonstrated NAFLD to be a disease of younger age group with a mean age at presentation being 33.3 (8.01) years. More than 90% of the patients were males. This predilection for involvement of males has been seen not only in other studies from Northern India[13-15] , but also in the United States[21]. This is different from what used to be the classical phenotype of NASH patients, where it was described to be a disease of middle-aged females. The reason for this male preponderance has been described as a higher waist-hip ratio in men as compared to women, an indicator of central obesity and insulin resistance. Twenty-one percent of our patients with NAFLD were found to have the metabolic syndrome. The prevalence rate of metabolic syndrome in the general population of India has been reported to be approximately 8% in men older than 20 years[22], but no study has earlier reported the prevalence of the metabolic syndrome in patients with NAFLD from India.
The present study also highlights certain important differences between the phenotype of the cohort of NAFLD as seen in Northern India versus that which has been described classically from the west. This difference would not be surprising, considering the fact that the body fat distribution and risk of cardiovascular complications with similar amount of body fat differs between Asian Indians and their western counterparts. This has even prompted lowering of BMI and waist-hip ratio cut-offs for defining overweight and obesity among Asians[23,24]. Since obesity and fat distribution are integral parts of the insulin resistance syndrome and fatty liver forms part of the spectrum of abnormalities associated with this syndrome, the difference in the baseline profiles of NAFLD patients would be obvious.
The mean age of presentation of our patients, most of whom were detected during workup of asymptomatic transaminitis was about a decade younger than the western patients. The younger age of presentation may suggest increasing health awareness among our population with lower thresholds for health check-ups during which the asymptomatic transaminitis is picked up and investigated. It may also suggest the epidemic proportion of the metabolic syndrome in India, wherein the population which is fast acquiring western lifestyle gets exposed to the detrimental effects of high calorie diet and physical inactivity at an earlier age. In fact, Indians have been shown to have higher body fat percentage and adverse pattern of body fat distribution including abdominal adiposity even when the BMI is within limits considered as normal for Caucasians[25]. Further, in the age group of 11-17 years, the prevalence of overweight and obesity is 11.63% and 2.38% in urban and 4.7% and 3.63% in rural Indian population respectively[26]. The mean BMI of our patients [26.5 (2.8) kg/m2] was similar to cohorts described in other studies from North India[13,14], but significantly lower than what has been described in the Caucasian populations, where the mean BMI has always been reported to be above 30[2,3,8,26,27]. As described earlier, Indian patients despite having a lower BMI have similar body fat percentage as the Caucasians. This would mean higher visceral fat distribution, evidenced by higher waist hip ratios, despite lower BMIs. Unfortunately, waist hip ratios were not available in the present study for most of the patients. However, 80% of our patients had high HOMA-IR which is an index of insulin resistance and has been correlated earlier with visceral adiposity and higher waist hip ratios.
Most important finding in the present study was the presence of histologically mild disease in the cohort. Two thirds of the patients had minimal or mild inflammation (grade 0 or 1). Severe (grade 3) inflammation was present in only 3 patients. Hypertriglyceridemia was found to be significantly and independently associated with presence of severe inflammation.
It has already been demonstrated that insulin resistance leads to higher free fatty acid load to the liver, consequently higher triglyceride synthesis and increased secretion of triglyceride rich very low density lipoprotein (VLDL) from the liver[28,29]. In fact, circulating VLDL triglycerides have been correlated with liver fat density[30]. Higher triglyceride and fatty acid deposits may provide substrates for oxidative stress, which is a putative second hit in pathogenesis of progressive NAFLD[31]. High triglyceride levels have been shown to be independently associated with septal or advanced fibrosis by Ratziu et al. They also demonstrated that septal fibrosis had a significant positive correlation with liver necroinflammatory activity, thereby indirectly linking hypertriglyceridemia with necroinflammation[9]. In the present study however, we have demonstrated a direct correlation between hypertriglyceridemia and necroinflammatory activity in the liver.
Interestingly, none of our patients had cirrhosis on the index biopsy and only 2% had advanced (stage 3 or 4) fibrosis. Most (> 90%) had minimal or no fibrosis on presentation. Similar mild histology among NASH patients has been reported in other studies from India[13-15] as well as one study from Israel[32]. This is in contrast to the reported series from the west, where advanced fibrosis or cirrhosis has been demonstrated to be present in up to 50% of NAFLD cohorts[7-9,24]. One reason which can be cited for mild fibrosis in our patients is the younger age at presentation, because extent of fibrosis has been shown to increase with increasing age and increasing duration of disease[8,9]. Therefore it is possible that the cohort in the present study happened to have been detected at an early stage and with advancing age the disease might progress. This can only be confirmed later when follow up histology is available in these patients. Another factor which could be responsible for milder disease in these patients is the lower BMI. But this may not be true, because as has been discussed earlier, Asians with lower BMI may also be predisposed to similar risk of developing the metabolic syndrome as Caucasians with higher BMI. Further the effect of BMI or age was not seen on the degree of fibrosis in the univariate analysis. No other factor was found to be associated with severe fibrosis in the present study. The lack of association might be due to small number of patients in the group of severe fibrosis, as only a minority of patients had advanced fibrosis. Studies from the west, however have reported higher BMI, older age, type 2 diabetes mellitus, AST/ALT ratio > 1 and hypertriglyceridemia to be independent risk factors for presence of advanced fibrosis on index biopsy[8,9]. The milder histological disease in the present cohort may also represent a genetic predisposition in our patients, just like their genetic predisposition to develop metabolic syndrome. Whether these patients with mild fibrosis continue to have a mild disease or they progress to a stage of cirrhosis can only be answered once we have an adequate follow up on them.
To conclude, NAFLD in North Indian patients is a disease of young overweight males, most of whom are insulin resistant and they tend to have a mild histological disease at presentation.
ACKNOWLEDGMENTS
We sincerely acknowledge the valuable contributions made by Dr Rajvir singh (Senior scientist, Department of Biostatistics, All India Institute of Medical Sciences, New Delhi) towards the statistical analysis of this study.
Footnotes
S- Editor Wang J L-Editor Zhu LH E- Editor Zhang Y
References
- 1.Adams LA, Sanderson S, Lindor KD, Angulo P. The histological course of nonalcoholic fatty liver disease: a longitudinal study of 103 patients with sequential liver biopsies. J Hepatol. 2005;42:132–138. doi: 10.1016/j.jhep.2004.09.012. [DOI] [PubMed] [Google Scholar]
- 2.Matteoni CA, Younossi ZM, Gramlich T, Boparai N, Liu YC, McCullough AJ. Nonalcoholic fatty liver disease: a spectrum of clinical and pathological severity. Gastroenterology. 1999;116:1413–1419. doi: 10.1016/s0016-5085(99)70506-8. [DOI] [PubMed] [Google Scholar]
- 3.Lee RG. Nonalcoholic steatohepatitis: a study of 49 patients. Hum Pathol. 1989;20:594–598. doi: 10.1016/0046-8177(89)90249-9. [DOI] [PubMed] [Google Scholar]
- 4.Bugianesi E, Leone N, Vanni E, Marchesini G, Brunello F, Carucci P, Musso A, De Paolis P, Capussotti L, Salizzoni M, et al. Expanding the natural history of nonalcoholic steatohepatitis: from cryptogenic cirrhosis to hepatocellular carcinoma. Gastroenterology. 2002;123:134–140. doi: 10.1053/gast.2002.34168. [DOI] [PubMed] [Google Scholar]
- 5.Yoshioka Y, Hashimoto E, Yatsuji S, Kaneda H, Taniai M, Tokushige K, Shiratori K. Nonalcoholic steatohepatitis: cirrhosis, hepatocellular carcinoma, and burnt-out NASH. J Gastroenterol. 2004;39:1215–1218. doi: 10.1007/s00535-004-1475-x. [DOI] [PubMed] [Google Scholar]
- 6.Ludwig J, Viggiano TR, McGill DB, Oh BJ. Nonalcoholic steatohepatitis: Mayo Clinic experiences with a hitherto unnamed disease. Mayo Clin Proc. 1980;55:434–438. [PubMed] [Google Scholar]
- 7.Ratziu V, Giral P, Charlotte F, Bruckert E, Thibault V, Theodorou I, Khalil L, Turpin G, Opolon P, Poynard T. Liver fibrosis in overweight patients. Gastroenterology. 2000;118:1117–1123. doi: 10.1016/s0016-5085(00)70364-7. [DOI] [PubMed] [Google Scholar]
- 8.Singh SP, Nayak S, Swain M, Rout N, Mallik RN, Agrawal O, Meher C, Rao M. Prevalence of nonalcoholic fatty liver disease in coastal eastern India: a preliminary ultrasonographic survey. Trop Gastroenterol. 2004;25:76–79. [PubMed] [Google Scholar]
- 9.Bellentani S, Saccoccio G, Masutti F, Crocè LS, Brandi G, Sasso F, Cristanini G, Tiribelli C. Prevalence of and risk factors for hepatic steatosis in Northern Italy. Ann Intern Med. 2000;132:112–117. doi: 10.7326/0003-4819-132-2-200001180-00004. [DOI] [PubMed] [Google Scholar]
- 10.Clark JM, Brancati FL, Diehl AM. The prevalence and etiology of elevated aminotransferase levels in the United States. Am J Gastroenterol. 2003;98:960–967. doi: 10.1111/j.1572-0241.2003.07486.x. [DOI] [PubMed] [Google Scholar]
- 11.Duseja A, Murlidharan R, Bhansali A, Sharma S, Das A, Das R, Chawla Y. Assessment of insulin resistance and effect of metformin in nonalcoholic steatohepatitis--a preliminary report. Indian J Gastroenterol. 2004;23:12–15. [PubMed] [Google Scholar]
- 12.Panigrahi AK, Nanda SK, Dixit RK, Acharya SK, Zuckerman AJ, Panda SK. Diagnosis of hepatitis C virus-associated chronic liver disease in India: comparison of HCV antibody assay with a polymerase chain reaction for the 5' noncoding region. J Med Virol. 1994;44:176–179. doi: 10.1002/jmv.1890440211. [DOI] [PubMed] [Google Scholar]
- 13.Stacy DL, Han P. Serum ferritin measurement and the degree of agreement using four techniques. Am J Clin Pathol. 1992;98:511–515. doi: 10.1093/ajcp/98.5.511. [DOI] [PubMed] [Google Scholar]
- 14.Abe A, Yamashita S, Noma A. Sensitive, direct colorimetric assay for copper in serum. Clin Chem. 1989;35:552–554. [PubMed] [Google Scholar]
- 15.Norman MR, Mowat AP, Hutchison DC. Molecular basis, clinical consequences and diagnosis of alpha-1 antitrypsin deficiency. Ann Clin Biochem. 1997;34:230–246. doi: 10.1177/000456329703400303. [DOI] [PubMed] [Google Scholar]
- 16.Brunt EM, Janney CG, Di Bisceglie AM, Neuschwander-Tetri BA, Bacon BR. Nonalcoholic steatohepatitis: a proposal for grading and staging the histological lesions. Am J Gastroenterol. 1999;94:2467–2474. doi: 10.1111/j.1572-0241.1999.01377.x. [DOI] [PubMed] [Google Scholar]
- 17.Chitturi S, Abeygunasekera S, Farrell GC, Holmes-Walker J, Hui JM, Fung C, Karim R, Lin R, Samarasinghe D, Liddle C, et al. NASH and insulin resistance: Insulin hypersecretion and specific association with the insulin resistance syndrome. Hepatology. 2002;35:373–379. doi: 10.1053/jhep.2002.30692. [DOI] [PubMed] [Google Scholar]
- 18.Report of the Expert Committee on the Diagnosis and Classification of Diabetes Mellitus. Diabetes Care. 1997;20:1183–1197. doi: 10.2337/diacare.20.7.1183. [DOI] [PubMed] [Google Scholar]
- 19.Vikram NK, Misra A, Dwivedi M, Sharma R, Pandey RM, Luthra K, Chatterjee A, Dhingra V, Jailkhani BL, Talwar KK, et al. Correlations of C-reactive protein levels with anthropometric profile, percentage of body fat and lipids in healthy adolescents and young adults in urban North India. Atherosclerosis. 2003;168:305–313. doi: 10.1016/s0021-9150(03)00096-0. [DOI] [PubMed] [Google Scholar]
- 20.Executive Summary of The Third Report of The National Cholesterol Education Program (NCEP) Expert Panel on Detection, Evaluation, And Treatment of High Blood Cholesterol In Adults (Adult Treatment Panel III) JAMA. 2001;285:2486–2497. doi: 10.1001/jama.285.19.2486. [DOI] [PubMed] [Google Scholar]
- 21.Ruhl CE, Everhart JE. Determinants of the association of overweight with elevated serum alanine aminotransferase activity in the United States. Gastroenterology. 2003;124:71–79. doi: 10.1053/gast.2003.50004. [DOI] [PubMed] [Google Scholar]
- 22.Cameron AJ, Shaw JE, Zimmet PZ. The metabolic syndrome: prevalence in worldwide populations. Endocrinol Metab Clin North Am. 2004;33:351–375, table of contents. doi: 10.1016/j.ecl.2004.03.005. [DOI] [PubMed] [Google Scholar]
- 23.World Health Organisation, Western Pacific region. The Asia-Pacific perspective. Redefining obesity and its treatment. WHO/IASO/IOTF. 2000 [Google Scholar]
- 24.Appropriate body-mass index for Asian populations and its implications for policy and intervention strategies. Lancet. 2004;363:157–163. doi: 10.1016/S0140-6736(03)15268-3. [DOI] [PubMed] [Google Scholar]
- 25.Misra A, Vikram NK. Insulin resistance syndrome (metabolic syndrome) and obesity in Asian Indians: evidence and implications. Nutrition. 2004;20:482–491. doi: 10.1016/j.nut.2004.01.020. [DOI] [PubMed] [Google Scholar]
- 26.Mohan B, Kumar N, Aslam N, Rangbulla A, Kumbkarni S, Sood NK, Wander GS. Prevalence of sustained hypertension and obesity in urban and rural school going children in Ludhiana. Indian Heart J. 2004;56:310–314. [PubMed] [Google Scholar]
- 27.Teli MR, James OF, Burt AD, Bennett MK, Day CP. The natural history of nonalcoholic fatty liver: a follow-up study. Hepatology. 1995;22:1714–1719. [PubMed] [Google Scholar]
- 28.Lewis GF, Uffelman KD, Szeto LW, Weller B, Steiner G. Interaction between free fatty acids and insulin in the acute control of very low density lipoprotein production in humans. J Clin Invest. 1995;95:158–166. doi: 10.1172/JCI117633. [DOI] [PMC free article] [PubMed] [Google Scholar]
- 29.Lewis GF, Steiner G. Acute effects of insulin in the control of VLDL production in humans. Implications for the insulin-resistant state. Diabetes Care. 1996;19:390–393. doi: 10.2337/diacare.19.4.390. [DOI] [PubMed] [Google Scholar]
- 30.Banerji MA, Buckley MC, Chaiken RL, Gordon D, Lebovitz HE, Kral JG. Liver fat, serum triglycerides and visceral adipose tissue in insulin-sensitive and insulin-resistant black men with NIDDM. Int J Obes Relat Metab Disord. 1995;19:846–850. [PubMed] [Google Scholar]
- 31.Marchesini G, Brizi M, Morselli-Labate AM, Bianchi G, Bugianesi E, McCullough AJ, Forlani G, Melchionda N. Association of nonalcoholic fatty liver disease with insulin resistance. Am J Med. 1999;107:450–455. doi: 10.1016/s0002-9343(99)00271-5. [DOI] [PubMed] [Google Scholar]
- 32.Knobler H, Schattner A, Zhornicki T, Malnick SD, Keter D, Sokolovskaya N, Lurie Y, Bass DD. Fatty liver--an additional and treatable feature of the insulin resistance syndrome. QJM. 1999;92:73–79. doi: 10.1093/qjmed/92.2.73. [DOI] [PubMed] [Google Scholar]