Abstract
AIM: To study the possible causes of sorbitol (S)-based diarrhea and its mechanism of reduction by rice gruel (RG) in cecectomized rats.
METHODS: S was dissolved either in distilled water or in RG (50 g/L) and ingested as a single oral dose (1.2 g/kg body mass, containing 0.5 g/L phenol red as a recovery marker) by S (control) and S + RG groups (n = 7), respectively. This dose is over the laxative dose for humans. Animals were sacrificed exactly 1 h after dose ingestion, without any access to drinking water. The whole gastro-intestinal tract was divided into seven segments and sampled to analyze the S and marker remaining in its contents.
RESULTS: Gastric-emptying and intestinal transit were comparatively slower in the S + RG group. Also, the S absorption index in the 3rd and last quarter of the small intestine (24.85 ± 18.88% vs 0.0 ± 0.0% and 39.09 ± 32.75% vs 0.0 ± 0.0%, respectively, P < 0.05) was significantly higher in the S + RG group than in the control group. The S absorption index and the intestinal fluid volume are inversely related to each other.
CONCLUSION: The intestinal mal-absorption of S is the main reason for S-based osmotic diarrhea. Where RG enhanced the absorption of S through passive diffusion, the degree of diarrhea was reduced in cecectomized rats.
Keywords: Cecectomized rat, Sorbitol, Diarrhea, Rice gruel, Phenol red
INTRODUCTION
Sugar alcohols are widely used as sugar-substitute sweeteners in the food industry, especially in candy, chewing gum, dietetics and diabetic foods, for their lower calorific value and various beneficial effects on health. Among the many sugar alcohols, sorbitol (S) is chosen most often because of its functional, nutritional, and disease-preventative effects impacting positively on health. However, higher dose or over-intake of S causes bloating, flatulence, cramping, abdominal pain and diarrhea both in adults[1] and in children[2]. As the laxative threshold of S varies from person to person, the actual cause of S-based gastrointestinal complications is still unclear. Several possible and dissimilar causes have been previously indicated by a number of investigators[3-7], although most of them reported that diarrhea was caused by increasing colonic osmolality when higher doses were consumed. Soergel reported that indigestible carbohydrate-induced diarrhea occurs when the amount of carbohydrate entering the colon exceeds its fermentation capacity[3]. In another report, it was stated that intestinal mal-absorption is the main reason for diarrhea[4]. Read et al[5] reported that the tendency for diarrhea in response to a meal containing un-absorbable carbohydrate depends more on the lack of colonic accommodation than on the small intestinal transit. Short chain fatty acids (SCFAs), the fermentation product of sugar alcohol, were reported to decrease intestinal or colonic water absorption, resulting in diarrhea[6]. Some other investigators found higher lactic and succinic acid levels during diarrhea in the colon of cecectomized rats[7] and in pig feces[8], and thought that the above fermentation products may increase the colonic osmolality to cause diarrhea. Although higher colonic osmolality and lower fluid absorption from the colon are indicated in the above studies as the main reasons for indigestible or fermentable material-based diarrhea, the actual cause of the induction of large gut osmolality is a matter of controversy.
The major difference between the digestive physiology of the rat and humans is that the rat has a large voluminous cecum, whereas humans have no distinct cecum. The cecum in rat acts as an important reservoir and fermentation site especially for indigestible and fermentable materials. Recently, we reported that the digestive physiology of cecectomized rats is more analogous to humans than to normal rats[7]. It was also proposed that the cecectomized rat could be a useful experimental tool to study the physiological effects of indigestible or fermentable materials in humans. In another study[9], we found that rice gruel (RG), a source of rice starch, significantly reduced the degree of S-based diarrhea in cecectomized rats. In the report of that study, we hypothesized that in the presence of the extra glucose from rice gruel, the influx of S across the luminal membrane increased significantly[10]. This may enhance the small intestinal absorption of S in the presence of the extra glucose released from RG, and only a small amount of S is transported to the colon from the small intestine for fermentation[9]. By the above proposed mechanisms, the colonic organic acid concentration as well as the osmolality was decreased and hard feces were formed in the mid to distal colon of the cecectomized rats. As a result, the degree of diarrhea was reduced in these rats[9].
The present study was undertaken to further examine our above hypothesis that small intestinal mal-absorption, or perhaps rather inadequate fermentation of S or mal-absorption of S fermentation products, is responsible for increasing the colonic osmolality as well as the occurring osmotic diarrhea, and to examine the mechanisms involved in reducing the degree of S-based diarrhea by RG in cecectomized rats.
MATERIALS AND METHODS
Animals
Three week-old male juvenile Wistar rats (50.3 ± 3.55 g body mass, Nippon SLC, Hamamatsu, Japan) were housed identically as reported in our previous study[7]. Animals were allowed free access to a diet of commercial pellets (Labo MR Stock, Nihon Nosan Kogyo K.K. Ltd., Tsukuba, Japan) and drinking water for the initial 3 wk, in their acclimatization period. After this period, when the mean body mass of the animals was 184.23 ± 12.85 g, cecectomy of all animals was performed according to our previous report[7]. After a 2 wk recovery period with free access to the commercial pellets and drinking water, animals were randomly divided into two subgroups of 7 animals each as the S (control) and S + RG groups with a similar mean body mass in each group (314.6 ± 8.94 g). They were fasted overnight (16 h) with free access to drinking water only, and then experimental diets were provided as a single bolus by gastric intubations. Animals were maintained according to the rules and regulations of the animal experiments committee of Okayama University.
Rice gruel preparation
Rice gruel (50 g/L) was prepared according to the procedures described in our previous report[9]. Briefly, 100 g japonica rice (Oryza sativa L.) was soaked in 200-250 mL of distilled water for about 1 h, and blended until reaching a dense milky appearance. The volume of blended rice was made up to 2.2 L with distilled water and boiled over a gas burner with continuous stirring until the final volume was 2 L.
Feeding and sampling
For a single oral dose, animals were lightly anesthetized with diethyl ether then S (90 g/L) (Sorbitol, Nacalai Tesque Inc., Kyoto, Japan; Lot no. M3G8055) was dissolved either in distilled water or in RG and ingested as a single oral dose (1.2 g/kg b.w., containing 0.5 g/L phenol red as a recovery marker) to the S (control) and S + RG groups (n = 7) respectively. This dose is over the laxative dose for humans. Animals were sacrificed by diethyl ether anesthesia exactly 1 h after dose administration, without any access to drinking water[11]. The whole gastro-intestinal tract was removed as quickly as possible and frozen in dry-ice-acetone to prevent the movement of gastro-intestinal contents, and immediately preserved at -30°C for subsequent analysis.
Analytical methods
The frozen gastrointestinal tract was defrosted over the ice bag, weighed and subdivided into the stomach, small intestine (1st, 2nd, 3rd and last quarter), the proximal half and the distal half of the colon. The contents of each segment were separately collected, homogenized and centrifuged according to the procedures described by Soontornchai et al[12]. The mass of the contents of each gastrointestinal segment was calculated from the mass of tissue with and without contents. The collected supernatants were analyzed colorimetrically (UV 1200, Shimadzu Corporation, Kyoto, Japan) for phenol red with bile acid correction[13]. For S analysis, supernatants were deproteinized, derivatized and analyzed by HPLC (Stainless steel column: Inertsil ODS-80A 150 mm × 4.6 mm i.d., Dectector: Shimadzu SPD-10A UV-VIS, Shimadzu Corporation, Kyoto, Japan) methods as described by Miwa et al[14]. For maximum recovery of phenol red from gut segments, the tissue of each segment was thoroughly homogenized in 5 mL physiological saline with a rotary stainless steel homogenizer in a centrifuge tube, and centrifuged at 45 000 × g at 4°C for 15 min (Himac-GX series: Himac CS 100GX micro ultra centrifuge, Hitachi Ltd., Tokyo, Japan). The collected supernatants were treated similarly for measurement of phenol red.
Calculations
The gastric emptying, intestinal transit, and S absorption indexes for each segment of intestine were calculated by the following equations, which were slightly modified from those of Reynell and Spray[11].
Gastric emptying (%) = (Total phenol red recovered from the int estinal tract)/(Total phenol red recovered from whole gastro int estinal tract) × 100
Intestinal transit from the 1st to the last quarter of the small intestine and the proximal colon of the large intestine was calculated by the following formula.
Digesta transit in a certain quarter or part of the intestine (%) = (a/b) × 100
Where, “a” is the amount of phenol red recovered from the 1st quarter of the small intestine to the distal colon excluding the amount of phenol red recovered from that respective quarter or the part of colon, and “b” is the total amount of recovered phenol red from that respective quarter to distal colon.
The S absorption index in a certain quarter of the small intestine and in the proximal and distal colon was calculated by the following formula.
Sorbitol absorption index (%) = [1- (a/b)/( c/d)] × 100
Where, “a” is the total amount of S recovered from that respective segment and “b” is the total amount of phenol recovered from the same segment of the small intestine; “c” and “d” are the amount of S and phenol red injected into corresponding animal, respectively. Put simply, the value of the S absorption index (%) for a certain segment means the percentage of total S passing through that segment that was absorbed.
Statistical analysis
Data are presented as means and standard deviations for 7 animals. Statistical analyses were performed between control (S) and S + RG groups by the Tukey-Kramer’s test using statistical software (Statview, Version 5.0, SAS Institute Inc., USA). Significance of difference was considered to be at P < 0.05.
RESULTS
Phenol red was used as a recovery marker to measure the gastric emptying, intestinal transit, and intestinal S absorption index in this experiment. The mean recovery of the phenol red from the gastrointestinal tract was 93.8% ± 1.56% of the given amount. A very small amount of phenol red was detected in the distal colon (Figure 1) and no feces were defecated in either group during the 1 h period after the dose. Although the marker concentration did not vary significantly (data not shown) between the groups for different volumes of intestinal fluid, the distribution of marker from the stomach to the different segments of the intestine showed that the marker concentration was relatively lower in the distal part of the small intestine, and was significantly lower in the proximal (3.54% ± 2.47% vs 16.77% ± 11.48%, P = 0.035) and distal (1.38% ± 0.38% vs 3.07% ± 1.55%, P = 0.045) colon for the S + RG group relative to the S group (Figure 1). The concentration of marker in the stomach of the S + RG group was comparatively higher (46.29% ± 23.33% vs 25.69% ± 7.54%, P = 0.097) than for the S group (Figure 1) due to slower (53.78% ± 22.02% vs 74.3% ± 7.12%, P = 0.098) gastric emptying (Figure 2). As a result of the slower gastric emptying, a smaller amount of marker was delivered to the small intestine and onward at a given time in the S + RG fed group compared to the S group. For the same reason, digesta transit in the different segments of the gastrointestinal tract was relatively slower in the S + RG group than in the S-only group (Table 1).
Figure 1.
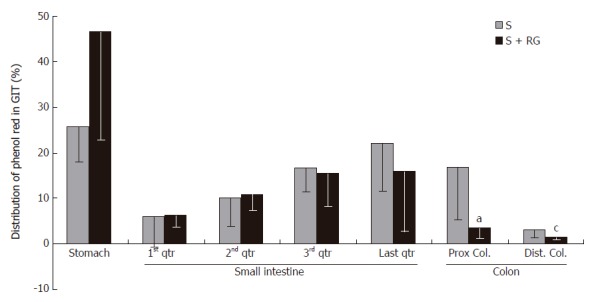
Distribution of marker (phenol red) in the different segments of the gastrointestinal tract 1 h after the dose ingestion. aP = 0.035, cP = 0.045 vs S group.
Figure 2.
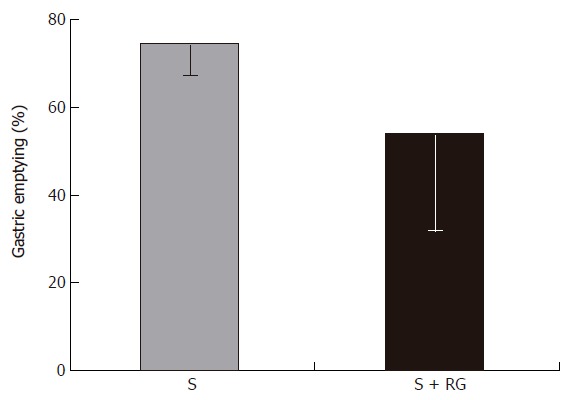
Gastric emptying 1 h after the dose ingestion.
Table 1.
Transit of the marker (phenol red) in the different segments of the intestinal tract during 1 h after the dose ingestion (mean ± SD)
| Group |
Small intestine |
Colon |
|||
| 1st quarter | 2nd quarter | 3rd quarter | Last quarter | Proximal | |
| Sorbitol (%) | 91.94 ± 8.74 | 84.56 ± 10.2 | 69.66 ± 15.42 | 44.22 ± 19.68 | 2.48 ± 2.09 |
| S + RG (%) | 87.40 ± 9.05 | 76.39 ± 10.4 | 56.97 ± 16.04 | 36.48 ± 17.96 | 3.07 ± 2.27 |
Values indicate the amount of marker (phenol red) passing into the following segments, as a percentage of the total marker that entered that particular segment.
The index for S absorption in the distal part (3rd and last quarters) of the gastrointestinal tract was greatly modified by the addition of RG to the S (Figure 3). Although the S absorption index was relatively lower in the 1st quarter of the small intestine for the S + RG group, it gradually increased from the 3rd to the last quarter of small intestine, and to the distal part of the colon. Significant differences were found at the 3rd and last quarters of the small intestine (24.85% ± 18.88% vs 0.0 ± 0.0% and 39.09% ± 32.75% vs 0.0 ± 0.0%, respectively, P < 0.05) when compared to the S group. It was noted that the absorption index in these two segments for the S group was zero.
Figure 3.
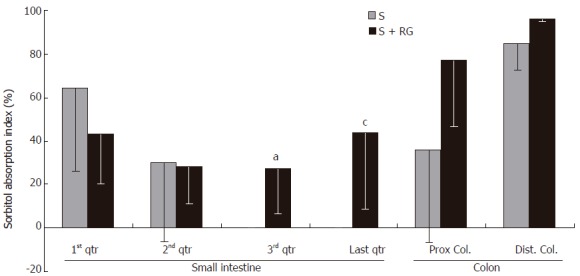
Sorbitol absorption index in the different segments of the intestinal tract during the 1 h period after dose ingestion. aP = 0.016, cP = 0.023 vs S group.
The relationship between the intestinal fluid volume and the S absorption index was inversely proportional for both the S and S + RG groups (Figure 4). In other words, the lower the fluid volume, the higher the absorption index of S, in both groups. The linear correlations between the S absorption index and the intestinal fluid volume for the different segments of the small intestine and colon are presented in Figure 5. From these correlations, although the S absorption index was significantly (P = 0.006) higher for the S group than the S + RG group in the first quarter of the small intestine, significant but inverse results were observed from the 2nd and last quarters of the small intestine and in the proximal colon of the large intestine (P = 0.056, 0.0085, 0.025, respectively). In addition, the overall S absorption index in the whole intestine was significantly (P < 0.0001) higher for the S + RG group than for the S group (Figure 5).
Figure 4.
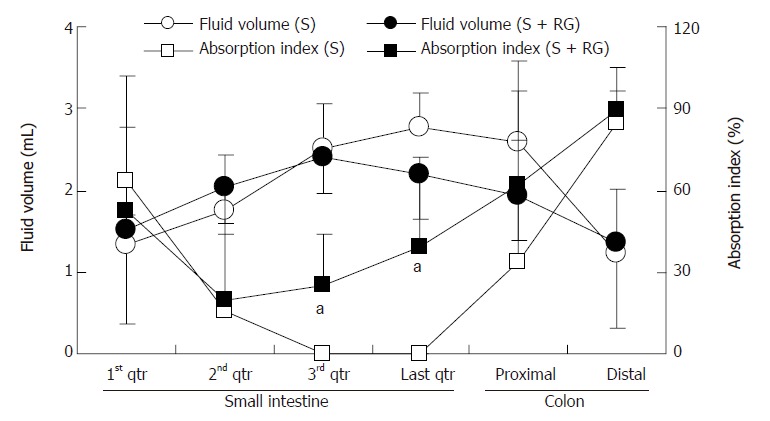
Relationship between the intestinal fluid volume and sorbitol absorption index of S and S + RG ingestion groups. One gram of intestinal contents was considered as 1 mL for the calculation of the volume of intestinal fluid. aP < 0.05 vs S group.
Figure 5.
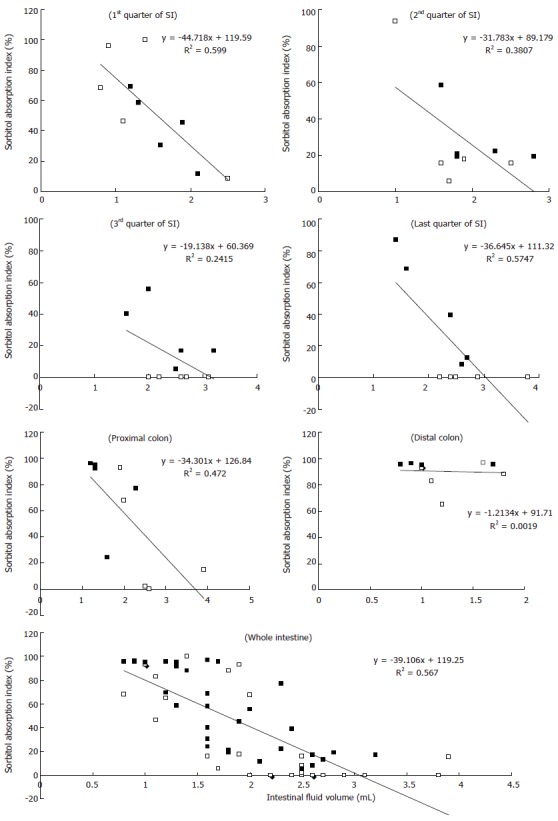
Correlation between the sorbitol absorption index (Y axis) and intestinal fluid volume (X axis) of S (□) and S + RG (■) groups in the different segments of the small intestine (SI), colon, and whole intestine. The P values indicate significant differences in the 1st quarter (P = 0.0064), 2nd quarter (P = 0.056), last quarter (P = 0.0085) of the small intestine; proximal colon of large intestine (P = 0.0259); and for the whole intestine (P < 0.0001) when S and S + RG groups are compared.
DISCUSSION
When a moderate amount of S (up to 30 g) is taken by a human, a very small amount of it is slowly absorbed in the small intestine through passive diffusion, while most enters into the colon for bacterial fermentation to produce various short chain fatty acids (SCFAs), and less than 10% of the ingested amount is excreted in the feces[15,16]. Higher concentrations of SCFAs, especially succinic and lactic acid, in the colon are responsible for increased colonic osmolality and cause osmotic diarrhea in cecectomized rats[7,9] and pigs[8]. It was reported that ingestion of 30-50 g of S (500-800 mg/kg b.w.) caused diarrhea in adult humans[17,18]. In this study, a non-physiological high and osmotically-active single oral dose of S (1200 mg/kg b.w.) was ingested to study the effects of RG on intestinal absorption of S. This is also more than the laxative threshold dose of S for humans (500-800 mg/kg).
A non-absorbable water-soluble recovery marker (phenol red) was used in this study to precisely measure the gastric emptying, intestinal transit and intestinal absorption indexes of S. It has been reported that there may be some binding of phenol red by the stomach tissue, even if the rat is killed within seconds of intubation[11]. Therefore, the phenol red was extracted from both the gastrointestinal contents and their respective tissues for measurement in this experiment, and a substantial amount of marker was recovered from the gut tissues (13.86% ± 4.62% of the total recovery).
The total recovery of the marker was 93.8% ± 1.56% of the given amount. Urine was not sampled for determination of the concentration of either S or for phenol red, as it is a non-absorbable marker and a very trace amount only can be detected in the urine[11]. The excretion of S in the urine is also only of trace amounts, either with a low or high single oral dose[19].
The determination of the concentration of S along with a non-absorbable marker in the different parts of the digestive tract after a single bolus dose with or without RG is an important investigation that may clarify the effects of RG on S absorption in the small intestine. In a recent study, Islam et al[9] reported that intestinal transit and mean retention time of S are relatively longer when S is fed with RG rather than alone. From the present experiment, it was confirmed that slower gastric emptying (Figure 2) in the S + RG group compared to the S group caused slower digesta transit in the different segments of the gastrointestinal tract.
Rice starch (RS) contained in RG is a bulk aggregation (n = 20-60) of smaller granules (3-8 μm in diameter) than in corn starch (5-15 μm in diameter), and is larger in size (0.99 kg/L) and denser in structure than corn starch (0.63 kg/L)[20]; it was found to be degraded slowly by pancreatic amylase and gradually released oligosaccharides and glucose at a slower rate in the intestinal brush border than corn starch[21]. Therefore, the rate of intestinal transit of S was relatively slower when ingested with RG, rather than alone. After consumption of S, a shorter orocecal transit time has been reported as a cause of S intolerance in a human-based study[22]. The slower gastric emptying and slower intestinal transit may result in maintenance of a constant normal osmotic environment in the inner intestinal lumen and facilitation of S absorption to prevent osmotic diarrhea in cecectomized rats[9]. In addition, slower gastric emptying and slower intestinal transit increases small intestinal mineral absorption in rats[23]. The energy value of sugar alcohols also depends on the extent to which they are absorbed along the small intestine[24]. In vivo and in vitro studies showed that longer transit times in the large intestine can have profound effects on bacterial physiology and metabolism, leading to breakdown of protein and fermentation of amino acids making an increased contribution to colonic SCFA pools[25-28]. Through this mechanism, RG increases the nutritional value of S not only by increasing the energy value through small intestinal absorption, but also by preventing the possible risk of osmotic diarrhea.
The S absorption index in the 3rd to the last quarter of the small intestine was significantly increased in this experiment when ingested with RG. In contrast, no S was absorbed from the above region during a 1 h period after the ingestion of S only. It was found that the absorption index of S in the small intestine was increased by the addition of RG, but the actual location(s) of increased absorption was not clear from the results of the single oral dose study. However, from the existing data it can be assumed that the highest amount of S was absorbed in the upper half of the small intestine, for both groups. Further study using a continuous feeding method could confirm the quantitative information on S absorption from the small intestinal tract. However, it was previously reported that RG releases an increased amount of glucose at the luminal surface as well as over a large segment of the small intestine[21]. In the presence of extra glucose, the influx of S across the luminal membrane increased significantly[10]. Moreover, slower gastric emptying and slower transit time caused by RG lengthened the contact time between S and intestinal mucosa, and facilitated the absorption of S by passive diffusion[29]. Although RG releases an increased amount of glucose, it avoids creating additional osmolality at the luminal surface, because the release of glucose occurs slowly from the polysaccharide and is over a large segment of the intestine[21]. The higher absorption of S in the presence of extra glucose prevented hyper-osmolality in the intestinal lumen, which prevented osmotic diarrhea in cecectomized rats.
Transit and volume of the intestinal fluid are important determinants of the degree of digestion and absorption in the small intestine. Both parameters, when they are increased excessively, have the potential to reduce degradation and absorption by limiting substrate contact with the mucosal surface[30,31]. The relatively slower transit and lower intestinal fluid volume in the S + RG group than in the S group enhanced the absorption of S from distal parts of the small intestine and colon. A linear correlation between the S absorption index and fluid volume was found in this study (Figure 5).
From the results of our present study it can be summarized that the possible causes of indigestible but fermentable material-based diarrhea are: (1) faster intestinal transit; (2) small intestinal mal-absorption; (3) incomplete colonic fermentation of S, and (4) slower absorption of some organic acids (e.g., lactic, succinic) from the colon.
The above summarized points are interrelated, with a sequential tendency, and are supported by some previously reported proposals of Rambaud et al[4], Ammon et al[6], and Islam et al[7].
In summary, our study shows that RG plays an important role in stimulating the small intestinal absorption of S. As a result, a smaller amount of S entered into the colon for fermentation. Moreover, due to a slower transit time, the S that entered the colon was completely fermented to rapidly absorbable SCFAs and this prevented the possible increment of osmolality by some organic acids (e.g., lactic, succinic). These may be the mechanisms by which hard feces were formed in the mid to distal colon of the cecectomized rats.
Footnotes
S- Editor Pan BR L- Editor Lutze M E- Editor Bi L
References
- 1.Jain NK, Rosenberg DB, Ulahannan MJ, Glasser MJ, Pitchumoni CS. Sorbitol intolerance in adults. Am J Gastroenterol. 1985;80:678–681. [PubMed] [Google Scholar]
- 2.Hyams JS. Chronic abdominal pain caused by sorbitol malabsorption. J Pediatr. 1982;100:772–773. doi: 10.1016/s0022-3476(82)80586-6. [DOI] [PubMed] [Google Scholar]
- 3.Soergel KH. Colonic fermentation: metabolic and clinical implications. Clin Investig. 1994;72:742–748. doi: 10.1007/BF00180540. [DOI] [PubMed] [Google Scholar]
- 4.Rambaud JC, Flourié B, Florent C. [What is the status of fermentation diarrhea] Rev Prat. 1989;39:2598–2602. [PubMed] [Google Scholar]
- 5.Read NW, Miles CA, Fisher D, Holgate AM, Kime ND, Mitchell MA, Reeve AM, Roche TB, Walker M. Transit of a meal through the stomach, small intestine, and colon in normal subjects and its role in the pathogenesis of diarrhea. Gastroenterology. 1980;79:1276–1282. [PubMed] [Google Scholar]
- 6.Ammon HV, Phillips SF. Inhibition of colonic water and electrolyte absorption by fatty acids in man. Gastroenterology. 1973;65:744–749. [PubMed] [Google Scholar]
- 7.Islam MS, Sakaguchi E, Kashima N, Hoshi S. Effect of sugar alcohols on gut function and body composition in normal and cecectomized rats. Exp Anim. 2004;53:361–371. doi: 10.1538/expanim.53.361. [DOI] [PubMed] [Google Scholar]
- 8.Tsukahara T, Ushida K. Succinate accumulation in pig large intestine during antibiotic-associated diarrhea and the constitution of succinate-producing flora. J Gen Appl Microbiol. 2002;48:143–154. doi: 10.2323/jgam.48.143. [DOI] [PubMed] [Google Scholar]
- 9.Islam MS, Nishiyama A, Sakaguchi E. Rice gruel and rice starch reduce sorbitol-induced diarrhoea in cecectomized rats. Digestion. 2005;72:13–21. doi: 10.1159/000087398. [DOI] [PubMed] [Google Scholar]
- 10.Beaugerie L, Nath SK, Desjeux JF. [Glucose stimulates the absorption of sorbitol through the human jejunal mucosa] Gastroenterol Clin Biol. 1989;13:379–382. [PubMed] [Google Scholar]
- 11.REYNELL PC, SPRAY GH. The simultaneous measurement of absorption and transit in the gastro-intestinal tract of the rat. J Physiol. 1956;131:452–462. doi: 10.1113/jphysiol.1956.sp005474. [DOI] [PMC free article] [PubMed] [Google Scholar]
- 12.Soontornchai S, Krüger D, Grossklaus R. Small intestinal transit and digestibility of lactitol in Wistar rats. Z Ernahrungswiss. 1998;37:358–362. doi: 10.1007/s003940050037. [DOI] [PubMed] [Google Scholar]
- 13.French AB, Brown IF, Good CJ, McLeod GM. Comparison of phenol red and polyethyleneglycol as nonabsorbable markers for the study of intestinal absorption in humans. Am J Dig Dis. 1968;13:558–564. doi: 10.1007/BF02233070. [DOI] [PubMed] [Google Scholar]
- 14.Miwa I, Kanbara M, Wakazono H, Okuda J. Analysis of sorbitol, galactitol, and myo-inositol in lens and sciatic nerve by high-performance liquid chromatography. Anal Biochem. 1988;173:39–44. doi: 10.1016/0003-2697(88)90155-8. [DOI] [PubMed] [Google Scholar]
- 15.WICK AN, ALMEN MC, JOSEPH L. The metabolism of sorbitol. J Am Pharm Assoc Am Pharm Assoc. 1951;40:542–544. doi: 10.1002/jps.3030401104. [DOI] [PubMed] [Google Scholar]
- 16.ADCOCK LH, GRAY CH. The metabolism of sorbitol in the human subject. Biochem J. 1957;65:554–560. doi: 10.1042/bj0650554. [DOI] [PMC free article] [PubMed] [Google Scholar]
- 17.Ravry MJ. Dietetic food diarrhea. JAMA. 1980;244:270. doi: 10.1001/jama.1980.03310030046027. [DOI] [PubMed] [Google Scholar]
- 18.Charney EB, Bodurtha JN. Brief clinical and laboratory observations. J Pediatr. 1981;98:157–158. doi: 10.1016/s0022-3476(81)80563-x. [DOI] [PubMed] [Google Scholar]
- 19.Herfarth H, Klingebiel L, Juhr NC, Grossklaus R. Dose dependency of fermentation and the extent of renal excretion of palatinit (isomalt) in rats with respect to its energy value. Z Ernahrungswiss. 1994;33:185–194. doi: 10.1007/BF01610784. [DOI] [PubMed] [Google Scholar]
- 20.Cheng HH, Lai MH. Fermentation of resistant rice starch produces propionate reducing serum and hepatic cholesterol in rats. J Nutr. 2000;130:1991–1995. doi: 10.1093/jn/130.8.1991. [DOI] [PubMed] [Google Scholar]
- 21.Molla AM, Bari A, Greenough WB 3rd, Molla AM, Budhiraja P, Sharma PN. Bangladeshi rural mothers prepare safer rice oral rehydration solution. Acta Paediatr. 2000;89:791–794. [PubMed] [Google Scholar]
- 22.Jain NK, Patel VP, Pitchumoni CS. Sorbitol intolerance in adults. Prevalence and pathogenesis on two continents. J Clin Gastroenterol. 1987;9:317–319. doi: 10.1097/00004836-198706000-00015. [DOI] [PubMed] [Google Scholar]
- 23.Fukahori M, Sakurai H, Akatsu S, Negishi M, Sato H, Goda T, Takase S. Enhanced absorption of calcium after oral administration of maltitol in the rat intestine. J Pharm Pharmacol. 1998;50:1227–1232. doi: 10.1111/j.2042-7158.1998.tb03338.x. [DOI] [PubMed] [Google Scholar]
- 24.Beaugerie L, Flourié B, Marteau P, Pellier P, Franchisseur C, Rambaud JC. Digestion and absorption in the human intestine of three sugar alcohols. Gastroenterology. 1990;99:717–723. doi: 10.1016/0016-5085(90)90960-9. [DOI] [PubMed] [Google Scholar]
- 25.Macfarlane GT, Gibson GR, Cummings JH. Comparison of fermentation reactions in different regions of the human colon. J Appl Bacteriol. 1992;72:57–64. doi: 10.1111/j.1365-2672.1992.tb04882.x. [DOI] [PubMed] [Google Scholar]
- 26.Macfarlane GT, Gibson GR, Macfarlane S. Short chain fatty acid and lactate production by human intestinal bacterial grown in batch and continuous culture. In: HJ Binder, JH Cummings and KH Soergel., editors. Short Chain Fatty Acids. London: Kluwer Publishing; 1994. pp. 44–60. [Google Scholar]
- 27.Macfarlane S, Quigley ME, Hopkins MJ, Newton DF, Macfarlane GT. Effect of retention time on polysaccharide degradation by mixed populations of human colonic bacteria studied under multi-substrate limiting conditions in a three-stage compound continuous culture system. FEMS Microbiol Ecol. 1998;26:231–243. [Google Scholar]
- 28.Macfarlane S, Macfarlane GT. Regulation of short-chain fatty acid production. Proc Nutr Soc. 2003;62:67–72. doi: 10.1079/PNS2002207. [DOI] [PubMed] [Google Scholar]
- 29.Beaugerie L, Flourié B, Lémann M, Achour L, Franchisseur C, Rambaud JC. Sorbitol absorption in the healthy human small intestine is increased by the concomitant ingestion of glucose or lipids. Eur J Gastroenterol Hepatol. 1995;7:125–128. [PubMed] [Google Scholar]
- 30.Dillard RL, Eastman H, Fordtran JS. Volume-flow relationship during the transport of fluid through the human small intestine. Gasteroenterology. 1965;49:58–66. [Google Scholar]
- 31.Holgate AM, Read NW. Relationship between small bowel transit time and absorption of a solid meal. Influence of metoclopramide, magnesium sulfate, and lactulose. Dig Dis Sci. 1983;28:812–819. doi: 10.1007/BF01296904. [DOI] [PubMed] [Google Scholar]


