Abstract
Aim:
Disrupted sleep may be a prodromal symptom or a predictor of depressive disorders. In this study we investigated the relationship between depression symptoms and disrupted sleep using a novel model of stress-mimicked sleep disorders in rats.
Methods:
SD rats were injected with corticosterone (10, 20 or 40 mg/kg, sc) or vehicle for 7 d. Their sleep-wake behavior was monitored through implanted EEG and EMG electrodes. Their depressive behaviors were assessed using forced swim test, open field test and sucrose preference test.
Results:
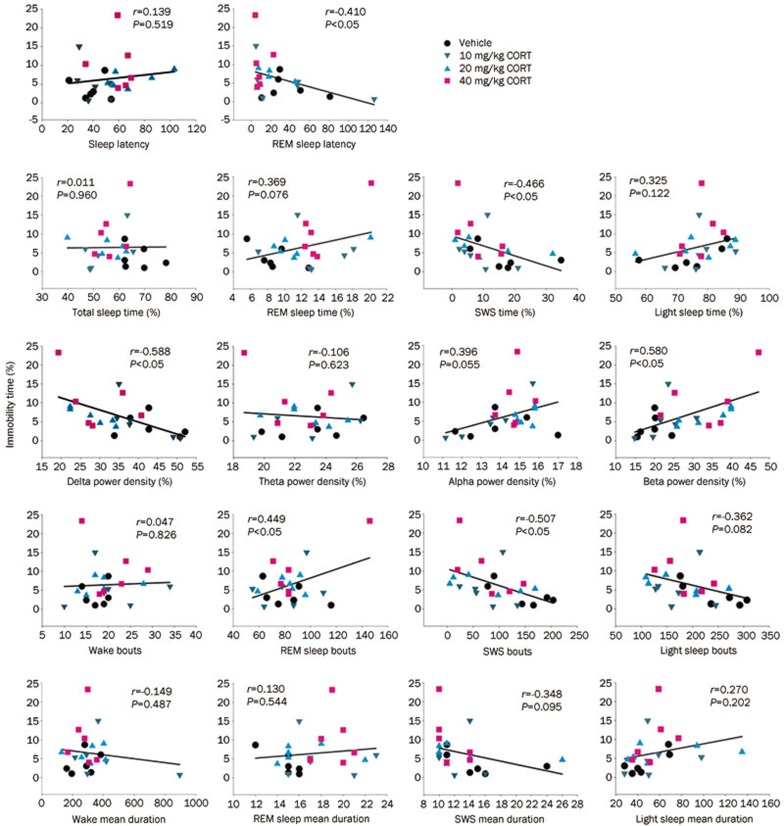
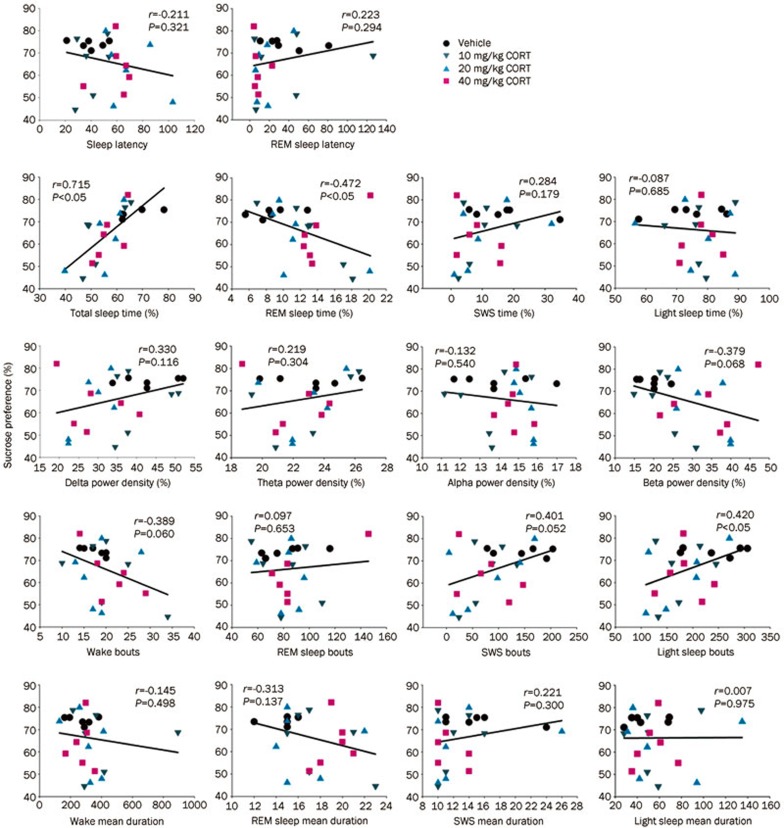
The corticosterone-treated rats showed significantly reduced sleep time, disinhibition of rapid-eye-movement (REM) sleep and altered power spectra during non-REM sleep. All depressive behavioral tests did not show significant difference across the groups. However, individual correlation analysis revealed statistically significance: the immobility time (despair) was negatively correlated with REM sleep latency, slow wave sleep (SWS) time ratio, SWS bouts and delta power density, and it was positively correlated with REM sleep bouts and beta power density. Meanwhile, sucrose preference (anhedonia) was positively correlated with total sleep time and light sleep bouts, and it was negatively correlated with the REM sleep time ratio.
Conclusion:
In stress-mimicked rats, sleep disturbances are a predictor of depressive disorders, and certain symptoms of depression may be related to the disruption of several specific sleep parameters.
Keywords: depression, sleep, corticosterone, stress, EEG, open field test, forced swim test, sucrose preference test
Introduction
Epidemiological data from the patients of general practitioners strongly suggest that insomnia is not only a typical symptom of depression but, conversely, it may be an independent risk factor for depression1,2. Similar results were reported by Breslau et al3, who observed a relative risk of 4.0 for a new onset of major depression in persons with a history of insomnia at baseline. Several other publications4,5,6, all based on epidemiological investigations, noted that insomnia in a given individual may be a major risk factor for the subsequent development of depression. The literature suggests that insomnia may be considered to be a prodromal symptom or predictor of a depressive disorder that develops later. In addition, chronic insomnia itself may be an important factor that triggers depression. Consequently, Ford and Kamerow6 and others7 have suggested that adequate early treatment of sleep disorders may provide an opportunity for the prevention of psychiatric disorders.
Most of the previous studies have examined the relationship between the overall severity of depression and sleep variables. For example, poor sleep maintenance, such as sleep fragmentation or sleep efficiency, was significantly correlated with depression severity scores8. The delta sleep ratio is correlated with the early recurrence of depression9. Some research has reported that reduced REM latency is correlated with endogenous symptoms, such as loss of appetite and distinct quality of mood10. Although differences in sleep-wake architecture have been noted11,12, the relationship of these differences to specific symptoms of depression is often assumed or absent.
Stress can trigger physiological and behavioral responses that can lead to a surge in arousal, alertness, vigilance, focused attention and cognitive processing13. To study depression, many researchers utilize rodents as a convenient model for analyzing behavioral and pharmacological responses to stress. The hypothalamo-pituitary-adrenocortical (HPA) system mediates the reaction to stress. Prolonged stress can challenge the capacity of the HPA system and may therefore cause serious mental or physical disorders, such as depression14. Repeated administration of corticosterone (CORT) can mimic the stress response and avoid the individual differences that can occur when an animal is exposed to stressors15. Many studies have adopted this paradigm for inducing depressive behaviors in animal models16,17.
The causal relationship between sleep-wake architecture and the specific symptoms of depression has not received adequate attention in the previous literature. To address this gap, we treated Sprague-Dawley rats with CORT for 7 d. Animals went through a series of behavioral tests, and measurements including immobility time (despair) during the forced swim test (FST), locomotor activity and sucrose consumption (anhedonia)18 were obtained. To correlate these metrics with the sleep-wake architecture, we performed electroencephalographical (EEG) recordings.
Materials and methods
Animals and drug administration
Twenty-four male Sprague-Dawley rats (Grade I, purchased from the Animal Center of Peking University, Beijing, China) were used. All of the experiments were conducted in accordance with the European Community guidelines for the use of experimental animals and approved by the Peking University Committee on Animal Care and Use. The rats were housed in acrylic fiber cages individually and had access to food and water ad libitum, with a 12:12 h light/dark schedule (lights on at 9:00 am). The ambient temperature averaged 22±2 °C, and the relative humidity was 50%±10%. Rats were injected subcutaneously with 10, 20 and 40 mg/kg CORT (corticosterone 21-acetate, Sigma, St Louis, MO, USA)16 dissolved in 1 mL/kg of saline with 2% Tween 80 (Sigma) once a day at 9:00 AM, for 7 d. The control group was injected with vehicle only.
Surgery
At least one week prior to any sleep recordings, the animals were instrumented using standard procedures, as reported previously19. Briefly, under chloral hydrate (300 mg/kg) anesthesia, two stainless steel screws attached to an insulated wire were implanted in the skull over the frontal-parietal cortex for EEG recording. One was placed approximately 2 mm anterior and 2 mm to the right of Bregma; another was placed approximately 3 mm posterior and 2 mm to the left of Bregma. A ground electrode was placed between the two, 3 mm lateral to midline. For electromyography (EMG), a pair of wire electrodes was threaded through the nuchal muscles. These electrodes were attached to a miniature connector, which was affixed to the skull with dental acrylic. After the surgery, rats were injected with antibiotics for 3 d and were allowed to recover for 7 d prior to the experiments. For the purposes of habituation, the animals were connected to the recording apparatus at least one day before the start of the EEG recording.
EEG and EMG recordings and analysis
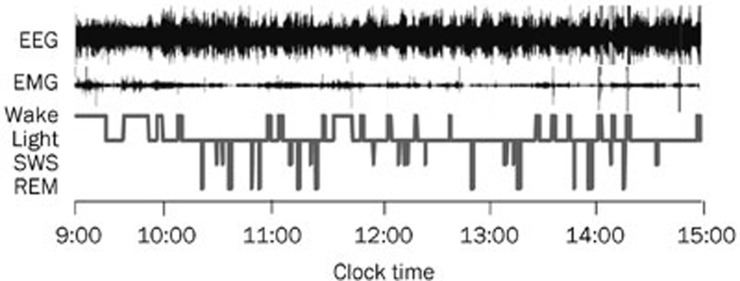
For electrophysiological recording, a lightweight shielded cable was plugged into the connector on the rat's head and attached to a counterbalanced swivel that allowed for free movement. All rats were studied in an electrically shielded box and a noise-attenuated environment that was free from interruptions. The signals were routed to an electroencephalograph (Model MP 150, BIOPAC Systems, Goleta, CA, USA). Recordings were performed after the last CORT injection, from 9:00 to 15:00. The signals were amplified and filtered (EEG, 0.5–30 Hz; EMG, 10–100 Hz), then digitized at a sampling rate of 128 Hz and recorded using the AcqKnowledge software (BIOPAC Systems). The EEG/EMG recordings were analyzed in 10 s epochs using the standard criteria embedded in SleepSign v.2.0 (Kissei Comtec Co, LTD, Nagano, Japan). Sleep-wake states were automatically classified as wakefulness, rapid-eye-movement (REM) sleep, light sleep (LS) and slow wave sleep (SWS). As a final step, the defined sleep-wake stages were manually examined and corrected according to the visual observations of the animal's behavior, which was recorded using a video camera. An example of the sleep recording analysis in one rat is shown in Figure 1.
Figure 1.
Typical examples of polygraphic recordings and corresponding hypnograms in rats. EEG, electroencephalography; EMG, electromyography; Light, light sleep.
Each epoch was assigned to one of the following categories: wakefulness (low-amplitude EEG activity, high-voltage EMG activity), REM sleep (fast Fourier transform (FFT) theta ratio of EEG≥60%, desynchronized EEG, absence of tonic EMG, occasional body twitches while maintaining a recumbent sleep posture), SWS (FFT delta ratio of EEG≥70%, large-amplitude, synchronous EEG with sleep spindles present, greatly diminished tonic EMG, eyes closed, small eye movement potentials present, recumbent posture, animal was usually lying on its side or curled up with head down) and LS (FFT delta ratio of EEG<70%, high-amplitude slow or spindle EEG activity, low-amplitude EMG activity). Non-rapid eye movement (NREM) sleep time was defined as the SWS time plus LS time. Total sleep (TS) time equals the NREM sleep time plus REM sleep time.
For the power spectrum analysis, the amplified and filtered data were digitized and subjected to a FFT (SleepSign) for calculating the cortical EEG power during NREM sleep of the total 6-h recording. The analysis focused on four frequency ranges: the delta band (0–4 Hz), theta band (4–8 Hz), alpha band (8–12 Hz) and beta band (12–30 Hz). The power of each frequency band was averaged and expressed as a percent of the total power within the frequency range of 0–30 Hz.
Open field test
After 6 h of sleep recording, locomotor activity was measured by an open field test that used four identical clear Plexiglas chambers (40 cm×40 cm×65 cm) and an automated video tracking system (DigBehv-LM4, Shanghai Jiliang Software Technology, Shanghai, China). The video files were analyzed using DigBehv analysis software. Locomotor activity is expressed as the total distance and total active time traveled in 5, 10, and 15 min of the time tested.
Forced swim test
The FST is a well-established behavioral model of despair. In this experiment, FST was performed according to a modified version of the paradigm16,17. After sleep recording, each rat was placed individually, for 5 min, into a 25 cm diameter×60 cm height Plexiglas cylinder filled with 23–25 °C water to a depth of 40 cm. The rat's behavior was recorded with two direction video cameras (top and side). Immobility time was assessed from the videotapes by a researcher who was blind to each rat's treatment condition. Immobility was defined as the minimum movement necessary to keep the rat's head above water. After the experiment, the rat was removed from the cylinder, dried off with a towel, and placed back in its home cage to be dried under a heat lamp. The water in the swim tank was changed for each rat.
Sucrose preference test (SPT)
Sucrose preference is considered to be an index of anhedonia20. After FST, the rats were trained for 48 h to adapt to a 1% sucrose solution (w/v) at the beginning of the experiment in which two bottles with 1% sucrose solution were placed in each cage. After adaptation, the rats were deprived of water for 4 h and then underwent the SPT, in which the rats were housed in individual cages for 1 h and exposed to two identical bottles, one filled with 1% sucrose solution and the other filled with water. At the end of the 1-h test, sucrose and water consumption was measured. Sucrose preference (%) was calculated as sucrose consumption/(sucrose consumption+water consumption).
Statistical analysis
All of the values are expressed as the mean±SEM. For multiple comparisons, data were analyzed using a one-way analysis of variance (ANOVA) followed by the Student-Newman-Keuls test. P<0.05 was considered statistically significant. The correlation between immobility time or sucrose preference and different sleep parameters were assessed using Pearson's correlation analysis. Correlation analysis was performed on pooled data (n=24), from both controls and CORT-treated rats at all doses (n=6/group).
Results
Effects of CORT on body weight
Compared to the control group, treatment with 40 mg/kg CORT inhibited the increase of body weight during the 7 d of administration. No significant differences were found in 10 and 20 mg/kg CORT-treated groups (Table 1). Additionally, there was a marked reduction in the body weight of 40 mg/kg CORT-treated rats on d 7 (P<0.05, Table 1).
Table 1. Effect of CORT on body weight during 7 d after injections. n=6. Mean±SEM. bP<0.05 vs vehicle group.
| CORT doses | Body weight (g) |
||||||
|---|---|---|---|---|---|---|---|
| d 1 | d 2 | d 3 | d 4 | d 5 | d 6 | d 7 | |
| Vehicle | 269.50±19.27 | 280.33±20.16 | 283.17±14.74 | 298.17±12.13 | 311.16±12.51 | 321.50±12.64 | 326.83±12.83 |
| 10 mg/kg | 269.83±19.15 | 273.17±17.92 | 274.33±20.56 | 284.33±12.87 | 295.00±15.52 | 302.67±15.01 | 307.83±17.33 |
| 20 mg/kg | 278.50±21.07 | 281.17±21.63 | 284.17±25.58 | 297.83±23.84 | 304.17±23.79 | 306.33±21.26 | 312.17±21.35 |
| 40 mg/kg | 264.00±4.51 | 261.00±6.96 | 262.67±4.84 | 265.83±4.19 | 267.67±3.48 | 267.00±4.82 | 261.67±7.46b |
Sleep differences after repeated CORT administration
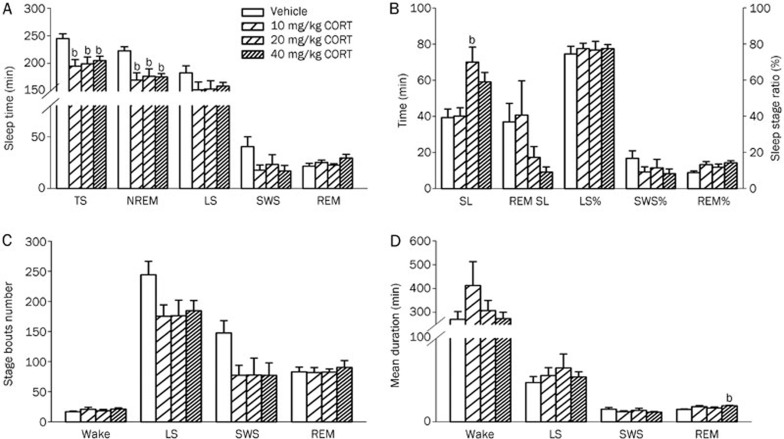
After a 7-d administration of CORT (10, 20 and 40 mg/kg), rats showed obvious sleep disturbances. There were significant treatment variations in total sleep time and NREM sleep time. Compared to the control group (244.92±8.84 min), total sleep time was markedly decreased in the animals that received 10 mg/kg CORT (194.95±11.87 min, P<0.05), 20 mg/kg CORT (199.2±12.34 min, P<0.05) and 40 mg/kg CORT (204.98±8.06 min, P<0.05) treatments. NREM sleep time was also significantly reduced by the administration of 10 mg/kg CORT (169.85±13.23 min, P<0.05), 20 mg/kg CORT (176.61±13.51 min, P<0.05) and 40 mg/kg CORT (175.51±5.85 min, P<0.05) compared to that of the vehicle control (222.78±7.34 min). However, light sleep time, SWS and REM sleep time did not vary significantly across treatment groups (Figure 2A).
Figure 2.
Effects of a 7-d administration of CORT on sleep. After the administration of CORT (10, 20 and 40 mg/kg) for 7 d, the following sleep parameters were assessed: (A) Total sleep (TS), NREM sleep, light sleep (LS), SWS and REM sleep; (B) Sleep latency (SL), REM SL, as well as the percentage of sleep time spent in light sleep (LS%), SWS% and REM%; (C) The number of bouts of wakefulness, light sleep, SWS and REM sleep; (D) The mean duration of wakefulness, LS, SWS and REM sleep. Data are represented as the mean±SEM. n=6/group. bP<0.05 vs control.
To examine various group-specific differences in sleep and wake cycles, the stages were further analyzed for the latency of onset (Figure 2B), number of episodes (bouts, Figure 2C) and mean duration (Figure 2D). We observed significant differences only in sleep latency and mean REM duration. Compared to the control group (39.33±4.74 min), sleep latency was significantly prolonged by the administration of 20 mg/kg CORT (70.03±8.31 min, P<0.05). Mean REM duration was significantly increased in the 40 mg/kg CORT group (17.16±0.60 s) as compared to control (14.83±0.60 s, P<0.05). Although the shortened REM sleep latency (P=0.174) and the increased REM sleep ratio (REM%, P=0.064) were evident after repeated treatment with 40 mg/kg CORT, no significant differences were observed between the treatment groups. Additionally, there were no significant differences in the mean wake duration, mean light sleep durationand mean SWS duration. Moreover, wake bouts, SWS bouts, light sleep bouts and REM sleep bouts were not significantly different between groups.
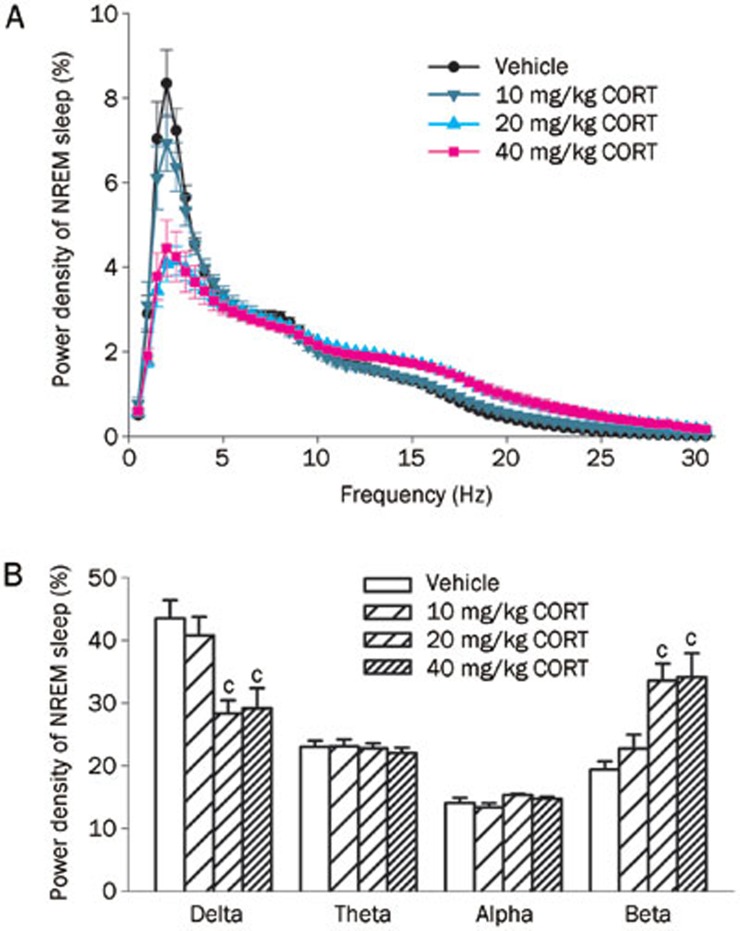
After 7 d of CORT (20 and 40 mg/kg) injections, a sharp reduction (-34.67% and -28.56%, respectively) of delta power (0–4 Hz, both P<0.01) and broad increase (72.22% and 50.10%, respectively) in beta power (12–30 Hz, both P<0.01) during NREM sleep occurred in both groups compared to the control group (Figure 3). Meanwhile, the power densities of theta (4–8 Hz) and alpha (8–12 Hz) were not changed across treatment groups.
Figure 3.
Effects of a 7-d administration of CORT on EEG spectral power during NREM sleep. (A) The power of each 0.5 Hz bin was first averaged across the sleep stages individually and then normalized by calculating the percentage of each bin from the total power (0–30 Hz) of each animal; (B) Power density of delta (0–4 Hz), theta (4–8 Hz), alpha (8–12 Hz) and beta bands (12–30 Hz) were examined. Data are represented as the mean±SEM. n=6/group. cP<0.01 vs control.
Depressive behavior after repeated administration of CORT
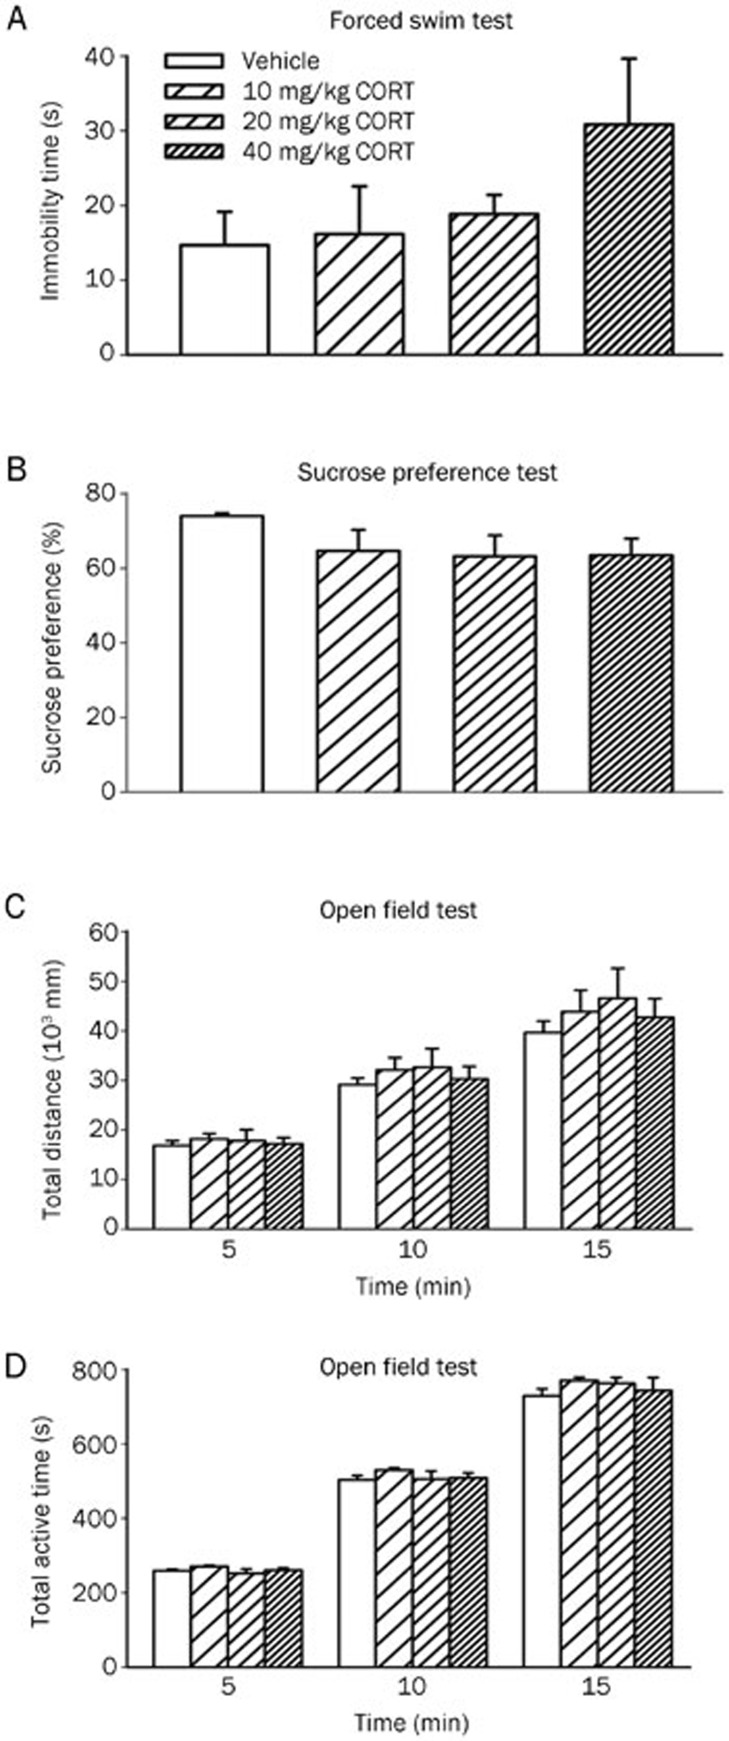
The ethological variables of depressive behavior after 7 d of CORT administration are shown in Figure 4. Although a trend seems apparent, no significant treatment effects were present in the forced swimming (Figure 4A) and sucrose preference tests (Figure 4B). The absence of a significant effect could be because the rat model of depression has not been fully developed.
Figure 4.
Effects of a 7-d administration of CORT on immobility time in the forced swim test (A), sucrose preference ratio (B) and total distance (C) and total active time (D) in the open field test. Data are represented as the mean±SEM. n=6/group.
To test the rats' normal behavior, we monitored their locomotor activity using an open field test. There were no obvious differences in locomotor activity, as measured by total distance (Figure 4C) and total active time (Figure 4D) during the tested 5, 10 and 15 min.
Relationship between immobility time (hopelessness or despair) and sleep parameters and EEG spectral power
After evaluating the differences in sleep parameters and EEG spectral power between the treatment groups receiving 7 d of CORT injections and the control group, we analyzed the correlation between depressive behavior and specific sleep parameters as well as EEG power spectra. Immobility time is a hopelessness or despair indicator of depression. Pearson's correlation analysis was performed to illustrate any relationship between the despair indicator (represented by immobility time in FST) and the sleep parameters or EEG spectral power density in CORT-treated rats. The results demonstrate that the immobility time ratio was not only negatively correlated with REM sleep latency, SWS ratio, SWS bouts and delta power density during NREM sleep but was also positively correlated with REM bouts and beta power (Figure 5, P<0.05). These results indicate that there is a linear relationship between immobility time and certain sleep parameters and EEG spectral power.
Figure 5.
The relationship between the immobility time ratio and the individual sleep parameters (Pearson's correlation test, n=24).
Relationship between sucrose preference ratio (anhedonia) and sleep parameters and EEG spectral power
The comparisons between the sucrose preference ratio and the sleep parameters and/or EEG spectral power density after 7 d of CORT injections are represented in Figure 6. The sucrose preference ratio was positively correlated (Pearson's correlation analysis) with sleep time and light sleep bouts, while it was negatively correlated with the REM sleep ratio (P<0.05). These results indicate that reduced sleep time, reduced frequency of sleep and disinhibition of REM sleep may promote the formation of anhedonia. We did not observe any correlation between the sucrose preference ratio and other sleep parameters.
Figure 6.
The relationship between the sucrose preference ratio and the individual sleep parameters (Pearson's correlation test, n=24).
Discussion
The relationship between insomnia and depressive disorders is reciprocal21. Nevertheless, the biological processes underlying this causal relationship are not yet fully understood. A growing body of evidence suggests that chronic insomnia is a strong risk factor for the development of depression4,5,6 as well as a prognostic indicator of the clinical course and the response to treatment in depressive disorders22. In a 2005 commentary in SLEEP23, Fred Turek considered this evidence and declared that insomnia causes depression. This result did not apply to everyone, of course, and insomnia does not always precede and is not always present in depression; however, insomnia is one independent cause of depression. It has also been noted that depression and insomnia are not strictly “birds of a feather”24, but how and in what form insomnia presents itself may be important. Most of the previous studies have reported a relationship between the overall severity of depression and specific sleep variables. For example, REM sleep latency25 and REM density26 have both been shown to predict the severity of depression. There are several lines of preliminary evidence suggesting that adjuvant insomnia treatments can have a greater impact on insomnia and depression than the treatment of depression alone27,28. The problem of identifying the most depression-vulnerable insomnia subtypes still remains for the current generation of insomnia-depression research.
Core symptoms of major depression include anhedonia, despair, insomnia and cognitive impairment, along with frequent anxiety and comorbid diseases29,30. In an animal model, the increased immobility behavior in the FST is considered to be an indicator of despair and sucrose preference is considered to be an index of anhedonia16,17,20. In this study, we used a repetitive CORT treatment paradigm to mimic stress-induced sleep disorders. The decreased body weight and increased serum CORT level (data not shown) verified the validity of the CORT administration. Lussier et al31 also reported that after a 7-d administration of CORT (40 mg/kg) rats showed decreased body weight. Interestingly, Lussier et al31 also found that 14 and 21 d of CORT injections (40 mg/kg) produced clear behavioral changes in the FST but that 7 d of CORT injections did not produce significant differences in immobility. The authors proposed that treatment with CORT increases depression-like behavior gradually over a 21-d period and the development of depression-like behavior in CORT-treated rats occurs in a linear manner. The results of the present study indicate that after a 7-d treatment of CORT (40 mg/kg), rats showed higher levels of immobility time and lower levels of sucrose preference than did the rats in the control group; however, these changes did not reach statistical significance. Based on the present study and Lussier's report, it could be surmised that administration of CORT (40 mg/kg) for 7 d may cause the rats to enter an early stage of depression.
Although there were no significant differences in immobility time and sucrose preference across groups in the present study, profound differences were evident in the rats' sleep-wake behavior. Disturbances of sleep are typical for most depressed patients and are a part of the core symptoms of the disorder. Polysomnographic sleep research has demonstrated that in addition to disturbances in sleep continuity, in depression, sleep is characterized by a reduction of SWS and a disinhibition of REM sleep, with a shortening of REM latency, prolongation of the first REM period, increased REM density and abnormal EEG power spectrum32. In our experiment, administration of CORT for 7 d induced a remarkable decrease in NREM sleep, a significant decrease in delta power and an increase in broad beta power. These results put into question the degree to which changes in sleep-wake architecture after CORT exposure represent an increase in depression behavior versus being simply a physiological reaction to the CORT treatment.
The present data revealed that the sucrose preference was positively correlated with the total sleep time and negatively correlated with REM sleep time. Meanwhile, the immobility time was positively correlated with REM bouts and negatively correlated with REM sleep latency, SWS time and SWS bouts. A previous clinical report indicated that reduced REM latency is correlated with endogenous symptoms, such as appetite loss and distinct changes in the quality of mood10. It has been demonstrated that serotonin neurons of the dorsal raphe nucleus project to the cholinergic laterodorsal and pedunculopontine tegmental areas, inhibiting REM sleep33; consequently, REM sleep suppression has been observed in patients treated with tricyclic antidepressants34, selective serotonin reuptake inhibitors, and serotonin-norepinephrine reuptake inhibitors35. Our results also substantiated the idea that an increase in REM sleep density and shortened REM sleep latency may be related to the formation of despair/hopelessness (immobility time), and an increase in the REM sleep ratio may be associated with the emergence of anhedonia (sucrose preference).
The neurotransmitter or neuropeptide-like choline or orexin neurons found in the sleep-wake regulating nuclei (such as pedunculopontine tegmetal nucleus and lateral hypothalamus)36 may project to the ventral tegmental area, one of the key rewarding systems in the brain, to relegate neural activity37,38. We found that sucrose preference (measured using a reward-based test for the interest in a sweet solution)20 was correlated with sleep generation (light sleep bouts and total sleep time) and the REM sleep ratio, suggesting that the altered sleep time may reflect changes in the reward system.
SWS abnormality is one of the most consistent biological markers of depression. Reduction in SWS may be related to the regional cerebral blood flow in orbitofrontal and anterior cingulate cortices39, which are critical for mood regulation40. The results of this study reveal that behavioral despair (immobility time) was negatively correlated with the SWS ratio and its bouts.
The EEG power spectral density reflects the global cortical electrophysiological status41. It is well known that delta (0.5–4 Hz) activity is an indicator of the depth of NREM sleep42 and beta power is an electrophysiological index of arousal43. Quantitative EEG analysis showed decreased delta power in NREM sleep in patients with depression32,44 and increased beta power in both REM and NREM sleep45. In this study, EEG spectral power analysis indicated that immobility time was negatively correlated with the delta power and positively correlated with the beta power. However, no significant correlation was seen between sucrose preference and the EEG delta, theta, alpha or beta powers. From the present study and the previous literature, it could be suggested that the decreased delta power or increased beta power that occur in the early stage of depression may prompt the formation of behavioral despair.
In summary, our observations suggest that the shortened REM latency and SWS time, reductions of SWS bouts and delta power, as well as the increased REM sleep bouts and beta power density may contribute to the formation of the symptoms of despair. On the other hand, the shortened sleep time (by decreasing sleep events) and increased REM sleep time may play roles in inducing anhedonia. In brief, the 7-d administration of C ORT induced sleep disturbances, including decreased total sleep time and NREM sleep, the tendency toward a disinhibition of REM sleep, as well as a decrease in delta power density and an increase in beta power density in NREM sleep. Although no significant depressive behavior was observed, a strong correlation was found between depressive symptoms and specific sleep parameters.
Varying the stressor manipulation may also result in different changes in sleep architecture. The present study attempted to induce sleep disturbances and depressive tendencies using only a 7-d CORT treatment. It should be noted that the current study only examined the effects of a 7-d CORT treatment on sleep architecture and the behavior that may occur in the early stages of depression by examining the correlation between the tendencies of depression behaviors and sleep architecture parameters during the early stage, before a significant depressive behavior was formed.
In conclusion, understanding the mechanisms that underlie depression and sleep disturbances is critical to the advancement of treatment strategies and diagnostic criteria. The results of the current study demonstrate that CORT exposure results in significant changes in the sleep architecture, before differences in depression behavior can be reliably established. These results clearly illustrate the need for further investigations into the relationship between depression symptoms and disrupted sleep.
Author contribution
Yong-he ZHANG and Xiang-yu CUI contributed to the study design; Zi-jun WANG, Sheng-jie LI, Yuan-li HUANG and Qing CAO performed the research; Bin YU, Xue-qiong ZHANG, Zhao-fu SHENG and Su-ying CUI conducted the data analysis; Zi-jun WANG wrote the first-draft manuscript and Yong-he ZHANG revised the manuscript.
Acknowledgments
This study was funded by grants from the National Natural Science Foundation of China (No 81173031, 81202511 and 81302746).
References
- Pigeon WR. Insomnia as a predictor of depression: do insomnia subtypes matter. Sleep. 2010;33:1585–6. doi: 10.1093/sleep/33.12.1585. [DOI] [PMC free article] [PubMed] [Google Scholar]
- Salo P, Sivertsen B, Oksanen T, Sjosten N, Pentti J, Virtanen M, et al. Insomnia symptoms as a predictor of incident treatment for depression: prospective cohort study of 40,791 men and women. Sleep Med. 2012;13:278–84. doi: 10.1016/j.sleep.2011.06.022. [DOI] [PubMed] [Google Scholar]
- Breslau N, Roth T, Rosenthal L, Andreski P. Sleep disturbance and psychiatric disorders: a longitudinal epidemiological study of young adults. Biol Psychiatry. 1996;39:411–8. doi: 10.1016/0006-3223(95)00188-3. [DOI] [PubMed] [Google Scholar]
- Chang PP, Ford DE, Mead LA, Cooper-Patrick L, Klag MJ. Insomnia in young men and subsequent depression. The Johns Hopkins Precursors Study. Am J Epidemiol. 1997;146:105–14. doi: 10.1093/oxfordjournals.aje.a009241. [DOI] [PubMed] [Google Scholar]
- Foley DJ, Monjan A, Simonsick EM, Wallace RB, Blazer DG. Incidence and remission of insomnia among elderly adults: an epidemiologic study of 6,800 persons over three years. Sleep. 1999;22 Suppl 2:S366–72. [PubMed] [Google Scholar]
- Ford DE, Kamerow DB. Epidemiologic study of sleep disturbances and psychiatric disorders. An opportunity for prevention. JAMA. 1989;262:1479–84. doi: 10.1001/jama.262.11.1479. [DOI] [PubMed] [Google Scholar]
- Weissman MM, Greenwald S, Nino-Murcia G, Dement WC. The morbidity of insomnia uncomplicated by psychiatric disorders. Gen Hosp Psychiatry. 1997;19:245–50. doi: 10.1016/s0163-8343(97)00056-x. [DOI] [PubMed] [Google Scholar]
- Park EM, Meltzer-Brody S, Stickgold R. Poor sleep maintenance and subjective sleep quality are associated with postpartum maternal depression symptom severity. Arch Womens Ment Health. 2013;16:539–47. doi: 10.1007/s00737-013-0356-9. [DOI] [PMC free article] [PubMed] [Google Scholar]
- Kupfer DJ, Frank E, McEachran AB, Grochocinski VJ. Delta sleep ratio. A biological correlate of early recurrence in unipolar affective disorder. Arch Gen Psychiatry. 1990;47:1100–5. doi: 10.1001/archpsyc.1990.01810240020004. [DOI] [PubMed] [Google Scholar]
- Giles DE, Roffwarg HP, Schlesser MA, Rush AJ. Which endogenous depressive symptoms relate to REM latency reduction. Biol Psychiatry. 1986;21:473–82. doi: 10.1016/0006-3223(86)90189-7. [DOI] [PubMed] [Google Scholar]
- Staner L. Comorbidity of insomnia and depression. Sleep Med Rev. 2009;14:35–46. doi: 10.1016/j.smrv.2009.09.003. [DOI] [PubMed] [Google Scholar]
- Rao U, Hammen CL, Poland RE. Risk markers for depression in adolescents: sleep and HPA measures. Neuropsychopharmacology. 2009;34:1936–45. doi: 10.1038/npp.2009.27. [DOI] [PMC free article] [PubMed] [Google Scholar]
- de Kloet ER, Joëls M, Holsboer F. stress and the brain: from adaptation to disease. Nat Rev Neurosci. 2005;6:463–75. doi: 10.1038/nrn1683. [DOI] [PubMed] [Google Scholar]
- Burke HM, Davis MC, Otte C, Mohr DC. Depression and cortisol responses to psychological stress: a meta-analysis. Psychoneuroendocrinology. 2005;30:846–56. doi: 10.1016/j.psyneuen.2005.02.010. [DOI] [PubMed] [Google Scholar]
- Sterner EY, Kalynchuk LE. Behavioral and neurobiological consequences of prolonged glucocorticoid exposure in rats: relevance to depression. Prog Neuropsychopharmacol Biol Psychiatry. 2010;34:777–90. doi: 10.1016/j.pnpbp.2010.03.005. [DOI] [PubMed] [Google Scholar]
- Johnson SA, Fournier NM, Kalynchuk LE. Effect of different doses of corticosterone on depression-like behavior and HPA axis responses to a novel stressor. Behav Brain Res. 2006;168:280–8. doi: 10.1016/j.bbr.2005.11.019. [DOI] [PubMed] [Google Scholar]
- Marks W, Fournier NM, Kalynchuk LE. Repeated exposure to corticosterone increases depression-like behavior in two different versions of the forced swim test without altering nonspecific locomotor activity or muscle strength. Physiol Behav. 2009;98:67–72. doi: 10.1016/j.physbeh.2009.04.014. [DOI] [PubMed] [Google Scholar]
- Nestler EJ, Gould E, Manji H, Buncan M, Duman RS, Greshenfeld HK, et al. Preclinical models: status of basic research in depression. Biol Psychiatry. 2002;52:503–28. doi: 10.1016/s0006-3223(02)01405-1. [DOI] [PubMed] [Google Scholar]
- Cui SY, Cui XY, Zhang J, Wang ZJ, Yu B, Sheng ZF, et al. Ca(2)+ modulation in dorsal raphe plays an important role in NREM and REM sleep regulation during pentobarbital hypnosis. Brain Res. 2011;1403:12–8. doi: 10.1016/j.brainres.2011.05.064. [DOI] [PubMed] [Google Scholar]
- Papp M, Willner P, Muscat R. An animal model of anhedonia: attenuation of sucrose consumption and place preference conditioning by chronic unpredictable mild stress. Psychopharmacology (Berl) 1991;104:255–9. doi: 10.1007/BF02244188. [DOI] [PubMed] [Google Scholar]
- Lustberg L, Reynolds CF. Depression and insomnia: questions of cause and effect. Sleep Med Rev. 2000;4:253–62. doi: 10.1053/smrv.1999.0075. [DOI] [PubMed] [Google Scholar]
- Thase ME.Antidepressant treatment of the depressed patient with insomnia J Clin Psychiatry 199960Suppl 1728–31.discussion 46–8. [PubMed] [Google Scholar]
- Turek FW. Insomnia and depression: if it looks and walks like a duck. Sleep. 2005;28:1362–3. [PubMed] [Google Scholar]
- Pigeon W, Perlis M. Insomnia and depression: birds of a feather. Int J Sleep Disord. 2007;1:82–91. [Google Scholar]
- Kupfer DJ, Foster FG. Interval between onset of sleep and rapid-eye-movement sleep as an indicator of depression. Lancet. 1972;2:684–6. doi: 10.1016/s0140-6736(72)92090-9. [DOI] [PubMed] [Google Scholar]
- Spiker DG, Coble P, Cofsky J, Foster FG, Kupfer DJ. EEG sleep and severity of depression. Biol Psychiatry. 1978;13:485–8. [PubMed] [Google Scholar]
- Manber R, Edinger JD, Gress JL, San Pedro-Salcedo MG, Kuo TF, Kalista T. Cognitive behavioral therapy for insomnia enhances depression outcome in patients with comorbid major depressive disorder and insomnia. Sleep. 2008;31:489–95. doi: 10.1093/sleep/31.4.489. [DOI] [PMC free article] [PubMed] [Google Scholar]
- Fava M, McCall WV, Krystal A, Wessel T, Rubens R, Caron J, et al. Eszopiclone co-administered with fluoxetine in patients with insomnia coexisting with major depressive disorder. Biol Psychiatry. 2006;59:1052–60. doi: 10.1016/j.biopsych.2006.01.016. [DOI] [PubMed] [Google Scholar]
- Nestler EJ, Barrot M, DiLeone RJ, Eisch AJ, Gold SJ, Monteggia LM. Neurobiology of depression. Neuron. 2002;34:13–25. doi: 10.1016/s0896-6273(02)00653-0. [DOI] [PubMed] [Google Scholar]
- Steiger A, Dresler M, Kluge M, Schussler P. Pathology of sleep, hormones and depression. Pharmacopsychiatry. 2013;46 Suppl 1:S30–5. doi: 10.1055/s-0033-1337921. [DOI] [PubMed] [Google Scholar]
- Lussier AL, Lebedeva K, Fenton EY, Guskjolen A, Caruncho HJ, Kalynchuk LE. The progressive development of depression-like behavior in corticosterone-treated rats is paralleled by slowed granule cell maturation and decreased reelin expression in the adult dentate gyrus. Neuropharmacology. 2013;71:174–83. doi: 10.1016/j.neuropharm.2013.04.012. [DOI] [PubMed] [Google Scholar]
- Steiger A, Kimura M. Wake and sleep EEG provide biomarkers in depression. J Psychiatr Res. 2010;44:242–52. doi: 10.1016/j.jpsychires.2009.08.013. [DOI] [PubMed] [Google Scholar]
- McCarley RW, Hobson JA. Neuronal excitability modulation over the sleep cycle: a structural and mathematical model. Science. 1975;189:58–60. doi: 10.1126/science.1135627. [DOI] [PubMed] [Google Scholar]
- Kupfer DJ, Spiker DG, Rossi A, Coble PA, Shaw D, Ulrich R. Nortriptyline and EEG sleep in depressed patients. Biol Psychiatry. 1982;17:535–46. [PubMed] [Google Scholar]
- Sharpley AL, Cowen PJ. Effect of pharmacologic treatments on the sleep of depressed patients. Biol Psychiatry. 1995;37:85–98. doi: 10.1016/0006-3223(94)00135-P. [DOI] [PubMed] [Google Scholar]
- Saper CB, Fuller PM, Pedersen NP, Lu J, Scammell TE. Sleep state switching. Neuron. 2010;68:1023–42. doi: 10.1016/j.neuron.2010.11.032. [DOI] [PMC free article] [PubMed] [Google Scholar]
- Holmstrand EC, Sesack SR. Projections from the rat pedunculopontine and laterodorsal tegmental nuclei to the anterior thalamus and ventral tegmental area arise from largely separate populations of neurons. Brain Struct Funct. 2011;216:331–45. doi: 10.1007/s00429-011-0320-2. [DOI] [PMC free article] [PubMed] [Google Scholar]
- Tsujino N, Sakurai T. Orexin/hypocretin: a neuropeptide at the interface of sleep, energy homeostasis, and reward system. Pharmacol Rev. 2009;61:162–76. doi: 10.1124/pr.109.001321. [DOI] [PubMed] [Google Scholar]
- Maquet P, Degueldre C, Delfiore G, Aerts J, Peters JM, Luxen A, et al. Functional neuroanatomy of human slow wave sleep. J Neurosci. 1997;17:2807–12. doi: 10.1523/JNEUROSCI.17-08-02807.1997. [DOI] [PMC free article] [PubMed] [Google Scholar]
- Drevets WC. Orbitofrontal cortex function and structure in depression. Ann N Y Acad Sci. 2007;1121:499–527. doi: 10.1196/annals.1401.029. [DOI] [PubMed] [Google Scholar]
- Merica H, Fortune RD. A neuronal transition probability model for the evolution of power in the sigma and delta frequency bands of sleep EEG. Physiol Behav. 1997;62:585–9. doi: 10.1016/s0031-9384(97)00165-0. [DOI] [PubMed] [Google Scholar]
- Chen CR, Zhou XZ, Luo YJ, Huang ZL, Urade Y, Qu WM. Magnolol, a major bioactive constituent of the bark of Magnolia officinalis, induces sleep via the benzodiazepine site of GABA(A) receptor in mice. Neuropharmacology. 2012;63:1191–9. doi: 10.1016/j.neuropharm.2012.06.031. [DOI] [PubMed] [Google Scholar]
- Nofzinger EA, Price JC, Meltzer CC, Buysse DJ, Villemagne VL, Miewald JM, et al. Towards a neurobiology of dysfunctional arousal in depression: the relationship between beta EEG power and regional cerebral glucose metabolism during NREM sleep. Psychiatry Res. 2000;98:71–91. doi: 10.1016/s0925-4927(00)00045-7. [DOI] [PubMed] [Google Scholar]
- Armitage R, Emslie GJ, Hoffmann RF, Rintelmann J, Rush AJ. Delta sleep EEG in depressed adolescent females and healthy controls. J Affect Disord. 2001;63:139–48. doi: 10.1016/s0165-0327(00)00194-4. [DOI] [PubMed] [Google Scholar]
- Kupfer DJ, Ehlers CL, Frank E, Grochocinski VJ, McEachran AB, Buhari A. Persistent effects of antidepressants: EEG sleep studies in depressed patients during maintenance treatment. Biol Psychiatry. 1994;35:781–93. doi: 10.1016/0006-3223(94)91140-1. [DOI] [PubMed] [Google Scholar]


