

Abstract
Introduction:
Osteoporosis is a multifactorial disease and one of the most important modifiable factors in the development and maintenance of bone mass are nutrition nutritional status and its relationship with Bone Mass Density (BMD) in postmenopausal women admitted in osteodensitometry Center, Isfahan, Iran.
Materials and Methods:
Seventy-two postmenopausal osteoporotic women were studied. BMD of the lumbar spine and total hip were measured using dual-energy X-ray absorptiometry. Demographic and dietary intakes were collected by interview and using a validated food frequency questionnaires. T-scores, Pearson correlation and one way analysis of variance tests were conducted to analyze the data.
Results:
Mean of age and duration of menopause was nearly 57.5 ± 7.2 and 10.6 ± 7.1 years, respectively. The mean t-scores for BMD of spine and hip were 0.877 ± 0.179 and 0.997 ± 0.21, respectively. The mean of calcium (Ca), phosphorous (P), fluoride (F), Vitamin D, K and Zn were less than DRI and Na more than it (all P value less than 0.0001). BMD of hip was significantly correlated with dietary Ca, animal protein, Zn (P < 0.05), but BMD of spine did not show any significant correlation with nutrients (P > 0.05).
Conclusion:
Most of the postmenopausal osteoporotic women in this study had a considerable deficiency in terms of micronutrients such as Ca, vitamin D and P, which can be deleterious for bone health.
Keywords: Bone mineral density, diet, nutrition, women
INTRODUCTION
Osteoporosis and low bone density is a main cause of mortality and morbidity in elderly population, especially in women.[1] It caused approximately 9 million fractures in the year 2000 in the world,[2] and it is supposed to increase this number by more than three-fold by the year 2050.[3] In a study on burden of osteoporosis in Iran, premature mortality and disability was responsible for 36027 year of life lost in 2001.[4] It has been estimated that people over the age of 60 years will become 2 billion in number by this year that 45% of them will live in developing countries.[5] Increasing in elderly people, osteoporosis emerges as a main public health problem in developing countries such as Iran. There is lack of data on prevalence and incidence of osteoporosis in developing countries. About 200 million women have osteoporosis in the world,[6] but prevalence of osteoporosis varies in different countries.[4] Differences in race, lifestyle including dietary behaviors such as low calcium and vitamin D intake and excess alcohol consumption, lack of physical activity, and smoking status, family history, premature menopause, some kind of cancers and long-term use of some drugs could predispose to osteoporosis.[7,8,9,10,11,12,13,14,15,16] Adequate nutrition is essential for the development and maintenance of the skeleton (i.e., bone health). Among these factors nutrition is the main characteristic seems to play an important role in the growth and maintenance of osteoporosis.[17] In addition to calcium and vitamin D, proteins, different kinds of fat, fiber, other minerals and vitamins may affect on bone density and formation.[18,19,20,21,22] However, there is a lack of such information, especially in developing countries. As bone mineral density (BMD) could estimate 75% of bone strength, it is a good indicator for prediction of fracture.[23] So, in the present study we tried to assess the relationship between nutrition status and BMD among menopausal women who referred to Bone Density Assay Center in Isfahan.
MATERIALS AND METHODS
In a descriptive cross sectional design, total of 72 menopausal women who attended the Osteoporosis Outpatient Clinic at the Isfahan were recruited in this study by using simple sampling. Including criteria was menopausal women who did not consumed any drugs were included and signed written consent.
Demographic and physiologic characteristics such as age, pregnancy number, duration of menopause, history of lactation were collected by questionnaire. Dietary pattern were assessed by a food frequency questionnaire (FFQ), which was translated to Persian with a nutrition expert. All data were collected by trained nutritionist.
Participants were asked to report their frequency of consumption of each food item during the previous year on a daily (e.g., bread), weekly (e.g., rice, meat) or monthly (e.g., fish) basis. To assist the subjects to report accurately, household utensils were used. The questionnaires were validated in the Nationwide Food Consumption Survey project, which has been reported in Farsi.[24]
Dietary data was conducted in Nutritionist 4 software. BMD was measured by dual-energy X-ray absorptiometry (DXA) using Lunar DPX-MD device (Lunar Corporation, Madison, Wisconsin, 53713. USA). The DXA device was calibrated daily and weekly by using appropriated phantoms methods. To assess BMD, second to fourth lumbar spine and from the hip bone, bone density was expressed as g/cm2.[25]
Statistical analysis
T-scores were used to compare mean of dietary intakes with dietary reference intakes (DRIs) to assess the relationship between dietary intake and bone density.
Pearson and Spearman correlations were done. One way analysis of variance (ANOVA) was conducted to compare bone density in women with different menopausal period. P value less than 0.05 was considered significant.
RESULTS
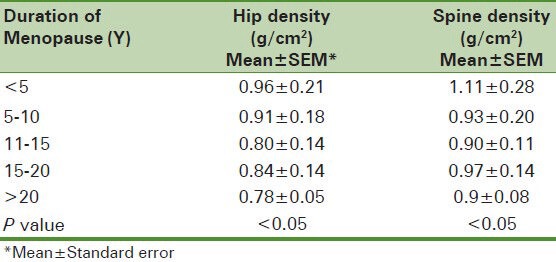
Mean age of subjects was 57.5 ± 7.2. The demographic characteristics and bone density levels were shown in Table 1. Table 2 shows the BMD of spinal and hip declined by increasing the menopausal period (P < 0.05).
Table 1.
Basic characteristics of postmenopausal women
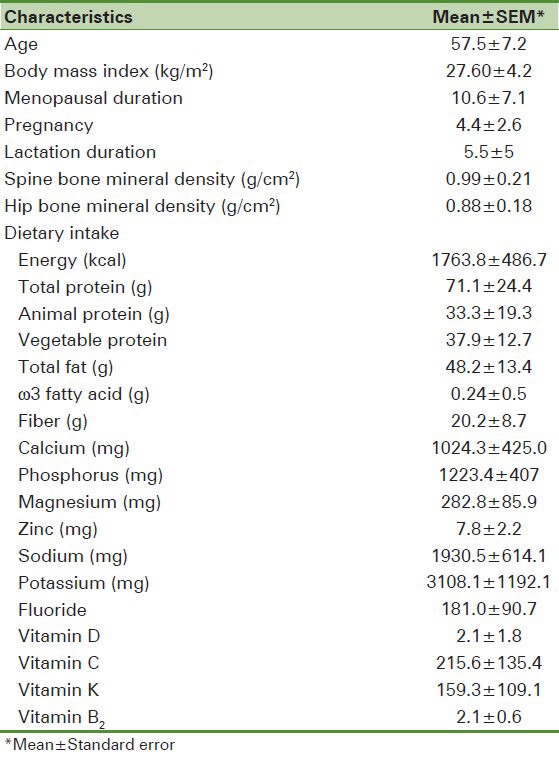
Table 2.
Comparing the mean of bone mineral density based on history of menopause
The comparing of dietary intake such as calcium (ca), phosphorus (P), energy, total fat, protein, sodium (Na), fluoride (F), zinc (Zn), vitamin C, D and K and fiber and ω3 fatty acids with DRI were shown subjects consumed significantly Ca, P, F, vitamin D, K and Zn less than DRI and Na more than it (P < 0.0001).
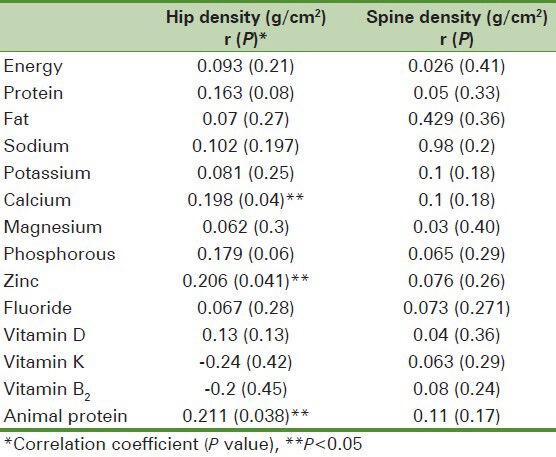
As it is showed at Table 3, BMD of hip showed significant relationship with animal protein (r = 0.211, P < 0.05), Zn (r = 0.2, P < 0.05), Ca (r = 0.19, P < 0.05), and vitamin B2 (r = 0.202, P < 0.05) intake, but BMD of spine did not show any significant relationship with nutrients. BMD of spine showed significant relation with BMI (r = 0.28, P < 0.01) and age (r =−0.209, P < 0.05), at the other hand BMD of hip showed similar relation with BMI (r = 0.27, P < 0.05) and age (r = −0.355, P < 0.01).
Table 3.
Correlation between nutrients and bone mass density
DISCUSSION
This study indicated that there was a weak correlation between dietary intakes and BMD. Animal protein, Ca, Zn and vitamin B2 had significant positive association with BMD. On the other hand there was a negative significant relationship with age. While by increasing menopausal period, the BMD was declined.
Hip and spine BMD in the subjects were less than normal concentrations and it was confirmed by Akbarian, et al. study in Iran.[26] Although, Ca, P, vitamin D and K, F, Zn and ω3 could be effective BMD,[27,28] intake in these postmenopausal women were less than DRI. It could aggravate bone loss and osteoporosis in Iranian women. Inadequate intake of Ca might be due to poor nutrition knowledge, low socioeconomic, dislike and intolerance of milk and dairy products.[29] Similarly another study in Sabzevar, a city in the east part of Iran, revealed that elderly population consumed all essential nutritional factors for bone formation except protein less than DRI.[30]
Nutrition role may be the most controversial effect on osteoporosis.[31] Positive association of BMD in hip with animal protein in this study was confirmed with the study of Bonjour, et al.[32] Several studies in Iran and other countries showed increasing protein intake among those who consumed inadequate dietary protein had a positive effect on the risk of hip fracture in men and women.[33,34] Low dietary protein causes Ca malabsorption and demineralization of bones in elderly[35] and animal proteins release intestinal absorption of Ca. Also, dietary proteins induce insulin growth factor 1, which has a positive effect on bone formation.[32]
Meng, et al. found that the effect of more intake of protein on muscle mediated bone mass increasing.[36] So, it was consistent with other studies that demonstrated lean body mass is an important determinant of BMC and BMD.[37,38,39,40,41] So, according to the review study of Campbell and et al. safe protein intake for elderly would be 1.0-1.25 g/kg/d of high quality protein such as some kinds of animal proteins.[42]
Although, protective role of animal protein such as chicken, fish and egg confirmed the theory of “adequate protein intake is important for optimal bone health in the elderly 50 to 69 years of age”, red meat consumption 4 times or more per week was shown as a risk factor in Iranian population.[5]
Similar to our study the Furrell, et al. and Ilich, et al. reported Zn, Ca and protein associated with three or more of the same BMD sites.[43] But in contrast to present study, several studies showed BMD had a significant positive association with K, Mg, P, fiber, vitamin D, E and C, fiber and significant negative relationship with dietary fat.[29,43,44,45,46] Osteoblast enzymes require Zn for collagen formation. Moreover, Zn is an essential factor that is involved in alkaline phosphatase as important osteoblast activation.[31] Sodium effects on BMD are equivocal. In the present study there was no significant association between Na and BMD, however, in studies in which Na intake was measured properly, there is a significant negative effect when daily intake exceeds 2,100 mg (90 mmol).[47] Positive relationship of vitamin B2 with BMD might be because of the main source of this vitamin is milk and dairy product. Contrary to our expectation, there was no significant negative correlation between dietary fat and BMD. It is possible for no exceed consumption of total fat in our society (my article).
Limitation
Small sample size might be a limitation of this study. Furthermore, we did not have any data on physical activity and smoking in subjects.
CONCLUSION
Also, there is a relation between animal protein, Ca, Zn and riboflavin but not other nutrition factors and BMD. We suggest that elderly women should consume animal protein such as milk and dairy products, fish and egg based on DRI. Further studies with more sample size are suggested.
ACKNOWLEDGEMENTS
We thank the participants of the study for their enthusiastic support.
Footnotes
Source of Support: Isfahan University of Medical Sciences, Iran
Conflict of Interest: None declared
REFERENCES
- 1.Larijani B, Resch H, Bonjour JP, Aghai Meybodi HR, Mohajery Tehrani MR. Osteoporosis in Iran, overview and management. Iran J Public Health. 2007:1–13. Supplementary Issue on Osteoporosis. [Google Scholar]
- 2.Johnell O, Kanis JA. An estimate of the worldwide prevalence and disability associated with osteoporotic fractures. Osteoporos Int. 2006;17:1726–33. doi: 10.1007/s00198-006-0172-4. [DOI] [PubMed] [Google Scholar]
- 3.Geneva: World Health Organization; 2007. [Last accessed on 2008 May 03]. WHO scientific group on the assessment of osteoporosis at primary health care level. Available from: http://www.who.int/chp/topics/osteoporosis.pdf . [Google Scholar]
- 4.Abolhassani F, Mohammadi M, Soltani A. Burden of Osteoporosis in Iran. Iran J Public Health. 2004:18–28. Supplement issue on osteoporosis. [Google Scholar]
- 5.Keramat A, Patwardhan B, Larijani B, Chopra A, Mithal A, Chakravarty D, et al. The assessment of osteoporosis risk factors in Iranian women compared with Indian women. BMC Musculoskelet Disord. 2008;9:28. doi: 10.1186/1471-2474-9-28. [DOI] [PMC free article] [PubMed] [Google Scholar]
- 6.International Osteoporosis Foundation. The facts about osteoporosis and its impact. International Osteoporosis Foundation Web site. [Last accessed on 2005 Jul 26]. Available from: http://www.osteofound.org/press_centre/fact_sheet.html .
- 7.Handa R, Kalla AA. Osteoporosis in developing countries. Best Pract Res Clin Rheumatol. 2008;22:693–708. doi: 10.1016/j.berh.2008.04.002. [DOI] [PubMed] [Google Scholar]
- 8.Ghosh UK, Roy S, Sharma D, Gaur SC, Ganguli G. Relationship of Osteoporosis with socioeconomic status, physical activity and puerperal calcium supplementation. J Obstetr Gynaecol India. 1996;46:224–8. [Google Scholar]
- 9.Socioeconomic Status Weighs Heavily on Health of Married Couples. [Last accessed on 2012 Mar 22]. Available from: http://www.obgyn.net/newsrx/general_health-Epidemiology-20010212-2.asp .
- 10.Park JN, You MH, Ahn HC, Hwang KU. Philadelphia: The 130th Annual Meeting of APHA; 2002. Bone mineral density and its relations in Korean adult women. [Google Scholar]
- 11.Varenna M, Binelli L, Zucchi F, Ghiringhlli D, Gallazzi M, Sinigaglia L. Prevalence of osteoporosis by education level in a cohort of postmenopausal women. Osteoporos Int. 1999;9:236–41. doi: 10.1007/s001980050143. [DOI] [PubMed] [Google Scholar]
- 12.Inanici-Ersoz F, Gokce-Kutsal Y, Oncel S, Eryavuz M, Peker O, Ok S. A multicenter case control study of risk factors for low tibia speed of sound among residents of urban areas in Turkey. Rheumatol Int. 2002;22:20–6. doi: 10.1007/s00296-002-0181-3. [DOI] [PubMed] [Google Scholar]
- 13.Farahmand BY, Persson PG, Michaelsson K, Baron JA, Parker MG, Ljunghall S Swedish hip fracture group. Socioeconomic status, marital status and hip fracture risk: A papulation- based case-control study. Osteoporosis Int. 2000;11:803–8. doi: 10.1007/s001980070060. [DOI] [PubMed] [Google Scholar]
- 14.Bonjour JP. Dietary Protein: An Essential Nutrient For Bone Health. J Am Coll Nutr. 2005;24(Suppl 6):526S–6S. doi: 10.1080/07315724.2005.10719501. [DOI] [PubMed] [Google Scholar]
- 15.Saadi HF, Reed RL, Carter AO, Qazaq H, Al-Suhaili AR. Bone density estimates and risk factors for osteoporosis in young women. East Mediterr Health J. 2001;4:730–7. [PubMed] [Google Scholar]
- 16.Finkestein JS, Lee TS, Sowers M, Ettinger B, Neer RM, Kelsey JL, et al. Ethnic variation in bone density in premenopausal women: Effects of anthropometric and lifestyle factor. J Clin Endocrinol Metab. 2002;87:3057–67. doi: 10.1210/jcem.87.7.8654. [DOI] [PubMed] [Google Scholar]
- 17.Tamaki J. Evidence-based, best-practice guildelines for primary prevention of osteoporotic fractures. Clin Calcium. 2005;15:1312–8. [PubMed] [Google Scholar]
- 18.Miggiano GA, Gagliardi I. Diet, nutrition and bone health. Clin Ter. 2005;156:47–56. [PubMed] [Google Scholar]
- 19.Mccabe LD, Martin BR, Maccab GP. Dairy affect bone density in the elderly. Am J Clin Nutr. 2004;80:1066–74. doi: 10.1093/ajcn/80.4.1066. [DOI] [PubMed] [Google Scholar]
- 20.Kontogianni MD, Melistas L, Yannakoulia M, Malagaris I, Panagiotakos DB, Yiannakouris N. Association between dietary patterns and indices of bone mass in a sample of Mediterranean women. Nutrition. 2009;25:165–71. doi: 10.1016/j.nut.2008.07.019. [DOI] [PubMed] [Google Scholar]
- 21.Corwin RL, Hartman TJ, Maczuga SA, Graubard BI. Dietary saturated fat intake is inversely associated with bone density in humans: Analysis of NHANES III. J Nutr. 2006;136:159–65. doi: 10.1093/jn/136.1.159. [DOI] [PubMed] [Google Scholar]
- 22.Macdonald HM, New SA, Golden MH. Nutrition associations with bone loss during menopausal transition: Evidence of a beneficial effect of calcium, alcohol and fruits and vegetable nutrient and of a determinal effect of fatty acids. Am J Clin Nutr. 2004;79:155–65. doi: 10.1093/ajcn/79.1.155. [DOI] [PubMed] [Google Scholar]
- 23.Ranjbar Omrani GH, Seyed Masoom Masoompour SM, Hamidi A, Mardanifard HA, Taghavi SM, Talezadeh P, et al. Bone mineral density in the normal Iranian population: A comparison with American reference data. Arch Osteoporos. 2006;1:29–35. [Google Scholar]
- 24.Tehran: Nutrition and Food Technology Research Institute; 1995. Nutrition and Food Technology Research Institute. National Food Consumption Survey. [Google Scholar]
- 25.Larijani B, Hossein-Nezhad A, Mojtahedi A, Pajouhi M, Bastanhagh M, Soltani A, et al. Normative data of bone Mineral Density in healthy population of Tehran, Iran: A Cross sectional study. BMC Musculoskelet Disord. 2005;6:38. doi: 10.1186/1471-2474-6-38. [DOI] [PMC free article] [PubMed] [Google Scholar]
- 26.Akbarian M, Davachi F, Salimzadeh A, Shahram F, Gharibdoost F, Nadji A, et al. Bone mass density in the normal population of Iran: APLAR. J Rheumatol. 2007;8:177–83. [Google Scholar]
- 27.Geneva: World Health Organization; 1998. Guidelines for preclinical evaluation and clinical trials in osteoporosis; p. 59. [Google Scholar]
- 28.Haghighian A, Tahbaz F, Hosseinnezhad A, Shafaei A, Sedaght M, Kimiagar M, et al. Effect of soy protein on bone metabolism biomarkers in postmenopausal women with osteopenia. Nut J. 2005;29:30. [Google Scholar]
- 29.Hejazi J, Mohtadinia J, Kolahi S, Ebrahimi-Mamaghani M. Nutritional status among postmenopausal osteoporotic women in North West of Iran. Asia Pac J Clin Nutr. 2009;18:48–53. [PubMed] [Google Scholar]
- 30.Kooshki A, Golafrooz M. Nutrient Intakes Affecting Bone Formation Compared with Dietary Reference Intake (DRI) in Sabzevar Elderly Subjects. Pak J Nut. 2009;8:218–21. [Google Scholar]
- 31.Chapman-Novakofski K. 13th ed. Saunders, WA: Elsevier; 2012. Nutrition and Bone Health, 531-545 in Krause's Food and the Nutrition Care Process. [Google Scholar]
- 32.Bonjour JP. Dietary protein: An essential nutrient for bone health. J Am Coll Nutr. 2005;24:526S–36S. doi: 10.1080/07315724.2005.10719501. [DOI] [PubMed] [Google Scholar]
- 33.Bekheirnia MR, Abdollah Shamshirsaz A, Kamgar M, Bouzari N, Erfanzadeh G, Larijani B, et al. Serum zinc and its relation to bone mineral density in beta thalassemic adolescents. Biol Trace Elem Res. 2004;97:215–24. doi: 10.1385/bter:97:3:215. [DOI] [PubMed] [Google Scholar]
- 34.Munger RG, Cerhan JR, Chiu BC. Prospective study of dietary protein intake and risk of hip fracture in postmenopausal women. Am J Clin Nutr. 1999;69:147–52. doi: 10.1093/ajcn/69.1.147. [DOI] [PubMed] [Google Scholar]
- 35.Connie MW. The Role of Nutrition on optimizing peak bone mass. Asia Pac J Clin Nutr. 2009;17:135–7. [PubMed] [Google Scholar]
- 36.Meng X, Zhu K, Devine A, Kerr DA, Binns CW, Prince RL. A 5- year cohort study of the effects of high protein intake on lean mass and BMC in elderly postmenopausal women. J Bone Miner Res. 2009;24:1827–34. doi: 10.1359/jbmr.090513. [DOI] [PubMed] [Google Scholar]
- 37.Foo LH, Zhang Q, Zhu K, Ma G, Greenfield H, Fraser DR. Influence of body composition, muscle strength, diet and physical activity on total body and forearm bone mass in Chinese adolescent girls. Br J Nutr. 2007;98:1281–7. doi: 10.1017/S0007114507787421. [DOI] [PubMed] [Google Scholar]
- 38.Gnudi S, Sitta E, Fiumi N. Relationship between body composition and bone mineral density in women with and without osteoporosis: Relative contribution of lean and fat mass. J Bone Miner Metab. 2007;25:326–32. doi: 10.1007/s00774-007-0758-8. [DOI] [PubMed] [Google Scholar]
- 39.Sanada K, Miyachi M, Tabata I, Miyatani M, Tanimoto M, Oh TW, et al. Muscle mass and bone mineral indices: Does the normalized bone mineral content differ with age? Eur J Clin Nutr. 2009;63:465–72. doi: 10.1038/sj.ejcn.1602977. [DOI] [PubMed] [Google Scholar]
- 40.van Langendonck L, Claessens AL, Lysens R, Koninckx PR, Beunen G. Association between bone, body composition, and strength in premenarcheal girls and postmenopausal women. Ann Hum Biol. 2004;31:228–44. doi: 10.1080/03014460310001638929. [DOI] [PubMed] [Google Scholar]
- 41.Liu JM, Zhao HY, Ning G, Zhao YJ, Zhang LZ, Sun LH, et al. Relationship between body composition and bone mineral density in healthy young and premenopausal Chinese women. Osteoporos Int. 2004;15:238–42. doi: 10.1007/s00198-003-1536-7. [DOI] [PubMed] [Google Scholar]
- 42.Campbell WW, Crim MC, Dallal GE, Young VR, Evans WJ. Increased protein requirements in elderly people: New data and retrospective reassessments. Am J Clin Nutr. 1994;60:501–9. doi: 10.1093/ajcn/60.4.501. [DOI] [PubMed] [Google Scholar]
- 43.Ilich J, Brownbill R, Tamborini L. Bone and nutrition in elderly women: Protein, energy, and calcium as main determinants of bone mineral density. Eur J Clin Nutr. 2003;57:554–65. doi: 10.1038/sj.ejcn.1601577. [DOI] [PubMed] [Google Scholar]
- 44.New S, Bolton-Smith C, Grubb D, Reid D. Nutritional influences on bone mineral density: A cross-sectional study in premenopausal women. Am J Clin Nutr. 1997;65:1831–9. doi: 10.1093/ajcn/65.6.1831. [DOI] [PubMed] [Google Scholar]
- 45.Maurer J, Harris M, Stanford V, Lohman T, Cussler E, Going S, et al. Dietary iron positively influences bone mineral density in postmenopausal women on hormone replacement therapy. J Nutr. 2005;135:863–9. doi: 10.1093/jn/135.4.863. [DOI] [PubMed] [Google Scholar]
- 46.Vanessa A, Margaret H, Timothy G, Scott B, Cynthia A, Judith L, et al. Comparison between dietary assessment methods for determining associations between nutrient intake and bone mineral density in postmenopausal women. J Am Diet Assoc. 2009;109:899–904. doi: 10.1016/j.jada.2009.02.008. [DOI] [PMC free article] [PubMed] [Google Scholar]
- 47.Devine A, Criddle RA, Dick IM, Kerr DA, Prince RL. A longitudinal study of the effect of sodium and calcium intakes on regional bone density in postmenopausal women. Am J Clin Nutr. 1995;62:740–5. doi: 10.1093/ajcn/62.4.740. [DOI] [PubMed] [Google Scholar]