Abstract
Chronic obstructive pulmonary disease (COPD) is characterized by an abnormal regulatory T cell (Treg) response and increases in T helper type 1 (Th1) and Th17 cell responses. It is unclear if dysregulation of microRNAs (miRNA) within Treg cells contributes to the abnormal inflammatory response in COPD. In this study, we aimed to compare the miRNA profile of COPD Treg cells with that of healthy controls and to explore the function of differentially expressed miRNAs. We first obtained Treg and T effector cells (Teff) from peripheral blood of non-smokers, unaffected current smokers and COPD current smokers. Then, we assessed their miRNA expression by microarray analysis followed by real-time reverse transcription–polymerase chain reaction (RT–PCR) validation of particular miRNAs. Six and 96 miRNAs were expressed differentially in COPD Treg cells versus Treg cells of healthy non-smokers and healthy smokers, whereas no differences were found in miRNA expression in Teff cells. We found that miR-199a-5p was repressed by approximately fourfold in Treg cells of COPD patients compared to healthy smokers (P < 0·05). In addition, miR-199a-5p was over-expressed in Treg cells compared to Teff cells (P < 0·001) and had significant over-representation of its target genes in the Treg transcriptome, being associated with the transforming growth factor (TGF)-β activation pathway (P < 0·01). We also confirmed the function of miR-199a5p in an in-vitro loss-of-function cell model running TaqMan® arrays of the human TGF-β pathway. These findings suggest that the abnormal repression of miR-199a-5p in patients with COPD compared to unaffected smokers may be involved in modulating the adaptive immune balance in favour of a Th1 and Th17 response.
Keywords: FoxP3, microRNAs, miR-199a-5p, smoking, T cells
Introduction
The new paradigm of chronic obstructive pulmonary disease (COPD) pathobiology highlights the interplay of dysregulated oxidative stress, protease/anti-protease imbalance and ageing/senescence 1. In this paradigm, epigenetic modulation of the oxidative stress response is thought to have a significant impact on the innate immune response 2–4. However, much remains to be determined regarding the role of the adaptive immune response in COPD and little is known about the contribution of regulatory T (Treg) cells to the pathogenesis of COPD. Three studies that examined the Treg cells in bronchoalveolar lavage (BAL) fluid showed decreases in these cells in COPD compared to smokers and non-smokers 5–7, but results are inconsistent in lung tissue. Plumb et al. showed increased Tregs in the lungs of COPD patients 8, whereas Lee et al. reported the opposite 9 and Isajevs et al. reported that the Treg cells are decreased in small airways and are increased in large airways 10. Similarly, the only two studies that addressed the functional aspect of the COPD Treg cells reported conflicting results 9,11. More recently, in a COPD murine model Wang et al. reported a loss of Treg cells and a shift of the T helper type 17 (Th17)/Treg balance in affected animals 12. While the mechanism for the observed Th17/Treg cell imbalance and Treg cell dysfunction has not been explored in previous studies, a number of transcription factors 13,14 and miRNAs 15 have been reported to modulate the Treg cell response, some of which could be involved in COPD, and could explain such a shift.
Certain miRNAs have an important role in the adaptive immune response 16. Depleting Treg cells of miRNAs by knocking out Dicer, the miRNA precursor-processing ribonuclease, results in fatal autoimmunity indistinguishable from that of Treg cell-deficient mice 17. These Dicer (and miRNA)-deficient Tregs also lost their suppressive function in vitro and exhibited an altered marker expression consistent with their impaired suppressive activity 17. Importantly, there is limited knowledge about the specific miRNAs that are involved in the regulation of these processes 18,19 and to what extent their deregulation contributes to COPD immunopathogenesis. In this study, we aimed to define the miRNA profile of the peripheral forkhead box protein 3 (FoxP3+) Treg cells of COPD patients and healthy subjects to characterize more clearly the adaptive phenotype associated with COPD. We found a distinct miRNA profile in the COPD Treg cells, but not T effector cells (Teff), and proceeded to explore miR-199a-5p function based on the in-silico analysis that revealed its potential role in cell signalling. In this study, we report that miR-199a-5p is expressed differentially in peripheral blood Treg cells compared to Teff cells and that it is down-regulated in COPD Treg cells versus that of healthy smokers. We also found that miR-199a-5p could potentially modulate the Treg cell response through interference with the transforming growth factor (TGF)-β pathway.
Materials and methods
Subject selection
We included 12 healthy non-smoking subjects, 12 healthy current smokers and 12 COPD current smokers in our study. Inclusion criteria for COPD patients were: aged > 40 and <80 years, currently smoking and with a history of cigarette smoking > 10 pack-years, and presence of airway obstruction [forced expiratory volume in 1 s/forced vital capacity (FEV1/FVC) < 70%] according the Global Initiative for Chronic Obstructive Lung Disease (GOLD) criteria 20. The same criteria were applied to healthy current smokers, except that they did not have evidence of airway obstruction. Inclusion criteria for non-smokers were: aged > 40 and < 80 years, never smoked tobacco products or they smoked approximately < 100 cigarettes during their lifetime (having had their last cigarette more than 10 years ago), and they did not have a history of exposure to second-hand smoking (living with someone who smoked or work-related smoking exposure). We excluded patients and subjects with the following known morbidities: cardiac disease, cerebrovascular disease, connective tissue disease, malignancy, immune deficiency, active infectious conditions and anyone on medications that may have had an impact on the inflammatory/immune response, including systemic steroids, aspirin, non-steroidal anti-inflammatory medications, statins, narcotics or using illicit drugs. We first performed miRNA microarray analysis in four subjects/group (matched according to age, gender and race) then conducted reverse transcription–polymerase chain reaction (RT–PCR) validation for each of the 36 subjects. After we increased the sample size per group, differences were noted between the groups in age and race (Table 1). The study was approved by our Temple University Institutional Review Board and all patients signed informed consent to participate in the study.
Table 1.
Characteristics of subjects (n = 12/group)
| Healthy non-smokers | Current smokers without COPD | Current smokers with COPD | |
|---|---|---|---|
| Age, years | 53 ± 5 | 49 ± 6* | 56 ± 5 |
| Gender (male) | 6 | 5 | 10 |
| Race† | |||
| Caucasian | 8 | 4 | 11 |
| African American | 2 | 8 | 1 |
| Other | 2 | 0 | 0 |
| FEV1, % predicted | 88 ± 15* | 59 ± 19 | |
| FEV1/FVC, % | 80 ± 5* | 53 ± 12 |
P < 0·05, chronic obstructive pulmonary disease (COPD) versus smokers without COPD (post-bronchodilator values).
The proportion of racial composition in groups is different, P = 0·048. Data presented as mean ± standard deviation. FEV1 = forced expiratory volume in 1 s.
Purification and phenotyping of Treg and Teff cells from peripheral blood
We obtained peripheral blood from our participants and isolated peripheral blood mononuclear cells (PBMC) by Ficoll-Paque gradient centrifugation. We collected blood in ethylenediamine tetraacetic acid (EDTA) tubes. From the PBMC population we obtained CD4+CD127− cells using magnetic cell separation, following the manufacturer's protocol (MACS; Miltenyi Biotech, Bisley, UK), then used these purified cells in another Treg kit, the CD25+CD49− T Cell Isolation Kit (Miltenyi Biotech), resulting in CD4+CD25+CD127–CD49− cells. The two-step procedure resulted in the isolation of highly purified forkhead box protein 3 (FoxP3+) Treg cells. Teff cells were purified from a different CD4+CD25+ Treg kit (Miltenyi Biotech), isolating the CD4+CD25− cells as our Teff cells of interest. We confirmed the phenotype of the cells by flow cytometry [CD4–peridinin chlorophyll (PerCP)5·5, FoxP3-phycoerythrin (PE); eBioscience, San Jose, CA, USA]. To test the function of the isolated Treg cells, we tested their suppressive activity by suspending 50 × 103 cells along with 50 × 103 Teff cells in culture medium in 96-well plates, serially diluting the Treg cell population, giving Treg : Teff ratios of 1:1, 1:2, 1:4, 1:8 and 1:16. Wells without Treg cells and without stimulation beads were included as controls in preparation of suppression curves. Each well was stimulated with Treg suppression inspector beads (Miltenyi) at a cell to bead ratio of 1:1. After 4 days of incubation, we determined CD4+ cell divisions by carboxyfluorescein (CFSE) dilution 21.
RNA purification and miRNA microarray analysis
We used the mirVana miRNA Detection kit (Applied Biosystems, Life Technologies, Carlsbad, CA, USA) to extract total and low molecular weight (LMW) RNA from the purified Treg and Teff cells. We quantified the concentration of total RNA using the Nanodrop Spectrophotometer, then used the Agilent Bioanalyzer to assess for quality of the microarray samples. All 12 samples were confirmed to have good quality RNA based on their RNA integrity number (RIN) and electropherograms. We labelled and hybridized 400 ng to 500 ng of the extracted RNA on the human v2MicroRNA Expression BeadChips (Illumina, San Diego, CA, USA), a platform containing 743 human microRNAs. BeadChips were scanned with the Illumina iScan Reader and the experimental data were analysed using the r, Bioconductor and GeneSpring software.
In-silico analysis: identifying miRNA targets in the Treg cell transcriptome and analysing their potential function
Predicted mRNA targets under the regulatory control of the identified miRNAs were obtained from three databases 22. We cross-referenced the list of the potential miRNA targets to the published gene expression profiles of human Treg cells 23. We then performed pathway and functional analysis of the intersected predicted targets using the ingenuity pathway analysis platform to map the genes into networks, pathways and molecular function and the results clustered according to their gene ontology (GO) classifications.
Validating potential miRNA and mRNA by real-time PCR
Quantitative RT–PCR (qRT–PCR) was used to confirm the differential expression of miR-199a-5p, hypoxia-inducible factor (HIF)-1α and TGF-β-related genes on an array plate (Applied Biosystems, Life Technologies). For miR-199a-5p, 10 ng of RNA was used in a TaqMan assay (Applied Biosystems), as per the manufacturer's protocol, to confirm the differential expression normalized to expression of endogenous control RNU48. For HIF-1α, 50 ng of starting RNA was used for the Taqman qRT–PCR, normalized to expression of glyceraldehyde 3-phosphate dehydrogenase (GAPDH) (Applied Biosystems). All PCRs were run in triplicate. Forty cycles of amplification were used and data acquisition was carried out with StepOnePlus Real-Time PCR systems (Applied Biosystems). Data from all qRT–PCR experiments were analysed using the comparative ΔCt method. To measure the differential TGF-β gene expression in our cell model (see below) we used the TaqMan® array human TGF-β pathway 96-well plates (Applied Biosystems). This particular Taqman Array plate contains 92 assays to TGF-β-associated genes and four assays to candidate endogenous control genes; it targets genes encoding members of the TGF-β superfamily of ligands, including TGF-β (β1, β2 and β3), bone morphogenetic proteins (BMPs), growth and differentiation factors (GDFs), activin A and B/inhibin A and B, nodal, and others.
Inhibiting miR-199a-5p in CCD-986Sk cells
We employed the CCD-986Sk human fibroblast cell line [American Type Culture Collection (ATCC), Manassas, VA, USA] to assess miRNA functional activity. This cell line is reported to endogenously express miR-199a-5p 24. These cells were transfected with LNA™ microRNA inhibitor and negative control (Exiqon, Vedbaek, Denmark) then treated with TGF-β to assess the effect of miR-199a-5p on the TGF-β pathway gene expression using TaqMan® array plates.
The CCD-986Sk cells were plated in T-75 flasks and cultured in Iscove's Dulbecco's modified Eagle's medium (DMEM) ×1 medium (Fisher Scientific, Rockford, IL, USA) with 10% fetal bovine serum (FBS). Cells were passed every 5–7 days when 80–90% confluent. We confirmed that the CCD-986Sk cells expressed miR-199a-5p by real-time RT–PCR. For the transfection experiments, cells were passed into six-well plates (30 × 106–35 × 106 cells/plate), and after approximately 24 h incubation at 37°C they were transfected with miR-199a-5p miRCURY LNA™ microRNA inhibitor and LNA negative control 3′-fluorescein-labelled (Exiqon) using Lipofectamine™ 2000 (Applied Biosystems), as per the manufacturer's protocol; a second control, with only Lipofectamine 2000 and without LNA was also performed. The LNA microRNA inhibitors are anti-sense oligonucleotides with perfect sequence complementary to their target, in this case AACAGGTAGTCTGAACACTGG. When introduced into cells, LNAs sequester their target microRNA in highly stable heteroduplexes preventing the miRNA from hybridizing with its normal target. The final optimal concentrations for LNA and Lipofectamine that yielded > 90% transfection efficiency were 100 pmol LNA and 3·5 μl Lipofectamine. Forty-eight h after transfection (i.e. 3 days from seeding the cells), the medium was changed to Iscove's DMEM ×1 medium without the FBS then incubated for another 24 h in serum-starved conditions to be treated with TGF-β1. On the day of harvest, cells were treated with 10 ng/ml of TGF-β1, or medium as control, for 1 h then lysed for RNA or protein isolation. These experiments were performed in triplicate. RNA samples from the three experiments were pooled then run on the TGF-β pathway TaqMan® array plates, as described above.
Over-expressing miR-199a-5p in human T lymphoblastic leukaemia cell line (MOLT)-4 cells
We used MOLT-4 cells, a lymphoblastic leukaemia cell line, to study the effects of over-expressing miR-199a-5p on BMP4 regulation. We found that this cell line does not express miR-199a-5p and increases its expression of BMP4 with epigallocatechin gallate (EGCG) stimulation by real-time RT–PCR. MOLT-4 cells were transfected with a miRNA mimic and labelled control (miRIDIAN microRNA human Hsa-miR-199a-5p and miRIDIAN microRNA transfection control with Dy547) diluted in Dharmacon ×5 siRNA buffer (Thermo Fisher Scientific, Waltham, MA, USA). Cells were seeded (1 × 10⁶ to 2 × 10⁶) and cultured overnight in antibiotic-free RPMI with 10% serum in standard conditions then transfected overnight using SE buffer/CM-137 program/200 nM mimic or control, 4D-Nucleofactor X Kit (Lonza, Basel, Switzerland), according to the manufacturer's protocol. Transfected MOLT-4 cells were then treated with 10 and 50 nM of EGCG diluted in 1:1000 dimethylsulphoxide (DMSO) for 48 h, but the 50 nM gave a more pronounced increase in BMP4. New medium with/without EGCG was replaced every 24 h. The same aforementioned kit was used to extract RNA followed by Taqman qRT–PCR.
Western blot analysis
CCD-986Sk cells from the transfection experiments were lysed in radio-immunoprecipitation assay (RIPA) lysis buffer (Cell Signaling, Beverly, MA, USA) for 30 min on ice. After centrifugation for 5 min at 15000 g (4°C), the protein content of the samples was determined. Thirty μg protein samples were loaded onto NuPAGE® 4–12% Bis-Tris Gels (Invitrogen, Carlsbad, CA, USA) then blotted onto the nitrocellulose membrane. Western blots were performed using antibodies directed against Smad2 and phosphoSmad2 (Cell Signaling). Anti-rabbit secondary antibodies were used (Cell Signaling). Densitometry of the Western blots was performed using the Adobe Photoshop CS6 extended software. Experiments were also performed in triplicate but, unlike RNA samples, these were not pooled.
Bioinformatics and statistical analysis
The miRNA microarray data were analysed using the r, Bioconductor and GeneSpring software. After cleaning and checking for data quality by standard methods for microarrays and principal component analysis (PCA) we used a cut-off of ≥ 1·5-fold differential expression as a threshold. A statistical t-test was then run on biological replicate samples to identify those miRNAs meeting a statistical threshold of P < 0·05. A Benjamini–Hochberg correction was used for minimizing type 1 errors associated with multiple testing. We performed group comparisons of the miRNA expression within the same cell populations (healthy Treg versus smokers Treg versus COPD Treg cells) to identify miRNAs associated with each cohort of subjects for that particular T cell phenotype. We also compared the miRNA profile between Treg cells and Teff cells. For the TaqMan® array human TGF-β pathway 96-well plates we used ExpressionSuite Software (Applied Biosystems; version 1·0.2) to analyse the results. Lastly, for the RT–PCR data and Western blot analyses, we performed one-way analysis of variance (anova) followed by the Student–Newman–Keuls method for pairwise multiple comparisons on SigmaStat. Data are expressed as mean ± standard deviation (s.d.).
Results
Patient demographics and cell populations
Patients' demographics are shown in Table 1. Of the COPD patients, one was GOLD stage 1, six were stage 2, four were stage 3 and one was stage 4. All but two patients were on short- and/or long-acting bronchodilators, and eight patients also received inhaled corticosteroids.
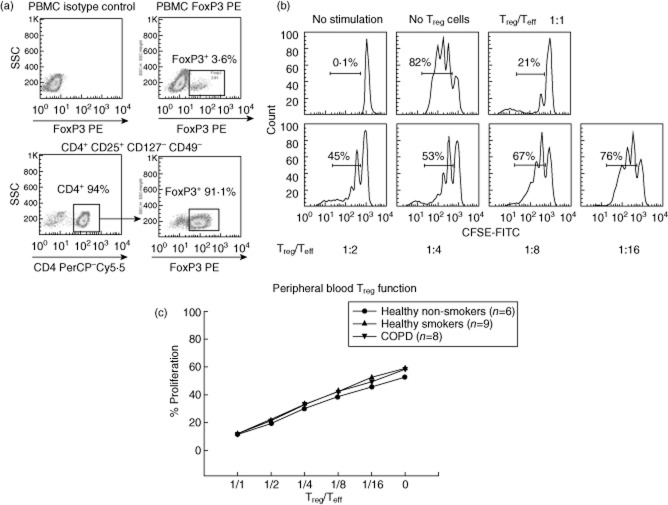
Our purified CD4+CD25+CD127–CD49− Treg cells were > 88% FoxP3+ and exhibited a significant suppressive activity of Teff cells consistent with their proposed function (Fig. 1). The CD4+CD25− Teff cells were confirmed to be < 4% FoxP3+.
Fig. 1.
Regulatory T cell (Treg) flow cytometry analysis and suppression assay. (a) Representative flow cytometry analysis of peripheral blood mononuclear cells (PBMC) and CD4+ cells analysed for forkhead box protein 3 (FoxP3) expression by flow cytometry. (b) Histograms showing one Treg cell suppression assay of our CD4+CD25+CD127–CD49− Treg cells. Proliferation of carboxyfluorescein (CFSE)-labelled T effector (Teff) cells is shown with each graph representing reduced concentration of Treg cells co-cultured with Teff cells. Each peak under the horizontal bar represents a generation of proliferating Teff cells, so the bar reflects the total percentage of proliferating Teff cells. (c) Teff proliferation curves from our cohorts show no difference in the Treg cell function between the three groups (P = 0·8).
Distinct COPD Treg miRNA profile
The miRNA profile in COPD Treg cells was more heterogeneous compared to healthy subjects. All healthy samples in each of the two cell categories exhibited a strong correlation in PCA (Fig. 2), but this was not observed in COPD for both cell types, suggesting that COPD, rather than smoking, may be responsible in part for miRNA deregulation. When we analysed and compared the Treg cell miRNA profiles of our cohorts we found six and 96 miRNAs that were specific to COPD versus healthy non-smokers and unaffected smokers, respectively. Remarkably, of the 743 miRNAs tested on the Illumina platform, we found no difference in miRNA expression between the Treg cells of healthy non-smokers and healthy unaffected smokers. Moreover, there were no differences in miRNA expression between COPD Teff cells and smokers' Teff cells, suggesting that the adaptive immunological disturbance in COPD is probably related to Treg rather than Teff cell dysfunction.
Fig. 2.
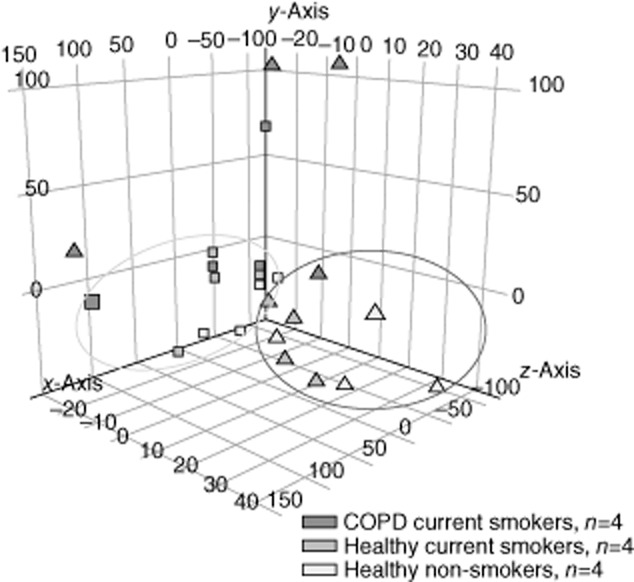
Regulatory T cell (Treg) and T effector (Teff) cells cluster analysis. Three-dimensional graph showing cluster principal component analysis (PCA) of the miRNome obtained from 12 subjects (four per group) demonstrating strong clustering of both cell phenotypes in healthy individuals (non-smokers and current smokers), but not in chronic obstructive pulmonary disease (COPD) patients. ▲ = Treg cells; ▪ = Teff cells.
Down-regulation of miR-199a-5p and HIF-1α in COPD Tregs
We validated several miRNAs that were expressed differentially between COPD and controls (Fig. 3) and found similar trends compared to the miRNA microarray analysis. Some of the miRNAs approached statistical significance, but we decided to pursue and report on miR-199a-5p because we were able to maintain a statistically significant difference and because this miRNA, in comparison to the rest, had most hits when we performed the in-silico analysis. We found miR-199a-5p to be significantly over-expressed in Treg cells compared to Teff cells (P < 0·001), and that it was consistently up-regulated by almost fourfold in smokers' and non-smokers' Treg cells than COPD Treg cells (P = 0·04) (Fig. 4a). We found a weak but significant correlation between miR-199a-5p expression and age (r2 = 0·13, P = 0·03), but no significant associations/differences with % predicted FEV1, FEV1/FVC, race, gender or being on inhaled corticosteroids.
Fig. 3.
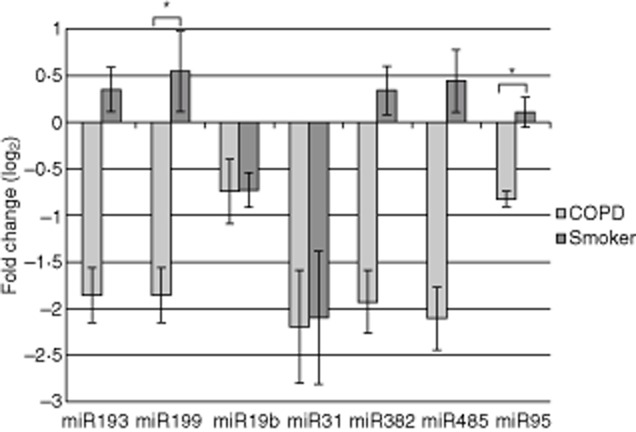
Log2 relative expression (RQ) plots showing fold change for some of the reverse transcription–polymerase chain reaction (RT–PCR)-validated miRNAs referenced to healthy non-smokers in regulatory T cells (Treg). Chronic obstructive pulmonary disease (COPD) patients and healthy smokers are referenced to healthy non-smokers (n = 6, 7 and 5, respectively, mean ± standard error. *P < 0·05 between COPD and both healthy subjects, mean ± standard error of the mean).
Fig. 4.
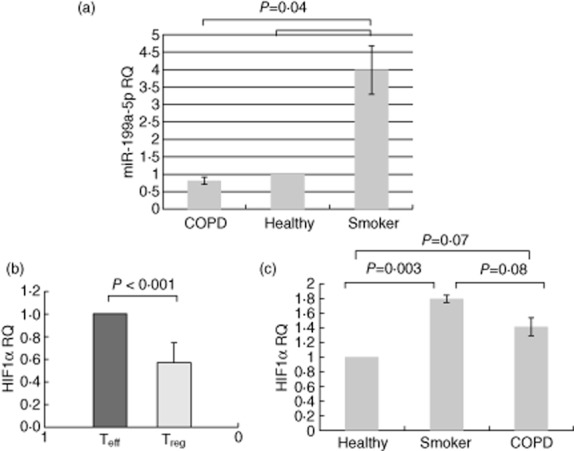
Comparison of miR-199a-5p and hypoxia-inducible factor (HIF)-1α expression between chronic obstructive pulmonary disease (COPD) and controls. Figures (a) and (c) depict relative expression (RQ) plot, based on ΔΔCT obtained from real-time reverse transcription–polymerase chain reaction (RT–PCR), showing fold change in expression of miR-199a-5p and HIF-1α in regulatory T cells (Treg) in the three groups referenced to healthy non-smokers (n = 35; 12 healthy non-smokers, 12 healthy smokers and 11 COPD patients). miR-199a-5p and HIF-1α were normalized to expression of endogenous control RNU48 and glyceraldehyde 3-phosphate dehydrogenase (GAPDH), respectively. The COPD group had one less subject because his RNA sample ran out after running the microarray. (b) Significant under-expression of HIF-1α in regulatory T cells (Treg) compared to T effector (Teff) cells (mean ± standard error of the mean).
HIF-1α is a validated target of miR-199a-5p and modulates the Th17/Treg response 14, so we measured its expression in Treg and Teff cells. We found HIF-1α to be down-regulated by 41 ± 27% in Treg cells compared to Teff cells (P < 0·001), and that its expression tended to be reduced in COPD patients (Fig. 4b). Surprisingly, HIF-1α expression in Treg cells was correlated weakly but positively with miR-199a-5p expression (r2 = 0·27, P < 0·002). There was no correlation between HIF-1α and severity of disease, race, gender and age. We also examined the expression of HIF-1α in the miR-199a-5p LNA transfected CCD-986Sk cells, and we observed a trend of increased HIF-1α with miR-199a-5p inhibition with TGF-β treatment (relative expression of negative control and LNA 1·39 ± 0·27 and 1·52 ± 0·26 versus Lipofectamine, P = 0·2).
Identifying targets and function of miR-199a-5p
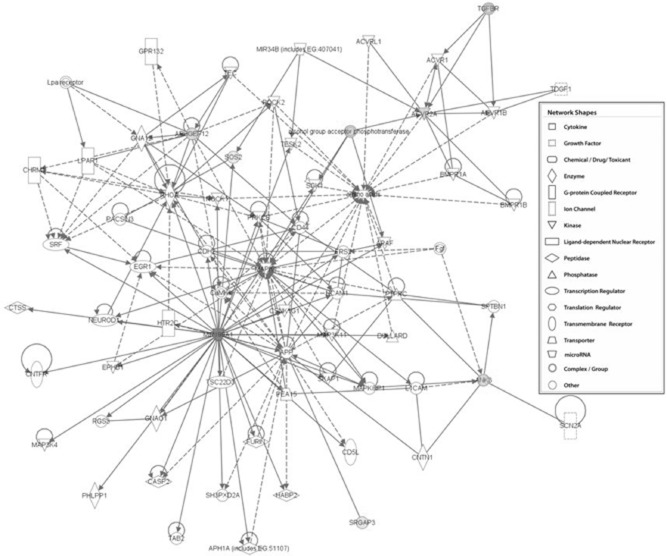
Upon mining the transcriptome of resting and stimulated human Treg cells and cross-referencing with predicted miR-199a-5p targets, using in-silico analysis we found a significant number of its putative down-regulated targets (Table 2) over-represented in the cell movement, amino acid metabolism and post-translational modification networks (Table 3). Moreover, the classification of these genes according to top pathways showed the strongest association with the TGF-β signalling pathway (Table 4, Fig. 5).
Table 2.
Regulatory T cell (Treg) genes that are predicted miR-199a-5p targets
| Gene name | Treg versus Thelp (stimulated) | Treg versus Thelp (resting) | Treg versus Thelp (stimulated) | Treg versus Thelp (resting) |
|---|---|---|---|---|
| ANK3 | −2·232 | −1·773 | 0·001 | 0·012 |
| ARHGEF12 | −1·950 | −1·534 | 0·010 | 0·096 |
| ACVR2A | −1·538 | −1·456 | 0·005 | 0·007 |
| GLIPR1 | −0·754 | −1·093 | 0·053 | 0·078 |
| ZNF215 | −1·094 | −0·766 | 0·017 | 0·069 |
| SRGAP3 | −0·626 | −0·764 | 0·049 | 0·067 |
| KLF12 | −0·669 | −0·724 | 0·021 | 0·079 |
| C1GALT1 | −1·036 | −0·683 | 0·013 | 0·096 |
| SOS2 | −0·568 | −0·546 | 0·015 | 0·034 |
| ZNF117 | −0·804 | −0·506 | 0·062 | 0·094 |
| GALC† | −0·682 | −0·443 | 0·010 | 0·070 |
Differentially expressed Treg cell genes that are down-regulated and are predicted targets of miR-199a-5p. The first two columns are log2 fold change, and the last two columns represent the respective false discovery rate (FDR)-adjusted P-value.
Galactosylceramidase (GALC) was predicted by miRanda only; all other genes were found in the three databases (Targetscan, MiRanda and MirWalk). Thelp = T helper cells.
Table 3.
Top networks of miR-199a-5p targets in regulatory T cells (Treg)
| Associated network functions | Score† |
|---|---|
| Cellular movement, amino acid metabolism, post-translational modification | 13 |
| Cardiovascular system development and function, cell-to-cell signalling and interaction, connective tissue development and function | 3 |
| Carbohydrate metabolism, cell-to-cell signalling and interaction, haematological system development and function | 3 |
| Gene expression, cell cycle, cell morphology | 3 |
| Cell death, cell cycle, cancer | 2 |
In ingenuity pathway analysis a score of 3 is considered to be significant (one in 1000 chance that genes are integrated in that network by pure chance).
Table 4.
Top canonical pathways associated with predicted targets of miR-199a-5p
| Name | P-value |
|---|---|
| TGF-β signalling | 1·4E-03 |
| Axonal guidance signalling | 2·3E-03 |
| PPARα/RXRα activation | 6·6E-03 |
| Breast cancer regulation by Stathmin1 | 8·4E-03 |
| Actin cytoskeleton signalling | 1·1E-02 |
Classification of miR-199a-5p targets based on the ingenuity pathway analysis of these genes that were obtained from the regulatory T cell (Treg) transcriptome. TGF = transforming growth factor; PPAR = peroxisome proliferator-activated receptors; RXR = retinoid X receptor.
Fig. 5.
Interacting miR-199a-5p targets in regulatory T cells (Treg). Ingenuity pathway analysis of the transforming growth factor (TGF)-β signalling network based on interacting set of genes that are miR-199a-5p predicted targets and found in the Treg cell transcriptome (P = 0·001).
In our loss-of-function model, we achieved a transfection efficiency of fluorescently labelled miR-199a-5p LNA of > 90% in the CCD-986Sk cells without causing significant cell death (< 20%) or changing the phenotype of the cells (Fig. 6). The TGF-β pathway was activated in this cell model based on increased expression of phosphoSmad2 (pSmad2). Figure 7 displays results of the Western blot and genes that were > 20% over-expressed in the Taqman TGF-β array plate in the CCD-986Sk cells. These results suggest that miR-199a-5p may serve to repress expression of some of these genes in vitro, the most pronounced being genes within the BMP pathway. The disinhibition of BMP3 and BMP4 was most pronounced in this cell model, but BMP2 and one of the BMP receptors showed the same trend without any increase in Smad expression, also suggesting that miR-199a-5p may be playing its role by regulating the Smad-independent pathways. The over-expression of miR-199a-5p in MOLT-4 cells showed significant down-regulation of BMP4 expression, supporting the observation that some BMP members may be regulated directly or indirectly by miR-199a-5p (Fig. 8).
Fig. 6.
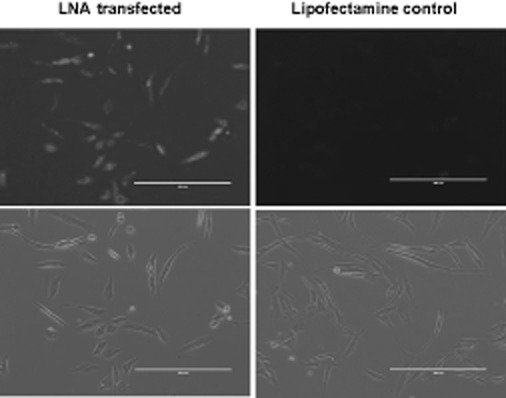
Locked nucleic acid (LNA) transfection efficiency CCD-986Sk cells. Photomicrographs of CCD-986Sk cells obtained 48 h after the transfection reaction with 3′-fluorescein-labelled miR-199a-5p miRCURY LNA™ microRNA inhibitor versus Lipofectamine™ 2000. The negative control miRCURY LNA™ showed the same transfection efficiency (>90%) as the miR-199a-5p miRCURY LNA™ inhibitor.
Fig. 7.
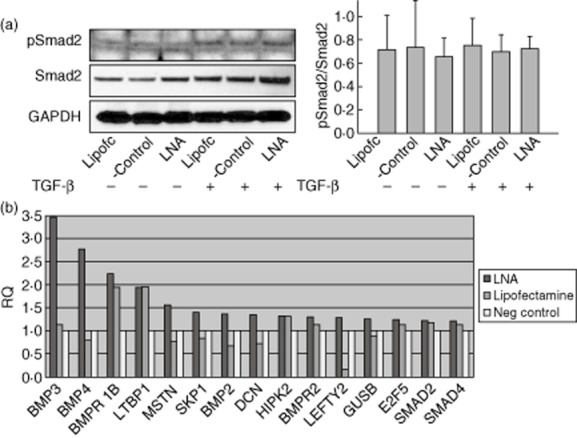
Effects of miR-199a-5p inhibition on transforming growth factor (TGF)-β pathway in CCD-986Sk cells. (a) Western blot analysis of miR-199a-5p locked nucleic acid (LNA)-transfected CCD-986Sk cells treated with TGF-β compared to Lipofectamine control and negative control show no difference in pSmad2 expression when normalized to Smad2 (P = 0·92). The same was noted when pSmad2 was normalized to glyceraldehyde 3-phosphate dehydrogenase (GAPDH). Data are presented as mean ± standard deviation, n = 3. (b) Relative expression (RQ) plot obtained from the Taqman TGF-β array plate analysis of the pooled RNA of LNA-transfected CCD-986Sk cells showing fold change of genes that were overexpressed by > 20% versus negative control (n = 3).
Fig. 8.

Effects of miR-199a-5p over-expression on bone morphogenic protein (BMP)4 in human T lymphoblastic leukaemia cell line (MOLT-4) cells. miR-199a-5p resulted in > 80% suppression of BMP4 expression after treatment with epigallocatechin gallate (EGCG) [n = 3, mean ± standard error of the mean, light blue colour columns + EGCG treatment diluted in dimethylsulphoxide (DMSO) versus dark blue columns DMSO only].
Discussion
In this study we report that COPD, rather than smoking, has a significant impact on miRNA expression profile in Treg cells based on the miRNA microarray analysis. We validated certain miRNAs that were identified in the miRnome of smokers with and without COPD and found that the miR-199a-5p response is significantly blunted in COPD Treg cells compared to Treg cells in healthy unaffected smokers. We also showed that miR-199a-5p to be specific to Treg cells and that a significant over-representation of its target genes was found in the Treg cell transcriptome. Importantly, many of the identified miR-199a-5p target genes were associated with the TGF-β signalling pathway. Interrogating the TGF-β pathway in our cell models also suggested that BMP signalling may be regulated by miR-199a-5p and implicating a non-Smad2 component within the TGF-β signalling pathway.
In COPD, studies that addressed the active immune suppressive mechanisms involving Treg cells are descriptive and inconclusive 5,6,8,9,25. Treg cells are generally categorized as adaptive/induced (iTreg), and natural, thymically derived CD4+CD25+FoxP3+ Treg (nTreg) cells. To what extent these two Treg cell populations are involved in the pathogenesis of COPD is unknown, but prior observations in BAL and tissue Treg cells, although inconsistent, all agree that the Treg cell response is abnormal and may be impaired 11, with a shift towards a Th1 and Th17 12. The mediators and mechanisms of deregulation are currently undetermined. COPD lungs provide a backdrop of ample antigens from smoking and its degradation by-products 9, latent viral pathogens 26 and repeated exacerbations 27, thus affecting numerous factors, including miRNAs, that could potentially modulate the Treg response.
In this study, when we analysed the miRNA expression in Treg and Teff cells we observed a strong clustering of samples in healthy subjects (non-smokers and smokers) for both phenotypes, but the difference between COPD patients and healthy subjects was most remarkable in Treg cells (Fig. 2). The miRNA profiles of the two T cell phenotypes were almost identical in healthy subjects, but not when compared with COPD Treg cells. In contrast, there was no difference in the miRnome of Teff cells of COPD and healthy smokers. These findings provide somewhat compelling evidence that the Treg cells are deregulated in COPD and that aberrancies within these Treg cells are likely to be more relevant to COPD immunopathogenesis than in Teff cells.
Overlapping the predicted targets of our validated miRNAs with published mRNA data of Treg cells revealed most hits for miR-199a-5p (11 genes for miR-199a-5p versus ≤5 genes for the other miRNAs), and these hits were associated significantly with the TGF-β pathway. miR-199a-5p is expressed in synovial and skin fibroblasts 24 and has been shown to have divergent functions in carcinogenesis; it promotes tumour progression in a few cancers 28, whereas in others it suppresses growth and invasiveness 29. In peripheral blood leucocytes and leucocytic cell lines, miR-199a-5a is down-regulated and its locus is hypermethylated 24. Our finding that miR-199a-5p is specifically up-regulated in Treg cells has not been reported, and raises questions about its function in these cells and the mechanism of its deregulation in COPD. Consistent with its putative function in the TGF-β signalling pathway, Zhang et al. demonstrated that miR-199a-5p is up-regulated by TGF-β1 in pulmonary artery smooth muscle cells and suggested that they may form a negative feedback loop to ensure a contained TGF-β response 30. We interrogated the TGF-β pathway in fibroblasts and MOLT-4 cells to explore other potential targets of miR-199a-5p to TGF-β. Interestingly, we found that the BMP pathway could also be involved (Figs 7b and 8). Although we did not provide functional data of miR-199a-5p in primary T cells, two groups have reported strong and convincing evidence on the role of the BMP signalling pathway in T cell biology. In the first study, Lu et al. neutralized the BMP pathway using Noggin and showed that BMP2/4 have a synergistic effect with TGF-β on the induction of Treg cells 31. Of note, both BMP2/4 were up-regulated with miR-199a-5p inhibition in our cell model. In the second study, Yoshioka et al. analysed the functional consequences of inhibiting BMP in Jurkat cells and mouse CD4+ cells 32. They found that BMPR inhibition did not affect phosphorylation of Smad2, but rather decreased the phosphorylation of Smad1/5/8 and inhibited the differentiation of Th17 and iTreg cells with marked suppression of Tbx21 and Rorc. Moreover, Zhang et al. reported that miR-199a-5p regulates TGF-β signalling by targeting Smad4 in a cancer cell line 30. Whether or not miR-199a-5p is directly involved in regulating the BMP signalling pathway in T cell will need to be confirmed, but the aforementioned reports, together with our results, suggest that miR-199a-5p is potentially an important regulator of the adaptive T cell response. In this context, the observed over-expression of miR-199a-5p in the Treg cells of unaffected smokers versus their blunted response in COPD (Fig. 4a) could be explained by two different mechanisms. Recently, He et al. demonstrated that reactive oxygen species (ROS) inhibit miR-199a expression through increasing its promoter methylation 33, and it is now well recognized that the anti-oxidant capacity in COPD is substantially reduced even after smoking cessation due to the continued production of ROS 34. Therefore, it is possible that in susceptible individuals the excessive ROS from smoking contributes to the blunting of the miR-199a-5p in COPD, which would hypothetically explain the shift in the Treg/Th1–Th17 balance (Fig. 9). Conversely, in unaffected smokers one can hypothesize that miR-199a-5p is up-regulated by early growth response protein 1 (Egr-1). Egr-1 is a transcription factor that can occupy the miR-199a gene promoter, inducing its expression in certain cancer cells 35. Of interest, however, is that Egr-1 protein expression is increased in multiple lung cells after exposure to cigarette smoke in a dose- and time-dependent manner 36, thus potentially explaining its up-regulation in our T cell population. Lastly, miR-199a-5p may have an impact on the Treg response via HIF-1α 37, which is known to shift the Treg/Th17 balance towards Th17 14. Our observation of a blunted HIF-1α response in COPD compared to healthy smokers is in agreement with the reported decrease in its expression in lung tissue of COPD patients 37, but cannot be explained by its positive association with miR-199a-5p in this study. It is unclear if this finding could be related to other regulators of HIF-1α or due to the basal state of our unstimulated peripheral T cells.
Fig. 9.
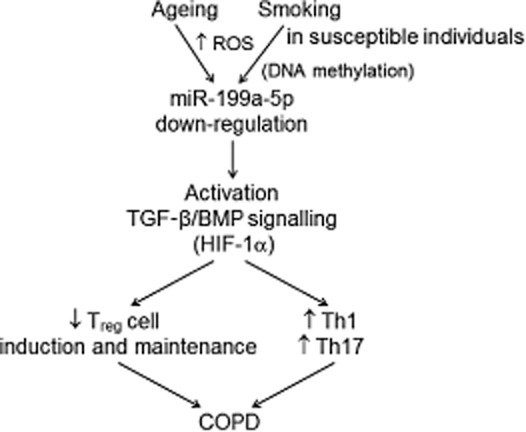
A schematic of the proposed function of miR-199a-5p in regulatory T cells (Treg). Deregulation of miR-199a-5p due possibly to the increased production of reactive oxygen species (ROS) leads eventually to an over-expression of the transforming growth factor (TGF)-β/bone morphogenic protein (BMP) signalling pathway, thus skewing the T cell response to T helper type 1 (Th1) and Th17 cells. As we found a positive correlation between miR-199a-5p expression and age, it is also possible that any of the aberrant ageing mechanisms in chronic obstructive pulmonary disease (COPD) may be involved in the deregulation of miR-199a-5p.
Our study has the limitations of a small number of subjects, with some patients being on inhaled corticosteroids, not being perfectly matched for age, and may not fully reflect Treg cell changes in the lungs. With that in mind, the isolation of highly purified Treg and Teff cells helped in reproducing the same trends for the observed differences with validation in the final cohort of patients. Secondly, although the groups were not perfectly matched, we observed only a correlation between age and miR-199a-5p expression; that association was very weak and is unlikely to have such a dramatic impact on miRNA expression. Lastly, the fact that we found significant differences in the peripheral blood Treg cells suggests that the response of the peripheral Treg cell pool has been altered either directly, by antigenic stimulation, or indirectly due to the systemic effects of COPD. This conclusion is in line with a recent study by Rahman et al., who reported changes in the peripheral blood Treg cell kinetics among patients with inactive Crohn's disease when compared to non-Treg cells and Treg cells from healthy control subjects 38, again suggesting that the effect of persistent tissue antigenic stimulation in chronic inflammatory conditions may spill into the periphery. Moreover, in patients with COPD, Hou et al. recently demonstrated changes of peripheral blood Tregs that mirrored tissue Treg changes and correlated with loss of lung function and immune activation 7. Lastly, inhaled corticosteroids are unlikely to have a major effect miR-199a-5p expression, as we did not see any correlation between this miRNA and their use and they obviously do not explain the up-regulation of miR-199a-5p in unaffected smokers.
In conclusion, we have found substantial differences in the miRnome of Treg cells, but not Teff cells, between COPD and healthy controls, and we have also shown that miR-199a-5p is up-regulated in Treg cells compared to Teff cells. Both findings are novel and support future functional studies to determine if miR-199a-5p repression, as observed in our COPD patients, has a significant impact on modulating the adaptive immune balance in favour of Th1 and Th17 cell responses.
Acknowledgments
The authors thank Drs Asif Chaudhry, Suleiman Ezoubi and Zeeshan Khan-Niazi for their support in the laboratory and helping with recruiting subjects for this study, and Dr Bassel Sawaya for providing insights into miRNA research and providing laboratory resources. This study was funded by grant no. NHLBI 5K08HL091058, DA-14230, and P30DA-13429.
Disclosures
The authors declare that they have no conflicts of interest.
Author contributions
T. A., J.-K. C., W. C. and M. S. were involved in setting up certain aspects of various experiments and data acquisition. B. M. performed the bioinformatics and statistical analysis. G. J. C., W. W. H. and T. J. R. were the mentors for this project and provided significant resources, guidance in the design of the experiments, and drafting of the manuscript. All authors approved the final version of the manuscript.
Supporting information
Additional Supporting information may be found in the online version of this article at the publisher's web-site:
Table S1. Differential expression of miRNAs in regulatory T cells. The miRNA microarray data can be accessed in GEO at: http://www.ncbi.nlm.nih.gov/geo/query/acc.cgi?acc=GSE56923.
References
- 1.MacNee W, Tuder RM. New paradigms in the pathogenesis of chronic obstructive pulmonary disease I. Proc Am Thorac Soc. 2009;6:527–531. doi: 10.1513/pats.200905-027DS. [DOI] [PubMed] [Google Scholar]
- 2.Agusti A, Sobradillo P, Celli B. Addressing the complexity of chronic obstructive pulmonary disease: from phenotypes and biomarkers to scale-free networks, systems biology, and P4 medicine. Am J Respir Crit Care Med. 2011;183:1129–1137. doi: 10.1164/rccm.201009-1414PP. [DOI] [PubMed] [Google Scholar]
- 3.Mercado N, Thimmulappa R, Thomas CM, et al. Decreased histone deacetylase 2 impairs Nrf2 activation by oxidative stress. Biochem Biophys Res Commun. 2011;406:292–298. doi: 10.1016/j.bbrc.2011.02.035. [DOI] [PMC free article] [PubMed] [Google Scholar]
- 4.Adenuga D, Yao H, March TH, Seagrave J, Rahman I. Histone deacetylase 2 is phosphorylated, ubiquitinated, and degraded by cigarette smoke. Am J Respir Cell Mol Biol. 2009;40:464–473. doi: 10.1165/rcmb.2008-0255OC. [DOI] [PMC free article] [PubMed] [Google Scholar]
- 5.Smyth LJ, Starkey C, Vestbo J, Singh D. CD4-regulatory cells in COPD patients. Chest. 2007;132:156–163. doi: 10.1378/chest.07-0083. [DOI] [PubMed] [Google Scholar]
- 6.Barcelo B, Pons J, Ferrer JM, Sauleda J, Fuster A, Agusti AG. Phenotypic characterisation of T-lymphocytes in COPD: abnormal CD4+CD25+ regulatory T-lymphocyte response to tobacco smoking. Eur Respir J. 2008;31:555–562. doi: 10.1183/09031936.00010407. [DOI] [PubMed] [Google Scholar]
- 7.Hou J, Sun Y, Hao Y, et al. Imbalance between subpopulations of regulatory T cells in COPD. Thorax. 2013;68:1131–1139. doi: 10.1136/thoraxjnl-2012-201956. [DOI] [PubMed] [Google Scholar]
- 8.Plumb J, Smyth LJ, Adams HR, Vestbo J, Bentley A, Singh SD. Increased T-regulatory cells within lymphocyte follicles in moderate COPD. Eur Respir J. 2009;34:89–94. doi: 10.1183/09031936.00100708. [DOI] [PubMed] [Google Scholar]
- 9.Lee SH, Goswami S, Grudo A, et al. Antielastin autoimmunity in tobacco smoking-induced emphysema. Nat Med. 2007;13:567–569. doi: 10.1038/nm1583. [DOI] [PubMed] [Google Scholar]
- 10.Isajevs S, Taivans I, Strazda G, et al. Decreased FOXP3 expression in small airways of smokers with COPD. Eur Respir J. 2009;33:61–67. doi: 10.1183/09031936.00145307. [DOI] [PubMed] [Google Scholar]
- 11.Moodley Y, Tan D. Impaired function of T-regulatory cells in COPD. Am J Respir Crit Care Med. 2012;185:A4544. [Google Scholar]
- 12.Wang H, Peng W, Weng Y, et al. Imbalance of Th17/Treg cells in mice with chronic cigarette smoke exposure. Int Immunopharmacol. 2012;14:504–512. doi: 10.1016/j.intimp.2012.09.011. [DOI] [PubMed] [Google Scholar]
- 13.Quintana FJ, Basso AS, Iglesias AH, et al. Control of T(reg) and T(H)17 cell differentiation by the aryl hydrocarbon receptor. Nature. 2008;453:65–71. doi: 10.1038/nature06880. [DOI] [PubMed] [Google Scholar]
- 14.Dang EV, Barbi J, Yang HY, et al. Control of T(H)17/T(reg) balance by hypoxia-inducible factor 1. Cell. 2011;146:772–784. doi: 10.1016/j.cell.2011.07.033. [DOI] [PMC free article] [PubMed] [Google Scholar]
- 15.Sethi A, Kulkarni N, Sonar S, Lal G. Role of miRNAs in CD4 T cell plasticity during inflammation and tolerance. Front Genet. 2013;4:1–13. doi: 10.3389/fgene.2013.00008. [DOI] [PMC free article] [PubMed] [Google Scholar]
- 16.Liang TJ, Qin CY. The emerging role of microRNAs in immune cell development and differentiation. APMIS. 2009;117:635–643. doi: 10.1111/j.1600-0463.2009.02520.x. [DOI] [PubMed] [Google Scholar]
- 17.Liston A, Lu LF, O'Carroll D, Tarakhovsky A, Rudensky AY. Dicer-dependent microRNA pathway safeguards regulatory T cell function. J Exp Med. 2008;205:1993–2004. doi: 10.1084/jem.20081062. [DOI] [PMC free article] [PubMed] [Google Scholar]
- 18.Stahl HF, Fauti T, Ullrich N, et al. miR-155 inhibition sensitizes CD4+ Th cells for TREG mediated suppression. PLOS ONE. 2009;4:e7158. doi: 10.1371/journal.pone.0007158. [DOI] [PMC free article] [PubMed] [Google Scholar]
- 19.Lu LF, Boldin MP, Chaudhry A, et al. Function of miR-146a in controlling Treg cell-mediated regulation of Th1 responses. Cell. 2010;142:914–929. doi: 10.1016/j.cell.2010.08.012. [DOI] [PMC free article] [PubMed] [Google Scholar]
- 20.Rabe KF, Hurd S, Anzueto A, et al. Global strategy for the diagnosis, management, and prevention of chronic obstructive pulmonary disease: GOLD executive summary. Am J Respir Crit Care Med. 2007;176:532–555. doi: 10.1164/rccm.200703-456SO. [DOI] [PubMed] [Google Scholar]
- 21.Akimova T, Ge G, Golovina T, et al. Histone/protein deacetylase inhibitors increase suppressive functions of human FOXP3+ Tregs. Clin Immunol. 2010;136:348–363. doi: 10.1016/j.clim.2010.04.018. [DOI] [PMC free article] [PubMed] [Google Scholar]
- 22.miRWalk. The database on predicted and validated microRNA targets. 2013. Available at: http://www.umm.uni-heidelberg.de/apps/zmf/mirwalk/micrornapredictedtarget.html (accessed November 2013)
- 23.Sadlon TJ, Wilkinson BG, Pederson S, et al. Genome-wide identification of human FOXP3 target genes in natural regulatory T cells. J Immunol. 2010;185:1071–1081. doi: 10.4049/jimmunol.1000082. [DOI] [PubMed] [Google Scholar]
- 24.Kim S, Lee UJ, Kim MN, et al. MicroRNA miR-199a* regulates the MET proto-oncogene and the downstream extracellular signal-regulated kinase 2 (ERK2) J Biol Chem. 2008;283:18158–18166. doi: 10.1074/jbc.M800186200. [DOI] [PubMed] [Google Scholar]
- 25.Chatila W, Aksoy M, Arguello V, Ji R, Kelsen S. COPD is not caused by a defect in T-regulatory cell infiltration into the lung. Am J Respir Crit Care Med. 2008;177:A874. [Google Scholar]
- 26.Retamales I, Elliott WM, Meshi B, et al. Amplification of inflammation in emphysema and its association with latent adenoviral infection. Am J Respir Crit Care Med. 2001;164:469–473. doi: 10.1164/ajrccm.164.3.2007149. [DOI] [PubMed] [Google Scholar]
- 27.Donaldson GC, Seemungal TA, Bhowmik A, Wedzicha JA. Relationship between exacerbation frequency and lung function decline in chronic obstructive pulmonary disease. Thorax. 2002;57:847–852. doi: 10.1136/thorax.57.10.847. [DOI] [PMC free article] [PubMed] [Google Scholar]
- 28.Magrelli A, Azzalin G, Salvatore M, et al. Altered microRNA expression patterns in hepatoblastoma patients. Transl Oncol. 2009;2:157–163. doi: 10.1593/tlo.09124. [DOI] [PMC free article] [PubMed] [Google Scholar]
- 29.Dai L, Gu L, Di W. MiR-199a attenuates endometrial stromal cell invasiveness through suppression of the IKKbeta/NF-kappaB pathway and reduced interleukin-8 expression. Mol Hum Reprod. 2012;18:136–145. doi: 10.1093/molehr/gar066. [DOI] [PMC free article] [PubMed] [Google Scholar]
- 30.Zhang Y, Fan KJ, Sun Q, et al. Functional screening for miRNAs targeting Smad4 identified miR-199a as a negative regulator of TGF-beta signalling pathway. Nucleic Acids Res. 2012;40:9286–9297. doi: 10.1093/nar/gks667. [DOI] [PMC free article] [PubMed] [Google Scholar]
- 31.Lu L, Ma J, Wang X, et al. Synergistic effect of TGF-beta superfamily members on the induction of Foxp3+ Treg. Eur J Immunol. 2010;40:142–152. doi: 10.1002/eji.200939618. [DOI] [PMC free article] [PubMed] [Google Scholar]
- 32.Yoshioka Y, Ono M, Osaki M, Konishi I, Sakaguchi S. Differential effects of inhibition of bone morphogenic protein (BMP) signalling on T-cell activation and differentiation. Eur J Immunol. 2012;42:749–759. doi: 10.1002/eji.201141702. [DOI] [PubMed] [Google Scholar]
- 33.He J, Xu Q, Jing Y, et al. Reactive oxygen species regulate ERBB2 and ERBB3 expression via miR-199a/125b and DNA methylation. EMBO Rep. 2012;13:1116–1122. doi: 10.1038/embor.2012.162. [DOI] [PMC free article] [PubMed] [Google Scholar]
- 34.Kirkham PA, Barnes PJ. Oxidative stress in COPD. Chest. 2013;144:266–273. doi: 10.1378/chest.12-2664. [DOI] [PubMed] [Google Scholar]
- 35.Sakurai K, Furukawa C, Haraguchi T, et al. MicroRNAs miR-199a-5p and -3p target the Brm subunit of SWI/SNF to generate a double-negative feedback loop in a variety of human cancers. Cancer Res. 2011;71:1680–1689. doi: 10.1158/0008-5472.CAN-10-2345. [DOI] [PubMed] [Google Scholar]
- 36.Chen ZH, Kim HP, Sciurba FC, et al. Egr-1 regulates autophagy in cigarette smoke-induced chronic obstructive pulmonary disease. PLOS ONE. 2008;3:e3316. doi: 10.1371/journal.pone.0003316. [DOI] [PMC free article] [PubMed] [Google Scholar]
- 37.Mizuno S, Bogaard HJ, Gomez-Arroyo J, et al. MicroRNA-199a-5p is associated with hypoxia-inducible factor-1alpha expression in lungs from patients with COPD. Chest. 2012;142:663–672. doi: 10.1378/chest.11-2746. [DOI] [PMC free article] [PubMed] [Google Scholar]
- 38.Rahman MK, Offord CP, Khanna S, et al. Regulatory T cell kinetics in the peripheral blood of patients with Crohn's disease. Hum Immunol. 2013;74:145–150. doi: 10.1016/j.humimm.2012.10.021. [DOI] [PMC free article] [PubMed] [Google Scholar]
Associated Data
This section collects any data citations, data availability statements, or supplementary materials included in this article.
Supplementary Materials
Table S1. Differential expression of miRNAs in regulatory T cells. The miRNA microarray data can be accessed in GEO at: http://www.ncbi.nlm.nih.gov/geo/query/acc.cgi?acc=GSE56923.


