Abstract
The spontaneous crescentic glomerulonephritis-forming/Kinjoh (SCG/Kj) mouse, a model of human crescentic glomerulonephritis (CrGN) and systemic vasculitis, is characterized by the production of myeloperoxidase-specific anti-neutrophil cytoplasmic autoantibody (MPO-ANCA) and marked leucocytosis. This study was performed to identify the specific populations of leucocytes associated with CrGN and susceptibility loci for pathogenic leucocytosis. Four hundred and twenty female (C57BL/6 × SCG/Kj) F2 intercross mice were subjected to serial flow cytometry examination of the peripheral blood (PB). Kidney granulocytes and monocytes were examined histopathologically. Linkage analyses were performed with 109 polymorphic microsatellite markers. Correlation studies revealed that increase of the granulocytes, F4/80+ cells, CD3+CD4−CD8− T cells and dendritic cells (DCs) in peripheral blood (PB) were associated significantly with glomerulonephritis, crescent formation and vasculitis. In kidney sections, F4/80low cells were observed in crescent, while F4/80high cells were around the Bowman's capsules and in the interstitium. Numbers of F4/80+ cells in crescents correlated significantly with F4/80+ cell numbers in PB, but not with numbers of F4/80+ cells in the interstitium. Genome-wide quantitative trait locus (QTL) mapping revealed three SCG/Kj-derived non-Fas QTLs for leucocytosis, two on chromosome 1 and one on chromosome 17. QTLs on chromosome 1 affected DCs, granulocytes and F4/80+ cells, but QTL on chromosome 17 affected DCs and granulocytes. We found CrGN-associated leucocytes and susceptibility QTLs with their positional candidate genes. F4/80+ cells in crescents are considered as recruited inflammatory macrophages. The results provide information for leucocytes to be targeted and genetic elements in CrGN and vasculitis.
Keywords: anti-neutrophil cytoplasmic autoantibody, crescentic glomerulonephritis, quantitative trait locus, SCG/Kj mice, vasculitis
Introduction
Vasculitis is characterized by inflammation and necrosis of blood vessel walls, and its clinical presentation depends on the type and size of vessels involved. The disease phenotype of small-vessel vasculitis in the kidney is crescentic glomerulonephritis (CrGN). Anti-neutrophil cytoplasmic autoantibody (ANCA) is detected in serum of patients with small-vessel vasculitis. Myeloperoxidase (MPO)-specific ANCA (MPO-ANCA) is related to the occurrence of microscopic polyangiitis and idiopathic pauci-immune necrotizing CrGN. Previous studies of patients have shown that genetic factors are important for both the production of ANCA and the occurrence of ANCA-associated vasculitis (AAV) 1,2, in relation to the dysfunction of granulocytes and lymphocytes 3,4. Genetic studies of murine models possibly shed light on studies in human vasculitis 2.
As a unique animal model of early and spontaneously occurring CrGN and vasculitis, the spontaneous crescentic glomerulonephritis-forming/Kinjoh (SCG/Kj) mouse has been established 5. Previous studies have revealed that CrGN and vasculitis in this model have been demonstrated to be associated with MPO-ANCA production and consequent hyperfunction of neutrophils 6,7. We also identified 14 susceptibility loci linked to histopathological traits and autoantibody production on mouse genome using (C57BL/6 × SCG/Kj) F2 intercross (BSF2) mice 8.
Profiles of leucocytes in peripheral blood (PB) have been studied extensively in human vasculitis and other autoimmune diseases to elicit their pathological mechanisms and to clarify therapeutic targets 9. In the follow-up procedure of BSF2 mice, we observed the profiles of leucocytes in PB with flow cytometry (FCM) repeatedly according to the age of the mice. Here, we report findings in the leucocyte lineages associating with the renal disease, particularly F4/80+ cells, susceptibility quantitative trait loci (QTLs) linked to abnormal leucocytosis. We also report epistatic interactions among QTLs and their candidate genes.
Materials and methods
Mice
The development of the F2 intercross mice were described earlier by Hamano et al. 8. Briefly, female C57BL/6 (B6) mice were purchased from the Shizuoka Laboratory Animal Center (Shizuoka, Japan). Male SCG/Kj mice were bred at the animal facility of Nippon Kayaku Co., Ltd (Tokyo, Japan) under specific pathogen-free conditions. B6 and SCG/Kj mice were crossed to obtain (B6 × SCG/Kj) F1 (BSF1) mice, and brother–sister mating of BSF1 produced a total of 420 female BSF2 animals. Only female mice were investigated. Animal care and experimental protocols were based on the guidelines for animal experiments at the Tokyo Metropolitan Institute of Gerontology Subcommittee on Animal Research.
Blood cell count and measurement of proteinuria
PB was obtained from periorbital sinus every 4 weeks. The white blood cell count was performed by the MEK-6158 Automatic Blood Cell Counter (Nihon Kohden, Tokyo, Japan). For monitoring the onset of glomerulonephritis (GN), proteinuria and haematuria were tested. Proteinuria was measured as described by Knight et al. 10. Haematuria was tested with Uropaper II urine dipsticks (Eiken Kagaku, Tokyo, Japan). Mice were killed at 24 weeks of age or when proteinuria was more than 200 mg/dl and/or haematuria was more than 1+.
Measurements of cell populations in PB by FCM
PB cells were depleted of red blood cells with ammonium chloride and single-cell suspensions were prepared in staining medium [phosphate-buffered saline (pH 7·4)/0·2% bovine serum albumin/0·05% NaN3]. Aliquots of 2–10 × 104 cells were triply or quadruply stained with monoclonal antibodies (mAbs). The mAbs against Gr-1 [fluorescein isothiocyanate (FITC)- or allophycocyanin (APC)-labelled, RB6-8C5], CD3ε (APC-labelled, 145-2C11), CD4 [phycoerythrin (PE)-labelled, GK1·5], CD8α (biotinylated, 53-6·7), CD11c (APC-labelled, HL3) and CD45R/B220 (biotinylated, RA3-6B2) were purchased from BD PharMingen (San Diego, CA, USA). PE-labelled or biotinylated mAb against F4/80 (BM8) was purchased from Caltag/Invitrogen (Carlsbad, CA, USA). Anti-mouse-immunoglobulin (Ig)M mAb (clone 331·12) was FITC-conjugated in our laboratory from the hybridoma kindly provided by Dr L. A. Herzenberg (Stanford University, CA, USA). Streptavidin–APC was purchased from BD PharMingen. Streptavidin–Alexa Fluor 594 was purchased from Molecular Probes/Invitrogen.
FCM analyses were performed as described previously 11. Briefly, cells were first blocked on ice with staining medium containing 10% normal rat serum. Cells were then stained with primary antibodies at 4°C for 30 min. After three washes, biotinylated antibodies were revealed by streptavidin–APC or streptavidin–Alexa Fluor 594 and incubated for 30 min at 4°C. The stained cells were examined using FACStar Plus and CellQuest software (BD Biosciences). Numbers of each population per 1 μl of PB were obtained by multiplying numbers in the white cell count by frequency in FCM.
Histopathology
At autopsy, kidneys were fixed in 10% formalin in 0·01 mol/l phosphate buffer (pH 7·2), embedded in paraffin and examined histopathologically, as described previously 8. Briefly, kidneys from one individual were dissected into more than four sections, and 120 glomeruli were examined. GN was expressed as percentage of glomeruli with endocapillary proliferation and/or mesangial proliferation and/or mesangial sclerosis. The crescent formation was expressed as numbers of glomeruli with crescents among 120 glomeruli. Vasculitis was expressed as numbers of small vessels with granulomatous vasculitis in four independent kidney sections.
Immunohistochemistry
Formalin-fixed, paraffin-embedded tissue sections were deparaffinized and rehydrated. After antigen retrieval with target retrieval solution (pH 6·0; Dako Japan, Tokyo, Japan) and endogenous peroxidase blocking by 3% hydrogen peroxide, tissue sections were blocked with 5% rabbit (Dako; for anti-Gr-1 and anti-F4/80) or goat serum (Dako; for anti-MPO). Sections were incubated overnight at 4°C with the following primary antibodies: anti-F4/80 (1:10, clone BM8; Abcam, Cambridge, MA, USA), anti-Gr-1 (1:20, clone RB6-8C5; eBioscience, San Diego, CA, USA), anti-MPO (1:100, RB-373; Thermo Fisher Scientific, Fremont, CA, USA) and negative control antibodies (10 μg/ml, hamster IgG, rat IgG2a and rat IgG2b; Biolegend, San Diego, CA, USA). Biotinylated rabbit anti-rat immunoglobulin (1:400, for anti-F4/80 and anti-Gr-1; Dako) or biotinylated goat anti-hamster IgG antibody (1:100, for anti-MPO; GeneTex, Irvine, CA, USA) were used as secondary antibody for 60 min at room temperature, followed by incubation with streptavidin–horseradish peroxidase (1:500; Dako). Sections were developed with 3-min 3,3-diaminobenzidine (0·2 mg/ml). In each mouse, numbers of positive cells per glomeruli in 30 consecutive glomeruli were counted at 400-fold magnification. In each glomerulus, positive cells were counted in the glomerular tuft, within the crescent and in the peri-glomerular area. Cells in each of cortical and medullary interstitium were assessed by counting positive cells in 10 random cortical and medullary fields (×400).
Microsatellite genotyping
Mapping panel was constructed using BSF2 as described previously 8, with modification by adding seven markers on the middle of chromosome 1 (D1MIT490, D1MIT492, D1MIT387, D1MIT91, D1MIT139, D1MIT536 and D1MIT30). Genomic DNA of mice were extracted from tail samples. Genotypes were determined by polymerase chain reaction (PCR) using selected simple sequence-length polymorphism markers. Genotypes of Fas were represented by those of D19MIT87 because of their adjacent positions on chromosome 19 8.
Statistical analyses
Comparison of leucocyte counts in PB among B6, BSF1, healthy BSF2 and diseased BSF2 mice was performed with analysis of variance (anova). Associations between histopathological traits and leucocyte counts in BSF2 mice were determined by correlation coefficients with P-values derived from Fisher's transformation. All analyses were performed using StatView, version 5·0 (Abacus Concepts, Inc., Berkeley, CA, USA).
Linkage analysis, interval mapping and interaction analysis
The linkage map for the BSF2 was created using MapManager QTX b20 (Dr K. F. Manly, http://www.mapmanager.org/). Interval mapping for QTL detection was performed using MapManager QTX in a free regression model. Likelihood ratio statistics were converted to conventional base-10 logarithm of odds (LOD) scores. To establish suggestive and significant threshold values, permutation tests were performed using MapManager QTX as described previously 12, with 1000 permutations of the data.
For epistatic interaction analyses, a systematic pairwise genome scan was performed using MapManager QTX b20. Results of permutation tests (500 times) using the interaction model by MapManager QTX were utilized to determine suggestive and significant thresholds of LOD score.
Results
Leucocytes in peripheral blood correlating with disease traits in BSF2 mice
As summarized in Table 1, correlation analyses between leucocyte counts in PB and renal disease traits were performed. Cell populations were estimated by FCM using lineage markers, Gr-1 for granulocytes, F4/80 for macrophages/monocytes 13, CD11c for dendritic cells (DCs), CD3 for T cells, surface IgM for B cells and markers for subpopulations.
Table 1.
Strength of association among numbers of leucocytes in peripheral blood and histopathological phenotypes.
| Leucocytes† | Glomerulonephritis (GN) | Crescents | Renal vasculitis |
|---|---|---|---|
| Dendritic cells | 0·376*** | 0·236*** | 0·436*** |
| Granulocytes | 0·393*** | 0·332*** | 0·249*** |
| Macrophages/monocytes | 0·276*** | 0·145** | 0·319*** |
| CD4+ T cells | n.s. | n.s. | 0·248*** |
| CD8+ T cells | n.s. | n.s. | 0·140* |
| CD4−CD8− T cells | 0·285*** | 0·248*** | 0·235*** |
| B cells | n.s. | n.s. | n.s. |
Strength of association expressed as Pearson's correlation coefficients (r) and P-values; *P < 0·01; **P < 0·005; ***P < 0·0001.
Numbers of cells in peripheral blood at 12 weeks of age (/μl). n.s. = not significant; GN = percentage of glomeruli with nephritic lesions; crescents = number of crescents in 120 glomeruli; renal vasculitis = number of inflamed vessels in four kidney sections. Three hundred and eighty-three mice underwent both flow cytometry and histological analyses.
DCs as well as granulocytes correlated significantly with all renal disease traits. Correlation between DCs and vasculitis was strongest among all leucocyte populations (Table 1). Macrophages/monocytes were also correlated significantly with all renal disease traits, but their correlation coefficients were weaker than those of granulocytes, except for renal vasculitis. CD3+CD4−CD8− T cells correlated significantly with all disease traits. Although CD4+ or CD8+ T cells associated weakly with renal vasculitis, they did not correlate with GN or crescent formation. B cells, however, were associated with none of these disease traits (Table 1).
B6, BSF1, healthy BSF2 and diseased BSF2 mice were examined by anova to confirm results of correlation analyses, and to assess their mode of inheritance (Fig. 1). A significant increase of granulocytes, macrophages/monocytes, DCs and CD3+CD4−CD8− T cells was shown in mice with GN (GN (+)) than in healthy mice (GN (−)) (Fig. 1a–d). Although not significant, granulocytes, macrophages/monocytes, and DCs tended to increase in BSF1 than in B6 mice, indicating that these phenomena inherited the mode of incomplete dominance.
Fig. 1.
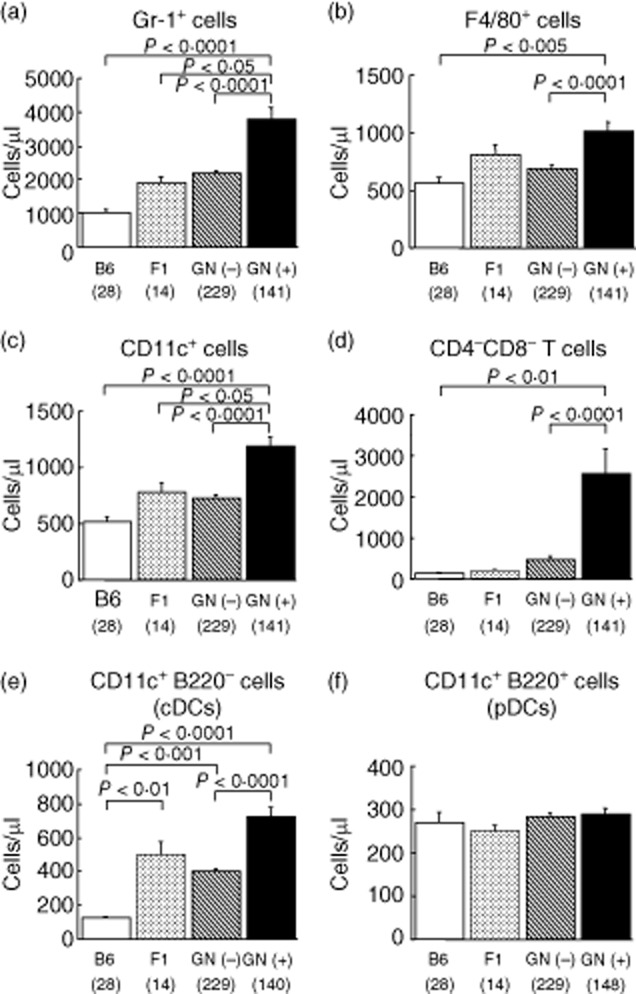
Increased numbers of Gr-1+ granulocytes (a), F4/80+ macrophages/monocytes (b), dendritic cells (DCs) (c) and CD4−CD8− T cells (d) in peripheral blood (PB) of [C57BL/6 × spontaneous crescentic glomerulonephritis-forming/Kinjoh (SCG/Kj)] F2 intercross (BSF2) mice with glomerulonephritis (GN). Not plasmacytoid (CD11c+B220+) but conventional (CD11c+B220−) DCs increased in GN (+) mice (e,f). Frequencies of each leucocyte in PB were counted using flow cytometry in C57BL/6 (B6), (C57BL/6 × SCG/Kj) F1 (BSF1), BSF2 without GN [GN (−)] and BSF2 with GN [GN (+)] mice at 12 weeks of age. Numbers of each leucocyte were calculated by multiplying the frequency and the whole white blood cell number. Whole leucocyte gates (blood cells except red blood cells and platelets) were examined. For CD4−CD8− T cells, CD3+ cells were further gated and analysed. Mean values ± standard error of the mean are shown. P-values were determined with analysis of variance (anova) and Fisher's protected least significant difference procedure. Numbers of mice are shown in parentheses.
Subpopulations of DCs correlating with disease traits
It was intriguing that increased DCs in PB correlated with disease traits. Comparison between diseased and healthy mice specified that not CD11c+B220+ DCs but CD11c+B220− DCs were involved in the development of GN (Fig. 1e,f). CD11c+B220− DCs increased significantly in diseased mice than in healthy mice (Fig. 1e), whereas there were no differences in CD11c+B220+ DCs among four groups (Fig. 1f). Similarly, not CD11b− but CD11b+CDs were increased in diseased BSF2 mice (data not shown). Because B220 is used to distinguish conventional DCs (cDCs, B220−) and plasmacytoid DCs (pDCs, B220+), these findings show that cDCs were involved in the development of GN.
Distribution of Gr-1+ cells, MPO+ cells and F4/80+ cells in normal and diseased kidneys
Because Gr-1+ cells and F4/80+ cells were correlated with GN, we examined these populations histopathologically as well as MPO+ cells in normal and glomerulonephritic kidneys with and without crescent formation (Fig. 2a–i).
Fig. 2.
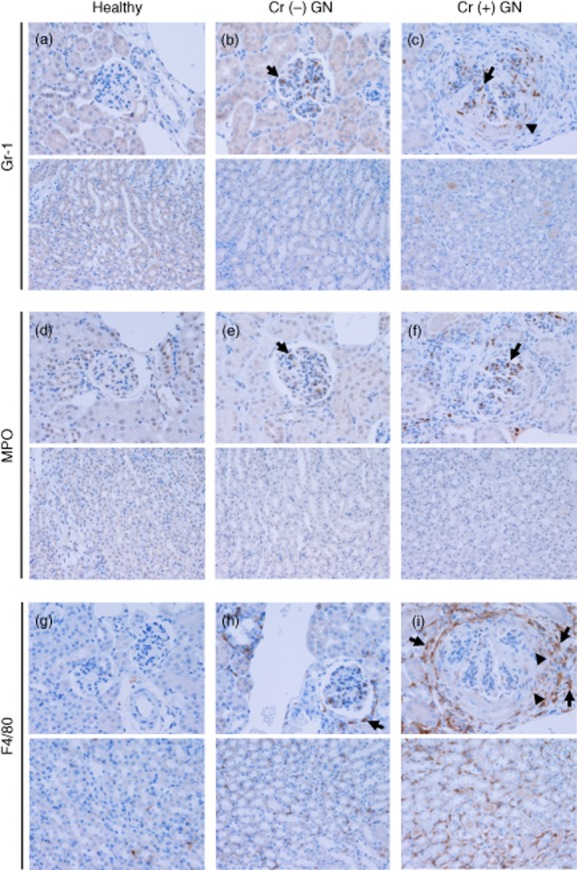
Distribution of Gr-1+ cells, myeloperoxidase (MPO+) cells and F4/80+ cells in healthy and glomerulonephritic glomeruli with crescents [Cr (+)] and without crescents [Cr (−)]. Upper photographs: cortical glomeruli, lower photographs: interstitium. (a–c) Gr-1+ cells were detected mainly within the glomerular tuft (arrows). Gr-1+ cells were also detected in crescents to a lesser extent (arrowhead), whereas they were rarely observed in the peri-glomerular area and in the interstitium. (d–f) As with Gr-1+ cells, MPO+ cells were found mainly in the glomerular tuft (arrows). They were detected occasionally in crescents, while they were rarely found in the peri-glomerular area and in the interstitium. (g–i) F4/80+ cells were present in the medullary and cortical interstitium in healthy mice. In mice with non-crescentic [Cr (−)] GN, an increased presence of F4/80+ cells was demonstrated in the peri-glomerular area (arrow) and in the interstitium. This was the case in mice with crescentic [Cr (+)] GN to a greater extent, and F4/80+ cells were also detected in crescents. F4/80+ cells in the interstitium and peri-glomerular area were F4/80high (arrows), while those in crescents were F4/80low (arrowheads). Original magnifications × 200. Numbers of mice: healthy, one; Cr (−) GN, three; Cr (+) GN, eight.
Gr-1+ cells were detected mainly within the glomerular tuft (Fig. 2b,c, arrows). Gr-1+ cells were also detected in crescents to a lesser extent (Fig. 2c, arrowhead), whereas they were rarely observed in the peri-glomerular area and in the interstitium (Fig. 2a–c).
As with Gr-1+ cells, MPO+ cells were found mainly in the glomerular tuft (Fig. 2e,f, arrows), while they were rarely found in the peri-glomerular area and in the interstitium (Fig. 2d–f). These suggest that many of MPO+ cells in the kidney are Gr-1+ cells.
F4/80+ cells were present in the medullary and cortical interstitium in healthy mice (Fig. 2g). In mice with non-crescentic GN, an increased presence of F4/80+ cells was demonstrated in the peri-glomerular area (Fig. 2h, arrow) and in the interstitium. This was the case in mice with crescentic GN to a greater extent, and F4/80+ cells were also detected in crescents (Fig. 2i). F4/80+ cells in the interstitium and peri-glomerular area were F4/80high (Fig. 2i, arrows), while those in crescents were F4/80low (Fig. 2i, arrowheads).
Characteristics and the trafficking of F4/80+ cells in diseased kidney
Next we analysed the distribution of F4/80+ cells in glomerulonephritic kidney and compared kidneys of GN with [Cr (+)] and without crescents [Cr (−)] (Fig. 3).
Fig. 3.
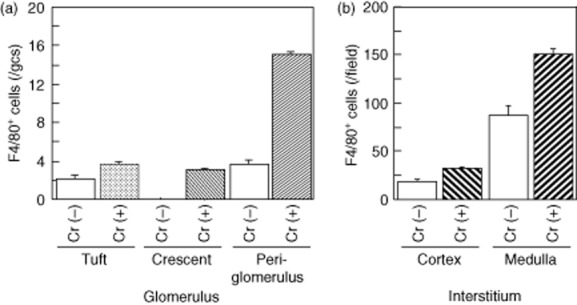
Distribution of F4/80+ cells in glomerulonephritic kidney: the difference between GN with crescents [Cr (+)] and without crescents [Cr (−)]. (a) More F4/80+ cells were demonstrated within crescents and peri-glomerular area in crescentic GN kidneys than in kidneys of GN without crescents. (b) F4/80+ cells were extensively present in the medullarly interstitium, especially in nephritic mice with crescents. Mean values ± standard error of the mean are shown are shown. Numbers of mice: Cr (−), four; Cr (+), eight.
As shown in Fig. 3a, more F4/80+ cells were demonstrated within crescents and around glomeruli in Cr (+) kidneys than in Cr (−) kidneys. F4/80+ cells were extensively present in the medullarly interstitium, especially in nephritic mice with crescents (Fig. 3b). Whereas F4/80+ cell numbers in crescents were not associated with interstitial F4/80+ cells, they associated positively with numbers of F4/80+ cells in PB (Table 2 and Fig. 4).
Table 2.
Association between numbers of F4/80+ cells in crescents and those in peripheral blood and interstitium†.
| F4/80+ cells | Correlation coefficients‡ | P-values |
|---|---|---|
| Peripheral blood§ | 0·595 | 0·039 |
| Interstitium¶ (cortex) | 0·305 | n.s. |
| Interstitium¶ (medulla) | 0·544 | n.s. |
Number of mice: eight.
Strength of association between F4/80+ cells within crescents and those in peripheral blood or interstitium is expressed as Pearson's correlation coefficients (r) and P-values. n.s. = not significant.
Numbers of F4/80+ cells in peripheral blood at the onset of glomerulonephritis (GN) (/μl).
Numbers of F4/80+ cells in 10 randomly selected high-power fields.
Fig. 4.
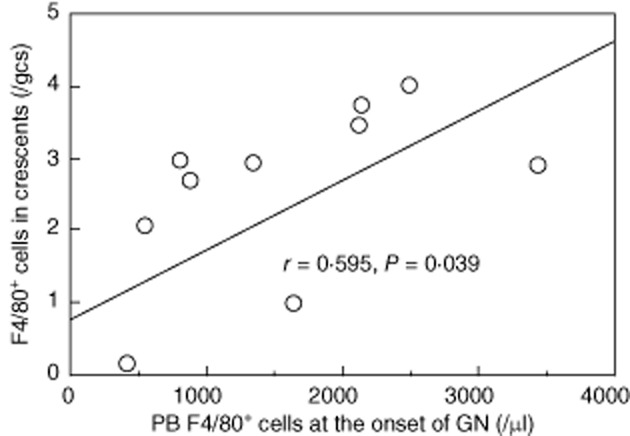
Numbers of F4/80+ cell in crescents presented positive correlation with F4/80+ cell numbers in peripheral blood at the onset of GN. Correlation coefficient and P-value derived from Fisher's transformation is presented. Number of mice: 12.
QTLs for aberrant increase of cDCs and pDCs
A genome-wide scan was performed to search non-Fas QTLs for leucocytosis using MapManager QTX software (Table 3). First, we tried to identify QTLs for increase of DCs.
Table 3.
Leucocytosis and their susceptibility non-Fas quantitative trait loci (QTLs).
| Leucocytosis | QTL | Chromosome and location† | Representative marker | Allele‡ | LOD§ (trait) | Variance¶ | Candidate gene†† |
|---|---|---|---|---|---|---|---|
| Total DCs, cDCs, granulocytes and macrophages/monocytes | Scg-1 | 1, 76·25 cM | D1MIT15 | ss | 6·5 (cDCs) | 7% | Fasl, 69·95 cM |
| Total DCs, cDCs, granulocytes and macrophages/monocytes | Scg-2 | 1, 51·5 cM | D1MIT387 | ss | 5·1 (cDCs) | 6% | Bcl2, 49·76 cM |
| pDCs and granulocytes | C17 | 17, 17·98 cM | D17MIT21 | ss | 4·5 (granulocyte) | 5% | H2, 17·98 cM |
| Tnf, 18·59 cM |
Chromosome and cM location from the Mouse Genome Database (http://www.informatics.jax.org).
Genotypes of mice: s = spontaneous crescentic glomerulonephritis-forming/Kinjoh (SCG/Kj); b = B6.
Base-10 logarithm of odds (LOD) score in quantitative trait loci (QTL) analyses by MapManager QTX in free regression model.
Percentage of trait variance calculated by MapManager QTX.
cM location from the Mouse Genome Database. DCs = dendritic cells; cDCs = conventional DCs; pDCs = plasmacytoid DCs.
There were two QTLs on chromosome 1 predisposing to the increase of whole DCs (Fig. 5a, upper row). One of them was the region between D1MIT14 and D1MIT15, and the other was the region between D1MIT134 and D1MIT91. As shown in Fig. 5b, both of these QTLs derived from SCG/Kj and were inherited in a recessive manner. We tried to identify QTLs for cDCs and pDCs. Mapping of the QTL for increased pDC presented much lower LOD values than those of total DCs in chromosome 1 (Fig. 5a, upper and mid rows). Its highest LOD score for the region around D1MIT15 was found, but it was not significant. However, analysis of the QTL for increased cDCs created higher LOD values than that of whole DCs for both regions represented by D1MIT15 and D1MIT387 (Fig. 5a, upper and lower rows). These facts indicate that QTLs for increased DCs on chromosome 1 predominantly controls the frequency of cDCs in PB. Intriguingly, these QTLs and our previously reported GN-controlling SCG/Kj loci 8, Scg-1 and Scg-2, shared their mode of inheritance and maximal likelihood location on chromosome 1 (Fig. 5 and Table 3). Therefore, we tentatively call these QTLs Scg-1 and Scg-2 (Figs 5 and 6), respectively. Both these QTLs derived from SCG/Kj and were inherited in a recessive manner (Fig. 5b,c).
Fig. 5.
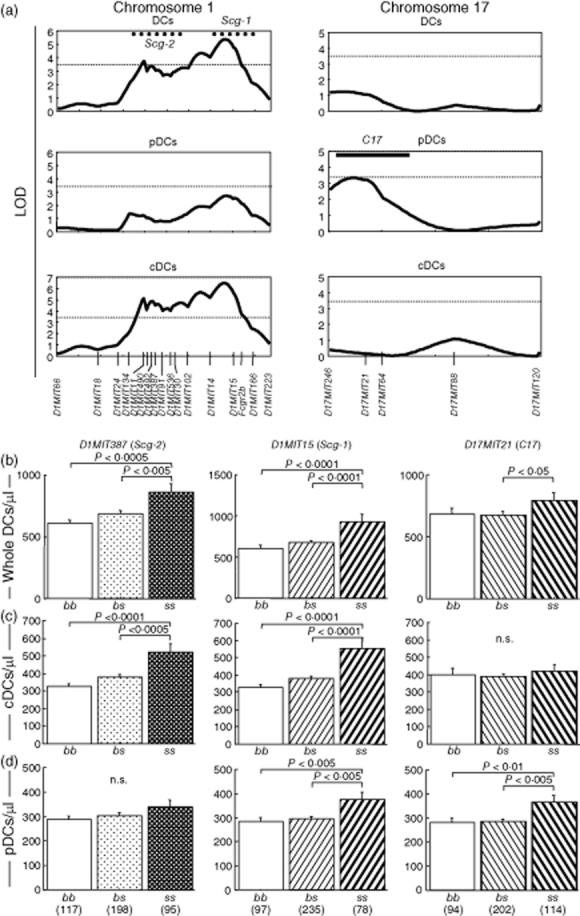
Two quantitative trait loci (QTLs) on chromosome 1 linked to increase of conventional DCs (cDCs) in peripheral blood, and one QTL on chromosome 17 linked to that of plasmacytoid DCs (pDCs). (a) Genome-wide scan using MapManager QTX identified one QTL represented by D1MIT15 and the other represented by D1MIT387 on chromosome 1, and one QTL represented by D17MIT21 on chromosome 17. 10-based logarithm of odds (LOD) scores calculated with MapManager QTX are shown. Dotted horizontal lines indicate significant LOD threshold values determined by permutation tests. Previously described spontaneous crescentic glomerulonephritis-forming/Kinjoh (SCG/Kj)-derived QTLs (Scg-1 and Scg-2) and their 1-LOD-supported intervals 8 are shown by bold dotted lines. The 1-LOD interval of C17 was determined by the LOD curve for Gr-1+ cells (see Fig. 6) and shown by bold horizontal line. (b–c) QTLs for increase of whole DCs (b), cDCs (c) and pDCs (d) in peripheral blood were inherited in a recessive manner. BSF2 mice grouped according to genotypes of D1MIT15 (Scg-1), D1MIT387 (Scg-2) and D17MIT21 (C17) were compared using analysis of variance (anova). P-values in Fisher's protected least significant difference procedure are shown; n.s. = not significant. Numbers of mice are shown in parentheses.
Fig. 6.
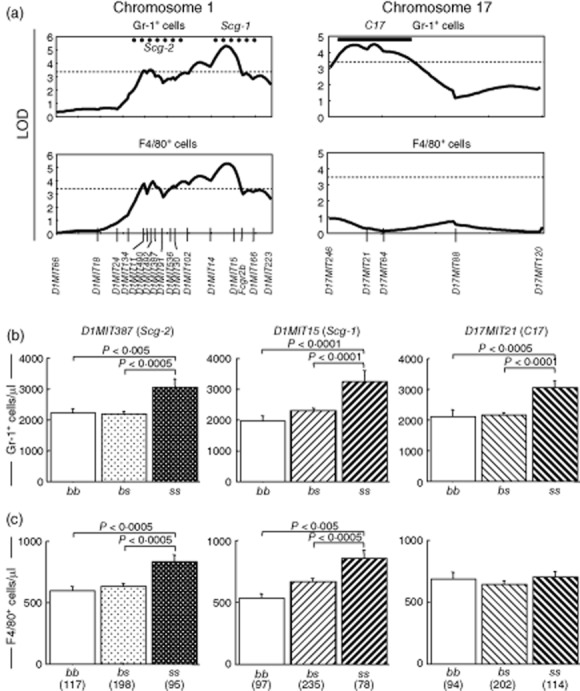
Quantitative trait loci (QTLs) represented by D1MIT15, D1MIT387 and D17MIT21 also influenced increase of granulocytes (D1MIT15, D1MIT387 and D17MIT21) and macrophages/monocytes (D1MIT15 and D1MIT387) in peripheral blood. (a) MapManager QTX scan to identify QTL(s) linked to increase of granulocytes and macrophages/monocytes. The pattern of the logarithm of odds (LOD) curve on chromosome 1 was similar to that of conventional dendritic cells (cDCs) (Fig. 5). The QTL on chromosome 17 for granulocyte increase was represented by D17MIT21, and its 1-LOD support interval defined C17. Spontaneous crescentic glomerulonephritis-forming/Kinjoh (SCG/Kj)-derived intervals (Scg-1 and Scg-2) and significant LOD threshold values determined by permutation tests are shown as Fig. 5. (b) QTLs for granulocytosis on chromosomes 1 and 17 were inherited in a recessive manner. (c) Mode of inheritance of QTLs for increased F4/80+ cells was similar to those of granulocytes and increase of cDCs. There was no QTL for monocytosis on chromosome 17. Analysis of variance (anova) was performed and P-values are shown in the same fashion as Fig. 5. Numbers of mice are shown in parentheses.
A genome-wide search identified the susceptibility locus for increased pDC on chromosome 17 (Fig. 5a, right column). It also derived from SCG/Kj and was inherited in a recessive manner (Fig. 5b,d). We tentatively denominate it C17 [Fig. 5, right column of (a), (b) and (d)].
QTLs for aberrant increase of granulocytes and macrophages/monocytes
Three loci linked to the increase of granulocytes and/or macrophages/monocytes. Two QTLs were on chromosome 1; 1-log support interval and representative markers of these QTLs resembled those of Scg-1/D1MIT15 and Scg-2/D1MIT387. The corresponding QTLs exhibited significant linkage to the granulocytosis and the increase of macrophages/monocytes (Fig. 6a, left column). These QTLs derived from SCG/Kj and were inherited in a recessive manner (Fig. 6b,c).
A QTL linked to the granulocytosis was segregated around D17MIT21. It may correspond to C17. This QTL inherited in a recessive mode (Fig. 6b). D17MIT21 did not exert any effect on the macrophages/monocytes (Fig. 6c).
The influence of Fas gene and epistatic interactions between pairs of Fas and non-Fas QTLs
In a previous study, we observed the Fas is the major gene controlling disease phenotypes 8. In fact, this study also revealed a significant difference between the frequency of Fas genotypes in healthy mice (Fas+/+, 63; Fas+/lpr, 151, Faslpr/lpr, 15) and that in mice with GN (Fas+/+, 18; Fas+/lpr, 67; Faslpr/lpr, 69; χ2 = 80·5, P < 0·0001) in BSF2 mice. We attempted to evaluate the effect of Fas mutation on increase of cDCs, pDCs, granulocytes and macrophages/monocytes. As shown in Fig. 7, all these four cells were increased significantly in mice with Faslpr/lpr more than in mice with other genotypes. Because Fas+/lpr heterologous mice did not exhibit more severe leucocytosis than Fas+/+ mice, the effect of lpr mutation is inherited in a recessive manner.
Fig. 7.
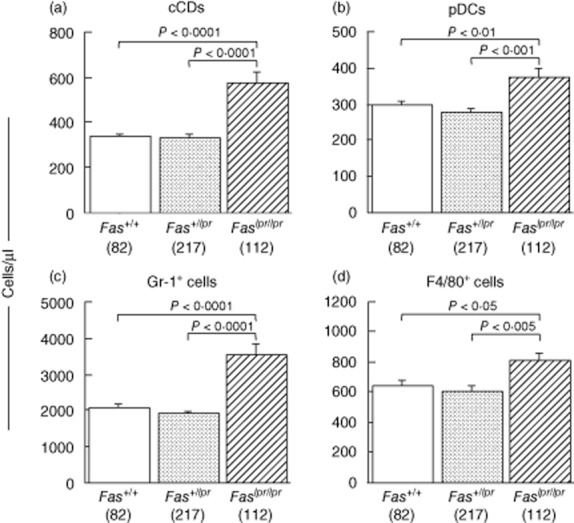
Effects of Fas genotypes on leucocytosis in BSF2 mice at 12 weeks of age. Numbers of conventional dendritic cells (cDCs) (a), plasmacytoid DCs (pDCs) (b), granulocytes (c) and macrophages/monocytes (d) in peripheral blood (PB) are shown. All these four cells are increased significantly in mice with the Faslpr/lpr genotype than in those with Fas+/+ or Fas+/lpr. Mean values ± standard error of the mean are shown are shown. P-values were determined with analysis of variance (anova) and Fisher's protected least significant difference procedure. Numbers of mice are shown in parentheses.
To evaluate the possibility of epistatic interactions between pairs of Fas, D1MIT15, D1MIT387 and D17MIT21, a systematic pairwise genome scan was performed using MapManager QTX (Table 4). Permutation tests (500 times) showed that LOD scores needed for suggestive and significant interaction were as follows: cDCs, 8·1 and 24·9; pDCs, 7·8 and 25·8; granulocytes, 8·2 and 28·4; and macrophages/monocytes, 6·9 and 10·3. Significant interactions between Fas and D1MIT15 were detected for cDCs, granulocytes and macrophages/monocytes (Table 4). Interactions between Fas and D1MIT15 for pDCs and interactions between Fas and D1MIT387 were all suggestive. We found no suggestive or significant interaction between D1MIT15 and D1MIT387 for leucocytosis. Interactions between Fas and three non-Fas loci are shown in Fig. 8. It is suggested that there are synergistic epistatic interactions between Fas and D1MIT15 and between Fas and D1MIT387 (Fig. 8). Interactions between pairs of non-Fas loci are shown in Fig. 9. Epistatic effects between D1MIT15 and D17MIT21 were suggestive to significant (Table 4). Figure 9, mid-column, suggests that there are antagonistic epistatic interactions between D1MIT15 and D17MIT21.
Table 4.
Interacting quantitative trait loci (QTLs) for leucocytosis†
| Leucocytes | Locus 1‡ | Locus 2‡ | LOD total§ | LOD IX¶ | LOD 1†† | LOD 2†† |
|---|---|---|---|---|---|---|
| cDCs | D1MIT387 | D17MIT21 | 8·8 | 3·8 | 4·8 | 0·2 |
| D1MIT387 | Fas | 24·5 | 8·5 | 4·8 | 10·8 | |
| D1MIT15 | D17MIT21 | 9·4 | 3·5 | 5·6 | 0·2 | |
| D1MIT15 | Fas | 28·8 | 11·0 | 5·6 | 10·8 | |
| pDCs | D1MIT387 | Fas | 8·0 | 3·0 | 1·0 | 4·0 |
| D1MIT15 | D17MIT21 | 10·4 | 4·5 | 2·5 | 3·2 | |
| D1MIT15 | Fas | 11·2 | 4·4 | 2·5 | 4·0 | |
| Granulocytes | D1MIT387 | Fas | 20·7 | 4·0 | 3·4 | 13·5 |
| D1MIT15 | D17MIT21 | 13·9 | 4·7 | 4·8 | 4·2 | |
| D1MIT15 | Fas | 28·9 | 9·2 | 4·8 | 13·5 | |
| Macrophages/monocytes | D1MIT387 | D17MIT21 | 7·9 | 3·9 | 3·7 | 0·3 |
| D1MIT387 | Fas | 9·7 | 2·9 | 3·7 | 3·2 | |
| D1MIT15 | D17MIT21 | 12·1 | 6·7 | 4·9 | 0·3 | |
| D1MIT15 | Fas | 14·7 | 6·0 | 4·9 | 3·2 |
Summary of interacting QTLs for leucocytosis with suggestive to significant statistics calculated by 500 permunation tests with MapManager QTX.
Interacting pairs of QTLs.
Combined likelihood of odds (LOD) for association.
LOD for interaction.
LOD of main effects of loci 1 and 2. LOD = logarithm of odds; cDCs = conventional dendritic cells; pDCs = plasmacytoid DCs.
Fig. 8.
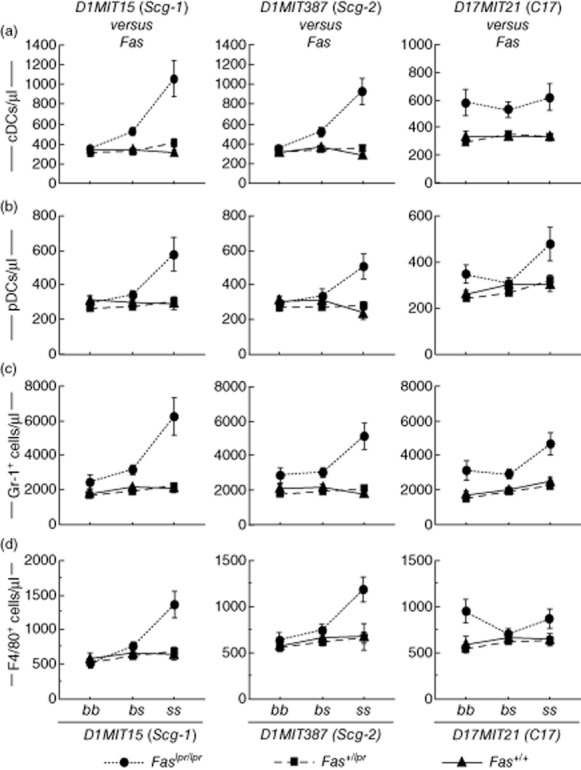
Characterization of interactions between Fas and three non-Fas quantitative trait loci (QTLs). BSF2 mice were classified by Fas genotypes and further classified by genotypes of any one from non-Fas QTLs. Mean values ± standard error of the mean are shown are shown.
Fig. 9.
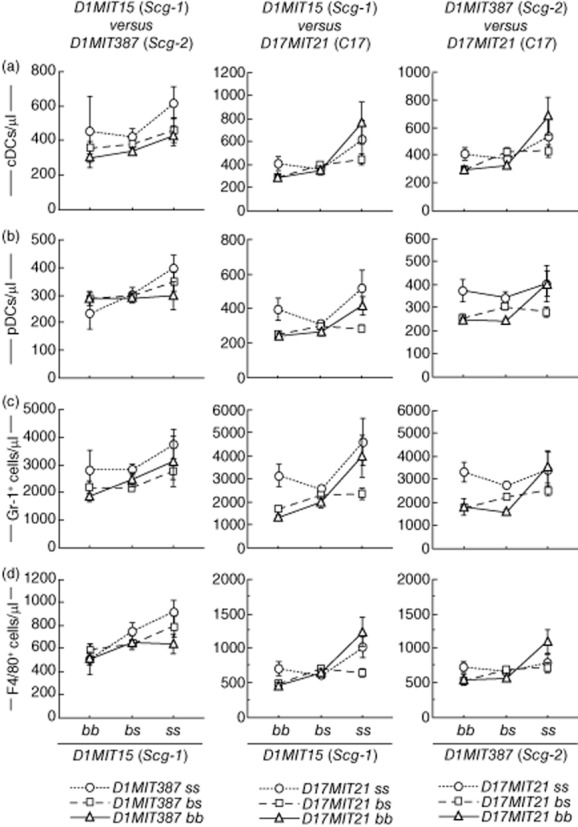
Characterization of interactions between pairs from three non-Fas quantitative trait loci (QTLs). BSF2 mice were classified by genotypes of two QTLs from three QTLs. Mean values ± standard error of the mean are shown.
Discussion
In this study, we demonstrated the following: (i) leucocyte lineages correlated with GN, crescent formation and vasculitis; (ii) distribution of F4/80+ and Gr-1+ cells in glomerulonephritic kidneys and their origins; and (iii) mapping of three QTLs for GN-correlated leucocytosis as well as their epistatic interaction.
Leucocytes related to AAV have been studied extensively in human and rodents. T cells 14, granulocytes 6,15, macrophages 16 and DCs 17 are reported to be involved in AAV or CrGN. These reports are consistent with our present data.
DCs have pivotal roles in immune system, and recent studies have revealed that DCs are involved in renal disease, GN 18, vasculitis 17 and ischaemic reperfusion injury 19. Correlation between DC increase and GN is partially consistent with data from Krueger et al. 20, in which blood-borne DCs are suggested to enter the inflamed kidney. Moreover, DCs are activated and induced by neutrophil extracellular traps to produce ANCA and to cause GN 17. Amelioration of CrGN by DC-specific suppressive drugs is more evidence for the crucial role of DCs in CrGN 21. The characterization of GN-correlated DCs in our model needs further study.
Macrophages/monocytes are involved in CrGN and AAV, and they are important as crescent-forming cells 16. Renal F4/80+ cells are distributed in the medullary interstitium of normal kidneys and also in the peri-glomerular area in nephritic kidneys 20. It was also shown that F4/80+ cells are prominent in the interstitium and peri-glomerular area in GN by anti-glomerular basement membrane (GBM) antibody 22. Interestingly, in these GN models, F4/80+ cells are not observed in crescents 20,22. In our spontaneous CrGN model, F4/80+ cells were present in crescent as well as in the interstitium and peri-glomerular areas.
Numbers of F4/80+ cells in crescents were correlated significantly with F4/80+ cell numbers in PB, but not with those in the interstitium (Table 2 and Fig. 4). Inflammatory monocytes are known to be released from bone marrow in response to the signals of GN and they traffic to the nephritic kidney 23. However, Huang et al. reported that F4/80+ ‘resident macrophages’ increased in the interstitium and peri-glomerular area in anti-GBM GN 24. Resident macrophages play an important role in tissue repair and are characterized as F4/80highGr-1low, whereas inflammatory/exudative macrophages are characterized as F4/80lowGr-1int 24. In our model, F4/80+ cells in crescents were F4/80low compared with those in the peri-glomerular area and the interstitium (Fig. 2), showing that F4/80+ cells in crescents are inflammatory/exudative macrophages. Taken together, we consider that F4/80+ cells in crescents are recruited by bloodstream due to the nephritic signals, and their presence is not because of the local proliferation in the kidney.
We identified Fas as QTL with profound effect on leucocytosis. We also identified two QTLs (both on chromosome 1, Scg-1 and Scg-2) for increase of cDCs, granulocytes and monocytes/macrophages, and one QTL (on chromosome 17, C17) for increased pDCs and granulocytes.
Previous reports have demonstrated loci related to autoimmunity, Scg-1 8, Sle1 25, Bxs3 26 and Nba2 27 on chromosome 1 adjacent to Scg-1/D1MIT15. These loci are associated with the production of autoantibodies, GN, splenomegaly 8,25,27, vasculitis 8 and loss of tolerance via T cell abnormalities 28,29. We note that the peak of the LOD curve for cDCs, as well as the 1-LOD support interval of Scg-1, is between D1MIT14 and D1MIT15 (Table 3). Fasl, the structural gene of the Fas ligand, is a positional candidate gene. Apoptosis of DCs can occur during DC–T cell cognate interaction via the Fas–Fasl signal 30. Fasl is an attractive candidate in light of the report by Stranges et al. that Fas-dependent elimination of DCs was a major regulatory mechanism to inhibit autoimmune responses, and DC-specific deletion of Fas was sufficient to cause systemic autoimmunity 31.
On chromosome 1 adjacent to Scg-2/D1MIT387 are previously defined loci, Scg-2/Man-1 8, Sbw1 32 and Bxs2 26. Scg-2/D1MIT387 is associated with the hyperproduction of IgG and IgG-class autoantibodies including MPO-ANCA 8,32, GN 8,26 and splenomegaly 8,32. One possible candidate gene for Scg-2/D1MIT387 is Bcl2. Bcl2 is the gene encoding the anti-apoptotic protein Bcl-2. Bcl-2 controls not only the lifespan of DCs but also T cell priming by DCs 33. Moreover, Izawa et al. reported recently that bone marrow-derived DCs in MRLlpr mice could survive much longer than DCs from normal mice through up-regulation of Bcl-2, and such accumulation of mature DCs was one element of autoimmunity 34. Bcl-2 over-expression also inhibits apoptosis and prolongs survival of myeloid cell line 35. Bcl-2 contributes to the development of resistance to apoptosis in monocytes 36,37. Bcl-2 can provide survival signals and differentiation of autoreactive B cells in the murine lupus-like disease model 38.
Therefore, Bcl-2 is a tempting candidate gene for Scg-2/D1MIT387, as it may explain a variety of traits, such as inhibited apoptosis of leucocytes, production of IgG-class autoantibodies and development of GN.
C17 is represented by D17MIT21, which is adjacent to H2 [murine major histocompatibility complex (MHC)-I and -II] and Tnf (Table 3). A recent study revealed that stimulation by Toll-like receptors licences pDCs to cross-present exogenous antigens by MHC-I, consequently generating effector T cells 39. With regard to granulocytes, Culshaw et al. reported that murine neutrophils could also present antigens to T cells in a MHC-I- and -II-dependent manner 40. These interactions between pDCs or granulocytes and T cells may also stimulate pDCs or granulocytes. Tnf, the gene encoding tumour necrosis factor alpha, is another attractive candidate gene for proliferation of granulocytes 41.
This study could not determine whether independent candidate genes for leucocytosis were in these QTLs, or if candidate genes only controlled tissue inflammation and leucocytosis was caused secondarily. The latter hypothesis is plausible, because it can explain why QTLs on chromosome 1 shared chromosomal location and the mode of inheritance. To clarify the roles of each QTL, the interval congenic mice for each QTL should be established and back-crossing is now ongoing in our group.
The elucidation of disease-susceptibility genes and pathogenic leucocytes in the murine model provides important information for the prediction of genes and therapeutic targets in human disease. Further characterization of the disease susceptibility loci in this work will provide clues in the pathogenesis and development of new therapies for human vasculitis.
Acknowledgments
This work was supported in part by a Grant for the Special Study Group on Progressive Glomerular Disease from the Ministry of Health, Labor and Welfare of Japan. We thank Dr Kyogoku for the use of the SCG/Kj mice and Dr X. Cine for technical assistance. We also thank Dr Akira Ishikawa of Nagoya University for technical assistance.
Disclosure
None to declare.
References
- 1.Lyons PA, Rayner TF, Trivedi S, et al. Genetically distinct subsets within ANCA-associated vasculitis. N Engl J Med. 2012;367:214–223. doi: 10.1056/NEJMoa1108735. [DOI] [PMC free article] [PubMed] [Google Scholar]
- 2.Xiao H, Ciavatta D, Aylor DL, et al. Genetically determined severity of anti-myeloperoxidase glomerulonephritis. Am J Pathol. 2013;182:1219–1226. doi: 10.1016/j.ajpath.2012.12.006. [DOI] [PMC free article] [PubMed] [Google Scholar]
- 3.Jennette JC, Falk RJ, Hu P, Xiao H. Pathogenesis of antineutrophil cytoplasmic autoantibody-associated small-vessel vasculitis. Annu Rev Pathol. 2013;8:139–160. doi: 10.1146/annurev-pathol-011811-132453. [DOI] [PMC free article] [PubMed] [Google Scholar]
- 4.Rimbert M, Hamidou M, Braudeau C, et al. Decreased numbers of blood dendritic cells and defective function of regulatory T cells in antineutrophil cytoplasmic antibody-associated vasculitis. PLOS ONE. 2011;6:e18734. doi: 10.1371/journal.pone.0018734. [DOI] [PMC free article] [PubMed] [Google Scholar]
- 5.Kinjoh K, Kyogoku M, Good RA. Genetic selection for crescent formation yields mouse strain with rapidly progressive glomerulonephritis and small vessel vasculitis. Proc Natl Acad Sci USA. 1993;90:3413–3417. doi: 10.1073/pnas.90.8.3413. [DOI] [PMC free article] [PubMed] [Google Scholar]
- 6.Ishida-Okawara A, Nagi-Miura N, Oharaseki T, et al. Neutrophil activation and arteritis induced by C. albicans water-soluble mannoprotein–beta–glucan complex (CAWS) Exp Mol Pathol. 2007;82:220–226. doi: 10.1016/j.yexmp.2006.05.006. [DOI] [PMC free article] [PubMed] [Google Scholar]
- 7.Nagao T, Kusunoki R, Iwamura C, et al. Correlation of interleukin-6 and monocyte chemotactic protein-1 levels with the crescent formation and myeloperoxidase-specific anti-neutrophil cytoplasmic antibody titer in SCG/Kj mice by treatment with anti-interleukin-6 receptor antibody or Mizoribine. Microbiol Immunol. 2013;57:640–650. doi: 10.1111/1348-0421.12080. [DOI] [PubMed] [Google Scholar]
- 8.Hamano Y, Tsukamoto K, Abe M, et al. Genetic dissection of vasculitis, myeloperoxidase-specific antineutrophil cytoplasmic autoantibody production, and related traits in spontaneous crescentic glomerulonephritis-forming/Kinjoh mice. J Immunol. 2006;176:3662–3673. doi: 10.4049/jimmunol.176.6.3662. [DOI] [PubMed] [Google Scholar]
- 9.Haller H, Eichhorn J, Pieper K, Gobel U, Luft FC. Circulating leukocyte integrin expression in Wegener's granulomatosis. J Am Soc Nephrol. 1996;7:40–48. doi: 10.1681/ASN.V7140. [DOI] [PubMed] [Google Scholar]
- 10.Knight JG, Adams DD, Purves HD. The genetic contribution of the NZB mouse to the renal disease of the NZB × NZW hybrid. Clin Exp Immunol. 1977;28:352–358. [PMC free article] [PubMed] [Google Scholar]
- 11.Kanno K, Okada T, Abe M, Hirose S, Shirai T. Differential sensitivity to interleukins of CD5+ and CD5− anti-DNA antibody-producing B cells in murine lupus. Autoimmunity. 1993;14:205–214. doi: 10.3109/08916939309077367. [DOI] [PubMed] [Google Scholar]
- 12.Churchill GA, Doerge RW. Empirical threshold values for quantitative trait mapping. Genetics. 1994;138:963–971. doi: 10.1093/genetics/138.3.963. [DOI] [PMC free article] [PubMed] [Google Scholar]
- 13.McKnight AJ, Macfarlane AJ, Dri P, Turley L, Willis AC, Gordon S. Molecular cloning of F4/80, a murine macrophage-restricted cell surface glycoprotein with homology to the G-protein-linked transmembrane 7 hormone receptor family. J Biol Chem. 1996;271:486–489. doi: 10.1074/jbc.271.1.486. [DOI] [PubMed] [Google Scholar]
- 14.Free ME, Bunch DO, McGregor J, et al. ANCA-associated vasculitis patients have defective Treg function exacerbated by presence of a suppression-resistant effector population. Arthritis Rheum. 2013;65:1922–1933. doi: 10.1002/art.37959. [DOI] [PMC free article] [PubMed] [Google Scholar]
- 15.Weidner S, Carl M, Riess R, Rupprecht HD. Histologic analysis of renal leukocyte infiltration in antineutrophil cytoplasmic antibody-associated vasculitis: importance of monocyte and neutrophil infiltration in tissue damage. Arthritis Rheum. 2004;50:3651–3657. doi: 10.1002/art.20607. [DOI] [PubMed] [Google Scholar]
- 16.Ferrario F, Vanzati A, Pagni F. Pathology of ANCA-associated vasculitis. Clin Exp Nephrol. 2013;17:652–658. doi: 10.1007/s10157-012-0701-8. [DOI] [PubMed] [Google Scholar]
- 17.Sangaletti S, Tripodo C, Chiodoni C, et al. Neutrophil extracellular traps mediate transfer of cytoplasmic neutrophil antigens to myeloid dendritic cells toward ANCA induction and associated autoimmunity. Blood. 2012;120:3007–3018. doi: 10.1182/blood-2012-03-416156. [DOI] [PubMed] [Google Scholar]
- 18.Kurts C, Heymann F, Lukacs-Kornek V, Boor P, Floege J. Role of T cells and dendritic cells in glomerular immunopathology. Semin Immunopathol. 2007;29:317–335. doi: 10.1007/s00281-007-0096-x. [DOI] [PubMed] [Google Scholar]
- 19.John R, Nelson PJ. Dendritic cells in the kidney. J Am Soc Nephrol. 2007;18:2628–2635. doi: 10.1681/ASN.2007030273. [DOI] [PubMed] [Google Scholar]
- 20.Kruger T, Benke D, Eitner F, et al. Identification and functional characterization of dendritic cells in the healthy murine kidney and in experimental glomerulonephritis. J Am Soc Nephrol. 2004;15:613–621. doi: 10.1097/01.asn.0000114553.36258.91. [DOI] [PubMed] [Google Scholar]
- 21.Saiga K, Tokunaka K, Ichimura E, et al. NK026680, a novel suppressant of dendritic cell function, prevents the development of rapidly progressive glomerulonephritis and perinuclear antineutrophil cytoplasmic antibody in SCG/Kj mice. Arthritis Rheum. 2006;54:3707–3715. doi: 10.1002/art.22187. [DOI] [PubMed] [Google Scholar]
- 22.Robertson H, Wheeler J, Morley AR. Anti-glomerular basement membrane glomerulonephritis in the mouse: the role of macrophages. Int J Exp Pathol. 1995;76:157–162. [PMC free article] [PubMed] [Google Scholar]
- 23.Lin SL, Castano AP, Nowlin BT, Lupher ML, Jr, Duffield JS. Bone marrow Ly6Chigh monocytes are selectively recruited to injured kidney and differentiate into functionally distinct populations. J Immunol. 2009;183:6733–6743. doi: 10.4049/jimmunol.0901473. [DOI] [PubMed] [Google Scholar]
- 24.Huang L, Garcia G, Lou Y, et al. Anti-inflammatory and renal protective actions of stanniocalcin-1 in a model of anti-glomerular basement membrane glomerulonephritis. Am J Pathol. 2009;174:1368–1378. doi: 10.2353/ajpath.2009.080476. [DOI] [PMC free article] [PubMed] [Google Scholar]
- 25.Morel L, Rudofsky UH, Longmate JA, Schiffenbauer J, Wakeland EK. Polygenic control of susceptibility to murine systemic lupus erythematosus. Immunity. 1994;1:219–229. doi: 10.1016/1074-7613(94)90100-7. [DOI] [PubMed] [Google Scholar]
- 26.Haywood ME, Hogarth MB, Slingsby JH, et al. Identification of intervals on chromosomes 1, 3, and 13 linked to the development of lupus in BXSB mice. Arthritis Rheum. 2000;43:349–355. doi: 10.1002/1529-0131(200002)43:2<349::AID-ANR14>3.0.CO;2-M. [DOI] [PubMed] [Google Scholar]
- 27.Vyse TJ, Halterman RK, Rozzo SJ, Izui S, Kotzin BL. Control of separate pathogenic autoantibody responses marks MHC gene contributions to murine lupus. Proc Natl Acad Sci USA. 1999;96:8098–8103. doi: 10.1073/pnas.96.14.8098. [DOI] [PMC free article] [PubMed] [Google Scholar]
- 28.Morel L, Croker BP, Blenman KR, et al. Genetic reconstitution of systemic lupus erythematosus immunopathology with polycongenic murine strains. Proc Natl Acad Sci USA. 2000;97:6670–6675. doi: 10.1073/pnas.97.12.6670. [DOI] [PMC free article] [PubMed] [Google Scholar]
- 29.Chen Y, Cuda C, Morel L. Genetic determination of T cell help in loss of tolerance to nuclear antigens. J Immunol. 2005;174:7692–7702. doi: 10.4049/jimmunol.174.12.7692. [DOI] [PubMed] [Google Scholar]
- 30.Rescigno M, Piguet V, Valzasina B, et al. Fas engagement induces the maturation of dendritic cells (DCs), the release of interleukin (IL)-1beta, and the production of interferon gamma in the absence of IL-12 during DC-T cell cognate interaction: a new role for Fas ligand in inflammatory responses. J Exp Med. 2000;192:1661–1668. doi: 10.1084/jem.192.11.1661. [DOI] [PMC free article] [PubMed] [Google Scholar]
- 31.Stranges PB, Watson J, Cooper CJ, et al. Elimination of antigen-presenting cells and autoreactive T cells by Fas contributes to prevention of autoimmunity. Immunity. 2007;26:629–641. doi: 10.1016/j.immuni.2007.03.016. [DOI] [PMC free article] [PubMed] [Google Scholar]
- 32.Kono DH, Burlingame RW, Owens DG, et al. Lupus susceptibility loci in New Zealand mice. Proc Natl Acad Sci USA. 1994;91:10168–10172. doi: 10.1073/pnas.91.21.10168. [DOI] [PMC free article] [PubMed] [Google Scholar]
- 33.Hou WS, Van Parijs L. A Bcl-2-dependent molecular timer regulates the lifespan and immunogenicity of dendritic cells. Nat Immunol. 2004;5:583–589. doi: 10.1038/ni1071. [DOI] [PubMed] [Google Scholar]
- 34.Izawa T, Ishimaru N, Moriyama K, Kohashi M, Arakaki R, Hayashi Y. Crosstalk between RANKL and Fas signaling in dendritic cells controls immune tolerance. Blood. 2007;110:242–250. doi: 10.1182/blood-2006-11-059980. [DOI] [PubMed] [Google Scholar]
- 35.Naumovski L, Cleary ML. Bcl2 inhibits apoptosis associated with terminal differentiation of HL-60 myeloid leukemia cells. Blood. 1994;83:2261–2267. [PubMed] [Google Scholar]
- 36.Iwai K, Miyawaki T, Takizawa T, et al. Differential expression of Bcl-2 and susceptibility to anti-Fas-mediated cell death in peripheral blood lymphocytes, monocytes, and neutrophils. Blood. 1994;84:1201–1208. [PubMed] [Google Scholar]
- 37.Busca A, Saxena M, Kumar A. Critical role for antiapoptotic Bcl-xL and Mcl-1 in human macrophage survival and cellular IAP1/2 (cIAP1/2) in resistance to HIV-Vpr-induced apoptosis. J Biol Chem. 2012;287:15118–15133. doi: 10.1074/jbc.M111.312660. [DOI] [PMC free article] [PubMed] [Google Scholar]
- 38.Lopez-Hoyos M, Carrio R, Merino R, et al. Constitutive expression of Bcl-2 in B cells causes a lethal form of lupuslike autoimmune disease after induction of neonatal tolerance to H-2b alloantigens. J Exp Med. 1996;183:2523–2531. doi: 10.1084/jem.183.6.2523. [DOI] [PMC free article] [PubMed] [Google Scholar]
- 39.Mouries J, Moron G, Schlecht G, Escriou N, Dadaglio G, Leclerc C. Plasmacytoid dendritic cells efficiently cross-prime naive T cells in vivo after TLR activation. Blood. 2008;112:3713–3722. doi: 10.1182/blood-2008-03-146290. [DOI] [PMC free article] [PubMed] [Google Scholar]
- 40.Culshaw S, Millington OR, Brewer JM, McInnes IB. Murine neutrophils present Class II restricted antigen. Immunol Lett. 2008;118:49–54. doi: 10.1016/j.imlet.2008.02.008. [DOI] [PMC free article] [PubMed] [Google Scholar]
- 41.Takashima K, Tateda K, Matsumoto T, Iizawa Y, Nakao M, Yamaguchi K. Role of tumor necrosis factor alpha in pathogenesis of pneumococcal pneumonia in mice. Infect Immun. 1997;65:257–260. doi: 10.1128/iai.65.1.257-260.1997. [DOI] [PMC free article] [PubMed] [Google Scholar]


