

Abstract
Context
The Affordable Care Act provides new Medicaid coverage to an estimated 12 million low-income adults. Barriers to access or quality could hamper the program's success. One of these barriers might be the stigma associated with Medicaid or poverty.
Methods
Our mixed-methods study involved 574 low-income adults and included data from an in-person survey and follow-up interviews. Our analysis of the interviews showed that many participants who were on Medicaid or uninsured described a perception or fear of being treated poorly in the health care setting. We defined this experience as stigma and merged our qualitative interviews coded for stigma with our quantitative survey data to see whether stigma was related to other sociodemographic characteristics. We also examined whether stigma was associated with access to care, quality of care, and self-reported health.
Findings
We were unable to identify other sociodemographic characteristics associated with stigma in this low-income sample. The qualitative interviews suggested that stigma was most often the result of a provider-patient interaction that felt demeaning, rather than an internalized sense of shame related to receiving public insurance or charity care. An experience of stigma was associated with unmet health needs, poorer perceptions of quality of care, and worse health across several self-reported measures.
Conclusions
Because a stigmatizing experience in the health system might interfere with the delivery of high-quality care to new Medicaid enrollees, further research and policy interventions that target stigma are warranted.
Keywords: health care, user's experiences, health insurance, poverty, stigma
In 2014, the Patient Protection and Affordable Care Act (ACA) offered states the option to expand Medicaid to millions of low-income, uninsured citizens, although several states had already implemented some kind of Medicaid expansion program. These “early-expansion” states served as test cases that offer lessons about how low-income populations interact with the health care system once they gain access to coverage. A recent evaluation of an early-expansion state found that insurance coverage removes some, but not all, barriers to quality care.1
Oregon was a special test case because the state used a lottery system to determine who would be allowed to apply for coverage under the state's early Medicaid expansion program. A broad mixed-methods research effort took advantage of this randomization mechanism to evaluate the causal effects of Medicaid on health care use, health outcomes, and financial well-being.2
To provide context and richness to the quantitative data collected in Oregon—which included surveys, biomarker data, and administrative data—we conducted hundreds of qualitative interviews with survey respondents. Interviews covered the attitudes, behaviors, and care experiences of a low-income population similar to those eligible for health coverage under an ACA Medicaid expansion. The interview data reveal an important story that would have been difficult to find from numbers alone: a story about what it means to be poor, what being poor means when you go to the doctor, and how difficult it can be to engage with the health care system when you believe that the system might not want much to do with you.
Background: Why Stigma Matters
The overarching goal of the ACA's Medicaid expansion is to improve the health security of low-income adults by providing access to affordable, high-quality health care.3 Before Medicaid was expanded, cost often prevented the low-income uninsured from accessing care. Now, however, this financial barrier has been removed for many, so the use of health services is expected to increase.4–6
Removing the financial barriers to care may not guarantee greater access or better health outcomes for all people, however. Despite the medical advancements and incremental increases of public health coverage in the United States, wide disparities in health care access and outcomes persist. Researchers have long documented nonfinancial barriers to health, and models of access to care have shifted from a focus on affordability to a framework that accounts for the dynamic ways that individuals interact with providers and the health care system.7 Thomas and Penchansky, for instance, proposed the concept of acceptability as an additional dimension of access, which captures the relationship between the preferences of both patients and providers. According to this model, a provider's refusal to accept a form of insurance is an acceptability barrier, but so are the patients’ and providers’ perceptions of each other in regard to race, class, age, or other sociodemographic characteristics.8
Other models demonstrate that barriers to access extend beyond the first health care visit. Andersen's behavioral framework, for example, found consumer satisfaction to be a factor in determining whether or not an individual will continue to seek necessary care.9 Eisenberg and Power identified 6 other “points of vulnerability” that policymakers should consider if the goal of coverage is to ensure that Americans receive high-quality health care. According to their model, just as voltage is lost when electric currents encounter resistance, so the potential to receive high-quality care is diminished when patients encounter structural resistance. After access to coverage, other points of vulnerability are take-up of available coverage, having a good network of providers and a range of covered services, being able to make informed choices, obtaining a regular source of primary care, having access to referrals when needed, and receiving a good quality of care.10 Eisenberg and Power's model has been useful in evaluating the expansion of public insurance to children.11
With the expansion of Medicaid, a vulnerability for the newly eligible may be attitudes toward and perceptions of Medicaid. For example, a recent study suggests that the lower take-up of Medicaid in conservative states may be related to a high prevalence of negative opinions of public insurance programs.12 Another vulnerability may be the limited supply of willing primary care providers to serve Medicaid beneficiaries. A nationally representative survey of office-based physicians in 2011 found that one-third were not accepting new Medicaid patients. Although higher payments for primary care services under the ACA will likely convince more providers to accept Medicaid recipients, other features of Medicaid programs still may deter some clinicians from accepting newly covered patients.13 That is, some providers are reluctant to serve Medicaid patients, who often face challenging socioeconomic factors that adversely affect their health and access to care, thus making it difficult to serve them.14 In addition, despite limited supportive evidence, some providers believe that Medicaid patients are more litigious.15
A provider's beliefs about the ACA, people in poverty, or those who receive public coverage will influence access through their decision to accept or not accept Medicaid insurance. These attitudes may also influence quality through the provider's ability to engage Medicaid patients, to communicate with them effectively, or to encourage their compliance with follow-up or self-care instructions.
Sociologists who study income inequality have well documented a stigma associated with poverty, and some have explored how the stigmatization of poverty affects the delivery of health care.16,17 Experts differentiate between “internalized” and “experienced” stigma, which also is called “perceived discrimination.”18 “Internalized” stigma is an intrapersonal phenomenon, meaning that individuals may carry it into the health care setting when they apply negative stereotypes of a stigmatized identity to themselves.19 People feel “experienced” stigma when they believe that they have been discriminated against, based on stereotypes, during an interpersonal interaction.20 Studies have identified multiple circumstances in health care in which patients reported discrimination and stigma related to race,21,22 or specific health conditions such as HIV23 or mental illness.24 A recent study of individuals with chronic illness found that their perception of stigmatization during a health care encounter led to less use of health care services.25
This article explores stigma in the health care setting for low-income patients, many of whom were newly insured by Medicaid. Our data offer a unique perspective on a population similar to the millions of individuals who will be enrolling in Medicaid in the coming years. These patients’ experience of stigma emerged as a theme in the qualitative interviews that we conducted as a follow-up to a structured, in-person survey. The purpose of this research was to examine whether the experience of stigmatization was associated with identifiable socioeconomic or systemic characteristics and additionally to see if the experience of stigma was related to outcomes such as health care access, quality, and self-reported health. To assess these relationships, we used both qualitative and quantitative methods.
Methods
Study Context
In a limited 2008 expansion, the state of Oregon created 10,000 additional spots in its Medicaid program, the Oregon Health Plan (OHP). Those who wanted to apply put their name on a list, from which they were chosen by lottery for the opportunity to apply for OHP. Our study sample was drawn from this registration list and was composed of low-income, nonelderly adults in the Portland, Oregon, area. From September 2009 through December 2010, we collected in-person survey data from 12,229 individuals, about half of whom “won” the ability to apply for coverage. The survey covered access, use of care, personal finances, and perceived health. Details about the parent study population, survey methodology, and findings are published elsewhere.5 The respondents in this quantitative survey formed the sample population for our qualitative follow-up interviews.
Focus Groups
In September 2010, we convened 2 focus groups of study participants from our in-person survey. One group consisted of those who did not win the lottery, and the other consisted of those who had won the lottery and received coverage. These focus groups offered a broad overview of the experiences of the insured and the uninsured that would inform our future qualitative data collection. The uninsured group discussed how they avoided seeking health care and described the frustrating encounters they had had with the system when they did seek care. Despite having insurance coverage, the insured group also reported barriers to access. But they also felt a sense of security as a result of having insurance and mentioned notable improvements in their health and well-being. We analyzed the narrative data from the focus groups to use as a reference in designing tools for individual interviews and our initial coding dictionary.
Qualitative Interviews
In 2011, we drew a random subsample of 790 participants from an in-person survey to recruit for open-ended, face-to-face qualitative interviews. Our large sample size reflected our plan to gather detailed information from our subgroups of interest.
Recruitment and Sample
We conducted the interviews between May and September 2011. We recruited the participants by phone, gave them the choice to be interviewed in their homes or at a clinic, and offered them $75 for their time. In total, 574 of the 790 eligible individuals completed in-person interviews. By the end of the study, we were unable to schedule an appointment with 192 people; 10 people refused to participate; and 14 were ineligible because they had died, had moved out of the state, or did not speak English or Spanish. Our adjusted response rate was 74%. Table 1 shows the characteristics of the survey population from which the qualitative sample was drawn, the qualitative sample population, and the respondents in the qualitative interviews. We used information from the in-person survey to compare qualitative respondents and nonrespondents and found that whites, lower-income individuals, and high-school graduates with some college were more likely to participate in the qualitative interviews.
Table 1.
Respondents' and Sample Characteristics
| In-Person Respondents | Qualitative Sample | Qualitative Respondents | p-Value | |
|---|---|---|---|---|
| Number | 12,229 | 790 | 574 | |
| Race | 0.015 | |||
| White, non-Hispanic | 68.8% | 68.6% | 71% | |
| Gender | 0.830 | |||
| Female | 56.5% | 56% | 55.8% | |
| Education | 0.028 | |||
| Less than high school | 20.5% | 21.3% | 19.2% | |
| High school diploma | 45.4% | 43% | 42.3% | |
| Some college, no degree | 22.7% | 25.3% | 27.2% | |
| 4-year degree + | 11.4% | 10.4% | 11.3% | |
| Federal poverty level (FPL) | 0.006 | |||
| Below 50% | 25.2% | 27.3% | 26.7% | |
| 50%-75% | 11.8% | 12.7% | 10.4% | |
| 75%-100% | 15.4% | 17.1% | 16.9% | |
| 100%-150% | 22.3% | 19.6% | 21.5% | |
| Above 150% | 25.3% | 23.4% | 24.6% | |
| Mean age | 39.7 | 38.8 | 41.1 | 0.025 |
Data source is self-reported survey data collected from September 2009 to December 2010. We tested differences between the qualitative respondents and the nonrespondents. For age, we reported a p-value from two-tailed t-tests. For all other measures, we reported Pearson's chi-square test for independence.
The federal poverty level (FPL) is used to determine means-tested public program eligibility and is calculated by family size and gross income. The threshold for Medicaid eligibility in Oregon is 100% of FPL.
The interview narratives covered an average look-back period of 30 months. Insurance status varied across participants and also, for individual participants, across time, as the look-back period was long enough for many participants to go through periods of gaining and losing coverage. In general, at the time of the interviews used for this analysis, 120 respondents received Medicaid during the 2008 expansion; an additional 191 received Medicaid through a 2010 expansion; and a few gained Medicaid coverage outside these expansions as a result of new categorical eligibility (such as through pregnancy). Of the rest, 139 were uninsured, 32 received Medicare, and 92 obtained private insurance. These numbers are approximate, as there were instances of churning, poor recall, and apparent confusion for some respondents regarding their insurance status(es).
Data Collection
The interviews were conducted in English and Spanish, and the average interview lasted approximately 1 hour. Although some interviews were conducted in the participant's home, most took place in the clinic. Once a participant had been recruited and scheduled, the interviewers reviewed a pre-interview report summarizing the participant's earlier survey responses. This report included the participant's Medicaid insurance history, Medical Outcomes Survey SF-8 health and mental health scores, and Patient Health Questionnaire PHQ-8 depression scale scores. The report also included earlier survey responses regarding the participant's chronic conditions, prescription drug usage, outpatient and inpatient utilization, and financial information related to medical costs and debt. This information helped the interviewers shape the otherwise unstructured interviews and focus on salient aspects of the participant's health care narrative. If, for example, the individual had been hospitalized, the interviewer was instructed to ask for details about the hospitalization.
The interviews began with a consent process and an introductory script explaining the interview's purpose. The interviewers then established a time line of important life events, which the interviewers used for marking the time of a respondent's description of an experience. This process helped us determine more accurately each participant's chronology of events and to keep track of the participant's insurance status as it changed throughout his or her narrative.
The 2011 interviews retrospectively explored the participant's health and his or her experiences with the health care system back to early 2008, which included the point at which the respondents participated in the in-person survey between 2009 and 2010. A complete interview guide is available in Appendix A.
All the interviewers were required to complete a postinterview assessment form summarizing the interview as soon as it was completed. This assessment form was crucial to highlighting key events in the narratives and also to capturing details that might otherwise have been lost in the transcription process, such as extreme emotion.
Qualitative Data Coding and Analysis
We transcribed and interpreted the interviews using framework analysis,26 an approach common to qualitative data analysis in applied policy research. Using a literature review and the results from the focus groups, we created a preliminary coding dictionary, which we refined as new themes emerged during data collection. About half the codes were created to tag specific, concrete instances within a narrative, for example, codes for emergency department utilization and any mention of medical debt collections.
Additional subsets of codes were created to capture emotions and experience-based concepts, such as optimism. The study team met weekly to discuss emergent themes in the data and to add new codes as the interview collection progressed. “Stigma” was an experiential code that emerged during the data collection and was added to the coding dictionary. We used the stigma code to tag instances when a participant described a perception or fear of being treated poorly in a health care context because of a particular attribute, such as insurance status, inability to pay, race, ethnicity, or health condition.
Transcripts were coded by separate research assistants using ATLAS.ti, and a member of the study leadership team reviewed and adjudicated any discrepancies in coding. We reached saturation in our analysis of the broad narratives regarding experiences of obtaining coverage or being uninsured long before we did in exploring the subgroups’ experiences. Nonetheless, we continued to offer all the participants an opportunity to share their experiences with us in an open-ended fashion. After fielding, we back-coded all the interviews with the last iteration of the coding dictionary in order to prepare the final analytic data set. The coded interview text was then sorted into families, and concepts were mapped together into patterns for interpretation.
Quantitative Analysis
We merged the stigma code, an indicator for the absence or presence of tagged stigma in the narratives, with the in-person quantitative survey data. To examine the sociodemographic attributes associated with stigma, we conducted bivariate analyses using Pearson's chi-square measure of independence and then included all the variables in an adjusted multivariate regression. We examined whether stigma was associated with race/ethnicity, age, gender, education, federal poverty level, obesity, prestudy diagnosis of depression or other health conditions, and type of insurance at the time of the in-person survey.
We used multivariate linear regression to examine the association of stigma with access to care, quality of care, and self-reported health. Within the domain of access, our dependent measures consisted of any use of care, mean number of doctor visits, and a clinic-based, usual source of care. Within the domain of quality, our dependent measures were good, very good, or excellent quality of care (versus fair or poor) and whether or not the participant had had all mental health and all medical needs met in the prior 6 months. Within the domain of health, our dependent measures were good, very good, or excellent self-reported health (versus fair or poor); stable or improving health in the previous 12 months; and SF-8 Health Survey scores for mental and physical health. Regression models were adjusted for age, race/ethnicity, gender, prestudy diagnosis of diabetes or chronic health condition, education, federal poverty level, any insurance, employment status, and having a clinic-based, usual source of care.
We fit linear models even with binary outcomes, consistent with our previous study methodology and for ease of interpretation.5,27 Although this approach poses no concern in fully saturated models,27,28 since our models were not fully saturated, we examined sensitivity to our functional form choice by examining logistic regression models, included as Table A1 in Appendix A. We also tested the sensitivity of including private and Medicaid coverage separately in the models (Table A2). All statistical analyses were performed using STATA 12.1.
Table A1.
Stigma's Impact on Access, Quality, and Well-Being, Logistic Regression
| Odds-Ratio | p-Value | 95% CI | Pseudo R2 (n) | |
|---|---|---|---|---|
| Access | ||||
| Any doctor visits in the last year | 0.906 | 0.787 | 0.442 to 1.854 | 0.3218 |
| (556) | ||||
| Clinic-based, usual source of care | 1.220 | 0.475 | 0.705 to 2.112 | 0.1636 |
| (557) | ||||
| Quality | ||||
| Quality of care good, very good, or excellent | 0.382 | 0.002 | 0.210 to 0.695 | 0.0981 |
| (460) | ||||
| All medical needs met in the last year | 0.435 | 0.002 | 0.258 to 0.731 | 0.1016 |
| (557) | ||||
| All mental health needs met in the last year | 0.477 | 0.012 | 0.267 to 0.852 | 0.1758 |
| (554) | ||||
| Well-being | ||||
| Health good, very good, or excellent | 0.556 | 0.036 | 0.321 to 0.962 | 0.1644 |
| (557) | ||||
| Health the same or improved in the last year | 0.456 | 0.010 | 0.251 to 0.827 | 0.1335 |
| (557) |
Except for stigma, the data source is self-reported survey data collected from September 2009 to December 2010. The stigma code was derived from qualitative interviews conducted from May to September 2011.
Models were adjusted for age, race/ethnicity, gender, prestudy diagnosis of depression or chronic health condition, education, federal poverty level, employment status, any insurance, and a clinic-based usual source of care (except the usual source of care model).
“Fair or poor” is the referent category in the quality of care and general health measures. The look-back period was in the previous 12 months. Having physical or mental health needs met includes those who did not report having any needs in the previous 12 months and those who did have needs and reported that all needs were met. Quality of care was contingent on using care.
PCS-8 and MCS-8 are from the short-form Medical Outcomes Survey. Questions in this scale use a 2-week look-back period.
Table A2.
Stigma's Impact on Access, Quality, and Well-Being, Controlling for Private Insurance and Medicaid Versus Any Insurance
| Sample Mean | Change with Stigma | p-Value | 95% CI | R2 (n) | |
|---|---|---|---|---|---|
| Access | |||||
| Any doctor visits in the last year | 71.3% | −2.8% | 0.553 | −11.9% to 6.4% | 0.3292 |
| (556) | |||||
| Clinic-based, usual source of care | 51.1% | 3.8% | 0.493 | −7.1% to 14.7% | 0.2112 |
| (557) | |||||
| Quality | |||||
| Quality of care good, very good, or excellent | 78.2% | −17.3% | 0.001 | −27.7% to −6.8% | 0.1035 |
| (460) | |||||
| All medical needs met in the last year | 62% | −18% | 0.002 | −29.2% to −6.7% | 0.1111 |
| (557) | |||||
| All mental health needs met in the last year | 76.4% | −12.4% | 0.011 | −22% to −2.8% | 0.1760 |
| (554) | |||||
| Well-being | |||||
| Health good, very good, or excellent | 60.2% | −11.9% | 0.030 | −22.7% to −1.6% | 0.2040 |
| (557) | |||||
| Health the same or improved in the last year | 82.6% | −11.9% | 0.008 | −20.7% to −3.1% | 0.088 |
| (557) | |||||
| Physical health (PCS-8) score | 45.2 | −2.59 | 0.030 | −4.92 to −.249 | 0.2329 |
| (556) | |||||
| Mental health (MCS-8) score | 44 | −2.70 | 0.039 | −5.26 to −.135 | 0.2642 |
| (556) |
Except for stigma, the data source is self-reported survey data collected from September 2009 to December 2010. The stigma code was derived from qualitative interviews conducted from May to September 2011. We treated dichotomous outcomes as continuous and fit linear regression models.
Models were adjusted for age, race/ethnicity, gender, prestudy diagnosis of depression or chronic health condition, education, federal poverty level, employment status, any insurance, and a clinic-based usual source of care (except the usual source of care model). Sample means are unadjusted.
“Fair or poor” is the referent category in the quality of care and general health measures. The look-back period was in the previous 12 months. Having physical or mental health needs met includes those who did not report having any needs in the previous 12 months and those who did have needs and reported that all needs were met. Quality of care was contingent on using care.
PCS-8 and MCS-8 are from the short-form Medical Outcomes Survey. Questions in this scale use a 2-week look-back period.
Results
Stigma in Health Care
Qualitative Evidence: Who Experiences Stigma, Where, and How
Even without formally probing stigma, we found that 14% of respondents described a stigmatizing experience in the health care system. The stigma usually was related to insurance status or stereotypes regarding poverty. Of those respondents reporting an experience of stigma, 33% were uninsured and 67% were on Medicaid at the time of the experience, although 13% of them had obtained private insurance in the interim.
Not all respondents reported the type of care location in which they experienced stigma, especially because for some the feeling of being stigmatized came from multiple providers and was not a single experience. However, the narratives allowed us to isolate the location of stigma in 24 (just under half) of the interviews tagged with a stigma code, and 9 of these occurred in an emergency department (ED).
Internalized Stigma
Twenty percent of the respondents reporting stigma explained their feelings as an internal sense of inadequacy, often related to poverty and the experience of receiving public assistance. Many described the sense of embarrassment they felt because of their inability to obtain health insurance on their own:
I think that the kind of insurance you have identifies you as what kind of group you fall in. [Having Medicaid puts me into the] broke, poor class, the class that is welfare class. The doctor who's sitting there, he's definitely upper class. Probably see me coming in and says, man, I'm paying for this.
For these low-income respondents, each interaction with the health care system reminded them that they could not afford care without assistance:
I'm very thankful that we have it and thankful that the Oregon Health Plan gave us what we needed at that time when we couldn't get it for ourselves, but it's not something I would want to stay on just because every time you have to go up to that window and hand in your Oregon Health Plan card, it's like you saying, “I can't do this on my own.”
Experienced Stigma
Eighty percent of the time, stigma was grounded in personal interactions with a provider or the health care system. Sometimes providers delivered this message directly: “This doctor said that I was wasting taxpayer dollars. That my insurance [Medicaid]—the only reason I had it was because people like him were paying for it.” Other people felt singled out for being poor, as if they didn't belong in the health care setting.
The first time I went to the hospital for a follow-up, I had the security guard following me around. He asked, “Sir, can I help you?” and I told him I had an appointment. The guard asked “Where is it? I'll take you.” Take me he did.
Other respondents said that they felt disrespected during their experiences with the health system. For example, one woman described her visit as: “It felt like ‘Oh, she's a welfare recipient, let's just do this and get her out.’ It wasn't very professional.”
Substance Abuse: Compounded Stigma
For just under 10% of stigma-coded interviews, stigma was associated with stereotypes of drug abuse.
I got enough follow-up care to where I got the cast off and he gave me a brace, and that was the last time I've seen the man. He knew I was using drugs, so he was just really intolerant of me. He just didn't like me … he felt like he was putting back together somebody that was worthless basically. That's how I felt.
A different participant articulated a similar experience when she felt that hospital staff had identified her as a substance abuser:
I have a hard time with some doctors because they are very patronizing and condescending. I think the doctors out there need to know that not everybody is a drug addict or everybody is going to see you just to get you to write a prescription for drugs. I don't like it when I'm treated like that, which I was when I went into the emergency room in October after I hurt my back. I felt that the doctor I went to on a follow-up for that lumped me into a drug addict category, and he treated me bad and I left crying.
Comparing Stigma with Unsatisfactory Care
We examined the relationship between unsatisfactory care and stigma to make sure the concepts were not being conflated. Unsatisfactory care experiences were common. Of all respondents, 38% reported at least 1 episode of unsatisfactory care. Seventeen percent of unsatisfactory care experiences occurred while the respondents were privately insured, 47% while publicly insured, and 36% while uninsured. The most common sources of dissatisfaction were frustrations related to miscommunication with providers and frustrations with ineffective treatments. For the Medicaid and uninsured subset, unsatisfactory care experiences also included long wait times, rushed service, and rotating physicians.
To better understand the relationship between unsatisfactory care and the experience of stigma, we examined the co-occurrence of these 2 codes in the qualitative data set: We calculated the number of times that they were applied together to a single quotation of text in the narratives. While stigma and unsatisfactory care were related, only 1 in 5 (21%) of the respondents described both a stigma experience and unsatisfactory care. Of the 216 respondents who reported at least 1 unsatisfactory care experience, the stigma code was used with it only 8% of the time.
Quantitative Evidence: Characteristics of Those Who Experience Stigma
Stigma was not strongly related to sociodemographics or other characteristics we examined, including gender, a prestudy diagnosis of a chronic health condition, current criteria for obesity, race/ethnicity, or level of poverty, though it should be noted our sample was largely in poverty and white, non-Hispanic (Table 2). Individuals who had attended college but had not graduated were more likely to report stigma (X2 = 9.34, p < .05), as were people with a pre-baseline diagnosis of depression (X2 = 4.34, p < .05). These associations were not significant in the fully adjusted model, which had very low predictive power (R2 = 0.0372). There also was no relationship between stigma and age, or the type of insurance that a participant had during the in-person survey; see limitations and challenges section for discussion on insurance status (Table 3).
Table 2.
Qualitative Respondents' Characteristics, No Stigma Versus Stigma
| No Stigma (%) | Stigma (%) | X2 | p-Value | |
|---|---|---|---|---|
| Race | ||||
| White, non-Hispanic | 70.3% | 75.3% | 0.835 | 0.360 |
| Gender | ||||
| Female | 54.3% | 64.2% | 2.729 | 0.099 |
| Education | 9.337 | 0.025 | ||
| Less than high school | 19.3% | 18.5% | ||
| High school diploma | 44% | 32.1% | ||
| Some college, no degree | 25% | 40.7% | ||
| 4-year degree + | 11.8% | 8.6% | ||
| Federal poverty level (FPL) | 3.341 | 0.502 | ||
| Below 50% | 26.4% | 28.4% | ||
| 50%-75% | 9.6% | 14.8% | ||
| 75%-100% | 17.4% | 13.6% | ||
| 100%-150% | 22.2% | 17.3% | ||
| Above 150% | 24.3% | 25.8% | ||
| Health characteristics | ||||
| Depression diagnosis, prestudy | 34.9% | 46.9% | 4.336 | 0.037 |
| One or more chronic condition diagnosis, prestudy | 30.4% | 32.1% | 0.070 | 0.722 |
| Obese | 37.2% | 38.3% | 0.033 | 0.856 |
n = 574. Except for stigma, data source is self-reported survey data collected from September 2009 to December 2010. The stigma code was derived from qualitative interviews conducted from May to September 2011.
We calculated Pearson's chi-square test of independence comparing those with stigma with those without.
We asked if the individual was ever diagnosed with depression, diabetes, high blood pressure, congestive heart failure, high cholesterol, or heart attack. Individuals who reported yes received a probe to determine if the diagnosis was made before the study.
Obesity is defined as a BMI of at least 30. BMI was collected during the in-person survey and is not available as a prestudy measure.
Table 3.
Respondents' Characteristics Predicting Stigma, Multiple Regression
| Dependent variable: stigma, mean value 14.1% | |||
|---|---|---|---|
| Coefficient | p-Value | 95% CI | |
| Age | 0.0009 | 0.475 | −0.0017 to 0.0037 |
| White, non-Hispanic | 0.0152 | 0.659 | −0.0526 to 0.0831 |
| Female | 0.0401 | 0.198 | −0.0211 to .10143 |
| Education | |||
| Less than high school | referent | ||
| High school diploma | −0.0389 | 0.349 | −0.1206 to 0.0426 |
| Some college, no degree | 0.0706 | 0.123 | −0.0190 to 0.1603 |
| 4 year degree + | −0.0450 | 0.434 | −0.1579 to 0.0679 |
| Federal poverty level (FPL) | |||
| Below 50% | referent | ||
| 50%-75% | 0.0470 | 0.392 | −0.0606 to 0.1547 |
| 75%-100% | −0.0479 | 0.308 | −0.1400 to 0.0442 |
| 100%-150% | −0.0387 | 0.383 | −0.1258 to 0.0484 |
| Above 150% | 0.0034 | 0.941 | −0.0882 to 0.0951 |
| Depression diagnosis, prestudy | 0.0555 | 0.091 | −0.0087 to 0.1198 |
| One or more chronic condition diagnosis, prestudy | −0.0228 | 0.528 | −0.0938 to 0.0481 |
| Obese | −0.0086 | 0.787 | −0.0712 to 0.0540 |
| Medicaid | 0.0348 | 0.344 | −0.0374 to 0.1070 |
| Private insurance | −0.0107 | 0.816 | −0.1017 to 0.0802 |
n = 557. R2 = 0.0372. Except for stigma, data source is self-reported survey data collected from September 2009 to December 2010. Seventeen people did not supply complete information and were not included in the model. The stigma code was derived from qualitative interviews conducted from May to September 2011. We fit a linear regression model rather than logistic.
For race, non-white or Hispanic is the referent category. For gender, male is the referent category. Medicaid and private insurance status is at the time of the in-person survey, not at the time of the stigma experience, which could have occurred at any time during the study period, 2008 to 2011.
We asked if the individual was ever diagnosed with depression, diabetes, high blood pressure, congestive heart failure, high cholesterol, or heart attack and, if so, followed up to establish the date of the first diagnosis. Prestudy diagnoses were those made before the drawings for the Oregon Medicaid lottery.
Obesity is defined as a BMI of at least 30. BMI was collected during the in-person survey.
Potential Consequences: Stigma as a Barrier to Access and Quality
Qualitative Evidence
Twenty percent of those respondents who reported stigma also reported a subsequent change in how they accessed care. Some described being told explicitly not to use preventive care because they were on Medicaid, even though increasing the use of preventive care is one of the ACA's key goals:
It was the receptionist or somebody that I talked to over there [who] said, “Don't be getting in the habit of doing this.” But all I was doing was having my blood pressure checked. They were concerned about the fact that I was using the funds to have that done … it definitely made me feel like maybe I should be not doing this. Well, I won't be doing it again, not just to have my blood pressure checked. I haven't gone to the doctor for anything.
Another participant who had just obtained OHP went in for her first primary care visit; her goal was to get a long-overdue Pap smear:
I felt like I was being judged for not having health insurance and for not taking care of me. … I didn't like how he made me feel at all. When I left there, I was just real sad. I was supposed to reschedule an appointment. But since he was rude to me, I didn't reschedule that appointment.
She left without the Pap smear. When the clinic later called to tell her that she had been diagnosed with Hepatitis C, she decided to forgo follow-up.
The experience of stigma sometimes influenced where the respondents sought care. Although it was not always an insurmountable obstacle to treatment, stigma impeded some participants’ access to the most appropriate source of care. As one participant recounted:
Because after my medicine ran out, when I went in to see my doctor I didn't know that Clonazepam was a controlled substance and they acted like I knew that. They made me totally feel like I relapsed on drugs or something. They said, “Well, we're not going to be prescribing our Clonazepam anymore.” And so for a while, I went to a doctor in Urgent Care and I told him what happened and he told me that he would prescribe them for as long as he could. But just the way that the other doctors made me feel about it, I just went off all my medications.
This patient later started using the emergency department for her ongoing care.
Quantitative Evidence
We used the in-person survey data to explore the effect of stigma on utilization (Table 4). Controlling for other characteristics related to access, we found that stigma was not a significant predictor of having at least 1 outpatient visit or having a clinic-based, usual source of care. We also found no statistical difference in the mean number of visits for those patients who had 1 or more visits: Those who had experienced stigma had an average of 5.8 outpatient visits, and those without a stigmatizing experience had 6.3 (t = 0.404, df = 566, p = 0.686).
Table 4.
Stigma's Impact on Access, Quality, and Well-Being
| Dependent Variables | Sample Mean | Change with Stigma | p-Value | 95% CI | R2 (n) |
|---|---|---|---|---|---|
| Access | |||||
| Any doctor visits in the last year | 71.3% | −2.4% | 0.605 | −11.5% to 6.7% | 0.3316 |
| (556) | |||||
| Clinic-based, usual source of care | 51.1% | 4.1% | 0.457 | −6.7% to 15% | 0.2099 |
| (557) | |||||
| Quality | |||||
| Quality of care good, very good, or excellent | 78.2% | −17.3% | 0.001 | −27.7% to −6.8% | 0.1018 |
| (460) | |||||
| All medical needs met in the last year | 62% | −17.7% | 0.002 | −28.9% to −6.6% | 0.1277 |
| (557) | |||||
| All mental health needs met in the last year | 76.4% | −12.3% | 0.012 | −21.9% to −2.8% | 0.1830 |
| (554) | |||||
| Well-being | |||||
| Health good, very good, or excellent | 60.2% | −11.9% | 0.030 | −22.6% to −1.3% | .2038 |
| (557) | |||||
| Health the same or improved in the last year | 82.6% | −11.8% | 0.008 | −20.6% to −3.1% | 0.088 |
| (557) | |||||
| Physical health (PCS-8) score | 45.2 | −2.62 | 0.028 | −4.97 to −.281 | 0.2280 |
| (556) | |||||
| Mental health (MCS-8) score | 44 | −2.70 | 0.038 | −5.26 to −.144 | 0.2644 |
| (556) |
Except for stigma, data source is self-reported survey data collected from September 2009 to December 2010. The stigma code was derived from qualitative interviews conducted from May to September 2011. We treated dichotomous outcomes as continuous and fit linear regression models.
Models were adjusted for age, race/ethnicity, gender, prestudy diagnosis of depression or chronic health condition, education, federal poverty level, employment status, any insurance, and a clinic-based usual source of care (except the usual source of care model). Sample means are unadjusted.
“Fair or poor” is the referent category in the quality of care and general health measures. The look-back period was in the previous 12 months. Having physical or mental health needs met includes those who did not report having any needs in the previous 12 months and those who did have needs and reported that all needs were met. Quality of care was contingent on using care.
PCS-8 and MCS-8 are from the short-form Medical Outcomes Survey. Questions in this scale use a 2-week look-back period.
Participants who experienced stigma were less likely to report that all their medical needs (p < .01) and mental health needs (p < .01) had been met. Stigma was associated as well with lower perceptions of the quality of care (p < .01).
Individuals who experienced stigma reported worse health outcomes. They were disproportionately more likely to perceive their health as fair or poor, rather than good, very good, or excellent (p < .05), and they were less likely to report stable or improving health in the previous year (p < .05). Individuals who reported stigma scored slightly lower on the SF-8 indices of mental (p < .05) and physical health (p < .05).
Divergent Cases
While many of the qualitative interviews suggested that stigma led people to avoid using care, several patients did not find the experience of stigma to be a deterrent. One woman suffering from breast cancer described her approach:
Unfortunately, if I can just get the bare minimum, OK, and then I'll go from there and see what else I can do. If that means keep climbing up this mountain that I have to do to get good health care, then I'll do it. It's unfortunate that somebody is looked at because of the insurance, not as a human being who needs care.
Other respondents were very pleased when they changed providers and were treated well:
I think when you're on Oregon Health Plan, if you find a doctor that doesn't look at your medical card and looks at you instead, it's different. I have a doctor now who is awesome. He calls me and asks, “How's your shoulder? How's this? How's that?” We have a really good relationship.
Even though a notable number of respondents reported experiencing stigma while uninsured or on Medicaid, being or feeling stigmatized was not the norm. Some uninsured respondents told us that they were receiving high-quality and compassionate treatment through the safety net and described, for example, doctors who went out of their way to secure samples of medication they could not afford or continued to see them at no cost after they lost their private coverage. Many participant narratives highlighted the positive impact that Medicaid had had on their lives. The benefit of public insurance for low-income adults has been well documented in our own work and in other studies.29,30 That the program can have such a positive impact on recipients’ well-being only underscores the importance of removing the barriers—such as stigmatization—that prevent beneficiaries from making the most of their coverage.
Limitations and Challenges
Our mixed-method approach allowed us to identify stigmatizing health care experiences and to examine these cases more closely using survey data. This approach has several limitations, however. First, these qualitative interviews were not specifically designed to explore issues of stigma and how it relates to access; they were intended to assess patients’ care experiences more generally and in the context of a study on health insurance. Therefore, while 14% of respondents described an experience with stigma, the prevalence of stigmatizing experiences among low-income adults cannot be estimated using these data and is likely higher than 14%. Follow-up research that is explicitly designed to explore stigma could yield richer results.
Second, the quantitative analysis examining associations between sociodemographic characteristics and stigma is limited by sample characteristics and study design; the majority of our study participants were white and low-income, and we were unlikely to identify statistically significant differences by race or poverty status. Similarly, while we can identify the type of insurance people had when recounting stigma, we cannot assign an insurance status to stigma when stigma wasn't reported in the qualitative interviews, making our coverage variable in the regression model less accurate than our qualitative interviews for understanding the relationship between insurance status and stigma.
Third, with this analysis we were unable to disentangle the complex causal pathways between stigma, access, and other outcomes. All the statistical relationships we identified are associational. It is certainly possible—indeed, likely—that there is a dynamic and evolving relationship among health care access, health status, and experiences of stigma.
Fourth, combining the qualitative and quantitative data sources may underestimate the magnitude of the relationship between stigma and the survey measures of access, quality, and well-being. Our stigma narrative was not specific enough to anchor the stigma experience to an event that preceded the in-person survey or to the look-back period of the survey questions, which ranged from 2 weeks (eg, SF-8) to 12 months (eg, needs met). The in-person survey data were collected a minimum of 5 months before the qualitative interviews. The time span covered during the qualitative interviews was, on average, 2.5 years.
Finally, all participants lived near Portland, Oregon. Even though its health delivery system and available resources are similar to those of other cities, Portland is in some ways less diverse5 and has a political and ideological profile different from that of other areas of the country. The experiences of rural individuals, or those living in other communities, might differ as well.
Discussion
Our qualitative interviews suggest that there is a stigma associated with insurance status and that it can play an important but complex role in the health care experiences of low-income adults.
Experiences of stigma did not appear to be concentrated in identifiable socioeconomic or demographic groups within this particular low-income sample. The source of feeling stigmatized sometimes reflected the individuals’ own sense of shame about being uninsured or on Medicaid but more often was experienced as coming from a provider. Interpreting the deeper causes of stigma is difficult. Most of our study participants were in poor health, which comes with its own negative stereotypes. Nevertheless, no participant self-identified illness as the source of the stigma that he or she felt; for these individuals the feeling and experience of stigma was closely tied to the inability to procure coverage for oneself. As one woman summed it up:
Even though you work but you can't afford insurance, people still frown on you because you simply have the Oregon Health Plan. It's like, “Oh, she is on welfare,” and I hate that label. In fact me and my doctor talked about it and I told him it's not because I'm black, it's not because I'm a female, it's because I'm on the Oregon Health Plan, then I'm going to get an aspirin rather than something that will help me more. … It makes you feel real low. It really does and I think it's so important that because like I said even though you do work, you've got your pride, just because you got that card saying Oregon Health Plan that means you're just bottom of the list. You are not fit for society.
Ours is not the first study to document this phenomenon. A focus group of physicians identified negative stereotypes of the uninsured and the “type of patient” that receives public assistance. The authors of the study presented the additional concern that a physician's negative stereotypes can set the tone for how the office staff treat uninsured and Medicaid patients.17 Discrimination by providers may reflect their political opinions about Medicaid, their frustration with Medicaid reimbursement rates,31 or their feelings about the Affordable Care Act.32 Regardless of the source, these negative feelings often are perceptible to the patient. Evidence that stigma is more commonly experienced than internalized indicates that changing the providers’ behavior may be a good way of reducing stigma.
Stigma was associated with health decline and poorer health across several metrics. While the probability of having any visit and the mean number of health care visits were basically the same, worse and worsening health in the stigma group may indicate either the need for more care or more effective care, and thus stigma can be thought of as a barrier to access.
Stigmatizing experiences were associated with lower perceptions of the quality of health care and with greater unmet needs. We should point out, though, that the majority of respondents reporting a stigma experience are nonetheless getting their needs met. Even if we underestimated unmet need, as noted in the discussion of study limitations, patients’ responses to feeling stigmatized clearly are varied. While some may subsequently avoid care, others ignore the perceived slight or switch providers. Still, providers or care environments that fail to treat patients with respect may be creating the risk that some will fail to receive necessary care. This suggests that empowering patients may be another way to reduce poor outcomes that may be associated with stigma.
Returning to Eisenberg and Power's model of transforming coverage to high-quality care, addressing stigma also seems to be an important component of the last vulnerability, which is in the quality of the care provided. One respondent articulated a more subtle way in which quality can be compromised when stigma is present:
What happens with people that live on an income such as I do is that when other people start talking down to you, you don't want to hear any more because you don't want to feel bad about yourself so you shut down or don't ask questions.
Even if stigma doesn't change the way that people access care, it might have a dampening effect on the impact of care provided.
Policy Implications
The ACA is expanding Medicaid to millions of low-income American adults. Although Medicaid coverage has been shown to improve some outcomes, earlier studies have not demonstrated that Medicaid leads to a sizable improvement in objective health status or a sizable reduction in health care costs, at least in the short term. To design the best Medicaid programs and to plan for Medicaid expansions, policymakers need better information about the mechanisms by which insurance coverage does lead to health improvements, as well as the barriers that individuals face as they try to use that insurance to access care and improve their health care status. Our results indicate that the stigma associated with Medicaid insurance may be one of these barriers.
Several states have made efforts to rebrand Medicaid, in part to combat stigmatization and increase take-up.33 Such strategies may be particularly effective in addressing internalized stigma, particularly since the new health insurance exchanges will be subsidizing health insurance for middle-income families and the Medicaid expansions will be changing the profiles of Medicaid patients. Challenging the stereotypes of the types of people who receive public assistance might alleviate some of the reported shame regarding the inability to secure coverage on one's own and also is appropriate given the documented erosion of employer-sponsored coverage.34
Other interventions may be necessary to reduce externally imposed stigma, such as training providers to be aware that patients might feel stigmatized. Like continuing education efforts to help providers deliver more culturally sensitive care, dispelling assumptions about or stereotypes of poor people might mitigate interactions that cause a patient to feel stigmatized.
Other government programs that have been traditionally stigmatized may offer lessons. In 2010, the Agriculture Department launched a campaign to encourage grocery stores and vendors that accept food stamps to post signs reading “We Welcome SNAP Benefits,” and Agriculture Secretary Tom Vilsack was quoted as saying: “Underscoring that SNAP benefits are welcome, rather than merely accepted, signals an important change in the way both retailers and program participants view these benefits.”35
Conclusion
The Affordable Care Act has put insurance cards into the hands of millions of low-income Americans, which will likely improve access, quality, and continuity of care for many people.4,5
Our interview results suggest that Medicaid may be necessary but not sufficient for access, as people see Medicaid insurance as different from other insurance. Patients are sensitive to their low-income status, and their perception of poverty-based prejudice may reduce the effectiveness of their care.
The ACA's Medicaid expansions provide a policy opening to address access barriers and “points of resistance” that may separate coverage from high-quality care. Addressing poverty or insurance-related stigma as it is experienced in health care environments may offer another opportunity to maximize the benefits of expanding public coverage.
Acknowledgments
We are grateful to Katherine Baicker and Vicki Lens, who kindly provided feedback on earlier drafts of this manuscript. This work would not have been possible without the OHS qualitative research team and the leadership of Kristen Dulacki.
We also gratefully acknowledge funding from the assistant secretary for planning and evaluation in the Department of Health and Human Services, the California HealthCare Foundation; the John D. and Catherine T. MacArthur Foundation; the National Institute on Aging (P30AG012810, RC2AGO36631 and R01AG0345151); the Robert Wood Johnson Foundation; the Sloan Foundation; the Smith Richardson Foundation; the US Social Security Administration (through grant 5 RRC 08098400-03-00 to the National Bureau of Economic Research as part of the SSA Retirement Research Consortium); and the Centers for Medicare and Medicaid Services’ matching funds.
Appendix A: Interviewer Guide
Domains of Interest
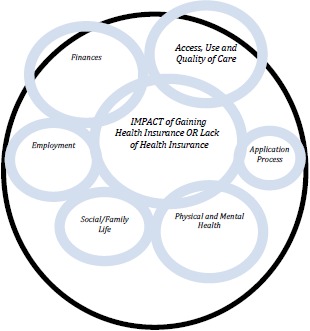
Research question: What is the overall impact of gaining (or not having) health insurance? Identifying mechanisms of change; answering how and why health insurance (or lack thereof) leads to reported outcomes.
Access and Use of Care (prevention, chronic, acute/ER)
Explore if relevant: What happens when care is needed—where, how, and why do they use care? What if they don't use care? For those who got OHP we want to know if there is a difference between uninsured where/how/why and insured where/how/why.
Finances
Explore if relevant: What is the interaction between health and finances? How do health and health care needs impact financial stability and vice versa (how does stress of financial situation impact health?) For those who got OHP what kind of impact does getting insurance have on financial stability? Other ramifications of health care costs (housing, bills, debt, stress)?
Social/Family Life (relationships, parenting, social activities)
Explore if relevant: What is the interaction between health and social/life? What is the interaction between health and mental health? General social support? How do health and the ability to access health care affect relationships, parenting, and social activities, and vice versa (health effects of isolationism? stress from family-related issues?)? For those who got OHP, has insurance changed their ability to be engaged in social and family life? How and why?
Employment
Explore if relevant: What is the interaction between health and employment (hours, type of work, how you do your work)? How do health and the ability to access health care affect one's employment situation in terms of job type and stability? How does employment affect one's health (injuries on the job? work-related stress?) If there is a “transition” experience, what is the reason for it and how is their life different because of it? For gainers of OHP how does having access to insurance change one's employment outlook and experiences, if at all? Future employment?
Physical and Mental Health (including stress)
Explore if relevant: How does one's physical and mental health affect the rest of their life (employment, social, finances, etc.)? How do they cope?
Application Experience
Explore if relevant: What made them a successful applicant or what contributed to them not being a successful applicant? Help from others or from the system?
References
- 1.Allen H, Wright B, Baicker K. New Medicaid enrollees in Oregon report health care successes and challenges. Health Aff. 2014;33(2):292–299. doi: 10.1377/hlthaff.2013.1002. [DOI] [PMC free article] [PubMed] [Google Scholar]
- 2.Allen H, Baicker K, Finkelstein A, Taubman S, Wright B and the Oregon Health Study Group. Introduction to the Oregon Health Study: a Medicaid expansion experiment. Health Aff. 2010;29(8):1498–1506. doi: 10.1377/hlthaff.2010.0191. [DOI] [PMC free article] [PubMed] [Google Scholar]
- 3.Centers for Medicare & Medicaid Services. Medicaid website. http://www.medicaid.gov/. Accessed March 18, 2014.
- 4.Finkelstein A, Taubman S, Wright B, et al. The Oregon Health Insurance Experiment: evidence from the first year. Q J Econ. 2012;127(3):1057–1106. doi: 10.1093/qje/qjs020. [DOI] [PMC free article] [PubMed] [Google Scholar]
- 5.Baicker K, Taubman S, Allen H, et al. The impact of Medicaid on clinical outcomes: evidence from the Oregon Health Insurance Experiment. N Engl J Med. 2013;368(18):1713–1722. doi: 10.1056/NEJMsa1212321. [DOI] [PMC free article] [PubMed] [Google Scholar]
- 6.Taubman S, Allen H, Wright B, Baicker K, Finkelstein A. Medicaid increases emergency-department use: evidence from Oregon's health insurance experiment. Science. 2014;343(6168):263–268. doi: 10.1126/science.1246183. [DOI] [PMC free article] [PubMed] [Google Scholar]
- 7.Ricketts TC, Goldsmith LJ. Access in health services research: the battle of the frameworks. Nurs Outlook. 2005;53(6):274–280. doi: 10.1016/j.outlook.2005.06.007. doi: http://dx.doi.org/10.1016/j.outlook.2005.06.007. [DOI] [PubMed] [Google Scholar]
- 8.Penchansky R, Thomas JW. The concept of access: definition and relationship to consumer satisfaction. Med Care. 1981;19(2):127–140. doi: 10.1097/00005650-198102000-00001. [DOI] [PubMed] [Google Scholar]
- 9.Andersen RM. Revisiting the behavioral model and access to medical care: does it matter? J Health Soc Behav. 1995;36(1):1–10. [PubMed] [Google Scholar]
- 10.Eisenberg J, Power E. Transforming insurance coverage into quality health care. JAMA. 2000;284(16):2100–2107. doi: 10.1001/jama.284.16.2100. [DOI] [PubMed] [Google Scholar]
- 11.Chung PJ, Schuster MA. Access and quality in child health services: voltage drops. Health Aff. 2004;23(5):77–87. doi: 10.1377/hlthaff.23.5.77. [DOI] [PubMed] [Google Scholar]
- 12.Sommers BD, Tomasi MR, Swartz K, Epstein AM. Reasons for the wide variation in Medicaid participation rates among states hold lessons for coverage expansion in 2014. Health Aff. 2012;31(5):909–919. doi: 10.1377/hlthaff.2011.0977. [DOI] [PubMed] [Google Scholar]
- 13.Decker SL. Two-thirds of primary care physicians accepted new Medicaid patients in 2011-12: a baseline to measure future acceptance rates. Health Aff. 2013;32(7):1183–1187. doi: 10.1377/hlthaff.2013.0361. [DOI] [PubMed] [Google Scholar]
- 14.Long SK. Physicians may need more than higher reimbursements to expand Medicaid participation: findings from Washington state. Health Aff. 2013;32(9):1560–1567. doi: 10.1377/hlthaff.2012.1010. [DOI] [PubMed] [Google Scholar]
- 15.Burstin HR, Johnson WG, Lipsitz SR, Brennan TA. Do the poor sue more? A case-control study of malpractice claims and socioeconomic status. Obstet Gynecol Surv. 1994;49(4):246–248. doi: 10.1001/jama.270.14.1697. [DOI] [PubMed] [Google Scholar]
- 16.Reutter LI, Stewart MJ, Veenstra G, Love R, Raphael D, Makwarimba E. “Who do they think we are, anyway?”: perceptions of and responses to poverty stigma. Qual Health Res. 2009;19(3):297–311. doi: 10.1177/1049732308330246. [DOI] [PubMed] [Google Scholar]
- 17.Wagenfeld-Heintz E, Ross VC, Lee K. Physicians’ perceptions of patients in a county sponsored health plan. Soc Work Public Health. 2007;23(1):45–59. [Google Scholar]
- 18.Kinsler J, Wong M, Sayles J, Davis C, Cunningham W. The effect of perceived stigma from a health care provider on access to care among a low-income HIV-positive population. AIDS Patient Care STDS. 2007;21(8):584–592. doi: 10.1089/apc.2006.0202. [DOI] [PubMed] [Google Scholar]
- 19.Link B. Understanding labeling effects in the area of mental disorders: an assessment of the effects of expectations of rejection. Am Sociol Rev. 1987;52:96–112. [Google Scholar]
- 20.Scambler G, Hopkins A. Being epileptic: coming to terms with stigma. Sociol Health Illn. 1986;8(1):26–43. [Google Scholar]
- 21.Hausmann LR, Hannon MJ, Kresevic DM, Hanusa BH, Kwoh CK, Ibrahim SA. Impact of perceived discrimination in health care on patient-provider communication. Med Care. 2011;49(7):626. doi: 10.1097/MLR.0b013e318215d93c. [DOI] [PMC free article] [PubMed] [Google Scholar]
- 22.Hausmann LR, Jeong K, Bost JE, Ibrahim SA. Perceived discrimination in health care and health status in a racially diverse sample. Med Care. 2008;46(9):905. doi: 10.1097/MLR.0b013e3181792562. [DOI] [PMC free article] [PubMed] [Google Scholar]
- 23.Duffy L. Suffering, shame, and silence: the stigma of HIV/AIDS. J Assoc Nurs AIDS Care. 2005;16(1):13–20. doi: 10.1016/j.jana.2004.11.002. [DOI] [PubMed] [Google Scholar]
- 24.Thornicroft G, Rose D, Kassam A. Discrimination in health care against people with mental illness. Int Rev Psychiatry. 2007;19(2):113–122. doi: 10.1080/09540260701278937. [DOI] [PubMed] [Google Scholar]
- 25.Earnshaw VA, Quinn DM. The impact of stigma in healthcare on people living with chronic illnesses. J Health Psychol. 2012;17(2):157–168. doi: 10.1177/1359105311414952. [DOI] [PMC free article] [PubMed] [Google Scholar]
- 26.Gale N, Heath G, Cameron E, Rashid S, Redwood S. Using the framework method for the analysis of qualitative data in multi-disciplinary health research. BMC Med Res Methodology. 2013;13:117. doi: 10.1186/1471-2288-13-117. [DOI] [PMC free article] [PubMed] [Google Scholar]
- 27.Angrist J, Krueger A. Instrumental variables and the search for identification: from supply and demand to natural experiments. J Econ Perspect. 2001;15(4):69–85. [Google Scholar]
- 28.Agnrist J, Jorn-Steffen P. The credibility revolution in empirical economics: how better research design is taking the con out of econometrics. J Econ Perspect. 2010;24(2):3–30. [Google Scholar]
- 29.Sommers B, Baicker K, Epstein A. Mortality and access to care among adults after state Medicaid expansions. N Engl J Med. 2012;367(11):1025–1034. doi: 10.1056/NEJMsa1202099. [DOI] [PubMed] [Google Scholar]
- 30.Doyle J., Jr Health insurance, treatment and outcomes: using auto accidents as health shocks. Rev Econ Stat. 2005;87(2):256–270. [Google Scholar]
- 31.Decker S. In 2011 nearly one-third of physicians said they would not accept new Medicaid patients, but rising fees may help. Health Aff. 2012;31(8):1673–1679. doi: 10.1377/hlthaff.2012.0294. [DOI] [PMC free article] [PubMed] [Google Scholar]
- 32.Sommers BD, Bindman AB. New physicians, the Affordable Care Act, and the changing practice of medicine. JAMA. 2012;307(16):1697–1698. doi: 10.1001/jama.2012.523. [DOI] [PubMed] [Google Scholar]
- 33.Volk G, Jacobs A. Implementing state health reform: lessons for policymakers. Report prepared for the Robert Wood Johnson Foundation State Coverage Initiatives. http://www.rwjf.org/content/dam/farm/reports/reports/2010/rwjf57163. Published March 2010. Accessed March 18, 2014.
- 34.Gould E. Employer-sponsored health insurance erosion accelerates in the recession. Int J Health Serv. 2012;42(3):499–537. doi: 10.2190/HS.42.3.h. [DOI] [PubMed] [Google Scholar]
- 35.USDA unveils new consumer information resources about SNAP for people in need of food assistance [news release] Washington, DC: United States Department of Agriculture; May 19, 2010. http://www.usda.gov/wps/portal/usda/!ut/p/c5/04_SB8K8xLL-M9MSSzPy8xBz9CP0os_gAC9-wMJ8QY0MDpxBDA09nXw9-DFxcXQ-cAA_1wkA5kFaGuQBXeASbmnu4uBgbe5hB5Axz-A0UDfzyM_N1W_IDs7zdFRUREAZXAypA!!/dl3/d3/L2dJQS-EvUUt3QS9ZQnZ3LzZfUDhNVlZMVDMxMEJUMTBJQ01-IMURERDFDUDA!/?contentidonly=true&contentid=2010%2f05%2f0272.xml. Accessed February 21, 2014. [Google Scholar]