

Abstract
The capacity to rapidly adjust behavioral strategies according to changing task demands is closely associated with coordinated activity in lateral and medial prefrontal cortices. Subdivisions within prefrontal cortex are implicated to encode attentional task sets and to update changing task rules, particularly when changing task demands require top-down control. Here, we tested whether these top-down processes precede stimulus processing and constitute a preparatory attentional state that functionally couples with parietal cortex. We examined this functional coupling by recording from intracranial EEG electrodes in macaques during performance of a task-switching paradigm that separates task performance that is based on controlled top-down guidance from automatic, stimulus-triggered processing modes. We identify a prefrontal-parietal network that phase synchronizes at 5–10 Hz, particularly during preparatory states that indicate top-down controlled task-processing modes. Phase relations in the network suggest that medial and lateral prefrontal cortices synchronize bidirectionally, with medial prefrontal cortex showing a phase-lead relative to left parietal recorded 5- to 10-Hz preparatory signals. These findings reveal a 5- to 10-Hz coordinated, long-range fronto-parietal network prior to actual task-relevant stimulus processing, particularly when subjects engage in controlled task processing modes.
Keywords: anterior cingulate cortex, attention, cognitive control, prefrontal cortex, theta oscillations
Introduction
Performance of even simple tasks requires brain circuitry to establish a representation of the task goal that entails the rules about how to map stimuli onto responses. This task set information serves as a critical top-down signal that biases how efficiently and accurately sensory inputs are processed and mapped onto actions. Accordingly, top-down information should be implemented by neuronal circuitry prior to the processing of task relevant stimuli and its neuronal signature should be predictive of task processing (Braver 2012). Recent studies have begun to map this preparatory top-down state onto brain areas in the prefrontal and parietal cortex (Summerfield and Egner 2009; Bollinger et al. 2010; Passingham et al. 2010). When subjects engage in controlled task processing that involves frequent switches of the task rules, a fronto-parietal network of areas activates in fMRI studies (Brass and von Cramon 2002, 2004; Dosenbach et al. 2007, 2008; Koechlin and Hyafil 2007; Hikosaka and Isoda 2010). Activation of lateral prefrontal cortices has been causally linked to efficient top-down guidance of attentional selection (Taylor et al. 2007; Ruff et al. 2008; Morishima et al. 2009; Zanto et al. 2011; Polania et al. 2012). Similarly, medial prefrontal and anterior cingulate cortices are known to provide essential preparatory control signals that ensure adjustment of attentional demands and behavioral strategies to cope with varying task demands (Kennerley et al. 2006; Johnston et al. 2007; Hikosaka and Isoda 2010; Passingham et al. 2010; Womelsdorf, Johnston et al. 2010; Kaping et al. 2011).
Preparatory top-down signals are thus evident in widely distributed brain areas that form various fronto-parietal networks subserving selective attentional control (Corbetta and Shulman 2011; Petersen and Posner 2012), decision-making processes (Wang 2008; Kable and Glimcher 2009; Polania et al. 2012), working memory maintenance (Palva, Monto, Kulashekhar et al. 2010; Salazar et al. 2012), predictive perceptual coding (Summerfield and Egner 2009; Bollinger et al. 2010; Bastos et al. 2012), or cognitive task sets (Brown et al. 2007; Dosenbach et al. 2007). Rich information about the spatial-anatomical specificity of these fronto-parietal networks has been gained from functional connectivity analysis at slow timescales measured in the fMRI BOLD response (Bressler and Menon 2010; Hutchison et al. 2012). However, only recently have investigators successfully delineated the temporal specificity of emerging functional networks using coherence and graph theoretical network analysis (Sarnthein et al. 1998; Womelsdorf et al. 2007; Gregoriou et al. 2009; Palva, Monto, Palva 2010; Hipp et al. 2011, 2012; Bosman et al. 2012; Siegel et al. 2012). These studies have shown that selective preparatory states indicative of anticipatory attention and working memory retention are associated with selective long-range phase synchronization at various time scales and frequencies (Canolty et al. 2010; Womelsdorf, Vinck et al. 2010; Fell and Axmacher 2011; Bosman et al. 2012; Salazar et al. 2012; Siegel et al. 2012). Large-scale phase coupling could thereby provide a critical window into the mechanisms underlying the coordination and integration of distributed top-down information during task performance (Fries 2005; Womelsdorf et al. 2007; Arnal and Giraud 2012; Battaglia et al. 2012; Jensen et al. 2012).
We therefore aimed to test whether phase coherence between intracranially implanted EEG electrodes covering the macaque neocortex allows for the identification of a functional network conveying information about the top-down control strategies used to perform a rapid alternating task-switch paradigm. In 2 animals, we found a reliable, and topographically specific (pre-)frontal-parietal network that engages in 5- to 10-Hz phase synchronization. Network coherence dynamically evolved prior to stimulus processing and predicted whether the subjects performed the task with a controlled behavioral strategy that utilizes top-down information, or whether subjects employed an automatic, stimulus-triggered response mode. Phase relations within the network suggested that medial prefrontal cortex and lateral prefrontal activity are coordinated bidirectionally, with 5- to 10-Hz oscillation cycles in the midline areas acting as potential drivers of 5- to 10-Hz activity recorded over parietal cortex.
Materials and Methods
Subjects
Two macaque monkeys (Macaca mulatta), monkey B and monkey Q (weighing 10 and 8 kg, respectively) were used as subjects in this study. All experimental procedures were conducted in accordance with the Canadian Council of Animal Care Policy on the Use of Laboratory Animals and a protocol approved by the Animal Use Subcommittee of the University of Western Ontario Council on Animal Care. The animals were implanted intracranially with 16 low-impedance electrodes placed over major dorsal cortical regions, based on stereotaxic coordinates (Paxinos et al. 2000) for EEG recordings as utilized and validated in previous studies (Woodman et al. 2007; Sander et al. 2010) (Fig. 2E). Once implanted, the impedance of the electrodes was 10–15 kΩ measured at 30 Hz (Grass F-EZM 5, Astro-Med, Brossard, Quebec).
Figure 2.

Task switching and behavioral accuracy around task-rule switches. (A) Illustration of the alternation of pro- and antisaccade task rules that were switched without overt cue every 5–10 trials. (B) The proportion of correctly performed “automatic” trials relative to all trials in monkey Q across all 32 sessions (upper panels) and on average across sessions (bottom panel) relative to the trial (x-axis) in which the task rule switched from a pro- to an antisaccade rule (left panels) or from an anti- to a prosaccade rule (right panels). (C) Proportion of correct trials of monkey Q with a response time that indicated controlled task processing, that is, with reaction times >110 ms relative to the peripheral cue. The y-axis denotes the trial number relative to the task-rule switch trials. (D and E) Same format as B and C, but for monkey B. (E) Stereotactic location (left panel) of intracranially implanted EEG electrodes with the major sulci of the underlying neocortex sketched as lines. The right panel illustrates the cortices underlying the electrode locations. For all panels with statistical markers (stars) of significance, **P ≤ 0.01 and **P ≤ 0.001.
Experimental Design
The monkeys performed a saccade-rule switch task, which is an adaptation of the saccade over-riding task introduced by Isoda and Hikosaka (2007) to investigate both automatically generated and controlled saccade responses (Isoda and Hikosaka 2007, 2008) (Fig. 1A). In this task, the animals had to complete blocks of 5–10 correct trials using 1 of 2 stimulus-response (SR) mapping rules, a prosaccade and antisaccade rule (Fig. 1A). The SR mapping rule alternated in successive blocks. At the start of each trial, the monkey had to acquire a central, white fixation point. Following a random delay of 0.75–0.9 s, a stimulus was presented either left or right of the fixation spot at 8° eccentricity. After a delay of 0.2 s, the white fixation spot was replaced with a colored instruction cue, which indicated the saccade rule of the current trial. A response was considered correct if the saccade endpoint fell within the appropriate target window (5° × 5°) within 0.5 s after cue onset and was maintained for 0.08 s, after which the monkey immediately received a liquid reward. The animals were not rewarded if the response was initiated before the fixation point changed color.
Figure 1.

Task design and bimodal behavioral reaction time distributions. (A) Trials began with a 0.75- to 0.9-s preparatory epoch in which the animals fixated a white fixation point on the monitor screen. A peripheral stimulus was then presented to the left or right of the fixation point. The animals were required to maintain central fixation for a further 0.2 s until the color of the fixation point changed either to red or to green. The color of the cue signaled whether a prosaccade toward the peripheral stimulus, or an antisaccade opposite to the peripheral stimulus location needed to be performed. The association of the color (red/green) to the stimulus response mapping rules (prosaccade/antisaccade) remained identical for each monkey, but was revered between animals. The gray shading indicates the preparatory epoch for all neuronal EEG analysis reported in the main text. (B) Saccadic reaction times across all correct trials (y-axis) of monkey B (left panel) and Q (right panel) relative to the onset of the peripheral stimulus. Note that responses before color cue onset at 200 ms after peripheral stimulus onset were considered errors. For both animals, a bimodal distribution was evident with fast responses following the cue indicative of an “automatic” task performance strategy, and responses (>110 ms) reflecting a “controlled” performance strategy (see text). (C) Bimodal response time distributions for trials (y-axis) correctly performed on the prosaccade task (upper panel) and the antisaccade task (bottom panel).
Implant and Surgery
Both monkeys underwent surgery for skull surface dental acrylic implants in preparation for chronic ERP recordings. Monkeys were sedated for the surgery with ketamine hydrochloride (10 mg/kg i.m.). Atropine (0.05 mg/kg s.c.) was given to reduce bradycardia and salivary secretions. Anesthesia was initiated with a bolus of propofol (2.0 mg/kg i.v.) and maintained with propofol (0.2 mg/kg/min i.v.) and midazolam (0.35 mg/kg/min i.v.). Heart rate, blood oxygen, respiratory rate, blood pressure, and body temperature were monitored throughout the duration of the surgery. For a 10-day period after surgery, animals received antibiotic (cefazolin, 25 mg/kg i.m.) to prevent infection. Animals were also given analgesic buprenorphine hydrochloride (0.01 mg/kg i.m.) postoperatively for 3 days to alleviate any potential discomfort. Further analgesia was provided by metacam (0.2 mg/kg, administered orally) as needed.
The implantation of electrodes within the skull followed procedures described in detail elsewhere (Sander et al. 2010). In brief, acrylic implants consisted of custom-made connector chambers holding the connector wires (Plexon, Inc., Dallas, TX) that were soldered to shortened amphenol gold pins serving as electrode contacts. Wire lengths were kept constant. We used a linked ear reference, with reference wires soldered to a separate connector, which received the linked ear clips set up manually during each recording session. Holes for the amphenol gold pin electrodes were drilled into the skull bone to a depth of ≈1 mm but without penetrating the bone (≈3 mm thick). Electrodes were initially fixed in their position with dental acrylic cement, and once all 16 electrodes were in place, the implant was built around them covering all components except for the connector end pieces. Through this setup, EEG electrodes were accessible with minimal invasiveness for chronic recording with electrodes at identical locations across sessions. The differences in size of cortical areas between humans and monkeys make a 10–20 systems inappropriate for monkeys. Electrode locations were selected based on stereotaxic coordinates (Paxinos et al. 2000). The closest corresponding locations from the human 10–20 system were FCz, F3, and F4 for prefrontal areas; FC3 and FC4 for the frontal lobe; C3, Cz, and C4 for central sites; P3, Pz, and P4 for parietal areas; modified T5 and T6 for higher order visual areas; O1, Oz, and O2 as sites over primary visual cortex (Fig. 2F). The impedance of the electrodes once implanted was 10–15 kΩ measured at 30 Hz (Grass F-EZM 5, Astro-Med, Brossard, Quebec).
EEG Recordings
The connectors for the 16 intracranially implanted electrodes were accessible via the implanted chambers, and connected to a PLEXON multichannel data acquisition system (Plexon, Inc.), via a preamplifier (PBX2/32sp/32fp300) with a band-pass filter of 0.7–300 Hz and 1000× gain, through connector cables with head-stage adapters (HST/8o50-G1-TR, unity gain). Grass ear clip electrodes (Astro-Med, Inc., Brossard, QC) with Grass EC2 cream as conductive agent were clipped to both ears. Electrical potentials were digitized at 1000 Hz. The system was also used to store trial events and eye positions, recorded at 120 Hz using an ISCAN primate video eye-tracking system (ISCAN, Inc., Woburn, MA). EEG signals were monitored online using Sort-Client software (Plexon, Inc.) on a PC running Windows XP®.
Preprocessing
All preprocessing and data analysis steps were performed with custom MATLAB code (Mathworks, Natick, MA), utilizing functionality from the open-source fieldtrip toolbox (http://www.ru.nl/fcdonders/fieldtrip/). The continuous recorded data were divided into nonoverlapping trials that were initiated when the monkeys directed their gaze to the fixation point and terminated when the monkeys gaze left the fixation window, that is, initiated a saccadic response outside the fixation control window. For each time point, we then computed the average activity across those 8 electrodes that were recorded with the same head stage and subtracted this average from the individual channels. This processing step removes differences in amplifier- and reference-related (DC) offsets between the 2 sets of 8 electrodes. To remove remaining artifactual potential fluctuations from the data, we removed trials where prestimulus potentials exceeded 3 standard deviations from the average at any time point. This procedure effectively removed trials with transient spike potentials of the data.
Data Analysis
All statistical analyses were limited to the preparatory period from −0.75 to 0 s before the peripheral stimulus onset, which itself was presented 0.2 s before the central color cue onset (Fig. 1A). Analysis thus excluded stimulus-onset-related activity, cue-onset-related activity, or saccade-related activity. Frequency decomposition of the EEG traces was performed on ±0.25-s time windows every 10 ms from −0.75 to 0.15 s relative to the time of the onset of the peripheral stimulus. Data in each ±0.25-s time window was tapered with a Hanning window before applying a fast Fourier transform. Hanning tapered Fourier spectra were calculated from 2 to 34 Hz.
Analysis of Phase Coherence
To study connectivity between signals from separate electrodes, we computed the weighted phase lag index (WPLI) (Vinck et al. 2011). The WPLI (for mathematical definition, see Vinck et al. 2011) is a measure of phase coherence that is based solely on the imaginary component of the cross-spectrum, and is not spuriously affected by the volume conduction of a single source's activity to 2 separate sensors, or by a common reference. The WPLI has increased robustness to noise compared with previous measures that are based on the imaginary component of the cross-spectrum (Nolte et al. 2004; Stam et al. 2007), and increased sensitivity to detect true interactions, such that the WPLI is monotonically related to increases in true coherence or phase-coupling between interacting sources. A further advantage of the WPLI is that it is invariant to a linear mixing of 2 dependent sources, and is hence more sensitive in detecting interactions when the interacting sources are spatially close (Vinck et al. 2011; Ewald et al. 2012; Haufe et al. 2013). A direct estimator of the WPLI is heavily biased by sample size (Vinck et al. 2011). We therefore estimated the squared WPLI by using the debiased WPLI estimator (Vinck et al. 2011), ranging from zero (negative values can incidentally occur because of limited sampling) to one (maximum coherence). The debiased WPLI has no sample size bias if the asymptotic WPLI value equals zero (no phase coupling), hence does not spuriously indicate interactions. Furthermore, its sample size bias is negligible for even small sample sizes of 20–30 trials (Vinck et al. 2011). Note that the debiased WPLI is an estimate of the squared WPLI, that is, a value of 0.1 for the debiased WPLI corresponds to a value of the unbiased WPLI of about 0.3.
Statistical Analysis of WPLI and FDR Control for Multiple Tests
To test whether the debiased WPLI significantly exceeded zero (i.e., significant phase-coupling) we computed jack-knife estimates of the standard error of the debiased WPLI (Efron and Tibshirani 1998) and used the standard errors to calculate P-values for the debiased WPLI with regard to the normal distribution. We applied an alpha value of P = 0.05 to infer statistical significance, and controlled for the multiple comparisons/hypothesis tests across all 120 electrode combinations in our 16 electrode EEG recordings by controlling for type I errors/false positives with an false discovery rate (FDR) control algorithm for dependent sample as previously proposed and validated (Benjamini and Yekutieli 2001). This FDR algorithm ensures that for a given significance level (e.g., alpha = 0.05), the proportion of null hypotheses that are rejected despite being true (false positives) does not exceed the specified false discovery proportion (FDP) (for details on the algorithm, see Groppe et al. 2011). We used an FDP of 0.20 and alpha = 0.05 to ensure that among all those rejected null hypothesis with P ≤ 0.05, the error likelihood for a false positive is P ≤ 0.2 (Genovese et al. 2002; Ewald et al. 2012). We adapted the Matlab implementation of the Benjamini and Yekutieli (2001) FDR control algorithm from the Mass Univariate ERP Toolbox (http://www.openwetware.org/wiki/Mass_Univariate_ERP_Toolbox), and report the FDR-corrected P-value at the respective places.
To test for a significant difference in debiased WPLI between conditions, we used permutation statistics testing the null hypothesis that the observed WPLI difference between conditions is independent of the actual condition label of trials. For every permutation (n = 500), we randomly permuted the trial order, such that the number of trials per condition was kept constant, reassigning randomly condition labels. We then tested whether the observed debiased WPLI difference exceeded the 97.5% percentile or fell below the 2.5% percentile of the randomization distribution, corresponding to a 2-tailed test of significance of P ≤ 0.05. To control for the FDR of rejected null hypothesis across multiple tests (across n = 120 electrode pair WPLI's), we applied a permutation correction method for FDR control that has been described and validated elsewhere (Korn et al. 2004; Groppe et al. 2011). We used an alpha P-value of 0.05 (2-tailed significance) and an FDR value of 0.2 for the difference statistics that corresponds to a control of the maximum proportion of false positives among the rejected null hypotheses of ≤20% percent (Genovese et al. 2002; Ewald et al. 2012).
In order to analyze for a possible directional influence of activity from one electrode site to another electrode site, we calculated the phase differences between sites across the frequencies of interest (5–10 Hz). A positive or negative slope of the phase progression through those frequencies at which there is significant coherence provides a direct estimate of whether the central site (in our application: electrode FCz) is driving or lagging behind the other electrode site (Schoffelen et al. 2005). We quantified the slope of the phase spectra at the frequency of interest by linear regression analysis. To test for the statistically significant difference of the slope of the phase spectra from zero slope, we performed permutation tests by randomly shuffling the frequency labels before computing the linear regression slope. This procedure was repeated n = 1000 times. The observed slope was considered significant at P ≤ 0.05 when its magnitude exceeded the 95th percentile of the slopes of the random distribution.
Results
Behavioral Performance of Controlled Stimulus-Response Mapping
We trained 2 macaque monkeys on a task-switch paradigm, designed to probe subjects' abilities to continuously balance their tendencies for “automatic” behavioral response mappings toward sensory stimuli, with “controlled” response mappings that utilize instructional cue information to map a response to a sensory stimulus (Fig. 1A, see Material and Methods section for details). The task showed a color cue that indicated the task rule only at 0.2 s. after the peripheral target stimulus location. Task rule (cue color) switches occurred in rapid alternation every 5–10 trials without overt switch cue. Figure 1B illustrates that this task elicited bimodal distributions of saccadic reaction times in both animals (Hartigan's dip test for bimodality: P ≤ 0.001 for both monkeys). Monkey B anticipated the saccadic response target without utilizing the cue information in 27.5% of trials (n = 1353 fast response trials vs., n = 3563 trials with slower saccadic responses after the cue stimulus). Monkey Q anticipated the saccadic response target without utilizing the cue information in 69.8% of trials (n = 4672 fast response trials vs., n = 2023 slow response trials) (Fig. 1B). In the following we call those trials with fast reaction times occurring within 110 ms to cue onset (i.e., within 310 ms to peripheral stimulus onset) automatic trials as they indicate that the task rules are applied without interpreting the color of the cue, which served in these trials as a mere GO-cue for the animals. In the other proportion of the trials, the monkeys’ reaction times were slower than 110 ms and in the time range that indicated that the cue information was used to program the saccadic response direction (Fig. 1B). We call these trials controlled trials as they indicate that monkeys did not rely on a previously established task rule to elicit a saccade, but rather reactivated the SR mapping rule and utilized the cue color for their SR mapping. The bimodal distribution of reaction times was evident for both, the prosaccade and antisaccade tasks (Hartigan's dip test for bimodality: P ≤ 0.001 for pro- and antisaccade distributions, Fig. 1C).
The 2 distinct, automatic, and controlled task performance strategies were achieved by switching the task rule, that is, the color of the rule cue, every 5–10 trials (randomly) without overt cue of the switching (Fig. 2A). For both animals, the performance following task switches dropped significantly for the automatic, fast trials when comparing the preswitch behavior (trials −4 to −1 before the switch) to the switch and immediate postswitch trial (t = 0 and t + 1) (all P ≤ 0.001) (Fig. 2B,D). This decline in performance on switch trials was evident irrespective of whether the switch was from prosaccade to antisaccade trials or from anti- to prosaccade trials. The overall accuracy for the switch trials (t = 0) dropped for monkey Q to 9.7% (pro- to antiswitch trials, Fig. 2B left panel), and to 13.7% (anti- to proswitch trials, Fig. 2B right panel), and for monkey B, it dropped to 2.7% (pro- to antiswitch trials, Fig. 2D left panel), and 3.5% (anti- to proswitch trials, Fig. 2B right panel). The deterioration of performance on switch trials shows that the automatic response strategy failed to be successful for switch trials in both monkeys. For these automatic, fast trials, performance remained lower than before the switch for t + 2 and beyond for most comparisons with the exception of fast antisaccade trials for monkey B (Fig. 2D, left panel). The failure to switch to an antisaccade or a prosaccade rule is best explained by the failure to attentively reactivate the SR mapping rules in order to utilize the color information of the cue to inform the saccadic response, but rather to use the color cue as an unspecific GO signal. The use of an automatic response strategy was highly consistent across all n = 32 experimental recording sessions (Fig. 2B,D).
In contrast to the almost complete breakdown of correctly performed fast (automatic) trials, we also calculated the proportion of correctly performed slow (controlled) trials and found performance on these trials was less consistently affected by the task switch (Fig. 2C,E). For monkey Q, switch trial accuracy was significantly different only for the pro- to antisaccade switch trial (at trial t = 0), but not for the anti- to prosaccade switch trial and performance on trials following the switch (t + 1 and beyond) was not different to trials before the switch (Fig. 2C). For monkey B, controlled (slow) trials did not show a dip of performance that was specific for the switch trials (t = 0), but revealed an overall lower proportion of correctly performed antisaccade trials compared with prosaccade trials (P ≤ 0.001, see Fig. 2E). These results show that both animals similarly applied 2 distinct performance strategies during task processing, with the task switch acting predominantly as a performance “breaker” for the automatic performance mode. Animals differed in 2 respects: First, monkeys differed in their overall performance success (79.6% correct in monkey B vs., 69.5% correct for monkey Q), with monkey B showing a relative decrease during controlled task performance of anti- relative to pro- saccade performance. Second, monkeys differed in the relative proportions of automatically versus controlled performed trials: Monkey B performed 27.5% (1353 of 4916 trials) correct trials with an automatic, fast response following cue onset, while monkey Q performed 69.8% (4672 of 6695 trials) correct trials with an automatic, fast response.
The Preparatory State is Characterized by a 5- to 10-Hz Coherent Fronto-Parietal Network
During the 64 recording sessions (n = 32 in each monkey), we recorded the local EEG from 16 intracranially implanted electrodes that were distributed across the whole extent of the dorsal neocortex (see Fig. 2F). We first aimed to identify the spectral signature and temporal profile of the preparatory state immediately preceding stimulus processing and SR mapping. To this end, we calculated the debiased WPLI (Vinck et al. 2011) across time and frequency between all EEG channel pairs (see Materials and Methods section). The WPLI indexes the strength of phase coupling similar to the phase locking value or coherence (0 indicates no phase coupling, 1 indicates maximum phase coupling), but is not spuriously increased by common referencing or volume conduction of single sources to 2 sensors (assuming instantaneous mapping of sources to sensors). In addition, our simulations and theoretical analysis have demonstrated a decreased sensitivity to noise and increased capacity to detect true changes in coherence in comparison to other measures that utilize the imaginary component of the cross-spectrum (Nolte et al. 2004; Stam et al. 2007; Vinck et al. 2011; Ewald et al. 2012; Polania et al. 2012).
Consistent across animals the prefrontal electrode site FCz showed coherence with a peak within a 5- to 10-Hz frequency band in the prestimulus period when considering all correctly (controlled and automatically) performed trials (Fig. 3A,E). Both animals also showed coherence within low beta frequencies with a clear 15- to 20-Hz peak evident only in monkey Q and with no consistent topography and time courses between animals (data not shown). Time frequency analysis revealed that coherence at 5–10 Hz emerged shortly after the animals engaged in a new trial by fixating the fixation stimulus (fixation onset started 0.75–0.9 s prior to stimulus onset, see Materials and Methods section) (Fig. 3B,F). The temporal profile of 5- to 10-Hz coherence is illustrated in Figure 3C,G, suggesting that phase synchronization in this frequency band signifies a preparatory network that functionally activates immediately prior to the onset of task-relevant stimuli in both animals.
Figure 3.

Reliable 5- to 10-Hz coherence during preparatory states. (A) Average coherence (measured as weighted phase lag index, WPLI) of electrode site FCz with those sites that were statistically significantly locking with FCz (P ≤ 0.003, FDR corrected, see text for details) for monkey B. Coherence was averaged for the preparatory period (−0.6 to −0.05 s) prior to stimulus onset for all correctly performed trials (automatic and controlled trials). Shading is SE across electrode pairs. (B) Temporal evolution of coherence of the prefrontal electrode site FCz in monkey B with those electrode sites showing statistically significant coherence. The white rectangle identifies the time-frequency region of interested selected for further analysis. (C) Time course of the averaged 5- to 10-Hz coherence as shown in B. Shading denotes SE across electrode pairs. Inset panels at the top show coherence aligned relative to the onset of fixation. (D) Adjacency matrix showing the average 5- to 10-Hz coherence (indexed as WPLI) for all n = 120 electrode site pairs of monkey B during the preparatory period (−0.6 to −0.05 s prior to stimulus onset) in all correctly performed automatic and controlled performance trials. Black crosses indicate statistically significant coherence (WPLI), controlling for the false discovery rate to be FDR <0.2. The thick rectangles mark all electrode combinations of electrode FCz. (E–H) Same as A–D, but for monkey Q.
To obtain a complete topographical overview of the 5- to 10-Hz coherent network, we calculated the complete adjacency matrices for the average coherence during the prestimulus period (−0.6 to −0.05 s) for all correct (controlled and automatically performed) trials for monkeys B (Fig. 3D) and Q (Fig. 3H). For both animals, the 5- to 10-Hz coherent network included the prefrontal midline electrode FCz, lateral prefrontal and frontal electrode sites (F3, F4, FC3, FC4), and central electrodes (C3, C4, CZ) when controlling for the FDR of multiple statistical tests performed across the 120 electrode combinations (P ≤ 0.05, FDR ≤0.2; see Materials and Methods section) (Fig. 3D,H). Beyond the common couplings with electrode FCz, additional electrode pairs showed significant 5- to 10-Hz coherence in each monkey. Statistically significant (FDR corrected) electrode pairs of the preparatory 5- to 10-Hz network included parietal-temporal, and parieto-occipital sites in monkey B (Fig. 3D), and included central-parietal and occipital-parietal sites in monkey Q (Fig. 3H). To quantify the similarity of this fronto-parietal network, we calculated the Pearson correlation coefficient of the adjacency coherence matrices of monkey B and Q. We found a strong and highly significant correlation between these 2 matrices (across cells in the matrices) (r = 0.44, P < 0.0001).
Controlled versus Automatic Strategies are Predicted by 5- to 10-Hz Fronto-Parietal Coherence
We next tested whether the 5- to 10-Hz fronto-parietal network coherence was informative about the task strategy that the animals applied to the SR mapping that commenced after the preparatory period. The similarity of the 5- to 10-Hz network allowed pooling coherence across animals to test for population differences of fronto-parietal coherence with enhanced statistical power with a randomization statistics that controlled for the FDRs when performing multiple statistical comparisons across all electrode site combinations (n = 120). Figure 4A shows that controlled task performance was associated with stronger 5- to 10-Hz coherence in the fronto-parietal network compared with automatic task performance (randomization test, P ≤ 0.05, FDR ≤0.2). Phase synchronization was statistically reliably stronger between FCz and bilateral prefrontal sites (F3, F4), with left parietal cortex (P3), and with occipital cortex sites (Oz, O2) (Fig. 4B).
Figure 4.

Spatial topography and selectivity of 5- to 10-Hz network activity for controlled versus automatic trials. (A) Complete adjacency matrix showing the difference in 5- to 10-Hz coherence (WPLI) between trials with controlled versus automatic task processing mode. Black crosses indicate site pairs with statistically significant coherence (WPLI) (alpha level = 0.05) based on randomization statistics and controlled for a false discovery proportion of ≤0.2 (see text for details). The coherence difference is calculated based on the average 5- to 10-Hz WPLI in the −0.6 to −0.05 s preparatory time window before stimulus onset. Positive coherence values index stronger coherence during the preparatory period prior to controlled rather than automatic task performance. (B) Sensor-level topography of the 5- to 10-Hz coherence difference (correct controlled trials vs. correct automatic trials) of electrode site FCz with all other 15 electrode sites, averaged across subjects in the −0.6 to −0.05 s prior to stimulus onset. The dots demarcate the 16 electrode positions with electrode labels. FCz served as reference electrode site for all site pairs. Arrows illustrate the major axes of coherence. Black dots show those electrode pairs that have significantly higher phase locking with FCz as shown in (A). (C) Same format and color scale as (A) but showing the WPLI difference between all correct trials that followed the task switch (trials 2–4, “postswitch”) versus all correct trials that preceded the task switch (last 5 “preswitch” trials). (D) Same format and color scale as (A and C), but showing the WPLI difference between all correct versus, all error trials.
We next tested whether the strength of 5- to 10-Hz coherence is related specifically to the task control the animals applied prior to stimulus processing, or whether it is influenced by other factors that varied across the course of the task. We first pooled all correct trials irrespective of their reaction times that followed the task switch (trials 2–4 after the task switch) and compared these postswitch trials to correctly performed preswitch trials (the last 5 trials prior to the switch and avoiding overlap of trials). Apart from the central occipital (Oz) to left central (C3) electrode pair with significantly stronger 5- to 10-Hz coherence for postswitch versus preswitch trials, there was no other electrode pair that showed statistically significant, differential coherence in postswitch relative to preswitch trials (all combinations, randomization test with FDR ≤0.2: P > 0.05, Fig. 4C). The lack of a switch specific modulation of coherence was likewise seen when the pre- to postswitch comparison was performed based a finer grained trial selection (t + 2, [t + 2 t + 3]) for the postswitch trials (data not shown). Similarly, the precise task that the animals performed (correct prosaccades vs. correct antisaccades) was not distinguished by 5- to 10-Hz coherence at any electrode pair (all combinations, randomization test with FDR ≤0.2: P > 0.05). Next, we pooled all correct trials irrespective of the task and the task processing strategy, the reaction time, and their occurrence relative to the task switch, and compared them to error trials and found that the 5- to 10-Hz coherence did not statistically distinguish correct versus error trials (Fig. 4D). Finally, we asked whether preparatory 5- to 10-Hz coherence that distinguished automatic (fast) and controlled (slower) trials related to finer grained reaction time variations beyond the task control mode. For example, 5- to 10-Hz coherence may index an inhibitory motor control signal that may be stronger when monkeys were more successful in suppressing an automatic anticipatory response, similar to what has been reported for beta activity in motor cortices (e.g., Miller et al. 2012). According to this hypothesis, preparatory 5- to 10-Hz coherence may be stronger for trials with slower saccadic reaction times compared with trials with faster reaction times. We therefore median split the reaction times for the automatically performed trials (the left part of the bimodal reaction time distributions) for each session and calculated prestimulus 5- to 10-Hz coherence for the set of faster and slower trials. Comparison of these sets of trials did not result in statistically reliable (FDR corrected) differences in coherence. We then median split the controlled performed trials into faster and slower trials and tested for differences in preparatory 5- to 10-Hz coherence. Similar to the automatically performed trials, there was no statistically reliable prediction of faster versus slower reaction times for this comparison.
Phase Relations Within the Fronto-Parietal Network
The previous analyses showed that 5- to 10-Hz coherence indexes a preparatory network that increases in phase locking when animals engage in a controlled processing mode. To investigate whether the phase relations within the fronto-parietal network are informative about the underlying processing mode beyond the strength of phase locking, we analyzed the phases at which electrodes sites synchronized to the reference site FCz. Figure 5 shows the normalized histograms of phase relations across all correctly performed (controlled and automatic) trials for electrode site FCz with those sites that showed stronger coherence in the previous analysis. The individual phase histograms reveal that, for all electrode sites, a consistent pattern of synchronization was evident in both animals within the network. The lateral prefrontal cortical sites (F3, F4) had a phase offset relative to FCz of 1.91 and 2.9 radians, corresponding to a time difference of 40–61 ms, respectively (see Fig. 5A,B). A similar phase difference was evident for electrode site Oz (Fig. 5E). In contrast to these relatively large phase offsets that are ambiguous with regard to their sign (positive/negative) relative to FCz because of potential EEG polarity reversals, the 5- to 10-Hz oscillation over left and right parietal cortex (electrodes P3 and P4) showed phase relations that were indicative of either a phase lag relative to FCz, or showed zero phase coherence (for right parietal cortex in monkey Q) (see below) (Fig. 5C,D). For monkey B, a consistent and significant (P ≤ 0.05) phase lag relative to FCz was evident for the left hemisphere parietal electrode site (mean: 15 ms, 95% circular confidence range: ±3.3 ms) and the right hemisphere parietal electrode site (mean: 17 ms, 95% circ. confidence range: ±2.3 ms). For monkey Q, the left parietal electrode site showed a zero phase delay to FCz (mean: 0.3 ms, 95% circ. confidence range: ±4.7 ms), and the right parietal electrode site showed a significant positive phase difference to FcZ (P ≤ 0.05) of on average 10 ms (95% circ. confidence range: ±8.8 ms).
Figure 5.

Phase relation of 5- to 10-Hz network coherence during the preparatory state. (A) Normalized histogram of the phase relations in radians (x-axis) of 5- to 10-Hz synchronization of electrode FCz with electrode site F3 for monkey B (red, left y-axis) and monkey Q (blue, right y-axis). The solid line is the circular interpolation of the data (dots). Triangles denote the mean phase relation. The phase relation is the difference of the (conjugate multiplied) of the complex Fourier value of FCz with F3. The mean phase relation is provided in ms as text in the panel. Positive phase relations indicate a phase lead of FCz relative to F3, and negative phase relations indicate a phase lag of FCz relative to F3. (B–E) Same format as (A), but showing the normalized phase relations of FCz with F4 (B), P3 (C), P4 (D), and Oz (E). For each panel, all correctly performed trials (controlled and automatic task performance) were used to histogram the phase relations. Normalization was done by dividing trial count histograms by the total number of trials.
We next tested whether the 5- to 10-Hz phase at which electrode sites synchronized to FCz in the preparatory prestimulus period varied between controlled and automatically performed trials. Figure 6A shows that the phase at which FCz synchronized to any of the other electrodes did not significantly differ between controlled and automatic processing modes in either monkey (all P > 0.05). This result allowed us to test, across subjects, for possible directional influences of activity at FCz toward other electrodes. To estimate whether activity at FCz is driving activity at those electrodes that showed systematic coherence effects in the preceding analysis we calculated the phase difference spectra between electrode sites and estimated the slope of the phase relations across the 5- to 10-Hz frequency. We pooled the average phase differences of each subjects' electrode combinations after normalizing them to their average, and estimated the slope using linear regression analysis (see Materials and Methods section). Figure 6B illustrates that a given time difference between activity at 2 electrodes (e.g., 66.7 ms corresponding to 3.1 radians of the 5- to 10-Hz cycle) translates into a positive phase slope if the central electrode (here: FCz) is leading the second signal, and it translates into a negative phase spectral slope if it is lagging behind the second signal (see also Schoffelen et al. 2005). Across all combinations of the frontal midline electrode (FCz) with those electrode sites that showed a significant coherence effect (see Fig. 5), we found a reliable and statistically significant (P ≤ 0.05, randomization test) positive slope of 0.04 radians per Hz (2.52° per 1 Hz) between FCz activity and activity at electrode P3 (Fig. 6C), suggesting that the source of the FCz activity is driving the activity at electrode site P3. None of the phase slopes for the remaining electrode pairs showed statistically significant slopes that differed from zero.
Figure 6.
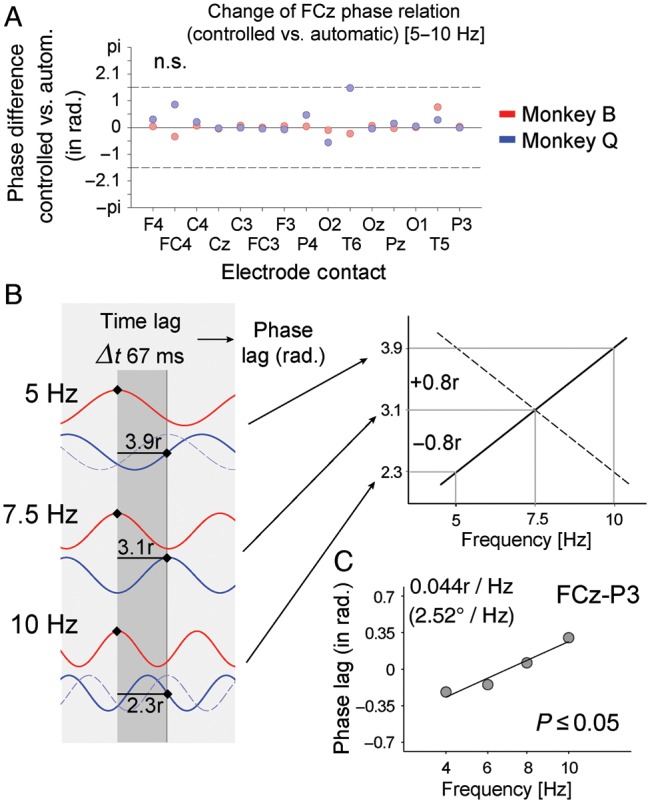
Phase differences and phase spectral analysis. (A) Shown are the phase differences of 5- to 10-Hz oscillatory activity in controlled versus automatically performed correct trials (y-axis) at electrode site FCz with all other electrode sites (x-axis). Red (blue) dots denote phase relations for monkey B (Q). No phase difference was found to be significantly different from zero (all P > 0.05). (B) Illustration of how a given time lag between oscillation cycles at 2 electrode sites (red and blue lines) at a particular frequency (here: 3.1 radians at 7.5 Hz cycle, corresponding to 66.6-ms time lag) can be interpreted as the “red” oscillation leading (driving) the “blue” oscillation if the slope of the phase spectra is increasing across frequencies. In the sketched example, the phase difference increases by 0.8 radians for the 5 Hz frequency and decreases by 0.8 radians for the 10-Hz frequency signifying a positive phase slope (right panel) and a lead of the red over the blue site. The dashed blue lines at 5 and 10 Hz illustrate the phase relations for a negative phase spectral slope, signifying that the red oscillation is driven by the blue oscillation (see also Schoffelen et al. 2005). (C) The phase spectrum for the phase relation of electrode FCz with P3. The positive slope (P ≤ 0.05, randomization test) suggests that the source giving rise to the activity at electrode FCz drives the parietal activity drives 5- to 10-Hz parietal activity (see text for details).
Discussion
We identified a large-scale 5- to 10-Hz coherent network that is instantiated during the prestimulus period of an uncued task-switching paradigm and that shows increased coherence in those trials that are processed with a controlled task performance strategy. The observed network emerged immediately after the subjects engaged in a task by fixating a central fixation point, was specific to a 5- to 10-Hz frequency band that corresponds to the classical theta frequency range, and showed a consistent topography in 2 animals, encompassing frontal midline and lateral prefrontal electrode sites and extending to central, parietal, and occipital sites. We measured the network with a variant of a task-switching paradigm that has previously been shown to probe subjects to balance task performance strategies between an automatic and a controlled processing mode (Isoda and Hikosaka 2007) with interindividually different preferences for either of these proactive behavioral control strategies (Braver 2012). This balance of task strategies was evident in both subjects in bimodal response time distributions for each of the 2 tasks involving either pro- or antisaccade SR mappings. Preparing to process task-relevant stimuli in a controlled, rather than in an automatic mode was accompanied by a significantly increased strength of phase coherence without an apparent modulation of the phase relations among synchronizing network nodes. This tightening of the network was specific to correctly performed, controlled trials and did not distinguish the type of task, nor did it differentiate trials that followed a task switch from trials preceding the task switch, and neither did it relate to finer grained variations in response times that would have been indicative of motor-related inhibitory control activity.
Long-Range Coherence at 5- to 10-Hz Indexes the Activation of Task Set Information
Our first major finding is the identification of a long-range, fronto-parietal network that starts to phase synchronize at 5–10 Hz when subjects engage in the task upon the presentation of a fixation point and before actual task-relevant stimuli are processed. The temporal evolution of the network suggests that it indexes the reactivation of task-relevant information needed to map stimuli onto responses later in the trial, consistent with a proactive cognitive control strategy that has been associated closely with activity in frontal midline structures (Hikosaka and Isoda 2010; Braver 2012). Previous fMRI and EEG studies of attentional and cognitive control have suggested that the selective retrieval and maintenance of task set information is subserved by a large-scale network comprising as central nodes the lateral prefrontal cortex, frontal midline structures (anterior cingulate and pre-SMA), and parietal areas (Dosenbach et al. 2006, 2008; Brown et al. 2007; Haynes et al. 2007; Cavanagh et al. 2009; Passingham et al. 2010; Womelsdorf, Vinck et al. 2010; Corbetta and Shulman 2011; Cohen and van Gaal 2012). The network topography that we observed is consistent with these network accounts of attentional task control, and suggests that the network is coordinated by phase-synchronized activity at a 5- to 10-Hz theta frequency range.
Previous studies have consistently reported that 5- to 10-Hz synchronization emerges during time epochs that require the retrieval of task-relevant information prior to goal-directed choice behavior (Womelsdorf, Vinck et al. 2010; Fell and Axmacher 2011). In human EEG studies, 3- to 8-Hz activity has been reported to synchronize “following” stimulus onsets between frontal midline, lateral prefrontal, and central electrode sites in tasks requiring the enhanced attentional target selection in the presence of distracting, incongruent stimulus information (Hanslmayr et al. 2008; Cavanagh et al. 2009; Cohen and Cavanagh 2011; Cohen et al. 2012), or following reward predictive cues (Cohen et al. 2012). In the rodent literature, 5–12 Hz coherence reflects the classical theta rhythm whose primary generators are inhibitory networks of the hippocampus and the medial septum, which synchronizes neuronal spiking activity in (pre-)frontal cortices, the striatum, and the parietal cortex, among others (Jones and Wilson 2005; Sirota et al. 2008; Benchenane et al. 2010; Fujisawa and Buzsaki 2011; Euston et al. 2012; Pignatelli et al. 2012). In recent years, phase synchronization at a ∼4- to 10-Hz frequency range has likewise been documented in the macaque and the human brain showing that rhythmic activity measured in the local EEG (local field potential) translates into phase-locked spiking activity of neurons within the rhythmically entrained network (Womelsdorf, Johnston et al. 2010; Liebe et al. 2012). Functionally, 4- to 10-Hz phase synchronization is thereby closely associated with the retrieval of memories, the updating of information in working memory, and the control of task set information (Jensen and Tesche 2002; Sauseng et al. 2005; Rutishauser et al. 2010; Womelsdorf, Johnston et al. 2010; Fell and Axmacher 2011; Liebe et al. 2012; Polania et al. 2012). A common theme of these putatively diverse cognitive processes that are linked to rhythmic 4–10 Hz activity is their internal origin as opposed to external, bottom-up-mediated processes (Passingham et al. 2010). Successful performance of a task requires the retrieval of SR mapping rules prior to the processing of actual stimuli. The active maintenance of SR mapping rules is a central function of working memory, which constitutes the internally sustained control structure that allows for the integration of newly incoming stimuli to update working memory content. A central question is therefore, how the internal processes that reflect the control of working memory and those that relate to the retrieval of task-rule information are coordinated. The findings of this study suggest that this coordination proceeds by the rhythmic coupling of local activities within medial prefrontal, lateral prefrontal and parietal cortex.
Functional Roles of the Frontal Midline Structures of the 5- to 10-Hz Network
The frontal midline electrode (FCz) constituted a prominent node of the preparatory network that we observed to show enhanced synchronization with lateral frontal, parietal, and occipital sites when subjects engaged in a controlled rather than automatic processing mode. Although we cannot reliably reconstruct the sources of the FCz coherence, previous studies that have used higher spatial sampling of EEG signals and have focused on stronger, local error and feedback-related signals suggest that medial frontal cortices provide a possible common regulator of 5- to 10-Hz activity that dominates multiple subcortical circuits (Pignatelli et al. 2012), and that in primate studies, the dorsal anterior cingulate and the medial presupplementary motor area (pre-SMA) are primary sources of the prefrontal midline EEG (Debener et al. 2005; Cavanagh et al. 2012). Consistent with this scenario and with the time-course of the observed preparatory network activity, local electrophysiological recordings in the macaque have documented phase coherence at ∼4–10 Hz within the anterior cingulate cortex that evolves during the preparation for a Go signal (Tsujimoto et al. 2006, 2010), with local clusters of neurons conveying selective information about either of 2 task rules by synchronizing to 5- to 10-Hz activity during the preparatory state (Womelsdorf, Johnston et al. 2010). In addition to the anterior cingulate, preparatory processes are also closely associated with activation of the pre-SMA (area 9) and with premotor cortex (Haynes et al. 2007; Hikosaka and Isoda 2010; Passingham et al. 2010). Neurons in the pre-SMA selectively activate during noninstructed, “top-down”-guided choices (Passingham et al. 2010) and are essential for the proactive implementation of new task rules and the suppression of previously used response tendencies when environmental demands vary (Nakamura et al. 2005; Hikosaka and Isoda 2010). Pre-SMA and anterior cingulate cortex are thus both implicated as major task control structures that monitor and regulate performance, particularly when task demands require adjustment, for example, when SR mappings rapidly vary as was the case in the paradigm deployed here (Isoda and Hikosaka 2007; Hikosaka and Isoda 2010).
Phase Relations of Lateral and Medial Prefrontal Cortices During Task Preparation
The discussed functional involvement of prefrontal midline areas in support of the implementation of task set information may suggest that rhythmic activity of these structures should in principle lead the coherence of other network nodes. Consistent with this hypothesis, we found that the 5- to 10-Hz oscillation cycles (each spanning ∼133 ms) at the frontal midline preceded the lateral prefrontal oscillation cycle by 40–60 ms. Phase leads in this range may be considered to reflect the directional influence of the leading to the lagging site if the phase relations at adjacent frequencies signify a positive phase spectral slope (see Fig. 6B) (Schoffelen et al. 2005; Dhamala et al. 2008). However, we did not observe a statistically consistent phase slope for the frontal midline electrode and the lateral prefrontal cortex between subjects. This may suggest that 5- to 10-Hz activity that significantly synchronizes during the preparatory state between lateral and midline prefrontal cortex areas proceeds bidirectionally. The observed phase delay corresponding to 40–60 ms is thereby not accounted for by the conduction delays of action potential travel across axonal connections (with delays of <10 ms between cingulate and dorsal prefrontal cortex). Rather, the phase delay may be due to delays in dendritic synaptic integration at slow time scales, similar to explanations invoked for phase delays of up to 80 ms that have been reported to underly theta band coherent oscillations between monosynaptically connected hippocampal, rhinal, medial frontal, or striatal sites in the rodent (Hyman et al. 2005; Jones and Wilson 2005; DeCoteau et al. 2007; Mizuseki et al. 2009; Benchenane et al. 2010). Our finding of the relative FCz phase-lead relative to F3/F4 that corresponds to 40–60 ms may therefore be interpreted with caution, but it provides a critical reference finding that future studies could disambiguate with task designs that specifically probe either lateral or medial prefrontal cortex functions.
The Role of Parietal Cortices to Coordinate With Prefrontal Cortex
The importance of identifying phase delays to unravel the relative timing of activity within a network is illustrated by our finding of a significant and short latency ∼10–17 ms phase lead of 5- to 10-Hz frontal midline activity relative to the lateral parietal electrode sites in both animals. This range of phase differences is consistent with direct interactions among neuronal groups in both areas. Consistent with this scenario, we observed a significant phase lead of the frontal midline activity at FCz over left hemisphere parietal cortex (Fig. 6C). This finding suggests that information within oscillation cycles in anterior cingulate cortex or pre-SMA conveys task relevant information prior to that conveyed in oscillation cycles within, parietal cortex, which may suggest that the frontal midline areas monitor or regulate proactive control over parietal cortex. Alternatively, the observed frontal midline phase lead may not reflect an influence over parietal cortex, but could reflect an influence over deeper sources underlying the parietal electrodes, whose locations (stereotactic XY coordinates of 1.4 mm/1 mm) overlay the posterior third of the hippocampal formation with a distance of ∼32 mm from hippocampus to the skull) (Sirota et al. 2008; Pignatelli et al. 2012).
Interestingly, the observed positive phase slope that indicates that frontal midline cortices are drivers of posterior parietal 5- to 10-Hz activity is consistent with the phase difference of ∼15 ms recently reported to characterize a prefrontal cortex lead over visual cortical area V4 during the delay period of a delayed-match-to-sample task (Liebe et al. 2012). Such a prefrontal cortex lead to establish a task control structure is likewise implicated in studies revealing that interfering with prefrontal areas (frontal eye field, inferior frontal gyrus, or dorsolateral prefrontal cortex), for example, with repetitive TMS, biases posterior cortex processing of sensory inputs and increases effective information transmission (Taylor et al. 2007; Ruff et al. 2008; Morishima et al. 2009; Zanto et al. 2011).
Summary: The Role of Neuronal Synchronization for Long-Range Coordination
In summary, we delineated a network that was characterized by 5- to 10-Hz synchronization among frontal, parietal, and occipital sites with a method that avoids spurious coherence estimates that can incur from volume conduction or correlated noise (Vinck et al. 2011). These findings implicate long-range synchronization at 5- to 10-Hz theta frequencies to index an internally generated, top-down control process that constrains the excitation periods of distributed neuronal groups to a narrow phase range of the 5- to 10-Hz theta cycle (Womelsdorf, Vinck et al. 2010). Phase-aligned neuronal activation increases the efficiency and gain of information transmission between neuronal circuitry (Fries 2005; Cardin et al. 2009; Knoblich et al. 2010; Fell and Axmacher 2011; Jensen et al. 2012; Siegel et al. 2012; Womelsdorf et al. 2012) and indexes the selective coupling among phase-synchronized neuronal assemblies (Womelsdorf et al. 2007; Buzsaki 2010). Our results suggest that such a selective coordination of information flow between distributed neuronal assemblies is a key signature of controlled, goal-directed behavior.
Funding
This work was supported by the Canadian Institutes of Health Research (CIHR-210428), the Natural Sciences and Engineering Research Council of Canada (NSERC), and the Ontario Ministry of Economic Development and Innovation (MEDI, ER11-08-140).
Notes
We thank Brian Soper for his assistance with the experiments. The funders had no role in study design, data collection and analysis, decision to publish, or preparation of the manuscript. Conflict of Interest: None declared.
References
- Arnal LH, Giraud AL. Cortical oscillations and sensory predictions. Trends Cogn Sci. 2012;16:390–398. doi: 10.3322/caac.20107. [DOI] [PubMed] [Google Scholar]
- Bastos AM, Usrey WM, Adams RA, Mangun GR, Fries P, Friston KJ. Canonical microcircuits for predictive coding. Neuron. 2012;76:695–711. doi: 10.1002/ijc.25516. [DOI] [PMC free article] [PubMed] [Google Scholar]
- Battaglia D, Witt A, Wolf F, Geisel T. Dynamic effective connectivity of inter-areal brain circuits. PLoS Comput Biol. 2012;8:e1002438. doi: 10.1056/NEJMoa0810699. [DOI] [PMC free article] [PubMed] [Google Scholar]
- Benchenane K, Peyrache A, Khamassi M, Tierney PL, Gioanni Y, Battaglia FP, Wiener SI. Coherent theta oscillations and reorganization of spike timing in the hippocampal-prefrontal network upon learning. Neuron. 2010;66:921–936. doi: 10.1016/S1470-2045(11)70184-X. [DOI] [PubMed] [Google Scholar]
- Benjamini Y, Yekutieli D. The control of the false discovery rate in multiple testing under dependency. Ann Statist. 2001;29:1165–1188. doi: 10.1038/nature05945. [DOI] [Google Scholar]
- Bollinger J, Rubens MT, Zanto TP, Gazzaley A. Expectation-driven changes in cortical functional connectivity influence working memory and long-term memory performance. J Neurosci. 2010;30:14399–14410. doi: 10.1200/JCO.2011.35.6345. [DOI] [PMC free article] [PubMed] [Google Scholar]
- Bosman CA, Schoffelen JM, Brunet N, Oostenveld R, Bastos AM, Womelsdorf T, Rubehn B, Stieglitz T, De Weerd P, Fries P. Attentional stimulus selection through selective synchronization between monkey visual areas. Neuron. 2012;75:875–888. doi: 10.1038/nm.2644. [DOI] [PMC free article] [PubMed] [Google Scholar]
- Brass M, von Cramon DY. Decomposing components of task preparation with functional magnetic resonance imaging. J Cogn Neurosci. 2004;16:609–620. doi: 10.1056/NEJMoa040938. [DOI] [PubMed] [Google Scholar]
- Brass M, von Cramon DY. The role of the frontal cortex in task preparation. Cereb Cortex. 2002;12:908–914. doi: 10.1021/jm2007613. [DOI] [PubMed] [Google Scholar]
- Braver TS. The variable nature of cognitive control: a dual mechanisms framework. Trends Cogn Sci. 2012;16:106–113. doi: 10.1158/0008-5472.CAN-07-6186. [DOI] [PMC free article] [PubMed] [Google Scholar]
- Bressler SL, Menon V. Large-scale brain networks in cognition: emerging methods and principles. Trends Cogn Sci. 2010;14:277–290. doi: 10.1056/NEJMoa1006448. [DOI] [PubMed] [Google Scholar]
- Brown MR, Vilis T, Everling S. Frontoparietal activation with preparation for antisaccades. J Neurophysiol. 2007;98:1751–1762. doi: 10.1038/nm.2658. [DOI] [PubMed] [Google Scholar]
- Buzsaki G. Neural syntax: cell assemblies, synapsembles, and readers. Neuron. 2010;68:362–385. doi: 10.1158/1078-0432.CCR-12-0550. [DOI] [PMC free article] [PubMed] [Google Scholar]
- Canolty RT, Ganguly K, Kennerley SW, Cadieu CF, Koepsell K, Wallis JD, Carmena JM. Oscillatory phase coupling coordinates anatomically dispersed functional cell assemblies. Proc Natl Acad Sci USA. 2010;107:17356–17361. doi: 10.1073/pnas.84.24.9270. [DOI] [PMC free article] [PubMed] [Google Scholar]
- Cardin JA, Carlen M, Meletis K, Knoblich U, Zhang F, Deisseroth K, Tsai LH, Moore CI. Driving fast-spiking cells induces gamma rhythm and controls sensory responses. Nature. 2009;459:663–667. doi: 10.1111/j.1538-7836.2006.02087.x. [DOI] [PMC free article] [PubMed] [Google Scholar]
- Cavanagh JF, Cohen MX, Allen JJ. Prelude to and resolution of an error: EEG phase synchrony reveals cognitive control dynamics during action monitoring. J Neurosci. 2009;29:98–105. doi: 10.1016/j.cell.2007.11.025. [DOI] [PMC free article] [PubMed] [Google Scholar]
- Cavanagh JF, Zambrano-Vazquez L, Allen JJ. Theta lingua franca: a common mid-frontal substrate for action monitoring processes. Psychophysiology. 2012;49:220–238. doi: 10.1371/journal.pone.0015640. [DOI] [PMC free article] [PubMed] [Google Scholar]
- Cohen MX, Bour L, Mantione M, Figee M, Vink M, Tijssen MA, van Rootselaar AF, van den Munckhof P, Schuurman PR, Denys D. Top-down-directed synchrony from medial frontal cortex to nucleus accumbens during reward anticipation. Hum Brain Mapp. 2012;33:246–252. doi: 10.1371/journal.pone.0028250. [DOI] [PMC free article] [PubMed] [Google Scholar]
- Cohen MX, Cavanagh JF. Single-trial regression elucidates the role of prefrontal theta oscillations in response conflict. Front Psychol. 2011;2:30. doi: 10.3389/fpsyg.2011.00030. [DOI] [PMC free article] [PubMed] [Google Scholar]
- Cohen MX, van Gaal S. Dynamic interactions between large-scale brain networks predict behavioral adaptation after perceptual errors. Cereb Cortex. 2012 doi: 10.1093/cercor/bhs069. . [Epub ahead of print]. [DOI] [PMC free article] [PubMed] [Google Scholar]
- Corbetta M, Shulman GL. Spatial neglect and attention networks. Annu Rev Neurosci. 2011;34:569–599. doi: 10.1016/j.cell.2012.08.024. [DOI] [PMC free article] [PubMed] [Google Scholar]
- Debener S, Ullsperger M, Siegel M, Fiehler K, von Cramon DY, Engel AK. Trial-by-trial coupling of concurrent electroencephalogram and functional magnetic resonance imaging identifies the dynamics of performance monitoring. J Neurosci. 2005;25:11730–11737. doi: 10.1101/gr.145144.112. [DOI] [PMC free article] [PubMed] [Google Scholar]
- DeCoteau WE, Thorn C, Gibson DJ, Courtemanche R, Mitra P, Kubota Y, Graybiel AM. Learning-related coordination of striatal and hippocampal theta rhythms during acquisition of a procedural maze task. Proc Natl Acad Sci USA. 2007;104:5644–5649. doi: 10.1093/annonc/mds391. [DOI] [PMC free article] [PubMed] [Google Scholar]
- Dhamala M, Rangarajan G, Ding M. Analyzing information flow in brain networks with nonparametric Granger causality. Neuroimage. 2008;41:354–362. doi: 10.1371/journal.pone.0028204. [DOI] [PMC free article] [PubMed] [Google Scholar]
- Dosenbach NU, Fair DA, Cohen AL, Schlaggar BL, Petersen SE. A dual-networks architecture of top-down control. Trends Cogn Sci. 2008;12:99–105. doi: 10.1245/s10434-012-2553-6. [DOI] [PMC free article] [PubMed] [Google Scholar]
- Dosenbach NU, Fair DA, Miezin FM, Cohen AL, Wenger KK, Dosenbach RA, Fox MD, Snyder AZ, Vincent JL, Raichle ME, et al. Distinct brain networks for adaptive and stable task control in humans. Proc Natl Acad Sci USA. 2007;104:11073–11078. doi: 10.1038/nature11404. [DOI] [PMC free article] [PubMed] [Google Scholar]
- Dosenbach NU, Visscher KM, Palmer ED, Miezin FM, Wenger KK, Kang HC, Burgund ED, Grimes AL, Schlaggar BL, Petersen SE. A core system for the implementation of task sets. Neuron. 2006;50:799–812. doi: 10.1016/j.neuron.2006.04.031. [DOI] [PMC free article] [PubMed] [Google Scholar]
- Efron B, Tibshirani RJ. An introduction to the bootstrap. London: Chapman & Hall/CRC; 1998. [Google Scholar]
- Euston DR, Gruber AJ, McNaughton BL. The role of medial prefrontal cortex in memory and decision making. Neuron. 2012;76:1057–1070. doi: 10.1016/j.neuron.2012.12.002. [DOI] [PMC free article] [PubMed] [Google Scholar]
- Ewald A, Aristei S, Nolte G, Rahman RA. Brain oscillations and functional connectivity during overt language production. Front Psychol. 2012;3:166. doi: 10.3389/fpsyg.2012.00166. [DOI] [PMC free article] [PubMed] [Google Scholar]
- Fell J, Axmacher N. The role of phase synchronization in memory processes. Nat Rev Neurosci. 2011;12:105–118. doi: 10.1038/nrn2979. [DOI] [PubMed] [Google Scholar]
- Fries P. A mechanism for cognitive dynamics: neuronal communication through neuronal coherence. Trends Cogn Sci. 2005;9:474–480. doi: 10.1016/j.tics.2005.08.011. [DOI] [PubMed] [Google Scholar]
- Fujisawa S, Buzsaki G. A 4 Hz oscillation adaptively synchronizes prefrontal, VTA, and hippocampal activities. Neuron. 2011;72:153–165. doi: 10.1016/j.neuron.2011.08.018. [DOI] [PMC free article] [PubMed] [Google Scholar]
- Genovese CR, Lazar NA, Nichols T. Thresholding of statistical maps in functional neuroimaging using the false discovery rate. Neuroimage. 2002;15:870–878. doi: 10.1006/nimg.2001.1037. [DOI] [PubMed] [Google Scholar]
- Gregoriou GG, Gotts SJ, Zhou H, Desimone R. High-frequency, long-range coupling between prefrontal and visual cortex during attention. Science. 2009;324:1207–1210. doi: 10.1126/science.1171402. [DOI] [PMC free article] [PubMed] [Google Scholar]
- Groppe DM, Urbach TP, Kutas M. Mass univariate analysis of event-related brain potentials/fields I: a critical tutorial review. Psychophysiology. 2011;48:1711–1725. doi: 10.1111/j.1469-8986.2011.01273.x. [DOI] [PMC free article] [PubMed] [Google Scholar]
- Hanslmayr S, Pastotter B, Bauml KH, Gruber S, Wimber M, Klimesch W. The electrophysiological dynamics of interference during the Stroop task. J Cogn Neurosci. 2008;20:215–225. doi: 10.1162/jocn.2008.20020. [DOI] [PubMed] [Google Scholar]
- Haufe S, Nikulin VV, Muller KR, Nolte G. A critical assessment of connectivity measures for EEG data: a simulation study. Neuroimage. 2013;64:120–133. doi: 10.1016/j.neuroimage.2012.09.036. [DOI] [PubMed] [Google Scholar]
- Haynes JD, Sakai K, Rees G, Gilbert S, Frith C, Passingham RE. Reading hidden intentions in the human brain. Curr Biol. 2007;17:323–328. doi: 10.1016/j.cub.2006.11.072. [DOI] [PubMed] [Google Scholar]
- Hikosaka O, Isoda M. Switching from automatic to controlled behavior: cortico-basal ganglia mechanisms. Trends Cogn Sci. 2010;14:154–161. doi: 10.1016/j.tics.2010.01.006. [DOI] [PMC free article] [PubMed] [Google Scholar]
- Hipp JF, Engel AK, Siegel M. Oscillatory synchronization in large-scale cortical networks predicts perception. Neuron. 2011;69:387–396. doi: 10.1016/j.neuron.2010.12.027. [DOI] [PubMed] [Google Scholar]
- Hipp JF, Hawellek DJ, Corbetta M, Siegel M, Engel AK. Large-scale cortical correlation structure of spontaneous oscillatory activity. Nat Neurosci. 2012;15:884–890. doi: 10.1038/nn.3101. [DOI] [PMC free article] [PubMed] [Google Scholar]
- Hutchison RM, Womelsdorf T, Gati JS, Leung LS, Menon RS, Everling S. Resting-state connectivity identifies distinct functional networks in macaque cingulate cortex. Cereb Cortex. 2012;22:1294–1308. doi: 10.1093/cercor/bhr181. [DOI] [PubMed] [Google Scholar]
- Hyman JM, Zilli EA, Paley AM, Hasselmo ME. Medial prefrontal cortex cells show dynamic modulation with the hippocampal theta rhythm dependent on behavior. Hippocampus. 2005;15:739–749. doi: 10.1002/hipo.20106. [DOI] [PubMed] [Google Scholar]
- Isoda M, Hikosaka O. Role for subthalamic nucleus neurons in switching from automatic to controlled eye movement. J Neurosci. 2008;28:7209–7218. doi: 10.1523/JNEUROSCI.0487-08.2008. [DOI] [PMC free article] [PubMed] [Google Scholar]
- Isoda M, Hikosaka O. Switching from automatic to controlled action by monkey medial frontal cortex. Nat Neurosci. 2007;10:240–248. doi: 10.1038/nn1830. [DOI] [PubMed] [Google Scholar]
- Jensen O, Bonnefond M, VanRullen R. An oscillatory mechanism for prioritizing salient unattended stimuli. Trends Cogn Sci. 2012;16:200–206. doi: 10.1016/j.tics.2012.03.002. [DOI] [PubMed] [Google Scholar]
- Jensen O, Tesche CD. Frontal theta activity in humans increases with memory load in a working memory task. Eur J Neurosci. 2002;15:1395–1399. doi: 10.1046/j.1460-9568.2002.01975.x. [DOI] [PubMed] [Google Scholar]
- Johnston K, Levin HM, Koval MJ, Everling S. Top-down control-signal dynamics in anterior cingulate and prefrontal cortex neurons following task switching. Neuron. 2007;53:453–462. doi: 10.1016/j.neuron.2006.12.023. [DOI] [PubMed] [Google Scholar]
- Jones MW, Wilson MA. Theta rhythms coordinate hippocampal-prefrontal interactions in a spatial memory task. PLoS Biol. 2005;3:e402. doi: 10.1371/journal.pbio.0030402. [DOI] [PMC free article] [PubMed] [Google Scholar]
- Kable JW, Glimcher PW. The neurobiology of decision: consensus and controversy. Neuron. 2009;63:733–745. doi: 10.1016/j.neuron.2009.09.003. [DOI] [PMC free article] [PubMed] [Google Scholar]
- Kaping D, Vinck M, Hutchison RM, Everling S, Womelsdorf T. Specific contributions of ventromedial, anterior cingulate, and lateral prefrontal cortex for attentional selection and stimulus valuation. PLoS Biol. 2011;9:e1001224. doi: 10.1371/journal.pbio.1001224. [DOI] [PMC free article] [PubMed] [Google Scholar]
- Kennerley SW, Walton ME, Behrens TE, Buckley MJ, Rushworth MF. Optimal decision making and the anterior cingulate cortex. Nat Neurosci. 2006;9:940–947. doi: 10.1038/nn1724. [DOI] [PubMed] [Google Scholar]
- Knoblich U, Siegle JH, Pritchett DL, Moore CI. What do we gain from gamma? Local dynamic gain modulation drives enhanced efficacy and efficiency of signal transmission. Front Hum Neurosci. 2010;4:185. doi: 10.3389/fnhum.2010.00185. [DOI] [PMC free article] [PubMed] [Google Scholar]
- Koechlin E, Hyafil A. Anterior prefrontal function and the limits of human decision-making. Science. 2007;318:594–598. doi: 10.1126/science.1142995. [DOI] [PubMed] [Google Scholar]
- Korn EL, Troendle JF, McShane LM, Simon R. Controlling the number of false discoveries: application to high-dimensional genomic data. J Stat Plan Inference. 2004;124:379–398. [Google Scholar]
- Liebe S, Hoerzer GM, Logothetis NK, Rainer G. Theta coupling between V4 and prefrontal cortex predicts visual short-term memory performance. Nat Neurosci. 2012;15:456–462. doi: 10.1038/nn.3038. [DOI] [PubMed] [Google Scholar]
- Miller KJ, Hermes D, Honey CJ, Hebb AO, Ramsey NF, Knight RT, Ojemann JG, Fetz EE. Human motor cortical activity is selectively phase-entrained on underlying rhythms. PLoS Comput Biol. 2012;8:e1002655. doi: 10.1371/journal.pcbi.1002655. [DOI] [PMC free article] [PubMed] [Google Scholar]
- Mizuseki K, Sirota A, Pastalkova E, Buzsaki G. Theta oscillations provide temporal windows for local circuit computation in the entorhinal-hippocampal loop. Neuron. 2009;64:267–280. doi: 10.1016/j.neuron.2009.08.037. [DOI] [PMC free article] [PubMed] [Google Scholar]
- Morishima Y, Akaishi R, Yamada Y, Okuda J, Toma K, Sakai K. Task-specific signal transmission from prefrontal cortex in visual selective attention. Nat Neurosci. 2009;12:85–91. doi: 10.1038/nn.2237. [DOI] [PubMed] [Google Scholar]
- Nakamura K, Roesch MR, Olson CR. Neuronal activity in macaque SEF and ACC during performance of tasks involving conflict. J Neurophysiol. 2005;93:884–908. doi: 10.1152/jn.00305.2004. [DOI] [PubMed] [Google Scholar]
- Nolte G, Bai O, Wheaton L, Mari Z, Vorbach S, Hallett M. Identifying true brain interaction from EEG data using the imaginary part of coherency. Clin Neurophysiol. 2004;115:2292–2307. doi: 10.1016/j.clinph.2004.04.029. [DOI] [PubMed] [Google Scholar]
- Palva JM, Monto S, Kulashekhar S, Palva S. Neuronal synchrony reveals working memory networks and predicts individual memory capacity. Proc Natl Acad Sci USA. 2010;107:7580–7585. doi: 10.1073/pnas.0913113107. [DOI] [PMC free article] [PubMed] [Google Scholar]
- Palva S, Monto S, Palva JM. Graph properties of synchronized cortical networks during visual working memory maintenance. Neuroimage. 2010;49:3257–3268. doi: 10.1016/j.neuroimage.2009.11.031. [DOI] [PubMed] [Google Scholar]
- Passingham RE, Bengtsson SL, Lau HC. Medial frontal cortex: from self-generated action to reflection on one's own performance. Trends Cogn Sci. 2010;14:16–21. doi: 10.1016/j.tics.2009.11.001. [DOI] [PMC free article] [PubMed] [Google Scholar]
- Paxinos G, Huang X-F, Toga AW. The rhesus monkey brain in stereotaxic coordinates. San Diego: Academic Press; 2000. [Google Scholar]
- Petersen SE, Posner MI. The attention system of the human brain: 20 years after. Annu Rev Neurosci. 2012;35:73–89. doi: 10.1146/annurev-neuro-062111-150525. [DOI] [PMC free article] [PubMed] [Google Scholar]
- Pignatelli M, Beyeler A, Leinekugel X. Neural circuits underlying the generation of theta oscillations. J Physiol Paris. 2012;106:81–92. doi: 10.1016/j.jphysparis.2011.09.007. [DOI] [PubMed] [Google Scholar]
- Polania R, Nitsche MA, Korman C, Batsikadze G, Paulus W. The importance of timing in segregated theta phase-coupling for cognitive performance. Curr Biol. 2012;22:1314–1318. doi: 10.1016/j.cub.2012.05.021. [DOI] [PubMed] [Google Scholar]
- Ruff CC, Bestmann S, Blankenburg F, Bjoertomt O, Josephs O, Weiskopf N, Deichmann R, Driver J. Distinct causal influences of parietal versus frontal areas on human visual cortex: evidence from concurrent TMS-fMRI. Cereb Cortex. 2008;18:817–827. doi: 10.1093/cercor/bhm128. [DOI] [PMC free article] [PubMed] [Google Scholar]
- Rutishauser U, Ross IB, Mamelak AN, Schuman EM. Human memory strength is predicted by theta-frequency phase-locking of single neurons. Nature. 2010;464:903–907. doi: 10.1038/nature08860. [DOI] [PubMed] [Google Scholar]
- Salazar RF, Dotson NM, Bressler SL, Gray CM. Content-specific fronto-parietal synchronization during visual working memory. Science. 2012;338:1097–1100. doi: 10.1126/science.1224000. [DOI] [PMC free article] [PubMed] [Google Scholar]
- Sander V, Soper B, Everling S. Nonhuman primate event-related potentials associated with pro- and anti-saccades. Neuroimage. 2010;49:1650–1658. doi: 10.1016/j.neuroimage.2009.09.038. [DOI] [PubMed] [Google Scholar]
- Sarnthein J, Petsche H, Rappelsberger P, Shaw GL, von Stein A. Synchronization between prefrontal and posterior association cortex during human working memory. Proc Natl Acad Sci USA. 1998;95:7092–7096. doi: 10.1073/pnas.95.12.7092. [DOI] [PMC free article] [PubMed] [Google Scholar]
- Sauseng P, Klimesch W, Schabus M, Doppelmayr M. Fronto-parietal EEG coherence in theta and upper alpha reflect central executive functions of working memory. Int J Psychophysiol. 2005;57:97–103. doi: 10.1016/j.ijpsycho.2005.03.018. [DOI] [PubMed] [Google Scholar]
- Schoffelen JM, Oostenveld R, Fries P. Neuronal coherence as a mechanism of effective corticospinal interaction. Science. 2005;308:111–113. doi: 10.1126/science.1107027. [DOI] [PubMed] [Google Scholar]
- Siegel M, Donner TH, Engel AK. Spectral fingerprints of large-scale neuronal interactions. Nat Rev Neurosci. 2012;13:121–134. doi: 10.1038/nrn3137. [DOI] [PubMed] [Google Scholar]
- Sirota A, Montgomery S, Fujisawa S, Isomura Y, Zugaro M, Buzsaki G. Entrainment of neocortical neurons and gamma oscillations by the hippocampal theta rhythm. Neuron. 2008;60:683–697. doi: 10.1016/j.neuron.2008.09.014. [DOI] [PMC free article] [PubMed] [Google Scholar]
- Stam CJ, Nolte G, Daffertshofer A. Phase lag index: assessment of functional connectivity from multi channel EEG and MEG with diminished bias from common sources. Hum Brain Mapp. 2007;28:1178–1193. doi: 10.1002/hbm.20346. [DOI] [PMC free article] [PubMed] [Google Scholar]
- Summerfield C, Egner T. Expectation (and attention) in visual cognition. Trends Cogn Sci. 2009;13:403–409. doi: 10.1016/j.tics.2009.06.003. [DOI] [PubMed] [Google Scholar]
- Taylor PC, Nobre AC, Rushworth MF. FEF TMS affects visual cortical activity. Cereb Cortex. 2007;17:391–399. doi: 10.1093/cercor/bhj156. [DOI] [PubMed] [Google Scholar]
- Tsujimoto T, Shimazu H, Isomura Y. Direct recording of theta oscillations in primate prefrontal and anterior cingulate cortices. J Neurophysiol. 2006;95:2987–3000. doi: 10.1152/jn.00730.2005. [DOI] [PubMed] [Google Scholar]
- Tsujimoto T, Shimazu H, Isomura Y, Sasaki K. Theta oscillations in primate prefrontal and anterior cingulate cortices in forewarned reaction time tasks. J Neurophysiol. 2010;103:827–843. doi: 10.1152/jn.00358.2009. [DOI] [PubMed] [Google Scholar]
- Vinck M, Oostenveld R, van Wingerden M, Battaglia F, Pennartz CM. An improved index of phase-synchronization for electrophysiological data in the presence of volume-conduction, noise and sample-size bias. Neuroimage. 2011;55:1548–1565. doi: 10.1016/j.neuroimage.2011.01.055. [DOI] [PubMed] [Google Scholar]
- Wang XJ. Decision making in recurrent neuronal circuits. Neuron. 2008;60:215–234. doi: 10.1016/j.neuron.2008.09.034. [DOI] [PMC free article] [PubMed] [Google Scholar]
- Womelsdorf T, Johnston K, Vinck M, Everling S. Theta-activity in anterior cingulate cortex predicts task rules and their adjustments following errors. Proc Natl Acad Sci USA. 2010;107:5248–5253. doi: 10.1073/pnas.0906194107. [DOI] [PMC free article] [PubMed] [Google Scholar]
- Womelsdorf T, Lima B, Vinck M, Oostenveld R, Singer W, Neuenschwander S, Fries P. Orientation selectivity and noise correlation in awake monkey area V1 are modulated by the gamma cycle. Proc Natl Acad Sci USA. 2012;109:4302–4307. doi: 10.1073/pnas.1114223109. [DOI] [PMC free article] [PubMed] [Google Scholar]
- Womelsdorf T, Schoffelen JM, Oostenveld R, Singer W, Desimone R, Engel AK, Fries P. Modulation of neuronal interactions through neuronal synchronization. Science. 2007;316:1609–1612. doi: 10.1126/science.1139597. [DOI] [PubMed] [Google Scholar]
- Womelsdorf T, Vinck M, Leung LS, Everling S. Selective theta-synchronization of choice-relevant information subserves goal-directed behavior. Front Hum Neurosci. 2010;4:210. doi: 10.3389/fnhum.2010.00210. [DOI] [PMC free article] [PubMed] [Google Scholar]
- Woodman GF, Kang MS, Rossi AF, Schall JD. Nonhuman primate event-related potentials indexing covert shifts of attention. Proc Natl Acad Sci USA. 2007;104:15111–15116. doi: 10.1073/pnas.0703477104. [DOI] [PMC free article] [PubMed] [Google Scholar]
- Zanto TP, Rubens MT, Thangavel A, Gazzaley A. Causal role of the prefrontal cortex in top-down modulation of visual processing and working memory. Nat Neurosci. 2011;14:656–661. doi: 10.1038/nn.2773. [DOI] [PMC free article] [PubMed] [Google Scholar]