An Imp3–Mpp10 complex involved in yeast ribosome assembly has been crystallized.
Keywords: ribosome synthesis, Imp3, Mpp10, 90S pre-ribosome, Saccharomyces cerevisiae
Abstract
Eukaryotic ribosome synthesis requires a vast number of transiently associated factors. Mpp10, Imp3 and Imp4 form a protein complex in the 90S pre-ribosomal particle that conducts early processing of 18S rRNA. Here, a short fragment of Mpp10 was identified to associate with and increase the solubility of Imp3. An Imp3–Mpp10 complex was co-expressed, co-purified and co-crystallized. Preliminary X-ray diffraction analysis revealed that the crystal diffracted to 2.1 Å resolution and belonged to space group P212121, with unit-cell parameters a = 51.6, b = 86.9, c = 88.7 Å.
1. Introduction
Eukaryotic ribosome biogenesis is a highly complicated process that requires a large number of trans-acting proteins and small nucleolar (sno) RNAs (Woolford & Baserga, 2013 ▶). These factors transiently associate with small and large ribosomal subunits to drive their maturation. In the most studied organism Saccharomyces cerevisiae, ribosome synthesis begins in the nucleolus with the transcription of a long 35S pre-rRNA by RNA polymerase I. The pre-rRNA is extensively modified and processed to generate 18S rRNA in the small subunit and 5.8S and 25S rRNA in the large subunit.
The 5′ part of pre-rRNA that includes the 5′-external transcribed spacer (5′-ETS), 18S rRNA and internal transcribed spacer 1 (ITS1) regions is co-transcriptionally packed into a large ∼40 nm particle which is called the 90S pre-ribosome or small subunit processome (Phipps et al., 2011 ▶). Within the 90S pre-ribosome, the pre-rRNA is processed at the A0, A1 and A2 sites, releasing a pre-40S particle that eventually matures into the small subunit. The remaining part of the pre-rRNA is packed into pre-60S particles that develop into the large subunit.
The 90S pre-ribosome is an enormous RNA–protein complex that contains the 35S pre-rRNA, U3 snoRNA, about 50 assembly factors and a subset of 40S ribosomal proteins (Grandi et al., 2002 ▶; Dragon et al., 2002 ▶). U3 snoRNA forms multiple base-pairing interactions with the 5′-ETS and 18S regions of pre-rRNA and is essential for 90S formation and early processing of 18S rRNA. Among the 90S factors are Mpp10 and its binding partners Imp3 and Imp4 (Lee & Baserga, 1999 ▶; Dunbar et al., 1997 ▶). Sequence analysis suggests that Mpp10 contains several putative coiled-coil regions but no other recognizable domains. Imp3 is a member of the S4 RNA-binding domain superfamily that includes ribosomal proteins S4 in bacteria and S9 in eukaryotes (Davies et al., 1998 ▶; Ben-Shem et al., 2011 ▶). Imp4 belongs to the Imp4/Brix superfamily and the other four members of this family are involved in the assembly of the large ribosomal subunit (Wehner & Baserga, 2002 ▶). Imp3 and Imp4 display RNA-binding activities in vitro and it has been proposed that they facilitate hybridization between U3 snoRNA and pre-rRNA (Shah et al., 2013 ▶; Gérczei et al., 2009 ▶; Gérczei & Correll, 2004 ▶). Residues of Mpp10 that interact with Imp3 and Imp4 have been mapped to two adjacent regions in the human equivalents of these proteins (Granneman et al., 2003 ▶).
Structural characterization of assembly factors and pre-ribosomal particles is an important step to elucidate the mechanism of ribosome assembly. To gain insight into the mechanism of the early assembly of the small subunit, we have undertaken structural analysis of 90S factors. Here, we report the preparation and crystallization of Imp3 in complex with a short fragment of Mpp10.
2. Materials and methods
2.1. Cloning, expression and purification
The original genes of Imp3 (a total of 183 residues) and Mpp10 (a total of 593 residues) were amplified from yeast genomic DNA. Imp3 and its fragment 26–183 were cloned into a modified pET-28a vector (Novagen) with an N-terminal His6-SMT3 tag. Mpp10 fragments were cloned into a modified pETDuet-1 vector with an N-terminal His6-GST tag followed by a PreScission cleavage site. Gene cloning was conducted with the transfer-PCR approach (Erijman et al., 2011 ▶). The constructed plasmids were verified by DNA sequencing.
Plasmids encoding Imp3 and Mpp10 were co-transformed into Escherichia coli Rosetta 2(DE3) strain (Novagen). Bacteria were grown in LB medium supplemented with 50 µg ml−1 ampicillin and 50 µg ml−1 kanamycin at 37°C to an OD600 of 0.8. The culture was then cooled to 16°C and induced for protein expression with 0.5 mM isopropyl β-d-1-thiogalactopyranoside for 16 h. Proteins were labelled with selenomethionine (SeMet) in M9 medium as described previously (Van Duyne et al., 1993 ▶).
All purification steps were carried out at 4°C. Cells were harvested by centrifugation, resuspended in buffer A (50 mM Tris–HCl pH 8.0, 500 mM NaCl) and lysed by sonication. The clarified lysate was loaded onto a HisTrap column (GE Healthcare), followed by washing with 50 mM imidazole in buffer A. The target protein was eluted with 500 mM imidazole in buffer A and incubated with Ulp1 and PreScission proteases overnight to cleave the His6-SMT3 tag of Imp3 and the His6-GST tag of Mpp10, respectively. The reaction mixture was diluted twofold with 25 mM HEPES–KOH pH 7.6 and loaded onto a heparin column (GE Healthcare). The protein complex was eluted using a 0.2–1 M KCl linear gradient in 25 mM HEPES–KOH pH 7.6. The protein complex was collected, concentrated with 10 kDa cutoff ultrafiltration devices (Amicon) and further purified using a Superdex 75 column in 10 mM Tris–HCl pH 8.0, 300 mM NaCl. Samples were concentrated to 16 mg ml−1 and stored at −80°C. The final yield was about 2 mg protein complex per litre of culture. Protein concentrations were determined by absorbance spectroscopy with a calculated molar extinction coefficient of 19 035 M −1 cm−1 at 280 nm. Macromolecule-production information is given in Table 1 ▶.
Table 1. Macromolecule-production information.
The residues in the final protein after tag removal are underlined.
| Source organism | Saccharomyces cerevisiae |
| DNA source | Genomic DNA |
| Imp3 26–183 | |
| Forward primer | GAACAGATTGGTGGATCCGGCCACCGGGACACTCAG |
| Reverse primer | CGACGGAGCTCGAATTATGAAAAATCAAAATCGTC |
| Expression vector | pET-28a-His-SMT3 |
| Expression host | Rosetta 2(DE3) |
| Complete amino-acid sequence of the construct produced | MGSSHHHHHHSSGLVPRGSHMASMSDSEVNQEAKPEVKPEVKPETHINLKVSDGSSEIFFKIKKTTPLRRLMEAFAKRQGKEMDSLRFLYDGIRIQADQTPEDLDMEDNDIIEAHREQIGGSGHRDTQVMRTYHIQNREDYHKYNRICGDIRRLANKLSLLPPTDPFRRKHEQLLLDKLYAMGVLTTKSKISDLENKVTVSAICRRRLPVIMHRLKMAETIQDAVKFIEQGHVRVGPNLINDPAYLVTRNMEDYVTWVDNSKIKKTLLRYRNQIDDFDFS |
| Mpp10 430–461 | |
| Forward primer | AAGTTCTGTTCCAGGGGCCCCTTCAAAAGGCACATTCC |
| Reverse primer | GCCGCAAGCTGAATTAAGGTTGAGCATCCTCCAT |
| Expression vector | pETDuet-His-GST |
| Expression host | Rosetta 2(DE3) |
| Complete amino-acid sequence of the construct produced | MGSSHHHHHHSQDPMSPILGYWKIKGLVQPTRLLLEYLEEKYEEHLYERDEGDKWRNKKFELGLEFPNLPYYIDGDVKLTQSMAIIRYIADKHNMLGGCPKERAEISMLEGAVLDIRYGVSRIAYSKDFETLKVDFLSKLPEMLKMFEDRLCHKTYLNGDHVTHPDFMLYDALDVVLYMDPMCLDAFPKLVCFKKRIEAIPQIDKYLKSSKYIAWPLQGWQATFGGGDHPPKSDLEVLFQGPLQKAHSEISELYANLVYKLDVLSSVHFVPKPA |
2.2. GST pull-down
His6-SMT3-Imp3 was co-expressed with a His6-GST-Mpp10 fragment in E. coli Rosetta 2(DE3) (Novagen) cells. The cells (100 ml) were collected and resuspended in 10 ml buffer A. After sonication and centrifugal clarification, the supernatant was incubated with 30 µl of Ni beads to capture both the Imp3 and Mpp10 proteins. After the Ni beads had been washed twice with 10 ml 50 mM imidazole in buffer A, the bound protein was eluted with 400 µl 500 mM imidazole in buffer A. The eluate from the Ni beads was used as input for GST pull-down. In some cases where the two proteins migrate at similar rates on SDS–PAGE, the His6-SMT3 tag of Imp3 was cleaved with Ulp1 before GST pull-down. The sample was incubated with 20 µl glutathione Sepharose beads and gently rotated for 1 h at 4°C. The beads were washed three times with buffer A and the protein was eluted with 10 mM glutathione in buffer A. His6-SMT3-Imp3 alone was used as a negative control. The input and eluate of pull-down were separated using SDS–PAGE followed by Coomassie Blue staining.
2.3. Crystallization
Crystallization conditions for the Imp3 26–183 and Mpp10 430–461 complex were screened at 20°C using sitting-drop vapour diffusion with a Mosquito crystallization robot (TTP Labtech) and commercial kits from Hampton Research. Drops were formed by mixing 0.2 µl protein solution and 0.2 µl reservoir solution. The crystal grew initially from 0.2 M potassium sodium tartrate, 0.1 M sodium citrate pH 5.6, 2.0 M ammonium sulfate. The crystallization condition was optimized using hanging drops consisting of 1 µl each of protein and reservoir solutions equilibrated against 0.5 ml reservoir solution. The best crystal grew at 1.6–1.8 M ammonium sulfate pH 5.0. Crystallization information is given in Table 2 ▶.
Table 2. Crystallization.
| Method | Hanging-drop vapour diffusion |
| Plate type | 24-well hanging-drop plate |
| Temperature (°C) | 20 |
| Protein concentration (mg ml−1) | 16 |
| Buffer composition of protein solution | 10 mM Tris–HCl pH 8.0, 300 mM NaCl |
| Composition of reservoir solution | 0.2 M potassium sodium tartrate, 0.1 M sodium citrate pH 5.0, 1.7 M ammonium sulfate |
| Volume and ratio of drop | 2 µl, 1:1 |
| Volume of reservoir (µl) | 500 |
2.4. Data collection and processing
The crystals were cryoprotected in the reservoir solution supplemented with 20%(v/v) glycerol and were flash-cooled in liquid nitrogen. Diffraction data were collected from a SeMet-labelled crystal at −173°C on Shanghai Synchrotron Radiation Facility (SSRF) beamline BL17U. The data were processed using DENZO, SCALEPACK and SDS (Otwinowski & Minor, 1997 ▶; Kabsch, 2010 ▶). Data-collection and processing statistics are given in Table 3 ▶.
Table 3. Data collection and processing.
Values in parentheses are for the outer shell.
| Diffraction source | BL17U, SSRF |
| Wavelength (Å) | 0.97915 |
| Temperature (°C) | −173 |
| Detector | ADSC Q315 |
| Crystal-to-detector distance (mm) | 300 |
| Rotation range per image (°) | 1 |
| Total rotation range (°) | 190 |
| Exposure time per image (s) | 1 |
| Space group | P212121 |
| a, b, c (Å) | 51.6, 86.9, 88.7 |
| α, β, γ (°) | 90, 90, 90 |
| Mosaicity (°) | 0.408 |
| Resolution range (Å) | 50–2.1 (2.23–2.1) |
| Total No. of reflections | 182235 |
| No. of unique reflections | 44837 |
| Completeness (%) | 99.8 (99.1) |
| Multiplicity | 4.06 (3.00) |
| 〈I/σ(I)〉 | 8.74 (2.47) |
| CC1/2 | 0.992 (0.687) |
| R r.i.m. | 0.186 (0.894) |
| Overall B factor from Wilson plot (Å2) | 30.5 |
3. Results and discussion
The Imp3 protein was previously purified from inclusion bodies and renatured for biochemical assay (Gérczei & Correll, 2004 ▶). We also observed that His6-tagged Imp3 was insoluble when expressed in E. coli. We found that Imp3 can be expressed in soluble form when fused to a His6-SMT3 tag, which generally enhances protein solubility (Mossessova & Lima, 2000 ▶). However, most of Imp3 protein precipitated after removal of the tag, indicating that Imp3 alone has intrinsic poor solubility.
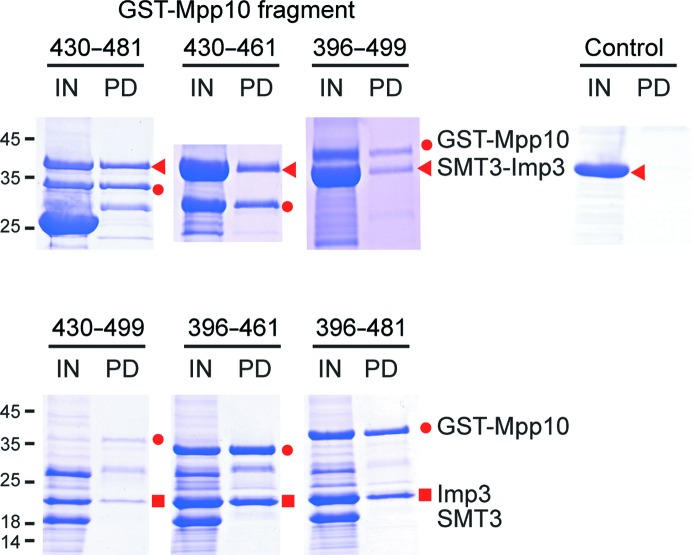
We reasoned that solubility of Imp3 may be improved when it binds to Mpp10. The Imp3-binding region has been mapped to residues 456–565 of human Mpp10 (Granneman et al., 2003 ▶), which correspond to residues 396–516 of yeast Mpp10. We co-expressed Imp3 with GST-tagged Mpp10 396–499 and found that Imp3 could be pulled-down with glutathione Sepharose beads, indicating that Imp3 and the Mpp10 fragment indeed form a complex (Fig. 1 ▶). To identify a minimal Imp3-binding region, we further truncated the Mpp10 fragment from both ends. The Imp3-binding activity was preserved when the N-terminus of Mpp10 was shortened to residue 430 and when the C-terminus of Mpp10 was truncated to residues 481 and 461 (Fig. 1 ▶). Importantly, the Imp3–Mpp10 complex did not precipitate after removal of the His6-SMT3 tag of Imp3. Therefore, we identified a small peptide of Mpp10 consisting of residues 430–461 that is capable of binding Imp3 and increasing its solubility.
Figure 1.
Mapping the Imp3-binding region of Mpp10 by GST pull-down assay. His6-SMT3-tagged Imp3 and the indicated His6-GST-tagged Mpp10 fragment were co-expressed and purified using Ni beads. The Ni-bead eluate was pulled-down with glutathione Sepharose beads. His6-SMT3-Imp3 protein alone was used as a negative control. The input (IN) and eluate (PD) of the pull-down assay were analyzed by SDS–PAGE and Coomassie Blue staining. The input samples in the lower panel were additionally incubated with Ulp1 to cleave the His6-SMT3 tag of Imp3 prior to pull-down. The positions of molecular standards are indicated on the left in kDa.
During protein purification, we observed that Imp3 was degraded to products with an approximately 3 kDa lower molecular mass. Sequence analysis and secondary-structure prediction suggest that the N-terminal region of Imp3 was likely to be degraded. To facilitate crystallization, we made an N-terminal truncation of Imp3 with residues 26–183.
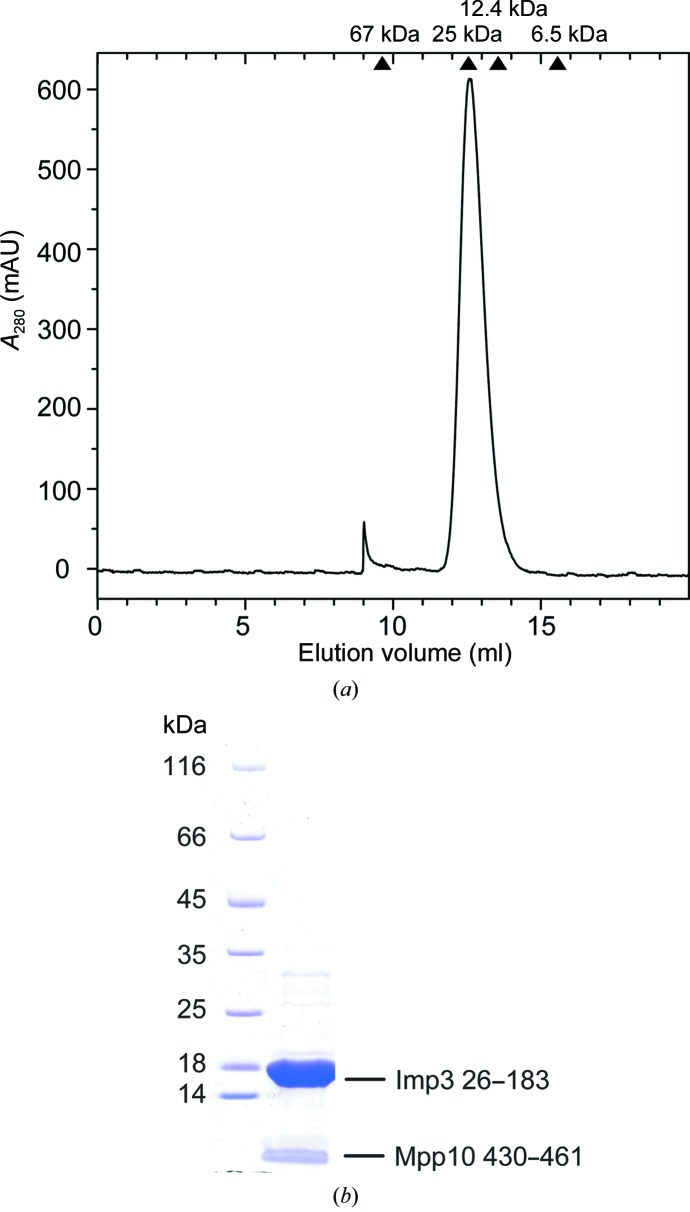
Imp3 26–183 and Mpp10 430–461 were co-expressed and co-purified via affinity, cation-exchange and size-exclusion chromatography. The two proteins co-eluted from size-exclusion chromatography as a single species that has an apparent molecular weight of ∼ 25 kDa (Fig. 2 ▶ a). They are most likely to form a 1:1 heterodimer given that the theoretical molecular weight of Imp3 26–183 is 18.7 kDa and that of Mpp10 430–461 3.6 kDa.
Figure 2.
(a) The gel-filtration profile of Imp3 26–183 in complex with Mpp10 430–461 eluted from a Superdex 75 column. The elution positions of reference proteins are indicated. (b) The purity of the complex was analyzed by a 4–20% gradient SDS–PAGE gel and Coomassie Blue staining.
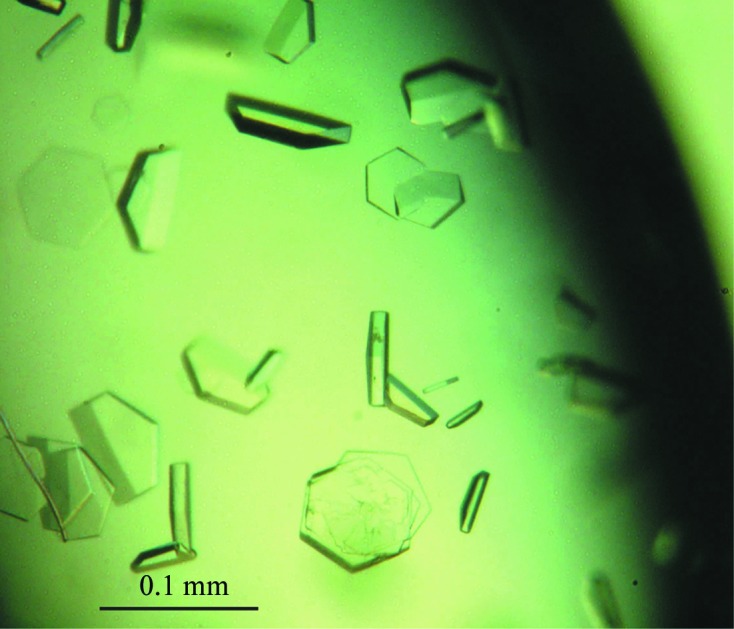
The purified Imp3–Mpp10 complex was of high purity (Fig. 2 ▶ b). The complex was subjected to crystallization screening using the sparse-matrix approach and crystals were initially obtained from condition 14 of Crystal Screen 2. After optimization of salt concentration and pH, good-quality crystals were grown from 0.2 M potassium sodium tartrate, 0.1 M sodium citrate pH 5.0, 1.6–1.8 M ammonium sulfate. The crystal has a hexagon or half-hexagon shape with dimensions of approximately 0.1 × 0.1 × 0.02 mm (Fig. 3 ▶). A SeMet-labelled crystal was grown in the same conditions and diffracted slightly better than the native crystal.
Figure 3.

Crystals of Imp3 26–183 in complex with Mpp10 430–461.
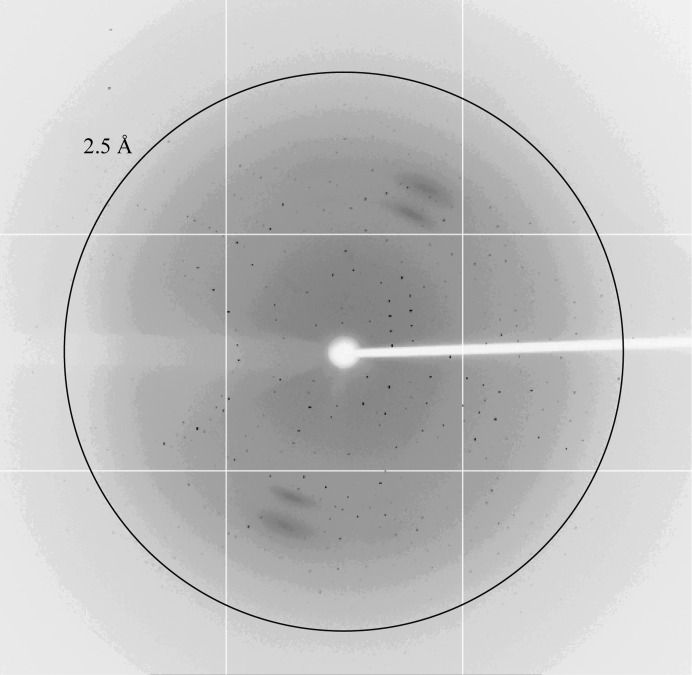
We collected diffraction data from a SeMet-labelled crystal on beamline BL17U of the SSRF at the Se peak wavelength of 0.97915 Å (Fig. 4 ▶). The data-collection statistics are shown in Table 3 ▶. The crystal belonged to space group P212121, with unit-cell parameters a = 51.6, b = 86.9, c = 88.7 Å. The data set had a completeness of 99.8% and an R r.i.m. of 18.6% at 2.1 Å resolution. The asymmetric unit is most likely to contain two copies of the complex, which would yield a solvent content of 45.52% and a Matthews coefficient of 2.26 Å3 Da−1 (Matthews, 1968 ▶).
Figure 4.
X-ray diffraction pattern of a crystal of SeMet-labelled Imp3 26–183 in complex with Mpp10 430–461. The outer circle indicates 2.5 Å resolution.
We have calculated the phases with the method of single-wavelength anomalous diffraction in PHENIX (Adams et al., 2010 ▶) and obtained an interpretable electron-density map. Model building and structure refinement are currently under way. We expect that the structure of the Imp3–Mpp10 complex will illustrate the details of how an S4 RNA-binding domain interacts with a protein and guide structure–function analysis of the two proteins.
Acknowledgments
We thank staff at SSRF beamline BL17U for assistance with data collection. This work was funded by grants from the National Natural Science Foundation of China (31325007), the Ministry of Science and Technology of China (National Basic Research Program of China, 2010CB835402) and the Beijing Municipal Government.
References
- Adams, P. D. et al. (2010). Acta Cryst. D66, 213–221.
- Ben-Shem, A., Garreau de Loubresse, N., Melnikov, S., Jenner, L., Yusupova, G. & Yusupov, M. (2011). Science, 334, 1524–1529. [DOI] [PubMed]
- Davies, C., Gerstner, R. B., Draper, D. E., Ramakrishnan, V. & White, S. W. (1998). EMBO J. 17, 4545–4558. [DOI] [PMC free article] [PubMed]
- Dragon, F., Gallagher, J. E., Compagnone-Post, P. A., Mitchell, B. M., Porwancher, K. A., Wehner, K. A., Wormsley, S., Settlage, R. E., Shabanowitz, J., Osheim, Y., Beyer, A. L., Hunt, D. F. & Baserga, S. J. (2002). Nature (London), 417, 967–970. [DOI] [PMC free article] [PubMed]
- Dunbar, D. A., Wormsley, S., Agentis, T. M. & Baserga, S. J. (1997). Mol. Cell. Biol. 17, 5803–5812. [DOI] [PMC free article] [PubMed]
- Erijman, A., Dantes, A., Bernheim, R., Shifman, J. M. & Peleg, Y. (2011). J. Struct. Biol. 175, 171–177. [DOI] [PubMed]
- Gérczei, T. & Correll, C. C. (2004). Proc. Natl Acad. Sci. USA, 101, 15301–15306. [DOI] [PMC free article] [PubMed]
- Gérczei, T., Shah, B. N., Manzo, A. J., Walter, N. G. & Correll, C. C. (2009). J. Mol. Biol. 390, 991–1006. [DOI] [PMC free article] [PubMed]
- Grandi, P., Rybin, V., Bassler, J., Petfalski, E., Strauss, D., Marzioch, M., Schäfer, T., Kuster, B., Tschochner, H., Tollervey, D., Gavin, A.-C. & Hurt, E. (2002). Mol. Cell, 10, 105–115. [DOI] [PubMed]
- Granneman, S., Gallagher, J. E., Vogelzangs, J., Horstman, W., van Venrooij, W. J., Baserga, S. J. & Pruijn, G. J. (2003). Nucleic Acids Res. 31, 1877–1887. [DOI] [PMC free article] [PubMed]
- Kabsch, W. (2010). Acta Cryst. D66, 125–132. [DOI] [PMC free article] [PubMed] [Google Scholar]
- Lee, S. J. & Baserga, S. J. (1999). Mol. Cell. Biol. 19, 5441–5452. [DOI] [PMC free article] [PubMed]
- Matthews, B. W. (1968). J. Mol. Biol. 33, 491–497. [DOI] [PubMed]
- Mossessova, E. & Lima, C. D. (2000). Mol. Cell, 5, 865–876. [DOI] [PubMed]
- Otwinowski, Z. & Minor, W. (1997). Methods Enzymol. 276, 307–326. [DOI] [PubMed]
- Phipps, K. R., Charette, J. M. & Baserga, S. J. (2011). Wiley Interdiscip. Rev. RNA, 2, 1–21. [DOI] [PMC free article] [PubMed]
- Shah, B. N., Liu, X. & Correll, C. C. (2013). RNA, 19, 1372–1383. [DOI] [PMC free article] [PubMed]
- Van Duyne, G. D., Standaert, R. F., Karplus, P. A., Schreiber, S. L. & Clardy, J. (1993). J. Mol. Biol. 229, 105–124. [DOI] [PubMed]
- Wehner, K. A. & Baserga, S. J. (2002). Mol. Cell, 9, 329–339. [DOI] [PubMed]
- Woolford, J. L. Jr & Baserga, S. J. (2013). Genetics, 195, 643–681. [DOI] [PMC free article] [PubMed]


