

Abstract
The Minnesota Adolescent Community Cohort (MACC) Study is a population-based, longitudinal study that enrolled 3636 youth from Minnesota and 605 youth from comparison states age 12 to 16 years in 2000–2001. Participants have been surveyed by telephone semi-annually about their tobacco-related attitudes and behaviors. The goals of the study are to evaluate the effects of the Minnesota Youth Tobacco Prevention Initiative and its shutdown on youth smoking patterns, and to better define the patterns of development of tobacco use in adolescents. A multilevel sample was constructed representing individuals, local jurisdictions and the entire state, and data are collected to characterize each of these levels.
This paper presents the details of the multilevel study design. We also provide baseline information about MACC participants including demographics and tobacco-related attitudes and behaviors. This paper describes smoking prevalence at the local level, and compares MACC participants to the state as a whole.
Keywords: youth, smoking, evaluation, multilevel
Introduction
Some states, including Minnesota, have had unprecedented funding for tobacco prevention and control programs over the past fifteen years. California in 1988, Massachusetts in 1992, Arizona in 1994, and Oregon in 1996 adopted tobacco tax increases through voter initiatives that generated funding for comprehensive tobacco control programs in those states. While state officials made almost continuous (and often successful) attempts to redirect some of the tobacco control funds to other uses, at one time these states spent per capita between $1.85 (CA) and $6.34 (MA) annually on tobacco control programs that today serve as prototypes for other states (Best Practices for Comprehensive Tobacco Control Programs--August 1999, 1999; Siegel & Biener, 1997).
The settlement of state lawsuits against the tobacco industry in 1997 and 1998 provided an opportunity for other states to build on the experience of California, Massachusetts, Arizona and Oregon, and develop major state tobacco control programs. These settlements provided payments to states by the tobacco industry estimated to range from $21.4 million (WY) to $825.5 million (NY) in fiscal year 2008 (Campaign for Tobacco-Free Kids, 2007). However, currently only 9 states fund tobacco prevention at 50% or more of the CDC’s minimum recommendation (FY 2009) for effectiveness in program implementation, none fund tobacco prevention at the CDC’s minimum recommendation, and six states committed no state funds to tobacco prevention during one or more of the last six years (Campaign for Tobacco-Free Kids, 2007). In addition other state programs have had funding levels reduced, despite early indicators of success.
Minnesota Tobacco Control Funding
Minnesota is one of the states where funding for tobacco control was increased dramatically and then reduced. In 1999 the Minnesota Legislature authorized setting aside $493 million of the tobacco settlement funds from the state’s litigation into an endowment to “reduce the prevalence of tobacco use among youth of this state.” (MN Session Laws, 1999). A portion of the endowment was to be spent over 16 years, under the supervision of the MN Department of Health, for statewide and local tobacco use prevention with a focus on youth ages 12–17, an effort known as the Minnesota Youth Tobacco Prevention Initiative (Minnesota House of Representatives, 1999). These efforts included a statewide information and marketing campaign, a youth advocacy component (Target Market), and local grants to focus on community mobilization and media advocacy on youth access policies, tobacco-free youth recreation policies, and community and home smoking restrictions. There was also a limited focus on school-based programs. Each of these programs included an emphasis on youth from populations at special risk for smoking initiation. However funding for these youth-focused programs was cut dramatically during the 2003 legislative session, from about $16 million in 2003 to about $3.2 million, where state funding remains in FY 2009 (Campaign for Tobacco-Free Kids, 2007).
The judge presiding over the settlement of the Minnesota lawsuit in 1998 also established a non-profit organization, ClearWay Minnesota, with a directive to fund research and programs that promote smoking cessation. The ClearWay Minnesota budget of $17.3 million in FY 2009 accounted for over 80% of the public money for tobacco control in Minnesota (Campaign for Tobacco-Free Kids, 2007).
Purposes of the MN Adolescent Community Cohort (MACC) Study
The primary goal of the MACC Study is to examine the effects of the Minnesota Youth Tobacco Prevention Initiative on tobacco use over time on adolescents at the individual, community and state levels. The MACC Study is uniquely designed to represent these multiple levels. The study created geo-political units (GPUs) that are the primary sampling units within the state, and youth were sampled within these units. Thus the youth in the sample are representative of their GPU, and all together, representative of the state as a whole. Data collection began in fall 2000, coincident with the start of the Minnesota Youth Tobacco Prevention Initiative (MYTPI), and continued through March 2008. The prospective study design increases the ability to make causal inferences about the effects of local and state interventions as well as statewide changes such as the abrupt decline in state funding for tobacco control in 2003, the 75¢ per pack increase in tobacco tax in 2005, and adoption of a statewide comprehensive clean indoor air law that went into effect in October 2007.
The National Cancer Institute’s Tobacco Research Implementation Plan highlights the importance of long-term prospective research on the effects of community policies and programs (National Cancer Institute (U.S.). Tobacco Research Implementation Group & National Cancer Institute (U.S.), 1998). These studies require sufficient power to use community as the unit of analysis, and sufficient detail about community policies and activities to construct environmental variables (Murray, Hannan, Wolfinger, Baker, & Dwyer, 1998; Sorensen, Emmons, Hunt, & Johnston, 1998). Among the handful of states with substantive early tobacco control programs, only California is able to link program elements to outcomes at the community level in some detail, despite general recognition that the success of the statewide programs depends upon community-based efforts (Independent Evaluation Consortium (IEC), 1998; Loeb, 1998; Siegel, 2002). The MACC project is designed to identify “best practices” among tobacco control initiatives using outcomes data; this first requires monitoring individual programs to assure effective implementation (Basch, Sliepcevich, Gold, Duncan, & Kolbe, 1985; Celebucki, Biener, & Koh, 1998; Moore & Bjornson, 1998; Pirie, Stone, Assaf, Flora, & Maschewsky-Schneider, 1994; Scheirer, 1987). Moreover, given the local variability in so many factors, including funding levels, duration, and program methods and goals, establishing causality between the effectiveness of a given program and a change in tobacco-use patterns is difficult unless the study design has been constructed to examine these linkages. Local-level program implementation data help in the interpretation of statewide outcomes as well as intermediate outcomes (Celebucki, et al., 1998; Moore & Bjornson, 1998).
A second goal of the MACC study is to better define the patterns of development of tobacco use in adolescents and to evaluate the effects of tobacco control programs on these patterns. The natural history of tobacco-use behaviors is not well understood in youth. Unambiguous markers of progression from nonsmoker to dependence have not been identified, and these markers are particularly important when clarifying program outcomes (Mayhew, Flay, & Mott, 2000). A number of researchers have described a series of stages in the process of becoming a dependent smoker (Flay, Hu, & Richardson, 1998; Lynch & Bonnie, 1994; Mayhew, et al., 2000; Pierce, Choi, Gilpin, Farkas, & Merritt, 1996; Preventing Tobacco Use Among Young People: A Report of the Surgeon General, 1994). Evidence suggests that delaying progression from one stage to the next, reducing the number of cigarettes smoked, or increasing quit attempts among youth could have important positive health consequences that are significant, especially at the population level (Choi, Pierce, Gilpin, Farkas, & Berry, 1997; Grimshaw & Stanton, 2006). Short-term program and policy effectiveness might be most clearly demonstrated in the delay or reversal of this progression toward regular smoking, rather than focusing exclusively on preventing onset altogether (Abroms, Simons-Morton, Haynie, & Chen, 2005; Chen, White, & Pandina, 2001; Choi, Gilpin, Farkas, & Pierce, 2001; Flay, et al., 1998; Karp, O’Loughlin, Paradis, Hanley, & Difranza, 2005; L. Liang, Chaloupka, Nichter, & Clayton, 2003; Mayhew, et al., 2000). Previous cohort studies have been restricted in the number of and interval between observations (two or three observations, often more than a year apart), thus limiting the detail with which individual progression over time can be described. Cohort studies that include multiple observations typically have limited information about smoking attitudes and behaviors, e.g. National Longitudinal Survey of Youth (Griesler, Kandel, & Davies, 2002), the National Study of Adolescent Health (Harris, et al., 2008), Growing Up Today Study (Field, et al., 2002), or involve a sample that is not population based, e.g. Pittsburgh Youth Study, a cohort study of boys with antisocial behavior (Burke, Loeber, White, Stouthamer-Loeber, & Pardini, 2007).
The multilevel design of the MACC Study provides the power to examine the effects of community-level programs, policies and other contextual factors and changes in these factors over time on patterns of smoking uptake. Multilevel studies of adolescent behavior typically have used schools as the primary sampling unit (Botvin & Griffin, 2007; Skara & Sussman, 2003; Thomas & Perera, 2006). However the problems of school-based surveys are well known (Celebucki, et al., 1998; Dent, Sussman, & Stacy, 1997; Gans & Brindis, 1995; Murray, Pals, Blitstein, Alfano, & Lehman, 2008). Furthermore, a school-based design does not allow appropriate assignment of contextual effects to the school’s students because a school’s enrollment is not necessarily reflective of the community in which it is located. Designing our own sampling units (GPUs) allowed us to standardize the size of the population of each unit to reflect the variability in smoking by geographical area, and to take into account the units of program delivery and policy coverage.
In addition, the MACC Study provides insight into patterns of initiation, progression to heavier smoking and smoking cessation in young adults. Cigarette smoking has increased in recent years in this age group, and both initiation and progression to regular smoking occur after high school in significant numbers. Since 1998, the rate of tobacco use among young adults (ages 18–25) has been the highest of any age group (Centers for Disease Control and Prevention, 2008; Substance Abuse & Mental Health Services Administration (SAMHSA), 2008). The 2007 National Surveys on Drug Use and Health revealed that the past-month cigarette smoking rate among 18–25 year olds was 36.2%, compared to 28.5% among those ages 26 and older (Substance Abuse & Mental Health Services Administration (SAMHSA), 2008). The prevalence of smoking among young adults in Minnesota ranked third among all states at 46.6% (Hughes, Sathe, & Spagnola, 2008).
Not only are young adults trying cigarettes and likely to progress from occasional to regular smoking, they are also trying to quit smoking in large numbers. Several studies have found that at least half of young adult smokers had tried to quit in the preceding year (Everett, et al., 1999; Messer, Trinidad, Al-Delaimy, & Pierce, 2008; Tucker, Ellickson, Orlando, & Klein, 2005; Wechsler, Rigotti, Gledhill-Hoyt, & Lee, 1998). In California, since 1990 young adults have consistently shown the highest rate of quit attempts among the adult population and in 1999, 78.5% of current smokers reported a quit attempt in the previous year (Gilpin, et al., 2001). Results from the Monitoring the Future Study show that only about 17% of those who had smoked half pack/day in high school were non-smokers by age 24 (Bachman, Wadsworth, O’Malley, Johnston, & Schulenberg, 1997). A major limitation is that most of what we know about tobacco use in young adults comes from cross-sectional studies. Only cohort studies can reveal whether young adults will continue their adolescent smoking patterns; whether those who begin smoking after high school have different smoking patterns from those who began earlier; and what are the long-term effects of exposure to policies and programs during adolescence on young adult smoking. Another limitation on current knowledge is that with few exceptions (Juon, Ensminger, & Sydnor, 2002; Prokhorov, et al., 2003; Voorhees, Schreiber, Schumann, Biro, & Crawford, 2002; Ward, et al., 2002) the detailed information about tobacco use in young adults comes from studies of traditional, 4-year, full-time college students. It appears that tobacco use is more prevalent among young adults who are not college students, at least among whites (Green, et al., 2007; Voorhees, et al., 2002). However smoking initiation, progression and cessation occurring after high school in young adults who work or enter the military are less understood. Since the MACC Study is population-based, participants include those who do not attend post-secondary schools.
The purpose of this paper is to illustrate the power of the MACC design. We describe the design and methods of the MACC Study in detail, and provide baseline information about MACC participants with regard to demographics and tobacco-related attitudes and behaviors. This paper will also describe smoking prevalence in the GPUs, and examine whether smoking varies by geographic unit within the state. We will also compare MACC participants to the state as a whole, to determine if our method of randomly selecting participants was successful.
Methods
Study Design
The MACC Study employs a multilevel design, including a cohort sequential design of five ages at the individual level where individuals (adolescents) are surveyed every six months. These individuals are nested in GPUs and there are longitudinal observations at the GPU level every six months as well. Finally individuals and GPUs were randomly assigned a specific month within the six-month window for each observation; thus each month constitutes an observation in a time series design for the state of Minnesota.
GPU Definition and Selection in Minnesota
The following criteria were used to define GPUs: a) the boundaries would follow established geopolitical boundaries (counties, cities, school districts, formal neighborhoods or planning districts within cities); b) the number of teenagers age 12 to 16 would be sufficient for efficient sampling; c) the unit would be identifiable over the phone, so that parents could recognize whether they lived in the target area; d) the boundaries would roughly correspond to program delivery units (Oswald, Chen, Zupan, Forster, & McCarty, 2002). To achieve sampling efficiency, variability in tobacco use also was taken into consideration to assure each participant carried the same amount of independent information in data analysis. Previous studies indicated that variance was largest in urban areas and smallest in rural areas. Therefore GPUs were defined so that the total teen population range for rural GPUs was 1,000 to 3,000, for suburban GPUs was 1,500 to 4,500, and for urban GPUs was 4,500 to 9,000. Rural GPU boundaries were selected to coincide with county boundaries, including one or more counties depending upon the teenage population. Suburban GPUs were counties, municipalities or school districts, and urban GPUs were formed by contiguous neighborhoods or planning districts. Three small cities in Greater Minnesota are defined as GPUs via their school districts. As a result, the entire state of Minnesota was divided into 129 GPUs, which is the sampling frame of the primary sampling units for the study.
Stratified random sampling was used to select the 60 GPUs for the study. The 129 GPUs representing the entire state were divided into nine strata defined as follows: four outstate congressional districts, high Hispanic population, high Native American population, suburban Minneapolis-St. Paul, outstate small cities, and Minneapolis-St. Paul. The number of GPUs selected from each stratum was proportional to the teenage population of that stratum, except that all of the high Hispanic, high Native American, and outstate city GPUs were selected. Within the Minneapolis-St. Paul stratum, GPUs were further stratified by minority population density before random selection. See Figure 1 for an illustration of the geographic design of the MACC study.
Figure 1.
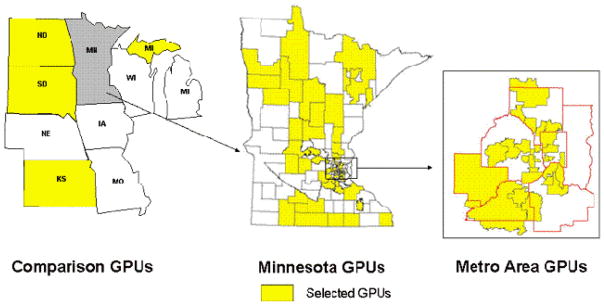
Geographic Design of the MACC Study
Adolescent Cohort
A combination of probability and quota sampling methods (to assure equal age distribution) was used to establish the cohort. The goal was to recruit 3600 participants from Minnesota. These participants included 12 of each age from 12 to 16 years old from each of the 60 Minnesota GPUs. Recruitment was conducted by telephone by Clearwater Research, Inc., using modified random digit dial (MOD1) sampling to identify households with at least one teenager in the target age range within the target GPU. Within households, respondents were selected at random from among age quota cells that were still open for that GPU. Parent permission was obtained by telephone followed by permission from the chosen teenager before interviewing. In addition a comparison cohort (n=600) consisting of approximately 180 12–16 year olds from metropolitan Kansas City KS and MO, 240 from the rest of Kansas, 60 each from North and South Dakota and 60 from the upper peninsula of Michigan were recruited into the study. We chose these states because as of 2000 they had devoted few resources from the Master Settlement Agreement to tobacco control and because they roughly corresponded to the demographics of Minnesota.
Adolescents were interviewed by phone every six months, on the six-month anniversary of their previous interview. Parent permission was obtained before each interview until the respondent was 18 years old. Respondents were sent a $10 check ($15 once they reached 18 years old) after each completed interview. Each six months constitutes one round of data collection. The initial grant included three years (Rounds 1–6) of data collection, and a subsequent grant added four years (Rounds 8–15) (due to an interruption in funding there is no round seven). Thus at the end of the current funding we have 14 observations (from 2000–2008) on cohort members.
Statewide Time Series
Each GPU and its participants were randomly assigned to either the odd or even months of the six-month window. Thus a unique sample of approximately 600 Minnesota participants and 100 comparison cohort participants were interviewed each month of the six month round, constituting a monthly time series of observations for Minnesota and comparison areas.
Sample Weighting
Sample weighting was necessary to extrapolate from our sample to the entire state. This weight for any teen in the sample is computed as the reciprocal of the inclusion probability for that teen. Given our design, a reasonable definition of the target population is all youth ages 12 to 16 who reside in a household with a telephone. The sampling design for Minnesota teens is based on stratified clustered multi-stage sampling. The first stage is the selection of 60 GPUs from 129 GPUs via stratified random sampling; the second stage is the selection of households with phones with teenagers via sampling phone numbers within the clusters (GPUs); the third stage is the selection of age-eligible teenagers from households with teens via quota sampling. As a result, we computed probability-based sampling weights for the first two stages and quota sampling weights for the last stage, which is an inherently a non-probability based scheme. The inverse weight was developed for probability sampling, and quota sampling was dealt with by including a covariate of household size in all regression-type models or by adjusting the sampling weight by using the inverse of teens 12–16 years in the household. Weights to be used in statistical analyses can also adjust for the representativeness of the sample to the target population. We accomplished this goal using post-stratification techniques to make the final weighted sample of teens demographically representative of our target population at the level of the state.
Individual Measures
The initial survey included questions and scales that have been validated by others, and/or used by large national surveys such as the National Youth Tobacco Survey. Survey constructs and their sources are indicated in Table 1. The questions were structured so that spoken responses would not be revealing to anyone overhearing the respondent. The phone interview lasted from 10–20 minutes, depending upon the smoking status of the respondent. Minor modifications were made for each round to add new questions or delete questions that need not be repeated. The full baseline survey can be found at http://www.epi.umn.edu/research/macc/index.shtm.
Table 1.
Constructs Included in MACC Adolescent Survey
| Smoking status (daily, past week, past month) | Pechacek, et al., 1984 |
| Smoking uptake stage |
Pierce, et al., 1996 Flay, et al., 1998 |
| Smoking use patterns | YTS*, TERNX |
| Nicotine addiction | DiFranza, et al., 2002 |
| Smoking cessation attempts, desire | YTS* |
| Commercial, social availability of cigarettes | YTS* |
| Use of other forms of tobacco | YTS* |
| Smoking by household members | MACC@ |
| Perceived adult, youth prevalence of smoking | MACC@ |
| Rules about smoking at home, in public places | MACC@ |
| Exposure to second hand smoke | YTS* |
| Attitudes toward tobacco companies | MACC@ |
| Perceived changes in cigarette price | MACC@ |
| Benefits, dangers associated with smoking | TERNX |
| Exposure to anti-tobacco programs | MACC@ |
TERN – Tobacco Etiology Research Network (Clayton, Ries Merikangas, & Abrams, 2000)
YTS – National Youth Tobacco Survey (Centers for Disease Control and Prevention, 2008)
MACC – Items developed by MACC investigators
Tobacco use
Responses to a series of questions were used to create a 6-point index of tobacco use (1=never smoker, 2=trier, 3=less than a monthly smoker, 4=experimental smoker, 5=regular smoker, 6=established smoker; see Figure 2). A “never smoker” was defined as someone who has never smoked, not even a puff. A “trier” is someone who has smoked one cigarette or less. A “less than monthly smoker” has smoked more than one cigarette in their lifetime, but none in the previous 30 days. An “experimenter” has smoked at least once in the previous 30 days. A “regular smoker” has smoked at least once in the previous week. Finally an “established smoker” smokes daily or most days. All smoking stage categories are mutually exclusive.
Analysis Plan
As stated earlier, the first goal of the MACC study is to evaluate local tobacco control programs in Minnesota. The analysis for this goal is conducted using Generalized Estimating Equations (GEE) (K. Y. Liang & Zeger, 1986). The GEE approach specifies a working correlation matrix for the observations, thereby allowing multiple random effects. The standard errors are computed using empirical-sandwich estimation. The GEE method gives consistent estimators under relatively weak assumptions about the form of the correlation matrix.
The second goal of the study is to better define the patterns of development of tobacco use and to evaluate the effects of tobacco control programs on these patterns. Growth curve and growth mixture modeling are appropriate to examine the pattern of initial smoking status and the change over time. To examine the effect of individual-level and community-level predictors on individual smoking pattern, we have used a three-level model. Level-1 is the repeated measures on the individual in the community; the outcomes from level-1 analyses are smoking-related characteristics for the individual, such as initial smoking status and rate of change in smoking status. In level-2 models, the smoking characteristics (initial status and rate of change) are related to other specific time-invariant individual characteristics, such as parent education, to yield estimates of these relationships averaged over individuals. At level-3 we examine community characteristics that relate to the community specific outcomes from level-2 to answer the question why different community characteristics help “explain” different average initial smoking status and rates of change.
Finally, to examine the effects of state-level tobacco control policies and spending, the analysis is conducted using Box-Jenkins intervention time-series models. Our sampling scheme generates a state representative monthly sample of youth in Minnesota and the Upper Midwest for total of seven years. By including a contemporaneous control group (Upper Midwest), we control for secular trends at both regional (multi-states) and national levels, which would confound a time series without a comparison group. The Box-Jenkins intervention time-series analysis is conducted in two steps. First, a parsimonious ARIMA model for each dependent time-series variable is specified and then a series of white noise is generated for each dependent variable. Second, intervention variables are transformed by transfer functions and added to the ARIMA white-noise model. It permits tests of the statistical significance of intervention effects.
Results
We present results of GPU selection, participant recruitment and characteristics, and tobacco use at the individual and GPU level.
GPU Selection
The random selection of 60 GPUs from the universe of 129 resulted in the following distribution: 24 are defined by county boundaries, 24 are defined by school district boundaries, four are defined by city boundaries and eight are defined by within-city neighborhood/planning district boundaries. The GPU boundaries were also translated into census block groups, so census variables could be used to characterize the GPUs. We compared the randomly-selected GPUs and those not selected on a number of demographic characteristics defined by census variables and found no significant differences (Table 2). The demographic heterogeneity among GPUs is indicated by the standard deviation being quite large for some measures. Even though the state is more than 85% non-Hispanic white, for example, MACC includes a GPU that is 80% non-white (US Census Bureau, 2007). The percent housing units that are renter-occupied varies more than ten-fold, as does the percent unemployed adults, the percent under 1.5 times the federal poverty level, and percent with less than a high school education.
Table 2.
Aggregate Census Characteristics of MN GPUs Selected and Not Selected for the MACC Study
| Selected (N=60) Mean (SD) |
Not Selected (N=69) Mean (SD) |
|
|---|---|---|
|
| ||
| % White | 89.4 (14.0) | 91.7 (10.0) |
| % < HS Education | 13.2 (6.0) | 13.1 (5.7) |
| % Married | 54.2 (9.7) | 56.5 (8.7) |
| % Urban | 65.5 (33.5) | 60.3 (33.2) |
| % English speakers, ≥age 18 | 92.3 (5.3) | 92.8 (5.0) |
| Median housing value ($) | 117,564 (43,828) | 114,202 (42,293) |
| % Renter occupied | 24.5 (12.2) | 21.4 (11.4) |
| Median income ($) | 48,464 (14,729) | 49,145 (14,185) |
| % Unemployed, ≥age 16 | 4.5 (2.2) | 4.0 (1.7) |
| % < 1.5 x federal poverty | 15.7 (8.7) | 14.0 (7.7) |
Source: U.S. Census 2000
Note: No significant differences between selected and not selected GPUs
Participant Recruitment
A total of 225,064 telephone numbers were called to achieve our goals for the original sample. Many of these were non-working (11.8%) or not answered (11.7%) or ineligible (70.5%), and 2.8% refused before eligibility could be determined. Of the 7251 households with known eligibility, 58.5% participated in baseline interviews. These include 3636 individuals age 12–16 in the Minnesota cohort and 605 from the comparison states.
Baseline Demographic Characteristics of Participants
As shown in Table 3, MACC participants are evenly distributed across the five age groups from 12 to 16 years by design, and almost half of participants are male by chance. Although we attempted to over-sample from ethnic minority populations, over 85% of the cohort members are white, with black participants representing the largest minority group at 5%. This distribution closely resembles the census distributions of age, sex and race/ethnicity distributions among 12 to 16 year olds within Minnesota. The comparison state cohort also closely resembles the age, sex and race/ethnicity distributions of the Minnesota cohort. About half (48.7%) of the Minnesota cohort lives in the Minneapolis-St. Paul urban – suburban (seven county metropolitan) area, reflecting the population distribution in general in the state.
Table 3.
Baseline Characteristics of MACC Participants and Same-Age Minnesotans
| MN Cohort N=3636 |
Comparison State Cohort N=605 |
Age 12–16, State of Minnesota | ||
|---|---|---|---|---|
| Male | 49.2% | 50.3% | 51.8% | |
| Age | 12 years | 19.9% | 18.7% | 19.8% |
| 13 years | 20.1% | 22.2% | 20.1% | |
| 14 years | 20.0% | 19.0% | 20.3% | |
| 15 years | 20.1% | 20.0% | 20.3% | |
| 16 years | 20.0% | 20.0% | 19.5% | |
| Race/Ethnicity | African American | 5.0% | 5.3% | 4.5% |
| American Indian | 2.3% | 4.3% | 1.6% | |
| Hispanic/Latino | 2.5% | 4.1% | 3.4% | |
| Asian | 2.4% | 1.7% | 4.0% | |
| White | 85.2% | 82.2% | 85.7% | |
| Other | 2.6% | 4.1% | 0.8% | |
| Region | Rural | 46.4% | ||
| Suburban | 35.2% | |||
| Small City | 5.0% | |||
| Urban | 13.5% | |||
| Comparison State | Kansas City Metro | 30.4% | ||
| Kansas Non-metro | 39.8% | |||
| South Dakota | 9.9% | |||
| North Dakota | 9.9% | |||
| Upper Michigan | 9.9% | |||
Source: MN and comparison cohorts=MACC data; state of Minnesota data, U.S. Census
Note: there were no significant differences in age or demographic variables among the three samples.
Baseline Tobacco Use
Tobacco use at baseline varied by age. Any cigarette use, even a puff, ranged from 12.9% among 12 year olds to 56.1% among 16 year olds among the Minnesota participants (Table 4). At the other end of the spectrum, those who smoked most days or every day in the prior thirty days ranged from <1% among 12 year olds to almost 11% among 16 year olds. The proportion of the Minnesota cohort who had ever used other forms of tobacco was highest for smokeless tobacco (10.6%) and cigars (18.6%).
Table 4.
Baseline Tobacco Use Among MACC Participants
| 12 yr | 13 yr | 14 yr | 15 yr | 16 yr | ||
|---|---|---|---|---|---|---|
| Minnesota | Never Smoker | 87.1% | 78.1% | 66.5% | 57.1% | 43.9% |
| Trier | 10.5% | 16.3% | 21.0% | 23.6% | 23.2% | |
| <monthly | 1.1% | 1.9% | 4.3% | 6.0% | 11,7% | |
| Experimental | 0.6% | 1.9% | 2.1% | 4.0% | 4.0% | |
| Regular | 0.6% | 1.1% | 2.3% | 4.2% | 5.9% | |
| Established | 0.1% | 0.7% | 3.4% | 4.9% | 10.9% | |
| Ever smokeless | 1.0% | 1.5% | 3.3% | 7.5% | 10.6% | |
| Ever bidis, clove cigarettes, kreteks | 0.3% | 0.7% | 1.2% | 1.4% | 6.3% | |
| Ever pipe | 0.7% | 0.8% | 1.8% | 2.3% | 3.7% | |
| Ever cigar | 1.5% | 3.3% | 7.3% | 11.1% | 18.6% | |
| Comparison States | Never Smoker | 88.5% | 82.8% | 57.4% | 62.0% | 46.3% |
| Trier | 9.7% | 13.4% | 29.6% | 22.3% | 22.3% | |
| <monthly | 0.9% | 1.5% | 4.3% | 6.6% | 14.0% | |
| Experimental | 0 | 0.7% | 2.6% | 3.3% | 5.0% | |
| Regular | 0.9% | 0.7% | 4.3% | 2.5% | 2.5% | |
| Established | 0 | 0.7% | 1.7% | 3.3% | 9.9% | |
| Ever smokeless | 1.8% | 0.7% | 2.6% | 8.3% | 13.2% | |
| Ever bidis, clove cigarettes, kreteks | 0 | 1.5% | 2.6% | 1.7% | 5.0% | |
| Ever pipe | 0 | 1.5% | 3.5% | 0.8% | 1.7% | |
| Ever cigar | 0 | 3.0% | 6.1% | 6.6% | 15.7% |
Note: P>0.10 for all comparisons of Minnesota and Comparison cohorts within age
Among the comparison cohort, the rate of any cigarette use was somewhat lower than in Minnesota for each age group except 14 year olds (Table 4). Slightly fewer adolescents in comparison states than in Minnesota were established smokers for every age group. However more of them had used smokeless tobacco, especially among the 16 year olds (13.2% vs. 10.9%). Chi square tests showed that none of the differences in tobacco use within age group between the Minnesota cohort and the comparison cohort were significant.
GPUs showed considerable variability in baseline smoking rates (Bernat, Lazovich, Forster, Oakes, & Chen, 2009). The mean rate of ever smoking among the 60 GPUs was 33.1%, as shown in Table 5, with a range of 13.3% to 53.3%. For past 30 day smoking the mean was 9.5% and the rates for the GPUs varied from 3.2% to 18.6%. Variability in ever smoking was greatest among suburban GPUs (coefficient of variation 28.2%) and variability for past 30-day smoking was greatest among urban GPUs (coefficient of variation 52.4%).
Table 5.
Prevalence of Smoking among Minnesota GPUs at Baseline
| % Ever smoked Mean (SD) |
% Smoked past 30 days Mean (SD) |
|
|---|---|---|
| All GPUs (N=60) | 33.0 (8.6) | 9.9 (4.2) |
| Rural + Small city GPUs (N=31) | 34.3 (8.0) | 10.5 (4.0) |
| Suburban GPUs (N=21) | 28.6 (8.0) | 8.6 (3.7) |
| Urban GPUs (N=8) | 39.3 (7.9) | 10.9 (6.0) |
Prevalence of ever-smoking less among suburban GPUs compared to urban or rural+small city, p<.05; no significant differences among categories for past 30-day smoking
The intraclass correlation coefficients (ICCs), comparing within and between GPU variability for the outcomes of interest, are quite small: 0.005 for smoking stage, 0.011 for ever- smoking and 0.003 for monthly smoking. Thus, no more than 1% of the total variability in these outcomes can be attributed to GPUs. The variance inflation factors, which also consider the size of the clusters, are also small – 1.30, 1.64 and 1.16 respectively – suggesting that the bias introduced by ignoring the clustering is likely negligible.
Discussion
The baseline results indicate that the multilevel MACC design was effective in producing comparability: (1) at the individual level between the Minnesota MACC cohort members and Minnesota as a whole; (2) at the group level, between the MACC GPUs and the non-selected GPUs in Minnesota; and (3) at the state level, between the Minnesota MACC cohort and the comparison state cohort. The racial/ethnic composition of the Minnesota sample was achieved through over-sampling areas of the state with higher proportions of Hispanic and American Indian people compared to the state as a whole, and stratifying regions of Minneapolis and St. Paul by racial/ethnic proportions. Despite this deliberate effort to over-sample via selecting the GPUs with high minority population, the distribution by race/ethnicity is very similar to the state population. The Minnesota cohort and the comparison cohort are surprisingly similar in both demographics and smoking rates, given the limited choice of comparison states. These results show that it is possible simultaneously to construct comparable and representative groups of individuals, GPUs, and states to conduct multilevel etiologic and evaluation research.
The MACC study design, while complex, offers many advantages for the study of behaviors and their developmental and contextual influences, and reflects the complexity of statewide comprehensive youth tobacco prevention programs. The cohort sequential design at the individual level allows us to examine the contribution of age, period and cohort to the association between programs and policies and smoking behavior. Disentangling these effects is especially important given that significant changes in programs and policies occurred during the study that might be expected to have differential effects dependent upon age. In this regard having access to multiple cohorts of the same age is particularly useful. The study includes 14 observations of each GPU. GPU-level comparisons are essential because GPUs vary in the extent that programs and policies are adopted and implemented. Also, there is a surprising amount of variability in contextual and smoking measures at the sub-state level that might be expected to moderate the effectiveness of programs and policies in changing smoking behavior. The statewide time-series consists of 168 observations on a sample that is representative of Minnesota and the comparison states. The statewide effects of state policy changes and the Minnesota Youth Prevention Initiative can optimally be assessed through this design.
The prospective design, small intervals between observations (six months), and large number of observations offer advantages over previous studies that focus on the development of smoking behavior. Individual changes can be observed with more precision, and exposures at early adolescence can be linked to changes in later years.
The complexity of the design presents many challenges for collecting data and constructing variables, especially at the GPU level. While GPUs were constructed to attempt to coincide with units of program implementation, other criteria for GPUs, notably number of adolescents, frequently meant that two rural counties with different programs and/or policies were combined into one GPU. Also, media exposure, for example via newspapers, varies within GPUs, and sometimes policy enforcement is conducted across an area larger or smaller than the GPU. Weighting schemes have been required to approximate GPU level exposure to these kinds of variables. Also, information relating to tobacco control program delivery is dependent upon reporting by local grantees to the Minnesota Department of Health. Our ability to examine effects of these programs at the local level depends upon the specificity of the reporting regarding the content of their programs and activities, so that variability in programs delivered can be observed.
This complex design presents many challenges for analysis as well. Methods to accommodate the multilevel sampling design must be considered even in individual-level analyses, for example of trajectories of change over time. Studies of phenomena such as smoking initiation or cessation in MACC must take into account the various ages at which these phenomena are occurring, and the varying number of observations for individuals of different ages within the cohort.
The MACC study suffers from other conventional limitations of studies of this type. Participants are from the Midwest and programs studied are administered only in Minnesota, limiting generalizability. While the MACC cohort was representative of the Minnesota and comparison state populations at baseline, as with any cohort study, the representativeness of the sample deteriorates over time. Also our ability to infer causation is limited by the observational nature of the study. However the advantages of the MACC Study - large population-based sample, many observations, linkage to local and state policies and programs over time, longitudinal cohort design, and collection of detailed information on tobacco use and intermediaries - make the MACC study uniquely useful in understanding the development of tobacco use among youth and the effects of tobacco programs and policies over time. The data presented in this paper affirm that the sampling method was successful in providing samples of adolescents whose data would represent the state of Minnesota and the north-central US, and thus provides a model for others who study these multi-level phenomena.
Contributor Information
Jean Forster, University of Minnesota, Minneapolis, MN
Vincent Chen, University of Texas, Houston, TX
Cheryl Perry, University of Texas, Austin, TX
John Oswald, US DHHS, Washington, DC
Michael Willmorth, Clearwater Research, Inc, Boise, ID
References
- Abroms L, Simons-Morton B, Haynie DL, Chen R. Psychosocial predictors of smoking trajectories during middle and high school. Addiction. 2005;100(6):852–861. doi: 10.1111/j.1360-0443.2005.01090.x. [DOI] [PubMed] [Google Scholar]
- Bachman JG, Wadsworth KN, O’Malley PM, Johnston LD, Schulenberg JE. Smoking, Drinking, and Drug Use in Young Adulthood: The Impacts of New Freedoms and New Responsibilities. Mahwah, NJ: Lawrence Erlbaum Associates; 1997. [Google Scholar]
- Basch CE, Sliepcevich EM, Gold RS, Duncan DF, Kolbe LJ. Avoiding type III errors in health education program evaluations: a case study. Health Educ Q. 1985;12(4):315–331. doi: 10.1177/109019818501200311. [DOI] [PubMed] [Google Scholar]
- Bernat DH, Lazovich D, Forster J, Oakes JM, Chen V. Area-Level Variation in Adolescent Smoking. Preventing Chronic Disease. 2009;6(2) [PMC free article] [PubMed] [Google Scholar]
- Best Practices for Comprehensive Tobacco Control Programs--August 1999. Atlanta, GA: US Department of Health and Human Services, Centers for Disease Control and Prevention, National Center for Chronic Disease Prevention and Health Promotion, Office on Smoking and Health; 1999. [Google Scholar]
- Botvin GJ, Griffin KW. School-based programmes to prevent alcohol, tobacco and other drug use. Int Rev Psychiatry. 2007;19(6):607–615. doi: 10.1080/09540260701797753. [DOI] [PubMed] [Google Scholar]
- Burke JD, Loeber R, White HR, Stouthamer-Loeber M, Pardini DA. Inattention as a key predictor of tobacco use in adolescence. J Abnorm Psychol. 2007;116(2):249–259. doi: 10.1037/0021-843X.116.2.249. [DOI] [PubMed] [Google Scholar]
- Campaign for Tobacco-Free Kids. A Broken Promise to Our Children: The 1998 State Tobacco Settlement Nine Years Later. Washington D.C: 2007. [Google Scholar]
- Celebucki C, Biener L, Koh HK. Evaluation: methods and strategy for evaluation--Massachusetts. Cancer. 1998;83(12 Suppl Robert):2760–2765. doi: 10.1002/(sici)1097-0142(19981215)83:12a+<2760::aid-cncr20>3.0.co;2-v. [DOI] [PubMed] [Google Scholar]
- Centers for Disease Control and Prevention. Cigarette smoking among adults--United States, 2007. MMWR - Morbidity & Mortality Weekly Report. 2008;57(45):1121–1226. [PubMed] [Google Scholar]
- Chen PH, White HR, Pandina RJ. Predictors of smoking cessation from adolescence into young adulthood. Addict Behav. 2001;26(4):517–529. doi: 10.1016/s0306-4603(00)00142-8. [DOI] [PubMed] [Google Scholar]
- Choi WS, Gilpin EA, Farkas AJ, Pierce JP. Determining the probability of future smoking among adolescents. Addiction. 2001;96(2):313–323. doi: 10.1046/j.1360-0443.2001.96231315.x. [DOI] [PubMed] [Google Scholar]
- Choi WS, Pierce JP, Gilpin EA, Farkas AJ, Berry CC. Which adolescent experimenters progress to established smoking in the United States. Am J Prev Med. 1997;13(5):385–391. [PubMed] [Google Scholar]
- Clayton RR, Ries Merikangas K, Abrams DB. Introduction to tobacco, nicotine, and youth: the tobacco etiology research network. Drug Alcohol Depend. 2000;59(Suppl 1):S1–4. doi: 10.1016/s0376-8716(99)00160-x. [DOI] [PubMed] [Google Scholar]
- Dent CW, Sussman SY, Stacy AW. The impact of a written parental consent policy on estimates from a school-based drug use survey. Evaluation Review. 1997;21:698–712. doi: 10.1177/0193841X9702100604. [DOI] [PubMed] [Google Scholar]
- DiFranza JR, Savageau JA, Fletcher K, Ockene JK, Rigotti NA, McNeill AD, et al. Measuring the loss of autonomy over nicotine use in adolescents: the DANDY (Development and Assessment of Nicotine Dependence in Youths) study. Arch Pediatr Adolesc Med. 2002;156(4):397–403. doi: 10.1001/archpedi.156.4.397. [DOI] [PubMed] [Google Scholar]
- Everett SA, Husten CG, Kann L, Warren CW, Sharp D, Crossett L. Smoking initiation and smoking patterns among US college students. J Am Coll Health. 1999;48(2):55–60. doi: 10.1080/07448489909595674. [DOI] [PubMed] [Google Scholar]
- Field AE, Austin SB, Frazier AL, Gillman MW, Camargo CA, Jr, Colditz GA. Smoking, getting drunk, and engaging in bulimic behaviors: in which order are the behaviors adopted? J Am Acad Child Adolesc Psychiatry. 2002;41(7):846–853. doi: 10.1097/00004583-200207000-00018. [DOI] [PubMed] [Google Scholar]
- Flay BR, Hu FB, Richardson J. Psychosocial predictors of different stages of cigarette smoking among high school students. Prev Med. 1998;27(5 Pt 3):A9–A18. doi: 10.1006/pmed.1998.0380. [DOI] [PubMed] [Google Scholar]
- Gans JE, Brindis CD. Choice of research setting in understanding adolescent health problems. J Adolesc Health. 1995;17(5):306–313. doi: 10.1016/1054-139x(95)00182-r. [DOI] [PubMed] [Google Scholar]
- Gilpin EA, Emery SL, Farkas AJ, Distefan JM, White MM, Pierce JP. The California Tobacco Control Program: A Decade of Progress. Results from the California Tobacco Surveys, 1990–1998. La Jolla, CA: University of California, San Diego; 2001. [Google Scholar]
- Green MP, McCausland KL, Xiao H, Duke JC, Vallone DM, Healton CG. A closer look at smoking among young adults: where tobacco control should focus its attention. Am J Public Health. 2007;97(8):1427–1433. doi: 10.2105/AJPH.2006.103945. [DOI] [PMC free article] [PubMed] [Google Scholar]
- Griesler PC, Kandel DB, Davies M. Ethnic differences in predictors of initiation and persistence of adolescent cigarette smoking in the National Longitudinal Survey of Youth. Nicotine Tob Res. 2002;4(1):79–93. doi: 10.1080/14622200110103197. [DOI] [PubMed] [Google Scholar]
- Grimshaw GM, Stanton A. Tobacco cessation interventions for young people. Cochrane Database Syst Rev. 2006;(4):CD003289. doi: 10.1002/14651858.CD003289.pub4. [DOI] [PubMed] [Google Scholar]
- Harris KM, Halpern CT, Entzel P, Tabor J, Bearman PS, Udry JR., Producer The National Longitudinal Study of Adolescent Health: Research Design. 2008 Podcast retrieved from http://www.cpc.unc.edu/projects/addhealth/design.
- Hughes A, Sathe N, Spagnola K. State Estimates of Substance Use from the 2005–2006 National Surveys on Drug Use and Health. Rockville, MD: Substance Abuse and Mental Health Services Administration, Office of Applied Studies; 2008. (No. DHHS Publication No. SMA 08-4311, NSDUH Series H-33) [Google Scholar]
- Independent Evaluation Consortium (IEC) Final Report: Independent Evaluation of the California Tobacco Control Prevention & Education Program: Wave 1 Data, 1996–1997. Rockville, MD: The Gallup Organization; 1998. [Google Scholar]
- Juon HS, Ensminger ME, Sydnor KD. A longitudinal study of developmental trajectories to young adult cigarette smoking. Drug Alcohol Depend. 2002;66(3):303–314. doi: 10.1016/s0376-8716(02)00008-x. [DOI] [PubMed] [Google Scholar]
- Karp I, O’Loughlin J, Paradis G, Hanley J, Difranza J. Smoking trajectories of adolescent novice smokers in a longitudinal study of tobacco use. Ann Epidemiol. 2005;15(6):445–452. doi: 10.1016/j.annepidem.2004.10.002. [DOI] [PubMed] [Google Scholar]
- Liang KY, Zeger SL. Longitudinal data analysis using generalized linear models. Biometrics. 1986;73:13–22. [Google Scholar]
- Liang L, Chaloupka F, Nichter M, Clayton R. Prices, policies and youth smoking, May 2001. Addiction. 2003;98(Suppl 1):105–122. doi: 10.1046/j.1360-0443.98.s1.7.x. [DOI] [PubMed] [Google Scholar]
- Loeb J. Evaluation: methods and strategy for evaluation--Arizona. Cancer. 1998;83(12 Suppl Robert):2766–2769. doi: 10.1002/(sici)1097-0142(19981215)83:12a+<2766::aid-cncr21>3.0.co;2-a. [DOI] [PubMed] [Google Scholar]
- Lynch BS, Bonnie RJ, editors. Growing Up Tobacco Free: Preventing Nicotine Addiction in Children and Youths. Washington, DC: National Academy Press; 1994. [PubMed] [Google Scholar]
- Mayhew KP, Flay BR, Mott JA. Stages in the development of adolescent smoking. Drug Alcohol Depend. 2000;59(Suppl 1):S61–S81. doi: 10.1016/s0376-8716(99)00165-9. [DOI] [PubMed] [Google Scholar]
- Messer K, Trinidad DR, Al-Delaimy WK, Pierce JP. Smoking cessation rates in the United States: a comparison of young adult and older smokers. Am J Public Health. 2008;98(2):317–322. doi: 10.2105/AJPH.2007.112060. [DOI] [PMC free article] [PubMed] [Google Scholar]
- Minnesota House of Representatives. Minnesota’s Tobacco Settlement. St. Paul, MN: Minnesota State Legislature; 1999. [Google Scholar]
- MN Session Laws. Tobacco Settlement Payments 1999. 1999 May 25; from https://www.revisor.leg.state.mn.us/laws/?id=245&doctype=Chapter&year=1999&type=0.
- Moore JM, Bjornson W. Evaluation: methods and strategy for evaluation--Oregon. Cancer. 1998;83(12 Suppl Robert):2770–2772. doi: 10.1002/(sici)1097-0142(19981215)83:12a+<2770::aid-cncr22>3.0.co;2-o. [DOI] [PubMed] [Google Scholar]
- Murray DM, Hannan PJ, Wolfinger RD, Baker WL, Dwyer JH. Analysis of data from group-randomized trials with repeat observations on the same groups. Stat Med. 1998;17(14):1581–1600. doi: 10.1002/(sici)1097-0258(19980730)17:14<1581::aid-sim864>3.0.co;2-n. [DOI] [PubMed] [Google Scholar]
- Murray DM, Pals SL, Blitstein JL, Alfano CM, Lehman J. Design and analysis of group-randomized trials in cancer: a review of current practices. J Natl Cancer Inst. 2008;100(7):483–491. doi: 10.1093/jnci/djn066. [DOI] [PubMed] [Google Scholar]
- National Cancer Institute (U.S.). Tobacco Research Implementation Group., & National Cancer Institute (U.S.) Tobacco research implementation plan : priorities for tobacco research beyond the year 2000. Bethesda, Md: National Cancer Institute, National Institutes of Health; 1998. [Google Scholar]
- Oswald J, Chen V, Zupan B, Forster JL, McCarty MC. Definition and uses of geopolitical units for the Minnesota Adolescent Community Cohort (MACC) study. Paper presented at the Annual Meeting of the American Public Health Association.2002. [Google Scholar]
- Pechacek TF, Murray DM, Luepker RV, Mittelmark MB, Johnson CA, Shutz JM. Measurement of adolescent smoking behavior: rationale and methods. J Behav Med. 1984;7(1):123–140. doi: 10.1007/BF00845351. [DOI] [PubMed] [Google Scholar]
- Pierce JP, Choi WS, Gilpin EA, Farkas AJ, Merritt RK. Validation of susceptibility as a predictor of which adolescents take up smoking in the United States. Health Psychol. 1996;15(5):355–361. doi: 10.1037//0278-6133.15.5.355. [DOI] [PubMed] [Google Scholar]
- Pirie PL, Stone EJ, Assaf AR, Flora JA, Maschewsky-Schneider U. Program evaluation strategies for community-based health promotion programs: perspectives from the cardiovascular disease community research and demonstration studies. Health Educ Res. 1994;9(1):23–36. doi: 10.1093/her/9.1.23. [DOI] [PubMed] [Google Scholar]
- Preventing Tobacco Use Among Young People: A Report of the Surgeon General. Atlanta, GA: US Department of Health and Human Services, Public Health Service, Centers for Disease Control and Prevention, National Center for Chronic Disease Prevention and Health Promotion, Office on Smoking and Health; 1994. [Google Scholar]
- Prokhorov AV, Warneke C, de Moor C, Emmons KM, Mullin Jones M, Rosenblum C, et al. Self-reported health status, health vulnerability, and smoking behavior in college students: Implications for intervention. Nicotine Tob Res. 2003;5(4):545–552. doi: 10.1080/1462220031000118649. [DOI] [PubMed] [Google Scholar]
- Scheirer MA. Program theory and implementation theory: Implications for evaluators. In: Bickman L, editor. New Directions for Program Evaluation, Using Program Theory in Evaluation. San Francisco: Jossey Bass; 1987. pp. 59–76. [Google Scholar]
- Siegel M. The effectiveness of state-level tobacco control interventions: a review of program implementation and behavioral outcomes. Annu Rev Public Health. 2002;23:45–71. doi: 10.1146/annurev.publhealth.23.092601.095916. [DOI] [PubMed] [Google Scholar]
- Siegel M, Biener L. Evaluating the impact of statewide anti-tobacco campaigns: the Massachusetts and California tobacco control programs. Journal of Social Issues. 1997;53(1) [Google Scholar]
- Skara S, Sussman S. A review of 25 long-term adolescent tobacco and other drug use prevention program evaluations. Prev Med. 2003;37(5):451–474. doi: 10.1016/s0091-7435(03)00166-x. [DOI] [PubMed] [Google Scholar]
- Sorensen G, Emmons K, Hunt MK, Johnston D. Implications of the results of community intervention trials. Annu Rev Public Health. 1998;19:379–416. doi: 10.1146/annurev.publhealth.19.1.379. [DOI] [PubMed] [Google Scholar]
- Substance Abuse & Mental Health Services Administration (SAMHSA) Results from the 2007 National Survey on Drug Use & Health: National Findings. Rockville, MD: US Department of Health and Human Services; 2008. [Google Scholar]
- Thomas R, Perera R. School-based programmes for preventing smoking. Cochrane Database Syst Rev. 2006;3:CD001293. doi: 10.1002/14651858.CD001293.pub2. [DOI] [PubMed] [Google Scholar]
- Tucker JS, Ellickson PL, Orlando M, Klein DJ. Predictors of attempted quitting and cessation among young adult smokers. Prev Med. 2005;41(2):554–561. doi: 10.1016/j.ypmed.2004.12.002. [DOI] [PubMed] [Google Scholar]
- US Census Bureau. Estimates of the population by race and Hispanic origin for the United States and States: July 1, 2007. 2007 Apr 28; 2008. Retrieved Sep 2, 2008, from http://www.census.gov/popest/states/asrh/SC-EST2007-04.html.
- Voorhees CC, Schreiber GB, Schumann BC, Biro F, Crawford PB. Early predictors of daily smoking in young women: the national heart, lung, and blood institute growth and health study. Prev Med. 2002;34(6):616–624. doi: 10.1006/pmed.2002.1026. [DOI] [PubMed] [Google Scholar]
- Ward KD, Vander Weg MW, Kovach KW, Klesges RC, DeBon MW, Haddock CK, et al. Ethnic and gender differences in smoking and smoking cessation in a population of young adult air force recruits. Am J Health Promot. 2002;16(5):259–266. doi: 10.4278/0890-1171-16.5.259. [DOI] [PubMed] [Google Scholar]
- Wechsler H, Rigotti NA, Gledhill-Hoyt J, Lee H. Increased levels of cigarette use among college students: a cause for national concern. Jama. 1998;280(19):1673–1678. doi: 10.1001/jama.280.19.1673. [DOI] [PubMed] [Google Scholar]