

Abstract
Background
Some popular weight loss diets restricting carbohydrates (CHO) claim to be more effective, and have additional health benefits in preventing cardiovascular disease compared to balanced weight loss diets.
Methods and Findings
We compared the effects of low CHO and isoenergetic balanced weight loss diets in overweight and obese adults assessed in randomised controlled trials (minimum follow-up of 12 weeks), and summarised the effects on weight, as well as cardiovascular and diabetes risk. Dietary criteria were derived from existing macronutrient recommendations. We searched Medline, EMBASE and CENTRAL (19 March 2014). Analysis was stratified by outcomes at 3–6 months and 1–2 years, and participants with diabetes were analysed separately. We evaluated dietary adherence and used GRADE to assess the quality of evidence. We calculated mean differences (MD) and performed random-effects meta-analysis. Nineteen trials were included (n = 3209); 3 had adequate allocation concealment. In non-diabetic participants, our analysis showed little or no difference in mean weight loss in the two groups at 3–6 months (MD 0.74 kg, 95%CI −1.49 to 0.01 kg; I2 = 53%; n = 1745, 14 trials; moderate quality evidence) and 1–2 years (MD 0.48 kg, 95%CI −1.44 kg to 0.49 kg; I2 = 12%; n = 1025; 7 trials, moderate quality evidence). Furthermore, little or no difference was detected at 3–6 months and 1–2 years for blood pressure, LDL, HDL and total cholesterol, triglycerides and fasting blood glucose (>914 participants). In diabetic participants, findings showed a similar pattern.
Conclusions
Trials show weight loss in the short-term irrespective of whether the diet is low CHO or balanced. There is probably little or no difference in weight loss and changes in cardiovascular risk factors up to two years of follow-up when overweight and obese adults, with or without type 2 diabetes, are randomised to low CHO diets and isoenergetic balanced weight loss diets.
Background
Overweight, obesity and the related burdens of cardiovascular disease (CVD), type 2 diabetes, other non-communicable diseases (NCD) and premature mortality are escalating globally [1]–[3]. Nearly 80% of annual NCD deaths occur in low and middle income populations [4] and the NCD burden is projected to rise disproportionately in these populations over the next ten years [5].
Some weight loss diets widely promoted through the media, such as the Atkins diet [6], [7], recommend a regimen greatly restricting carbohydrates (CHO), with increased protein and unrestricted total and saturated fat intake. Advocates claim these diets are more effective for losing weight compared to balanced weight loss diets and also improve cardiovascular health, and prevent or cure diabetes [8]. To achieve the very low CHO intake, these diets prescribe restriction of most vegetables and fruit, wholegrains, legumes and other carbohydrate-containing foods. It is plausible that these low CHO diets could be harmful, especially over the longer term [9]–[11]. We therefore sought to determine whether low CHO diets have any beneficial or harmful effects on weight and cardiovascular risk factors when compared to balanced diets.
What do existing systematic reviews say?
We first examined evidence from existing systematic reviews. We sought any review that synthesised evidence on dietary macronutrient manipulation and cardiovascular outcomes or risk factors (last search: 3 March 2014). We found 50 reviews but these had a number of methodological constraints precluding the possibility that they could meaningfully address the question we set out to answer (see Supporting Information S1 for detailed summary). The main constraints were: they did not adequately define the macronutrient composition of treatment and control diets; the total energy intake in treatment and control diets was not considered or was different between groups; arms included additional interventions that could confound the findings, such as exercise; inclusion of non-randomised studies and studies with dissimilar follow-up periods (Table 1). In light of these shortcomings, which make interpretation of the previous reviews problematic, we carried out our own systematic review.
Table 1. Main limitations identified in existing systematic reviews that served as constraints to interpretation of the evidence and what we did to address them in our review.
| What answering the research question requires | Why was it identified as a limitation in existing reviews? | What we did to address identified limitations in our review |
| Explicit definition of treatment and control diets with complete macronutrient profile | If unclear, any effects seen on weight loss and CVD risk factors cannot be attributed to a well-defined intervention diet compared to a well-defined control diet | Used explicit cut-off ranges for macronutrients for treatment and control diets; the complete macronutrient profile of intervention diets had to be available (proportions of total energy intake) |
| Recommended energy intake in treatment and control groups needs to be similar | If different, any effects seen on weight loss and CVD risk factors would be confounded by total energy intake | Only included isoenergetic diet comparisons |
| Co-interventions, such as drugs given as part of the intervention, or recommendations for exercise, need to be similar in the comparison groups | If different, any effects on CVD risk factors could be confounded by co-interventions | Only included interventions with a diet component alone, or combined interventions that were similar to prevent confounding by co-interventions |
| Appropriate study design for the question | Methodological heterogeneity: some reviews included both controlled and uncontrolled trials | Only included randomised controlled trials |
| Meaningful and comparable follow-up in trials needs to be considered | Outcomes of trials with different follow-ups were pooled; generalised conclusions about weight loss may be skewed by early changes; or follow-up may be insufficient to detect CVD risk factor changes | Only included studies with 12 weeks or more follow-up; and outcomes were grouped by defined lengths of follow-up |
CVD: cardiovascular disease.
Note: see Supporting Information S1 for the critical summary of existing systematic reviews.
Macronutrient recommendations and low carbohydrate diets
Nutrition specialists have defined “recommended, balanced diets” in terms of macronutrient composition, micronutrients and dietary quality to ensure adequate nutrition, energy balance for health and weight maintenance, and prevention of NCDs in healthy populations [12]–[15]. Recommended macronutrient ranges have been developed in the USA and Canada, Australia and New Zealand and Europe [12]–[15] and are very similar across the various countries and regions. For CHO, the recommended range varies between 45 and 65% of total energy, for protein between 10 and 35% and for fat between 20 and 35%. Since not only quantity (% contribution to total energy intake), but also quality (type and nature) of macronutrients are important, guidance on the quality aspects of CHO and fats are also included in most recommendations [12]–[15]. Balanced weight loss diets restrict total energy and adhere to the principles of a balance between energy derived from CHO, protein and fat, as well as the recommended quality of each macronutrient.
To further improve our understanding of these diets, we examined and summarised the main themes in the advocacy literature on low CHO diets and their supposed benefits. We identified two main variants of low CHO diets. In Table 2, we summarise examples of these, along with a balanced weight loss diet, comparing key characteristics. Essentially, low CHO diets emphasise a change in recommended macronutrient balance with CHO restriction implemented by elimination or reduction of specific foods and food groups and replacement of these with high fat and protein foods. All restrict CHO intake, but the definitions used for ‘low’ and the specific implementation, advice and health claims provided with these diets vary. Very low CHO diets advocate extreme restriction of CHO and are consequently high in both protein and fat (which we have labelled high fat variant). A second variant is also high in protein, but the amount of fat is within recommended ranges and therefore restriction of CHO is less extreme (labelled high protein variant). This information helped to inform the protocol, specifically the sub-group analysis, for our systematic review of relevant randomised controlled trials.
Table 2. Low carbohydrate (CHO) diets compared with a recommended, balanced weight loss diet.
| Low CHO diet, high fat varianta | Low CHO diet, high protein variantb | Balanced weight loss diet | |
| Examples | Atkins diet [6], [7] | Zone diet [67], [68] | British Dietetic Association weight loss plan [69] |
| Energy | |||
| Is energy explicitly restricted? | No | Noc | Yes |
| Macronutrients | |||
| CHO | Extreme restriction | Moderate restriction | 45–65% of total energy |
| Fat | Unrestricted fat | 25–35% of total energy | 25–35% of total energy |
| Protein | Unrestricted protein | Promotes lean protein | 10–20% of total energy |
| Quality | |||
| CHO | Extreme restriction of all CHO food sources | Extreme restriction of grains and starches; fruit and vegetables recommended | High fibre, unprocessed; promotion of fruit, vegetables and legumes |
| Protein | Unrestricted, especially animal protein | Increased lean animal protein, protein bars and shakes | Emphasis on plant protein and lean animal protein |
| Fat | Promotion of increased ‘natural’ fats, including saturated (animal) fats | Promotion of monounsaturated fats, mention of omega-3 fats | Promotion of polyunsaturated and monounsaturated fats, replacement of saturated fats with unsaturated fats, avoidance of trans fats; adequate omega-3 fats |
| Micronutrients | |||
| Is micronutrient intake addressed? | Not specificallyd | Not specificallye | Not specificallyf |
| Selected claimed health benefits | |||
| Main | Weight loss | Weight loss | Weight loss (if energy is restricted) |
| Other | “Improvement in risk factors for heart disease, hypertension and diabetes, inflammation” | “Reverses cellular inflammation”. “Cellular inflammation is what makes us gain weight, accelerate the development of chronic disease, and decrease our physical performance” | Reduces risk of obesity-related illness; Reduces risk of non-communicable diseases; Promotes nutritional adequacy |
Energy reduction is implicit as a consequence of extreme restriction of carbohydrates, the reported satiating effect of protein, and appetite suppressing effect of ketones.
Energy reduction is implicit as a consequence of extreme restriction of grains and starches and reported satiating effect of protein.
Portion guides sometimes provided.
Potential risks of inadequacies by extreme restriction of carbohydrates, including most vegetables and fruit.
Potential risks of inadequacies by restricting grains and starches.
Promoted indirectly through recommending a variety of foods from all food groups and quality food choices (including plenty of vegetables and fruit).
Objective
To compare the effects of low CHO and isoenergetic balanced weight loss diets in overweight and obese adults.
Inclusion Criteria
Types of studies
We included randomised controlled trials (RCTs) in humans published in English. Trials could be of a parallel or crossover design, however, crossover trials were only included if first period data could be extracted. We excluded trials with less than 10 participants randomised in each group.
Types of participants
People who are overweight or obese, have diabetes, glucose intolerance or insulin resistance, cardiovascular conditions or risk factors such as hypertension and dyslipidaemia, as defined by trial authors. We excluded pregnant and lactating women and individuals younger than 18 years.
Types of interventions
We required the studies to provide the macronutrient goals of the diet in terms of their contribution to total energy intake, or that these goals could be calculated as proportions of total energy intake, for both the treatment and comparison arms. Treatment diets were low CHO weight loss diet plans, including a) low CHO, high fat, high protein diet (high fat variant) or b) low CHO, recommended fat, high protein diet (high protein variant) (Table 3). Control diets were balanced weight loss diet plans (Table 3) with the same or similar prescribed energy content as the treatment diet.
Table 3. Cut-off ranges* used to classify the macronutrient goals of treatment and control diets.
| Classifications | |||
| Macronutrients | Low | Balanced | High |
| Carbohydrate (% of total energy) | <45 | 45 to 65 | >65 |
| Fat (% of total energy) | <25 | 25 to 35 | >35 |
| Protein (% of total energy) | <10 | 10 to 20 | >20 |
We excluded studies where: the treatment and control diets were not adequately defined or where the control diet was defined as ‘no dietary intervention’; diets were combined with any other interventions (e.g. exercise, pharmacological, surgical) so that the effect of diet alone could not be assessed; dietary interventions had an exclusive focus on energy restriction, i.e. no macronutrient manipulation was instituted; a substantial disparity in energy intake (>500 kilojoules) between the prescribed treatment and control diets was present; an ad libitum energy prescription was used; interventions focused on specific foods, food groups or food components (e.g. dairy, oats, plant sterols), meal replacement or supplement products were used; the duration of the intervention was less than 12 weeks or test meal responses (post-prandial) were assessed.
Types of outcome measures
Weight
Total weight change (kg); body mass index (BMI) (kg/m2).
Markers of cardiovascular disease risk
Diastolic blood pressure (DBP) and systolic blood pressure (SBP) (mmHg); serum cholesterol: low density lipoprotein (LDL), high density lipoprotein (HDL) and total (mmol/L); serum triglycerides (TG) (mmol/L).
Markers of diabetes mellitus risk or glycaemic control
Glycosylated haemoglobin (HbA1c) (%); fasting blood glucose (FBG) (mmol/L).
Mortality, myocardial infarction and stroke were not explicitly excluded as outcomes, but we did not expect to find randomised controlled trials with these outcomes where dietary manipulations were under study.
Search Methods for Identification of Studies
Electronic searches were done in MEDLINE via PubMed, Excerpta Medica Database (EMBASE) and The Cochrane Central Register of Clinical Trials (CENTRAL), with the last search on 19 March 2014. The full electronic search strategy for EMBASE is detailed in Table 4. In addition, the references of the previously mentioned 50 existing systematic reviews were searched.
Table 4. Search strategies for EMBASE.
| Search: 22 October 2012 | ||
| No. | Query | Results |
| #5 | #3 AND #4 | 1312 |
| #4 | ‘randomised controlled trial’/exp OR ‘randomised controlled trial’ OR ‘randomised controlled trials’ OR ‘randomized controlled trial’/exp OR ‘randomized controlled trial’ OR ‘randomized controlled trials’/exp OR ‘randomized controlled trials’ AND [humans]/lim AND [english]/lim AND [embase]/lim AND [1-1-1966]/sd NOT [22-10-2012]/sd AND [1966-2012]/py | 249285 |
| #3 | #1 AND #2 | 2862 |
| #2 | ‘carbohydrate restricted diet’/exp OR ‘carbohydrate restricted diet’ OR ‘carbohydrate restricted diets’ OR ‘high fat diet’/exp OR ‘high fat diet’ OR ‘high fat diets’ OR ‘fat restricted diet’/exp OR ‘fat restricted diet’ OR ‘fat restricted diets’ OR ‘ketogenic diet’/exp OR ‘ketogenic diet’ OR ‘ketogenic diets’ AND [humans]/lim AND [english]/lim AND [embase]/lim AND [1-1-1966]/sd NOT [22-10-2012]/sd AND [1966–2012]/py | 11176 |
| #1 | ‘randomized controlled trial’/exp OR ‘randomized controlled trial’ OR random*:ab,ti OR trial:ti OR allocat*:ab,ti OR factorial*:ab,ti OR placebo*:ab,ti OR assign*:ab,ti OR volunteer*:ab,ti OR ‘crossover procedure’/exp OR ‘crossover procedure’ OR ‘double-blind procedure’/exp OR ‘double-blind procedure’ OR ‘single-blind procedure’/exp OR ‘single-blind procedure’ OR (doubl* NEAR/3 blind*):ab,ti OR (singl*:ab,ti AND blind*:ab,ti) OR crossover*:ab,ti OR cross+over*:ab,ti OR (cross NEXT/1 over*):ab,ti AND [humans]/lim AND [english]/lim AND [embase]/lim AND [1-1-1966]/sd NOT [22-10-2012]/sd AND [1966–2012]/py | 879594 |
Data Collection and Analysis
Selection of studies
Two authors (CN and AS) screened titles and abstracts of all search results and identified potentially eligible studies using the pre-specified eligibility criteria. Full text articles for these studies were obtained and assessed by the two authors simultaneously. Studies not fulfilling eligibility criteria were excluded with reasons. All discrepancies were resolved by consensus.
Data extraction and management
Two authors (CN and AS) extracted data using an electronic data extraction spreadsheet in Microsoft Excel. The main sections of the spreadsheet included information on the design, country, participants, treatment, control, diet quality, energy and nutrient composition, adherence, outcomes and results, funding, conflict of interest, and risk of bias. The extracted data were collated in tables and figures. The author of one included RCT [16] was contacted and provided means and standard deviations that could not be read accurately from a figure in the publication.
Length of follow-up
Outcomes were grouped into those measured between baseline and three to six months of follow-up; and between baseline and one to two years of follow-up. For trials measuring outcomes at several time points within either of these two categories, we took the values for the longest follow-up within that category (for example, where results were available at three and six months, the results at six months were used).
Risk of bias assessment
Two authors (CN and AS) assessed the risk of bias in the included studies by using the Cochrane Collaboration risk of bias tool [17], where domains include random sequence generation, allocation concealment, performance and detection bias, attrition bias, reporting bias and ‘other’ bias. Criteria for low risk, high risk and unclear risk of bias per the Cochrane Handbook for Systematic Reviews of Interventions [17] were used.
Adherence
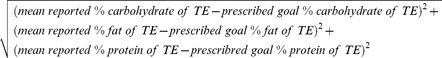
For energy, the prescribed and reported total energy intakes (kilojoules) for each reported follow-up category in the trial were tabulated per group, as were group comparisons of mean reported energy intake reported by trial authors. For macronutrients, adherence was calculated as the difference between the reported mean and prescribed distribution of energy intake (% of total energy) from CHO, fat and protein for each follow-up category. For trials reporting dietary intake at several time points within either of the two follow-up categories, we took the values for the longest follow-up within that category. Specifically, adherence was calculated using a Mahalanobis distance equation, which can be used to measure the similarity between a set of actual conditions relative to a set of ideal conditions [18]. The equation generated an adherence score that represents the degree of deviation from the prescribed goals for macronutrients in the treatment and control groups. A lower score reflects better adherence and a higher score reflects poorer adherence.
The equation for the macronutrient adherence score, where TE is total energy:
 |
Measures of treatment effect
Review Manager (RevMan) 5.2 was used to manage the extracted data and to conduct meta-analyses [19] for each outcome, where relevant, to determine a pooled effect of low CHO diets compared to balanced diets. Mean differences (MD) were calculated for continuous data and reported alongside 95% confidence intervals (CIs). Where change per group was not available, end values were used and we combined change from baseline results with end values [17]. Footnotes on the figures of forest plots indicate when end values were used.
Unit of analysis issues
No crossover trials met the inclusion criteria. In the case of multiple intervention groups, we selected one pair of interventions i.e. treatment and control that was most relevant to this systematic review question [17].
Assessment of heterogeneity
Statistical heterogeneity was assessed with the Chi2 test (significance level p <0.1) and quantified with the I2 test [20] where I2 values of 50% or more indicate a substantial level of heterogeneity and values of 75% or more indicate considerable heterogeneity [17].
Assessment of reporting bias
We assessed reporting bias with funnel plots when we had 10 or more studies per outcome, which was the case for five outcomes in non-diabetic overweight and obese adults in the early follow-up category.
Data synthesis and investigation of heterogeneity
The outcomes were reported as the difference in the mean change between the treatment and control groups. Because the presence of diabetes is likely to influence the effects of the diet, we stratified by trials of overweight and obese participants without and with type 2 diabetes. Heterogeneity between the included studies was anticipated due to variations in dietary plans and goals, length of follow-up and dietary methodology, and the random-effects model was therefore used for all meta-analyses. We stratified the analysis by whether the treatment group was the high fat variant or the high protein variant of low CHO diets, and pooled the estimate if there was no obvious heterogeneity.
GRADE analysis
We assessed the quality of evidence using GradePro (Grade Profiler) 3.2.2 software [21], [22]. We used standard terms to translate the quality of the evidence, as assessed by GRADE, into words to express the quality of evidence and magnitude of effect. For example, for large effects and moderate quality evidence, we use the word “probably”, whereas for low quality we use the word “may” [23].
Results
Description of studies
Results of the search and included studies
We screened 3450 records and retrieved and screened 179 full-text articles, after which we included 19 RCTs (Figure 1). We included 19 RCTs with 3209 participants [16], [24]–[41]. All trials used a parallel group design, were published after 2001 and were conducted in high-income countries (United States of America (5), Australia (7), New Zealand (1), Germany (1), Norway (1), United Kingdom (1), Sweden (1) and Spain (2)). Sample size varied between 25 and 402 participants. Follow-up ranged from 12 weeks to two years.
Figure 1. Flow diagram illustrating the search results and selection process, as well as the variants of the low carbohydrate diets used as treatments in the included trials.

The high fat variant of low carbohydrate diets is low in carbohydrates (<45% of total energy), high in fat (>35% of total energy) and high in protein (>20% of total energy). The high protein variant of low carbohydrate diets is low in carbohydrates (<45% of total energy), has a recommended proportion of fat (20 to 35% of total energy) and is high in protein (>20% of total energy).
There were 14 trials in people without diabetes [16], [24], [26]–[29], [31]–[33], [36]–[39], [41] and five trials in people with type 2 diabetes mellitus [25], [30], [34], [35], [40]. Nine trials tested the high fat variant of the low CHO diet and 10 trials tested the high protein variant. Figure 1 displays the number of trials and variants of the low CHO diet used as treatments in each population. In people without diabetes, eight trials examined the high fat variant [16], [24], [26], [27], [29], [32], [33], [38] and 6 the high protein variant [28], [31], [36], [37], [39], [41]. A single trial [30] evaluated the high fat variant and four [25], [34], [35], [40] evaluated the high protein variant in adults with type 2 diabetes mellitus. No included trials reported mortality, myocardial infarction or stroke as outcomes.
Two trials were only in men [33], [41] and the rest were mixed. All trials included only participants who were overweight or obese (BMI of 26 kg/m2 or greater). In all trials that reported baseline BMIs, the mean baseline BMI in both groups was greater than 30 kg/m2. The WHO classifies an individual as overweight when their BMI is greater than or equal to 25 kg/m2 and as obese when BMI is greater than or equal to 30 kg/m2 [42]. Table 5 provides characteristics of included trials per population group and Table 6, the prescribed dietary goals for the treatment and control diets per included trial and population group. We excluded 160 full-text articles with reason given in Table 7; the most common reason was follow-up less than 12 weeks.
Table 5. Characteristics of included randomised controlled trials.
| First author (follow-up in weeks) | Year of publication | Country | Parallel design | No randomised | No Completed in Rx group | Dropout in Rx group | No Completed in Control group | Dropout in Control group | Gender | Age Range (yrs) | Types of Participants | Total Intervention Period in weeks |
| Overweight and obese adults | ||||||||||||
| Aude (12) [24] | 2004 | USA | Yes | 60 | 29 | 1 | 25 | 5 | Both | 27–71 | Overweight or Obese | 12 |
| De Luis (12) [27] | 2009 | Spain | Yes | 118 | 52 | 0 | 66 | 0 | Both | NR | Overweight or Obese | 12 |
| De Luis (12) [26] | 2012 | Spain | Yes | 305 | 147 | 0 | 158 | 0 | Both | NR | Obese | 12 |
| Farnsworth (16) [28] | 2003 | UK | Yes | 66 | 28 | NR | 29 | NR | Both | 20–65 | Overweight or Obese | 16 |
| Frisch (52) [29] | 2009 | Germany | Yes | 200 | 85 | 15 | 80 | 20 | Both | 18–70 | Overweight or Obese | 52 |
| Keogh (52) [31] | 2008 | Australia | Yes | 36 | 7 | NR | 6 | NR | Both | 20–65 | Overweight or Obese | 52 |
| Klemsdal (52) [32] | 2010 | Norway | Yes | 202 | 78 | 22 | 86 | 16 | Both | 30–65 | Overweight or Obese and CVD risk | 52 |
| Krauss (12) [33] | 2006 | USA | Yes | 224 | 40 | 12 | 49 | 8 | Males | NR | Overweight or Obese with Dyslipidaemia | 12 |
| Lasker (16) [36] | 2008 | USA | Yes | 65 | 25 | 7 | 25 | 8 | Both | 40–56 | Overweight or Obese | 16 |
| Layman (52) [37] | 2009 | USA | Yes | 130 | 41 | 23 | 30 | 36 | Both | 40–57 | Overweight or Obese | 52 |
| Lim (64) [38] | 2010 | Australia | Yes | 113 | 17 | 13 | 15 | 15 | Both | 20–65 | Overweight or Obese with CVD risk | 64 |
| Luscombe (16) [39] | 2003 | Australia | Yes | 36 | 17 | 0 | 19 | 0 | Both | 20–65 | Overweight or Obese | 16 |
| Sacks (104) [16] | 2009 | USA | Yes | 811 | 168 | 33 | 169 | 35 | Both | 30–70 | Overweight or Obese | 104 |
| Wycherley (52) [41] | 2012 | Australia | Yes | 123 | 33 | 26 | 35 | 29 | Males | 20–65 | Overweight or Obese | 52 |
| Overweight and obese adults with Type 2 diabetes mellitus | ||||||||||||
| Guldbrand (104) [30] | 2012 | Sweden | Yes | 61 | 30 | 0 | 31 | 0 | Both | NR | Overweight or Obese with T2DM | 104 |
| Brinkworth (64) [25] | 2004 | Australia | Yes | 66 | 19 | 14 | 19 | 14 | Both | 58–65 | Overweight or Obese with T2DM | 64 |
| Krebs (104) [34] | 2012 | New Zealand | Yes | 419 | 144 | 63 | 150 | 62 | Both | 30–78 | Overweight or Obese with T2DM | 104 |
| Larsen (52) [35] | 2011 | Australia | Yes | 108 | 48 | 9 | 45 | 6 | Both | 30–75 | Overweight or Obese and T2DM | 52 |
| Parker(12) [40] | 2002 | Australia | Yes | 66 | 26 | 6 | 28 | 6 | Both | NR | Obese with T2DM | 12 |
CVD = cardiovascular disease; No = number; NR = not reported; Rx = treatment; T2DM = type two diabetes mellitus; USA = United States of America; yrs = years.
Note: In the case of multiple intervention groups, we selected one pair of interventions i.e. treatment and control that was most relevant to this systematic review question.
Table 6. Prescribed dietary goals per length of follow-up for included randomised controlled trials.
| First author (follow-up in weeks) | Year of publication | No. of weeks of weight loss | Prescribed energy for Rx group | Prescribed energy for Control group | Prescribed CHO for Rx group | Prescribed fat for Rx group | Prescribed protein for Rx group | Prescribed CHO for Control group | Prescribed fat for Control group | Prescribed protein for Control group |
| (kJ) | (kJ) | (% of TE) | (% of TE) | (% of TE) | (% of TE) | (% of TE) | (% of TE) | |||
| Overweight and obese adults: High fat variant of low CHO diet | ||||||||||
| Aude (12) | 2004 | 12 | 5460–6720 | 5460–6720 | 28 | 39 | 33 | 55 | 30 | 15 |
| De Luis (12) | 2009 | 12 | 6300 | 6330 | 38 | 36 | 26 | 52 | 27 | 20 |
| De Luis (12) | 2012 | 12 | 6329 | 6300 | 38 | 36 | 26 | 53 | 27 | 20 |
| Frisch (24 and 52) | 2009 | 24 | 2100 deficit | 2100 deficit | <40 | >35 | 25 | >55 | <30 | 15 |
| Klemsdal (24 and 52) | 2010 | 24 | 2100 deficit | 2100 deficit | 30–35 | 35–40 | 25–30 | 55–60 | <30 | 15 |
| Krauss (12) | 2006 | 5 | 4200 deficit | 4200 deficit | 26 | 45 | 29 | 54 | 30 | 16 |
| Lim (24 and 64) | 2010 | 24 | 6500 | 6500 | 4 | 60 | 35 | 50 | 30 | 30 |
| Sacks (24 and 104) | 2009 | 24 | 3150 deficit | 3151 deficit | 35 | 40 | 25 | 65 | 20 | 15 |
| Overweight and obese adults: High protein variant of low CHO diet | ||||||||||
| Farnsworth (16) | 2003 | 12 | 6000–6300 | 6000–6300 | 40 | 30 | 30 | 55 | 30 | 15 |
| Keogh (12 and 52) | 2008 | 12 | 6000 | 6000 | 33 | 27 | 40 | 60 | 20 | 20 |
| Lasker (16) | 2008 | 16 | 7100 | 7100 | 40 | 30 | 30 | 55 | 30 | 15 |
| Layman (16 and 52) | 2009 | 16 | 7100–7940 | 7100–7940 | 40 | 30 | 30 | 55 | 30 | 15 |
| Luscombe (16) | 2003 | 12 | 6500–8200 | 6500–8201 | 40 | 30 | 30 | 55 | 30 | 15 |
| Wycherley (12 and 52) | 2012 | 52 | 7000 | 7000 | 40 | 25 | 35 | 58 | 25 | 17 |
| Overweight and obese adults with type 2 diabetes mellitus: High fat variant of low CHO diets | ||||||||||
| Guldbrand (12–24) | 2012 | 12–24 | M:6696 | M:6696; | 20 | 50 | 30 | 55–60 | 30 | 10–15 |
| F: 7531 | F: 7531 | |||||||||
| Guldbrand (104) | 2012 | 104 | M:6696; | M:6696; | 20 | 50 | 30 | 55–60 | 30 | 10–15 |
| F: 7531 | F: 7531 | |||||||||
| Overweight and obese adults with type 2 diabetes mellitus: High protein variant of low CHO diets | ||||||||||
| Brinkworth (12) | 2004 | 8 | NR | NR | 40 | 30 | 30 | 55 | 30 | 15 |
| Brinkworth (64) | 2004 | N/A | NR | NR | 40 | 30 | 30 | 55 | 30 | 15 |
| Krebs (24 and 104) | 2012 | 12 | 2000 deficit | 2000 deficit | 40 | 30 | 30 | 55 | 30 | 15 |
| Larsen (12) | 2011 | 12 | 6400/−30%E | 6400/−30%E | 40 | 30 | 30 | 55 | 30 | 15 |
| Larsen (52) | 2011 | N/A | E balance | E balance | 40 | 30 | 30 | 55 | 30 | 15 |
| Parker (12) | 2002 | 8 | 6720-E balance | 6721-E balance | 40 | 30 | 30 | 60 | 25 | 15 |
CHO = carbohydrate; E = energy; F = females; g = gram; kJ = kilojoule; M = males; MJ = megajoule; N/A = not applicable; No = number; NR = not reported; Rx = treatment; TE = total energy.
Table 7. Excluded studies and reasons for exclusion.
| Reasons for exclusion | Number of studies excluded |
| Not a randomised controlled trial | 4 [71]–[74] |
| Duration of the intervention <12 weeks | 40 [75]–[114] |
| All three macronutrients not prescribed (or cannot be calculated as proportions of the total energy intake) | 20 [115]–[134] |
| Non-English language | 1 [135] |
| Test meal response measured | 1 [136] |
| Meal replacement | 2 [137], [138] |
| Combined interventions were involved | 3 [139]–[141] |
| Treatment and control both low carbohydrate – not an eligible comparison | 3 [142]–[144] |
| Comparison not meaningful (carbohydrate content of treatment and controls differ <5% of TE) | 2 [145], [146] |
| No eligible balanced carbohydrate control | 1 [147] |
| Crossover trial where first period data cannot be extracted: 1 | 1 [148] |
| Substantial disparity in energy intake between prescribed intervention diets | 13 [49], [51], [149]–[159] |
| Treatment diet is not low in carbohydrates | 26 [160]–[185] |
| Control diet is not within balanced macronutrient range | 4 [186]–[189] |
| Duplicate and/or complimentary | 24 [190]–[213] |
| Energy intake ad libitum | 8 [214]–[221] |
| Ineligible low carbohydrate diet variant | 6 [222]–[227] |
| Less than 10 participants randomised per group | 1 [228] |
RCT = randomised controlled trial; CHO = carbohydrate.
Risk of bias in included studies
Risk of bias is reported in Table 8 and displayed in Figure 2.
Table 8. Risk of bias in overweight and obese adult population.
| First author | Year published | Random sequence generation Judgement | Random sequence generation Comment | Allocation concealment Judgement | Allocation concealment Comment | Performance bias Judgement | Performance bias Comment | Detection bias Judgement | Detection bias Comment | Attrition bias Judgement | Attrition* bias Comment (Rx/Control group) | Reporting bias Judgement | Reporting bias Comment | Other bias Judgement | Other bias Comment |
| Overweight and obese adults | |||||||||||||||
| Aude [24] | 2004 | Low risk | Block design | Unclear risk | NR | Unclear risk | Equal contact time but not blinded | Low risk | Assessors blinded | High risk | 3%/17% attrition (differential), no reasons | Low risk | Protocol not available, but prespecified and all NB outcomes addressed | High risk | Food choice advice & fibre supplements only given to Rx group |
| De Luis [27] | 2009 | Low risk | Random number list | Unclear risk | “closed envelope” | Unclear risk | Equal contact time but not blinded | Unclear risk | Not blinded | Low risk | No attrition | Low risk | Protocol not available, but prespecified and all NB outcomes addressed | High risk | Funding & COI NR, imbalanced baseline DBP, HDL, TG |
| De Luis [26] | 2012 | Unclear risk | NR | Unclear risk | NR | Unclear risk | Equal contact time but not blinded | Unclear risk | Not blinded | Low risk | No attrition | High risk | No prespecified outcomes, protocol not available | High risk | Funding & COI NR, imbalanced baseline SBP, HDL |
| Farnsworth [28] | 2003 | Unclear risk | NR | Unclear risk | NR | Unclear risk | Equal contact time but not blinded | Unclear risk | Not blinded | Unclear risk | 14% total attrition, attrition & reasons not provided per group | High risk | No prespecified outcomes, protocol not available | Unclear risk | Funding: possible influences |
| Frisch [29] | 2009 | Low risk | Computer generated random no. lists | Unclear risk | NR | Unclear risk | Equal contact time but not blinded | Unclear risk | Not blinded | Low risk | ITT analysis | Low risk | Prespecified and all NB outcomes addressed, protocol available | Low risk | - |
| Keogh [31] | 2008 | Unclear risk | NR | Unclear risk | NR | Unclear risk | Equal contact time but not blinded | Unclear risk | Not blinded | High risk | 36% total attrition, attrition & reasons not provided per group | Low risk | Prespecified and NB outcomes addressed, protocol available | High risk | Incomplete and suspected errors in reporting, imbalanced baseline TG |
| Klemsdal [32] | 2010 | Unclear risk | NR | Unclear risk | NR | Unclear risk | Equal contact time but not blinded | Unclear risk | Not blinded | Low risk | ITT analysis | Low risk | Prespecified and NB outcomes addressed, protocol available | Unclear risk | COI NR |
| Krauss [33] | 2006 | Low risk | Blocks of 4, 8, 12, 16, 20, 24 | Unclear risk | Sealed sequentially no. envelopes, not opaque | Unclear risk | Equal contact time but not blinded | Unclear risk | Not blinded | High risk | 23/14% attrition (differential), reasons not per group | High risk | Only 1 outcome prespecified, protocol not available | Unclear risk | COI NR |
| Lasker [36] | 2008 | Low risk | Block randomisation | Unclear risk | NR | Unclear risk | Equal contact time but not blinded | Unclear risk | Not blinded | High risk | 22/24% attrition, no reasons | Low risk | Protocol not available, but prespecified and all NB outcomes addressed | High risk | Funding: possible influences |
| Layman [37] | 2009 | Unclear risk | NR | Unclear risk | NR | Unclear risk | Equal contact time but not blinded | Unclear risk | Not blinded | High risk | 36/55% attrition (differential), reasons differ per group | Low risk | Protocol not available, but prespecified and all NB outcomes addressed | Unclear risk | Funding and COI reported: possible influences |
| Lim [38] | 2010 | Unclear risk | NR | Unclear risk | NR | Unclear risk | Equal contact time but not blinded | Unclear risk | Not blinded | High risk | 43/50% attrition, reasons differ per group (differential) | Low risk | Protocol not available, but prespecified and all NB outcomes addressed | Low risk | - |
| Luscombe [39] | 2003 | Unclear risk | NR | Unclear risk | NR | Unclear risk | Equal contact time but not blinded | Unclear risk | Not blinded | Low risk | No attrition | High risk | No prespecified outcomes, protocol not available | Unclear risk | COI NR; Funding: possible influences |
| Sacks [16] | 2009 | Unclear risk | NR | Low risk | Centrally | Low risk | Participants blinded | Low risk | Assessors blinded | Low risk | ITT | Low risk | Prespecified and all NB outcomes addressed, protocol available | Low risk | - |
| Wycherley [41] | 2012 | Low risk | Computer generated random no. lists | Unclear risk | NR | Unclear risk | Equal contact time but not blinded | Unclear risk | Not blinded | High risk | 44/45% attrition | Unclear risk | Protocol retrospectively registered, outcomes only specified in abstract, NB outcomes addressed | High risk | Funding: possible influence, analysis at 12 weeks only included data from 52 week completers but dropouts after 12 weeks lost less weight |
| Overweight and obese adults with Type 2 diabetes mellitus | |||||||||||||||
| Brinkworth [25] | 2004 | Low risk | Random no. generator | Unclear risk | NR | Unclear risk | Equal contact time but not blinded | Unclear risk | Not blinded | High risk | 42/42% attrition, reasons differ per group | Low risk | Protocol not available, but prespecified and all NB outcomes addressed | High risk | Imbalanced baseline weight, DBP, SBP glucose |
| Guldbrand [30] | 2012 | Low risk | Drawing blinded ballots | Unclear risk | NR | Unclear risk | Equal contact time but not blinded | Unclear risk | Not blinded | Low risk | No attrition | High risk | Protocol available: prespecified outcomes vague | High risk | Imbalanced baseline weight & BMI |
| Krebs [34] | 2012 | Low risk | Computer generated random no. | Low risk | Independent biostatistician | Unclear risk | Equal contact time but not blinded | Unclear risk | Not blinded | High risk | 30/29%, reasons differ per group (differential) | Low risk | Prespecified and NB outcomes addressed, protocol available | Low risk | - |
| Larsen [35] | 2011 | Low risk | Random block sizes | Low risk | Centrally | Unclear risk | Equal contact time but not blinded | Low risk | Assessors blinded | High risk | 16/12% attrition, reasons differ per group (differential) LOCF analysis only on some missing participants | Low risk | Prespecified and NB outcomes addressed, protocol available | Unclear risk | COI: NR |
| Parker [40] | 2002 | Unclear risk | NR | Unclear risk | NR | Unclear risk | Equal contact time but not blinded | Unclear risk | Not blinded | Unclear risk | 19/18% attrition, no reasons | High risk | No prespecified outcomes, protocol not available | High risk | COI NR; Funding: possible influences; imbalanced baseline weight & glucose |
*number of attrition per group given for longest follow-up within the categories;
BMI = body mass index; BP = blood pressures; COI = conflict of interest; DBP = diastolic blood pressure; HDL = high density lipoprotein cholesterol; ITT = intention-to-treat; LOCF: Last observation carried forward; NB = important; No = number; NR = Not reported; Rx = treatment; TG = triglycerides.
Figure 2. Risk of bias: systematic review authors' judgements about each risk of bias item presented as percentages across all included trials using the Cochrane risk of bias tool (n = 19).

Generation of sequence and allocation concealment: Ten trials reported the method of randomisation; three trials reported adequate concealment and in the rest it was unclear.
Blinding: Blinding of participants in diet trials is not easy as they usually have to follow specific dietary plans in order to attain the prescribed goals of the intervention diets. Three trials blinded the outcome assessors of which one also reported blinding the participants.
Incomplete outcome data: After 3–6 months, reported loss to follow-up ranged from no loss to 42%, peaking at 47% after 15 months in one of the trials. Ten trials had overall attrition greater than 20%, differential attrition between groups, or both. Six trials had differential loss and/or different or unspecified reasons for loss to follow-up. Seven trials had low risk of attrition bias, with four reporting no attrition and three performing intention-to-treat analysis.
Selective reporting: Six trials did not have protocols available or outcomes were not pre-specified in the methods section of the trial reports and one trial had an unclear risk of reporting bias. The remaining 12 trials were judged to have low risk of reporting bias.
Publication bias: Assessment of the funnel plot asymmetry for the five outcomes in overweight and obese adults in the early follow-up category showed that for weight loss, small studies with a negative mean difference are missing. Similarly, smaller studies appear to be missing for the other four outcomes, namely serum LDL, HDL and total cholesterol, and serum triglycerides (data not shown).
Other potential sources of bias: Nine trials were judged to have a high risk of other types of bias. Six trials were funded independently, five were funded by industry, five by a combination of independent and industry funding and the remaining three trials did not report their funding source. Four trials had low risk of other bias.
Adherence to prescribed dietary goals
Table 9 shows the energy prescriptions, the mean reported total energy intakes and the calculated adherence scores for macronutrients for all lengths of follow-up per diet group (see Table 6 for the prescribed dietary goals for the treatment and control diets per included trial). Energy prescriptions for the weight loss diets were expressed as absolute goals or ranges, or as absolute or percentage deficits, with some trials using sex-specific goals. In the 12 trials that reported group comparisons in energy intake, only one found a difference, with a lower reported intake in the balanced diet group [34] (Table 9). None of these 12 trials demonstrated a difference in weight loss between the low CHO and balanced diet groups at any follow-up category.
Table 9. Group comparisons of mean reported energy intakes and calculated adherence scores per diet group for all lengths of follow-up.
| Study ID | Length of follow-up (weeks) | Energy prescription in both groups in kJ | Mean reported energy intake (SD) in kJ | Group comparison of mean reported energy intake reported by trial authors | Adherence scoresa for macronutrients | ||
| Low CHO diet group | Balanced diet group | Low CHO diet group | Balanced diet group | ||||
| Aude 2004 | 12 | 6720 (m); 5460 (f) | – | – | NA | – | – |
| Brinkworth 2004 | all | equivalent | – | – | NA | – | – |
| De Luis 2009 | 12 | 6330 | 6502 (NR) | 6775 (NR) | – | – | – |
| De Luis 2012 | 12 | 6300–6329 | 6598 (NR) | 6779 (NR) | – | – | – |
| Farnsworth 2003 | 12 | 6000–6300 | 6300 (529) | 6500 (539) | “did not differ” | ||
| 16 | balance | 8000 (1058) | 8200 (1077) | “did not differ” | 5.93 | 4.00 | |
| Frisch 2009 | 24 | 2100 deficit | 7316 (2621) | 7489 (2507) | p = 0.636 | 5.96 | 6.13 |
| 52 | 7837 (2982) | 7787 (2621) | p = 0.903 | 7.08 | 5.19 | ||
| Guldbrand 2012 | 12–24 | 7531 (m); 6694 (f) | 5791 (1531) | 6498 (1787) | p = 0.065 for change | 7.87 | 8.54 |
| 52 | 6017 (2075) | 6619 (2075) | over all time points | ||||
| 104 | 5234 (1799) | 6104 (1891) | between groups | 13.89 | 9.49 | ||
| Keogh 2008 | 12 | 6000 | 6242 (4576) | 6262 (3876) | “did not differ” | 6.81 | 7.15 |
| 52 | – | – | NA | – | – | ||
| Klemsdal 2010 | All | 2100 deficit | – | – | NA | – | – |
| Krauss 2006 | 12 | 4200 deficit | – | – | NA | – | – |
| Krebs 2012 | 12 | 2000 deficit | 7400 (3057) | 6815 (1841) | 9.71 | 8.32 | |
| 52 | 7258 (2098) | 6784 (1792) | p = 0.012 | ||||
| 104 | 7170 (1974) | 7093 (1851) | over 104 weeks | 11.24 | 8.71 | ||
| Larsen 2011 | 12 | 6400 or 30% restriction | 6449 (2652) | 6029 (2652) | p = 0.22 for “group by | 1.85 | 8.37 |
| 52 | balance | 6664 (3233) | 6628 (3233) | time interaction” | 4.00 | 8.09 | |
| Lasker 2008 | 16 | 7100 | 6607 (1175) | 5875 (1955) | p>0.10 | 2.45 | 8.77 |
| Layman 2009 | 16 | 7100 | 6730 (1659) | 6200 (1714) | p>0.05 | 3.16 | 6.93 |
| 52 | 7118 (1793) | 6800 (1917) | p>0.05 | 6.32 | 4.69 | ||
| Lim 2010 | 12 | 6500 | 7706 (868) | 7659 (1044) | – | ||
| 24 | 7367 (1372) | 6449 (1668) | 11.10 | 2.77 | |||
| 52 | 7726 (1609) | 7124 (2287) | |||||
| 64 | 6841 (1348) | 6593 (1503) | 41.28 | 8.10 | |||
| Luscombe 2003 | 12 | 6500 | 6358 (585) | 6663 (819) | p>0.05 | ||
| 16 | 8200 | 8068 (1542) | 8235 (263) | p>0.05 | 6.18 | 4.14 | |
| Parker 2002 | 8 | 6720 | 6665 (771) | 6480 (977) | “not different” | ||
| 12 | balance | 8522 (1178 | 7497 (1645) | “not different” | 3.59 | 5.54 | |
| Sacks 2009 | 24 | 3150 deficit | 6821 (2033) | 6871 (2033) | “similar between | 10.11 | 10.07 |
| 104 | 5935 (1793) | 6430 (2016) | groups” | 10.04 | 14.24 | ||
| Wycherley 2012 | 12 | 7000 | 7134 (771) | 7189 (535) | p = 0.73 | 3.83 | 7.83 |
| 52 | 7629 (1085) | 7243 (739) | p = 0.09 | 7.64 | 11.55 | ||
–: not reported; CHO: carbohydrate; f: females, m: males; kJ: kilojoules; NA: not applicable; SD: standard deviation
Arbitrary adherence score, calculated using a Mahalanobis distance equation, represents the degree of deviation from the prescribed goals for macronutrients in the two diet groups. A lower score reflects better adherence and a higher score reflects poorer adherence.
Thirteen and eight trials reported mean CHO, fat and protein intakes at 3–6 months and 1–2 years, respectively (Table 9). Calculated adherence scores were variable across the two diet groups and follow-up categories. Four trials showed similar adherence (difference in scores between groups <1) to prescribed macronutrient goals in the two diet groups after 3–6 month follow-up [16], [29]–[31]. Five trials showed better adherence in the low CHO diet groups [35]–[37], [40], [41] and four trials showed better adherence in the balanced diet group [28], [34], [38], [39]. At 1–2 years follow-up, there were greater discrepancies in the adherence scores between the two diet groups. The low CHO diet group showed better adherence to macronutrient prescriptions in three trials [16], [35], [41] and the balanced diet group showed better adherence in five trials [29], [30], [34], [37], [38] (Table 9).
Effects of interventions
The effect estimates between the two dietary variants (high fat and high protein) did not show a qualitative difference and the heterogeneity between the groups was small or not detectable, so we pooled data across the two low CHO diet variants in the analysis.
Trials in participants without type 2 diabetes
Total weight loss
At 3–6 months, the average weight loss in trials in the low CHO group ranged from 2.65 to 10.2 kg and in the isoenergetic balanced diet group from 2.65 to 9.4 kg. At 1–2 years, the range of weight loss was 2.9 to 12.3 kg with low CHO diets and 3.5 to 10.9 kg with isoenergetic balanced diets.
The meta-analysis of the mean difference in weight loss between the low CHO and balanced diets did not demonstrate a difference at 3–6 months (−0.74 kg, 95%CI −1.49 to 0.01; 14 trials) (Table 10; Figure 3); and at 1–2 years (−0.48 kg, 95%CI −1.44 to 0.49; 7 trials) (Table 11; Figure 4). In the study [16] that concealed allocation, there was no mean difference in weight loss at 3–6 months (0.20 kg, 95%CI −0.88 to 1.28; n = 402) and at 1–2 years (0.60 kg, 95%CI −0.76 to 1.96).
Table 10. Summary of findings for meta-analysis of low carbohydrate diets compared with balanced diets for overweight and obese adults: 3–6 months follow-up.
| Patient or population: overweight and obese adults without type 2 diabetes |
| Settings: primary care |
| Intervention: low carbohydrate diets (includes high fat and high protein variants) |
| Comparison: balanced diets |
| Follow-up: 3–6 months after starting diet |
CI: Confidence interval ;
Note this is the univariate average change observed between follow-up and baseline in the control group.
GRADE Working Group grades of evidence.
High quality: Further research is very unlikely to change our confidence in the estimate of effect.
Moderate quality: Further research is likely to have an important impact on our confidence in the estimate of effect and may change the estimate.
Low quality: Further research is very likely to have an important impact on our confidence in the estimate of effect and is likely to change the estimate.
Very low quality: We are very uncertain about the estimate.
Downgraded by 1 for risk of bias: 8 of 14 studies did not report adequate sequence generation and 13 studies did not report adequate allocation concealment. 4 studies had high total attrition (>20%) and 2 other studies had differential attrition.
Not downgraded for inconsistency: no qualitative heterogeneity; some quantitative heterogeneity, to be expected.
Downgraded by 1 for risk of bias: 1 study did not report adequate sequence generation, none of the studies reported on allocation concealment and 1 study had high total attrition (>20%).
Downgraded by 1 for risk of bias: 5 of 8 studies did not report adequate sequence generation and 7 studies did not report adequate allocation concealment. 2 studies had high total attrition (>20%).
Downgraded by 1 for inconsistency: Mean differences were on opposite sides of the line of no difference (I2 51%).
Downgraded by 1 for risk of bias: 5 of 8 studies did not report adequate sequence generation and 7 studies did not report adequate allocation concealment. 2 studies had high total attrition (>20%).
Downgraded by 1 for risk of bias: 5 of 12 studies did not report adequate sequence generation and 11 studies did not report adequate allocation concealment. 3 studies had high total attrition (>20%) and 2 other studies had differential attrition.
Downgraded by 1 for risk of bias: 6 of 12 studies did not report adequate sequence generation and 11 studies did not report adequate allocation concealment. 3 studies had high total attrition (>20%) and 2 studies had differential attrition.
Downgraded by 1 for inconsistency: Mean differences were on opposite sides of the line of no difference (I2 63%).
Downgraded by 1 for risk of bias: 6 of 12 studies did not report adequate sequence generation and 11 studies did not report adequate allocation concealment. 3 studies had had total attrition (>20%) and 2 studies had differential attrition.
Downgraded by 1 for inconsistency: Mean differences were on opposite sides of the line of no difference (I2 72%).
Figure 3. Forest plot of low carbohydrate versus balanced diets in overweight and obese adults for weight loss (kg) at 3–6 months.

Table 11. Summary of findings for low carbohydrate diets compared with balanced diets for overweight and obese adults at 1–2 years follow-up.
| Patient or population: overweight and obese adults without type 2 diabetes |
| Settings: primary care |
| Intervention: low carbohydrate diets (includes high fat and high protein variants) |
| Comparison: balanced diets |
| Follow-up: 1–2 years after starting diet |
CI: Confidence interval;
Note this is the univariate average change observed between follow-up and baseline in the control group.
GRADE Working Group grades of evidence.
High quality: Further research is very unlikely to change our confidence in the estimate of effect.
Moderate quality: Further research is likely to have an important impact on our confidence in the estimate of effect and may change the estimate.
Low quality: Further research is very likely to have an important impact on our confidence in the estimate of effect and is likely to change the estimate.
Very low quality: We are very uncertain about the estimate.
Downgraded by 1 for risk of bias: 5 of 7 studies did not report adequate sequence generation and only 1 reported adequate allocation concealment. 5 studies were judged to have a high or unclear risk of attrition bias.
Downgraded by 1 for risk of bias: the study did not report adequate allocation concealment and reasons for attrition differed between groups.
Downgraded by 1 for imprecision: difference in mean BMI change ranges from a reduction of −0.94 to an increase of 0.14 kg/m2 (approximately equivalent to 2 to 4 kilograms).
Downgraded by 1 for risk of bias: 4 of 6 studies did not report adequate sequence generation and 5 studies did not report adequate allocation concealment. 2 studies had high total attrition (>20%), 1 of which also had differential attrition.
Figure 4. Forest plot of low carbohydrate versus balanced diets in overweight and obese adults for weight loss (kg) at 1–2 years.

A few studies reported change in BMI. As with weight, average BMI was lower after dieting in both diet groups, but with no difference detected at either 3–6 months across the 4 trials reporting this (Table 10; Figure S2A in Supporting Information S2), or in the one trial reporting this at 1–2 years (Table 11; Figure S2B in Supporting Information S2).
Blood pressure
At 3–6 months, the average DBP compared to baseline in each study was reduced in both the low CHO group (range: −10 to −1 mmHg) and in those on balanced diets (range: −14 to −1 mmHg). At 1–2 years, the average drop within studies compared to baseline ranged from 9 mmHg lower to no change in DBP with low CHO and a reduction across studies with balanced diets of 11 to 1 mmHg.
The meta-analyses of the mean difference in DBP change did not demonstrate a difference between the low CHO and balanced diets at 3–6 months (95%CI −1.53 to 1.36; 8 trials) (Table 10; Figure S2C in Supporting Information S2) and at 1–2 years (95%CI −1.68 to 1.62; 6 trials) (Table 11; Figure S2D in Supporting Information S2). (In one of the trials [26], the mean SBP value after three months in the low CHO group was reported as 103.1±13.7 mmHg (corresponding reported mean baseline value of 138.6±16.8 mmHg). We suspected this very low SBP value to be a typographical error, but did not receive a response after contacting the authors and therefore excluded this data from the meta-analysis.)
At 3–6 months, the average SBP in each study compared to baseline showed a drop in both the low CHO (range: −15 to −2 mmHg) and balanced diet groups (range: −16 to −1 mmHg) in all trials. At 1–2 years, average SBP decreased with low CHO (range: −10.6 to −0.9 mmHg) and either decreased or increased with balanced diets (range: −10 to 8 mmHg). The increase was observed in a small trial (n = 25) with 48% attrition when the trial ended after one year [31].
The meta-analysis of the mean difference in SBP change showed no difference after 3–6 months (−1.26 mmHg, 95%CI −2.67 to 0.15; 7 trials) (Table 10; Figure S2E in Supporting Information S2) and after 1–2 years (−2.00 mmHg, 95%CI −5.00 to 1.00; 6 trials) (Table 11; Figure S2F in Supporting Information S2).
Blood lipids
At 3–6 months, compared to baseline, average LDL and total cholesterol were inconsistent across trials with low CHO diets (range LDL: −0.62 to 0.3 mmol/L; total cholesterol: −0.71 to 0.1 mmol/L), while these values decreased with balanced diets in each of the 12 trials that reported these values (range LDL: −0.82 to −0.03 mmol/L; total cholesterol: −0.88 to −0.07 mmol/L). Average changes in HDL and TG from baseline varied with low CHO (range HDL: −0.07 to 0.1 mmol/L; TG: −0.64 to 0.01 mmol/L) and balanced diets (range HDL: −0.1 to 0.08 mmol/L; TG: −0.49 to 0.01 mmol/L). At 1–2 years, average lipid marker changes from baseline were inconsistent in both diet groups across trials, with variations in ranges of change that were similar to those reported at 3–6 months.
The meta-analyses of the mean differences in blood lipids between the low CHO and balanced diets were small in both follow-up categories, with narrow confidence intervals suggesting little or no difference in effect between the two diets (Tables 10 and 11; Figures S2G to S2N in Supporting Information S2).
Fasting blood glucose
From baseline to 3–6 months, average FBG decreased with low CHO (range −0.47 to −0.06 mmol/L) and balanced diets (range −0.52 to −0.1 mmol/L), and at 1–2 years average changes were variable with low CHO (range: −0.71 to 0.17 mmol/L) and balanced diets (range: of −0.4 to 0.06 mmol/L). The meta-analysis showed no difference between low CHO and balanced diets in FBG change at either 3–6 months (0.05 mmol/l, 95%CI −0.05 to 0.15; 10 trials; Figure S2O in Supporting Information S2) or 1–2 years (0.0 mmol/L, 95%CI −0.16 to 0.16; 6 trials; Figure S2P in Supporting Information S2).
Trials in participants with type 2 diabetes
Total weight loss
Average weight loss was evident at 3–6 months with low CHO (range: 2.79 to 5.5 kg) and isoenergetic balanced diets (range: 3.08 to 5.4 kg), and similarly with both diets at 1–2 years (range low CHO diets: 2 to 3.9 kg; range balanced diets: 2.1 to 6 kg) in all trials. The meta-analysis of the mean difference in weight loss between the low CHO and balanced diets did not demonstrate a difference at 3–6 months (0.82 kg, 95%CI −1.25 to 2.90; 5 trials) (Table 12; Figure 5); and at 1–2 years (0.91 kg, 95%CI −2.08 to 3.89; 4 trials) (Table 13; Figure 6).
Table 12. Summary of findings for low carbohydrate diets compared with balanced diets for overweight and obese adults with type 2 diabetes mellitus at 3–6 months follow-up.
| Patient or population: overweight or obese adults with type 2 diabetes |
| Settings: primary care |
| Intervention: low carbohydrate diets (includes high fat and high protein variants) |
| Comparison: balanced diets |
| Follow-up: 3–6 months after starting diet |
CI: Confidence interval;
Note this is the univariate average change observed between follow-up and baseline in the control group.
GRADE Working Group grades of evidence.
High quality: Further research is very unlikely to change our confidence in the estimate of effect.
Moderate quality: Further research is likely to have an important impact on our confidence in the estimate of effect and may change the estimate.
Low quality: Further research is very likely to have an important impact on our confidence in the estimate of effect and is likely to change the estimate.
Very low quality: We are very uncertain about the estimate.
Downgraded by 1 for risk of bias: 1 of 5 studies did not report adequate sequence generation and 3 of 5 studies did not report adequate allocation concealment. 1 study had high total attrition (>20%) and 2 studies had differential attrition.
Downgraded by 1 for imprecision: difference in mean weight loss ranges from a loss of 1.25 to a gain of 2.9 kilograms.
Downgraded by 1 for risk of bias: 1 out of 5 studies did not report adequate sequence generation and 3 out of 5 studies did not report allocation concealment. 1 study had high total attrition and 2 studies had differential attrition.
Downgraded by 1 for risk of bias: 2 of 4 studies did not report adequate allocation concealment. 1 study had high total attrition (>20%) and 2 studies had differential attrition.
Downgraded by 1 for imprecision: difference in mean systolic blood pressure ranges from a reduction of 3.14 to an increase of 4.36 mmHg.
Downgraded for risk of bias: 1 of 4 studies did not report adequate sequence generation and 2 studies did not report adequate allocation concealment. 2 studies had differential attrition.
Downgraded by 1 for imprecision: confidence interval range is 0.5 mmol/L.
Figure 5. Forest plot of low carbohydrate versus balanced diets in overweight and obese adults with type 2 diabetes for weight loss (kg) at 3–6 months.

Table 13. Summary of findings for low carbohydrate diets compared with balanced diets for overweight and obese adults with type 2 diabetes mellitus at 1–2 years follow-up.
| Patient or population: overweight or obese adults with type 2 diabetes |
| Settings: primary care |
| Intervention: low carbohydrate diets (high fat and high protein variants combined) |
| Comparison: balanced diets |
| Follow-up: 1–2 years after starting diet |
CI: Confidence interval;
Note this is the univariate average change observed between follow-up and baseline in the control group.
GRADE Working Group grades of evidence.
High quality: Further research is very unlikely to change our confidence in the estimate of effect.
Moderate quality: Further research is likely to have an important impact on our confidence in the estimate of effect and may change the estimate.
Low quality: Further research is very likely to have an important impact on our confidence in the estimate of effect and is likely to change the estimate.
Very low quality: We are very uncertain about the estimate.
Downgraded by 1 for risk of bias: 2 of 4 studies did not report adequate allocation concealment. 1 study had high total attrition (>20%) and 2 studies had differential attrition.
Downgraded by 1 for imprecision: The 95% confidence interval includes both a loss of 2.08 kg and a gain of 3.89 kg.
Downgraded by 1 for risk of bias: 2 of 4 studies did not report adequate allocation concealment, 2 studies had high total attrition (>20%), 2 studies had differential attrition.
Downgraded by 1 for risk of bias: 1 of 3 studies did not report adequate allocation concealment. 2 studies had high total attrition (>20%), 2 studies had differential attrition.
Downgraded by 1 for imprecision: confidence interval range is about 0.7 mmol/L.
Figure 6. Forest plot of low carbohydrate versus balanced diets in overweight and obese adults with type 2 diabetes for weight loss (kg) at 1–2 years.

A single trial found no difference in BMI change between the low CHO (high fat variant) and balanced diets at 3–6 months (Figures S3A and S3B in Supporting Information S3).
Markers of glycaemic control
At 3–6 months, compared to baseline, changes in average HbA1c varied across studies with low CHO diets (range: −0.54 to 0%), and decreased in each study with balanced diets (range: −0.51 to −0.3%). At 1–2 years, average HbA1c changes from baseline were inconsistent in both diet groups across trials (range low CHO: −0.23 to 0.1%; balanced: −0.28 to 0.4%).
The meta-analyses of the mean difference in HbA1c change did not demonstrate a difference between the low CHO and balanced diets at 3–6 months (0.19%, 95%CI −0.0 to 0.39; 5 trials) (Table 12; Figure S3C in Supporting Information S3) and at 1–2 years (0.01%, 95%CI −0.28 to 0.30, 4 trials) (Table 13; Figure S3D in Supporting Information S3).
Similarly, no mean difference in FBG change between low CHO and balanced diets was detected by meta-analysis of 2 studies at 3–6 months (Figure S3E in Supporting Information S3). One trial reported no difference in FBG change after 15 months (Figure S3F in Supporting Information S3).
Blood pressure
Average changes in DBP from baseline varied at 3–6 months with low CHO (range: −4 to 2.24 mmHg) and balanced diets (range: −3 to 1.63 mmHg) and also at 1–2 years (range low CHO: −5 to 0.21 mmHg; balanced: −6 to 2.5 mmHg).
The meta-analyses of the mean difference in DBP change did not demonstrate a difference between the low CHO and balanced diets at 3–6 months (95%CI −1.77 to 3.30; 4 trials) (Table 12; Figure S3G in Supporting Information S3) and at1–2 years (95%CI −1.95 to 2.13, 4 trials) (Table 13; Figure S3H in Supporting Information S3).
The average SBP in each study compared to baseline showed a drop in both the low CHO (range: −9 to −1 mmHg) and balanced diets (range: −8 to −0.06 mmHg) at 3–6 months, with varied changes at 1–2 years (range low CHO: −9 to 2.2 mmHg; balanced: −11 to 3.7 mmHg).
The meta-analysis of the mean difference in SBP change showed no difference after 3–6 months (95%CI −3.14 to 4.36; 4 trials) (Table 12; Figure S3I in Supporting Information S3) and after 1–2 years (95%CI −3.10 to 3.72; 4 trials) (Table 13; Figure S3J in Supporting Information S3).
Blood lipids
At 3–6 months, blood lipids (LDL, HDL, total cholesterol, TG) showed variable changes from baseline in both low CHO and balanced diets. Overall, changes from baseline were inconsistent between the diet groups and for both follow-up categories. The changes on meta-analysis were small suggesting little or no difference in effect between the two diets (Table 12 and 13; Figures S3K to S3R in Supporting Information S3).
Discussion
This review, including 19 RCTs with 3209 participants showed there is probably little or no difference in changes in weight and cardiovascular and diabetes risk factors with low CHO weight loss diets compared to isoenergetic balanced weight loss diets. This was in both overweight and obese adults without diabetes and those with diabetes, with follow-up for up to two years. When reported, energy intake was similar in the diet groups being compared, but participants did not adhere fully to the prescribed macronutrient goals for both diets in most trials.
Overweight and obese adults without type 2 diabetes
Weight loss
Participants lost weight in both groups, with similar before and after average loss after 3–6 months, and 1–2 years of follow-up. There was little or no difference in weight loss and change in BMI between the low CHO and balanced weight loss diets in the two follow-up periods. The similar reported mean energy intakes in the low CHO and balanced diet groups and the corresponding similar average weight loss in the diet groups supports the fundamental physiologic principle of energy balance, namely that a sustained energy deficit results in weight loss regardless of macronutrient composition of the diet [43].
Norms for defining “stable weight” are gaining less than or equal to 2 kg and losing less than 2 kg [44] indicating that both low CHO and balanced weight loss diets (or energy-restricted diets) result in meaningful weight loss. Clearly, the goal of any healthy weight loss strategy should be to achieve weight loss and to subsequently maintain this over the long-term. The 2013 AHA/ACC/TOS Guideline for the Management of Overweight and Obesity in Adults state that strategies for weight maintenance after successful loss differ from the strategies for achieving weight loss and make recommendations in this regard [44].
Impacts on markers of cardiovascular risk
Weight loss improves markers of cardiovascular risk [45]–[47]. According to the 2013 AHA/ACC/TOS Guideline [44], based largely on systematic reviews, clinically meaningful changes in CVD risk indicators are associated with a loss of at least 2.5 kg, or 2% of body weight, achieved with lifestyle interventions over one to four years. This document states that at a 5% weight loss, a weighted mean reduction in DBP of about 2 mmHg and in SBP of about 3 mmHg is observed [44]. Correspondingly, the weight loss in both diet groups in our review was accompanied by reductions in average DBP and SBP in all trials. In line with the weight loss findings, there is probably little or no difference in SBP changes after 3–6 months and there may be little or no difference in DBP changes between the low CHO and balanced diet groups. After 1–2 years, there is probably little or no difference in changes in DBP and SBP between the diet groups. These judgements are based on both the meta-analyses and the quality of the evidence for these outcomes per length of follow-up category.
When considering blood lipid changes, a weight loss of 5 kg to 8 kg is reported to result in LDL cholesterol reduction of approximately 0.13 mmol/L and an increase in HDL cholesterol of between 0.05 to 0.08 mmol/L [44]. In overweight and obese adults with and without CVD risk who lose 3 kg on a lifestyle intervention, a weighted reduction in serum TG of approximately 0.17 mmol/L is observed [44]. In the trials in our review, effects on blood lipids and FBG with low CHO and balanced diets were variable, with greater and lesser average changes in LDL, HDL and TG than the observations described above. When comparing low CHO and isoenergetic balanced diets, the pooled mean differences across the trials and quality of evidence indicate that there is probably little or no difference in changes in LDL, HDL and total cholesterol and there may be little or no difference in TG change at 3–6 months. Similarly, after 1–2 years, there is probably little or no difference in serum LDL and total cholesterol and TG between the diet groups. Meta-analysis of HDL cholesterol difference was 0.04 mmol/L higher with low CHO diets compared to balanced diets after 1–2 years, but the difference was not clinically meaningful, and no difference was detected for LDL.
The primary reason for the moderate grade of evidence in most outcomes at 3–6 months and 1–2 years is the risk of selection, performance and attrition bias in most included trials. For serum triglycerides, inconsistency (as discussed above) in effects resulted in further downgrading to low quality indicative of less confidence in the findings. Similarly, for DBP at 3–6 months, inconsistency in the mean differences across the different trials resulted in further downgrading to low quality evidence. This inconsistency could not be explained by the different variants of the low CHO diet. Most of the inconsistency can be ascribed to two trials [32], [41] with similar weights in the meta-analysis (19.5% and 15.5%, respectively) that produced significant opposite mean differences for DBP. Klemsdal and colleagues [32] found that the low CHO diet reduced DBP more than the balanced diet (−3.40 mmHg, 95%CI −6.02 to −0.78). They reported that this observation should be interpreted with some caution, since blood pressure was a secondary endpoint in the study and the effect on SBP did not differ between the two groups. This effect was no longer significant at one year. In contrast, Wycherley and colleagues [41] reported a greater reduction in DBP with the balanced diet compared to the low CHO diet (4.00 mmHg, 95%CI 0.58 to 7.42). Similarly, this difference in effect was not found for SBP and disappeared at one year. The heterogeneity may also be attributable to differences in dietary adherence, as well as mean baseline DBP in one trial [27] that could be judged as being imbalanced (85.8 and 80.7 mmHg in low CHO and balanced diet groups, respectively). Although not reported, it could be argued that differences in the sodium and potassium content of the intervention diets may explain some of the variable effects on DBP.
Overweight and obese adults with type 2 diabetes mellitus
Weight loss
Both low CHO diets and balanced weight loss diets showed similar weight loss on average after 3–6 months and after 1–2 years. Meta-analysis and quality of evidence indicate that in overweight and obese adults with type 2 diabetes there may be little or no difference in weight loss after 3–6 months and 1–2 years. The earlier discussion of the long-term effects of dieting on weight loss is also applicable in this population.
Impacts on glycaemic control and cardiovascular risk
Weight loss is associated with improvements in glycaemia in overweight and obese adults with type 2 diabetes. According to the 2013 AHA/ACC/TOS Guideline, 2% to 5% weight loss achieved with one to four years of lifestyle intervention results in modest reductions in FBG and lowering of HbA1c by 0.2% to 0.3% [44]. Along with weight loss in both diet groups in our included trials, both low CHO and balanced diet groups showed similar reductions in average HbA1c in most trials after 3–6 months. At 1–2 years average HbA1c change was more variable. Comparing these changes by combining data across trials indicated that there is probably little or no difference in changes in HbA1c between the two diets at 3–6 months and 1–2 years. The meta-analysis at 3–6 months of two small trials [25], [40] showed similar findings for FBG concentrations. Only one of these trials went on to report FBG at 15 months and had the same finding [25].
Effects on DBP with low CHO and balanced diets were variable in most trials, showing both reductions and increases. Both the low CHO and balanced weight loss diets demonstrated reductions in average SBP in all trials after 3–6 months, but effects were variable with both diets after 1–2 years. Based on both the meta-analyses and the quality of the evidence, there is probably little or no difference in DBP change between the two diets and there may be little or no difference in SBP change after 3–6 months. After 1–2 years, there is probably little or no difference in changes in both DBP and SBP.
Effects on blood lipids with low CHO and balanced diets were variable between included trials, as was seen in the non-diabetic population. Considering the meta-analyses and the quality of the evidence, there is probably little or no difference in changes in LDL, HDL and total cholesterol after 3–6 months and 1–2 years when comparing the two diets. There may be little or no difference in changes in TG concentrations after 3–6 months and 1–2 years.
As in the non-diabetic overweight and obese population, the presence of risk of selection, performance and attrition bias in most included trials were the primary reasons for the moderate grade of evidence in most outcomes in the diabetic population. For weight loss at 3–6 months and 1–2 years follow-up, imprecision of the effect estimates resulted in further downgrading to low quality evidence. Similarly, the evidence for triglycerides for both follow-up categories and for SBP at 3–6 months was downgraded due to imprecision of the effect estimates. These imprecise estimates possibly relate to the smaller samples in the diabetes population.
Adherence
Assessment of adherence to energy prescriptions across the 19 trials was problematic due to the different methods used to express prescriptions and the lack of reported energy intake data in some trials. The dietary intake methodology used also varied between the included trials, with trials using food records/diaries, single or multiple 24 hour recalls, food frequency questionnaires or combinations of these methods.
From the calculated adherence scores it was clear that strict adherence to prescribed macronutrient goals failed with both diets in most trials and generally declined with longer follow-up. This diminished adherence after the first few months has been well documented in weight loss trials [48]–[51] and is more likely in weight loss diets involving extreme dietary changes such as drastic restrictions of entire food groups. This is supported by the fact that trials of low CHO diets have reported a very low incidence of urinary ketosis after six months [49]–[51], which suggests that most overweight participants in weight loss trials struggle to sustain a low intake of CHO. It could thus be argued that overweight participants following reduced energy weight loss diets in trials tend to revert to their usual macronutrient intakes over time, but may nonetheless, be able to lose weight if they are able to maintain the energy deficit. The novelty factor attached to a particular diet, media attention, and the opinion of the researchers involved could possibly affect the adherence of participants to any type of diet. It is clear from this and other research [52] that one of the pertinent issues in the treatment of overweight and obesity relates to the improvement of behavioural adherence to reduced dietary energy intake. It should be noted that the adherence score is based on calculations using mean reported intakes of macronutrients (% of total energy) and thus does not consider the variation around the mean.
Overall completeness and applicability of evidence
The findings of our review need to be interpreted in light of the presence of risk of bias or lack of power or both in many of the included trials, the possibility that adherence to dietary macronutrient goals were not optimal and that there was inter-trial variation in quantity (and type) of fat consumed. The interpretation of many weight loss trials is limited by a lack of blinded ascertainment of the outcome, small samples, large loss to follow-up, potentially limited generalisability and a lack of data on adherence to assigned diets [53]. These limitations all apply to the evidence assessed in our systematic review. Strengths of our review include the clear definitions used in relation to the energy content and macronutrient composition of treatment and control diets, as well as the restriction of included studies to those testing diets only thereby reducing the risk of confounding by co-interventions. By considering only isoenergetic comparisons we also avoided the problem of the effect of energy imbalance between the comparison groups being confounded with any potential effect of macronutrient manipulation on the outcomes being investigated. Furthermore, we only included studies with follow-up of 12 weeks or more to allow for sufficient time to detect weight and CVD risk factor changes and assessed outcomes at defined lengths of follow-up. These methods differentiate our systematic review from previous reviews on this topic.
Our results show that the weight loss in overweight and obese subjects with or without diabetes on isoenergetic low CHO or balanced weight loss diets was similar at 3–6 months and at 1–2 years. Thus, the weight loss is the result of a reduction in total dietary energy intake rather than manipulation of macronutrient contribution. It follows that when considering dietary strategies for weight loss, less emphasis should be placed on an ‘ideal’ macronutrient composition and more emphasis on reduction in total energy intake, as well as improvement of behavioural adherence to reduced energy intake. This will go a long way to ensure that weight loss is achieved and maintained to gain health benefits. Guidance on macronutrient composition to meet nutritional requirements and prevent disease [12]–[15] remains integral to healthy sustainable weight management.
The small size and short duration of weight loss trials often account for their lack of definitive evidence of the effectiveness of dietary interventions on CVD risk. By contrast sound observational data, population-level interventions and “natural experiments” in whole populations have demonstrated a reduction in population risk with adoption of recommended, balanced dietary strategies to lower cardiovascular risk. For example, over the past three decades, levels of population cardiovascular risk factors have declined in Finland, with the greatest change being dietary behaviour (reduction in total and saturated fat and increased vegetables and fruit intake). These declines explain most of the observed decline in CHD mortality in the Finnish middle-aged population over this period [54]. Mortality due to coronary heart disease was reduced in Poland over a ten year period by partly replacing dietary saturated fats with polyunsaturated fats while maintaining a low intake of trans fatty acids [55]. A large prospective cohort study in 30 to 49 year old Swedish women (n = 43396; average follow-up 15.7 years) reported significantly increased incidence of cardiovascular disease overall (n = 1270) with a one tenth decrease in carbohydrate intake or increase in protein intake, or a two unit increase in the low carbohydrate-high protein score [9].
Our systematic review did not address macronutrient quality of the diets, specifically the quality of CHO and fat, which along with total macronutrient quantities and proportions, explains the effects of diet on cardiovascular risk [56]. The replacement nutrient is central to these effects. When foods high in CHO are avoided and replaced with high protein foods, reliance on animal protein sources becomes necessary since most foods with significant amounts of plant protein are also high in CHO (e.g. legumes). This reliance on animal protein will result in a greater intake of both total and especially saturated fat leading to higher serum HDL and LDL cholesterol over time. Substitution of saturated fat with polyunsaturated fats reduces coronary heart disease risk [57], [58], while substitution with high glycaemic index CHO increases risk [59]. LDL-cholesterol is a causal risk factor for heart disease and reducing LDL cholesterol has been shown to be effective in reducing risk of heart disease irrespective of the presence of prior heart disease, age, sex, hypertension and diabetes [60]–[62]. Mendelian randomisation studies have demonstrated a 54% reduction in coronary heart disease risk per 1 mmol/l lower serum LDL cholesterol over a lifetime [62]. Treatment of elevated cholesterol levels reduces coronary heart disease risk, with clinical trials demonstrating a 24% reduction in risk per 1 mmol/l reduction in LDL over 5 years [60]. Furthermore, the role of ultra-processed products in the etiology and treatment of obesity and NCD is a pertinent consideration in this area [63], [64]. The inconsistent changes in blood lipids and markers of diabetes risk with both diets in the trials may be attributable to differences in the quality of macronutrients in the intervention diets, for example, different intakes of saturated fat and/or types of carbohydrates (low or high glycaemic), an issue which was beyond the scope of our review. These inconsistences may also be attributable to participants not fully adhering to the prescribed total macronutrient goals for each of the diets, as evident from the adherence data.
Any dietary guidelines for health should be sustainable in the long-term, specifically in terms of ease of adherence, availability and affordability of foods, as well as social and cultural acceptability. Bearing this in mind, the dietary approach for weight management should be one that is nutritionally sound, not harmful and feasible to maintain over time. Such diets can be tailored to the needs of individuals on the basis of each individual's complete health and risk profile, for example existing lipid abnormalities and comorbidities, as well as food preferences, socioeconomic circumstances and personal and cultural preferences, thereby improving the chances of longer term success. Suitably qualified healthcare professionals should guide the tailoring of dietary advice for individuals. Monitoring and follow-up by a healthcare professional during a dietary weight loss intervention is known to positively affect outcomes [16]. The demonstrated value of combining dietary and other positive lifestyle interventions such as increased physical activity for weight loss and reduction of cardiovascular risk, is also important to keep in mind [65], [66].
Potential biases in the review process
Three prominent electronic databases were searched and two authors carried out the various steps in the review (screening and selecting, extracting, risk of bias assessment, analysing, collation and interpretation). Although we planned not to include non-English randomised controlled trials, we did not come across any potentially eligible studies that we needed to exclude based on language.
Conclusions
Trials show weight loss in the short-term irrespective of whether the diet is low CHO or balanced in terms of its macronutrient composition. There is probably little or no difference in weight loss and changes in cardiovascular risk factors up to two years of follow-up when overweight and obese adults, with or without type 2 diabetes, are randomised to low CHO diets and isoenergetic balanced weight loss diets.
Supporting Information
(PDF)
A critical summary of existing systematic reviews.
(DOCX)
Forest plots of meta-analyses in overweight and obese adults without type 2 diabetes mellitus. Figure S2A: Forest plot of low carbohydrate versus balanced diets in overweight and obese adults for body mass index (kg/m2) at three to six months. Figure S2B: Forest plot of low carbohydrate versus balanced diets in overweight and obese adults for body mass index (kg/m2) at one year. Figure S2C: Forest plot of low carbohydrate versus balanced diets in overweight and obese adults for diastolic blood pressure (mmHg) at three to six months. Figure S2D: Forest plot of low carbohydrate versus balanced diets in overweight and obese adults for diastolic blood pressure (mmHg) at one to two years. Figure S2E: Forest plot of low carbohydrate versus balanced diets in overweight and obese adults for systolic blood pressure (mmHg) at three to six months. Figure S2F: Forest plot of low carbohydrate versus balanced diets in overweight and obese adults for systolic blood pressure (mmHg) at one to two years. Figure S2G: Forest plot of low carbohydrate versus balanced diets in overweight and obese adults for serum LDL cholesterol (mmol/L) at three to six months. Figure S2H: Forest plot of low carbohydrate versus balanced diets in overweight and obese adults for serum LDL cholesterol (mmol/L) at one to two years. Figure S2I: Forest plot of low carbohydrate versus balanced diets in overweight and obese adults for serum HDL cholesterol (mmol/L) at three to six months. Figure S2J: Forest plot of low carbohydrate versus balanced diets in overweight and obese adults for HDL cholesterol (mmol/L) at one to two years. Figure S2K: Forest plot of low carbohydrate versus balanced diets in overweight and obese adults for serum total cholesterol (mmol/L) at three to six months. Figure S2L: Forest plot of low carbohydrate versus balanced diets in overweight and obese adults for serum total cholesterol (mmol/L) at one to two years. Figure S2M: Forest plot of low carbohydrate versus balanced diets in overweight and obese adults for serum triglycerides (mmol/L) at three to six months. Figure S2N: Forest plot of low carbohydrate versus balanced diets in overweight and obese adults for serum triglycerides (mmol/L) at one to two years. Figure S2O: Forest plot of low carbohydrate versus balanced diets in overweight and obese adults for fasting blood glucose (mmol/L) at three to six months. Figure S2P: Forest plot of low carbohydrate versus balanced diets in overweight and obese adults for fasting blood glucose (mmol/L) at one to two years.
(DOCX)
Forest plots of meta-analyses in overweight and obese adults with type 2 diabetes mellitus. Figure S3A: Forest plot of low carbohydrate versus balanced diets in overweight and obese adults with type 2 diabetes mellitus for body mass index (kg/m2) at three to six months. Figure S3B: Forest plot of low carbohydrate versus balanced diets in overweight and obese adults with type 2 diabetes mellitus of body mass index (kg/m2) at two years. Figure S2C: Forest plot of low carbohydrate versus balanced diets in overweight and obese adults with type 2 diabetes mellitus for glycosylated hemoglobin (%) at three to six months. Figure S3D: Forest plot of low carbohydrate versus balanced diets in overweight and obese adults with type 2 diabetes mellitus for glycolosated hemoglobin (%) at one to two years. Figure S3E: Forest plot of low carbohydrate versus balanced diets in overweight and obese adults with type 2 diabetes mellitus for fasting blood glucose (mmol/L) at three to six months. Figure S3F: Forest plot of low carbohydrate versus balanced diets in overweight and obese adults with type 2 diabetes mellitus for fasting blood glucose (mmol/L) at 15 months. Figure S3G: Forest plot of low carbohydrate versus balanced diets in overweight and obese adults with type 2 diabetes mellitus for diastolic blood pressure (mmHg) at three to six months. Figure S3H: Forest plot of low carbohydrate versus balanced diets in overweight and obese adults with type 2 diabetes mellitus for diastolic blood pressure (mmHg) at one to two years. Figure S3I: Forest plot of low carbohydrate versus balanced diets in overweight and obese adults with type 2 diabetes mellitus for systolic blood pressure (mmHg) at three to six months. Figure S3J: Forest plot of low carbohydrate versus balanced diets in overweight and obese adults with type 2 diabetes mellitus for systolic blood pressure (mmHg) at one to two years. Figure S3K: Forest plot of low carbohydrate versus balanced diets in overweight and obese adults with type 2 diabetes mellitus for LDL cholesterol (mmol/L) at three to six months. Figure S3L: Forest plot of low carbohydrate versus balanced diets in overweight and obese adults with type 2 diabetes mellitus for LDL cholesterol (mmol/L) at one to two years. Figure S3M: Forest plot of low carbohydrate versus balanced diets in overweight and obese adults with type 2 diabetes mellitus for HDL cholesterol (mmol/L) at three to six months. Figure S3N: Forest plot of low carbohydrate versus balanced diets in overweight and obese adults with type 2 diabetes mellitus for HDL cholesterol (mmol/L) at one to two years. Figure S3O: Forest plot of low carbohydrate versus balanced diets in overweight and obese adults with type 2 diabetes mellitus of total cholesterol (mmol/L) at three to six months. Figure S3P: Forest plot of low carbohydrate versus balanced diets in overweight and obese adults with type 2 diabetes mellitus for total cholesterol (mmol/L) at one to two years. Figure S3Q: Forest plot of low carbohydrate versus balanced diets in overweight and obese adults with type 2 diabetes mellitus for triglycerides (mmol/L) at three to six months. Figure S3R: Forest plot of low carbohydrate versus balanced diets in overweight and obese adults with type 2 diabetes mellitus for triglycerides (mmol/L) at one to two years.
(DOCX)
Acknowledgments
We acknowledge Elizabeth Pienaar for searching EMBASE.
Funding Statement
This review was funded by the Effective Health Care Research Consortium and the South African Medical Research Council. CN is funded by the Centre for Evidence-based Health Care (CEBHC) and the South African Medical Research Council. AS and TY are funded by CEBHC. MS is funded by University of Cape Town. JV is funded by Stellenbosch University and the South African Cochrane Centre. PG is funded by the University of Liverpool and the Evidence Building and Synthesis Research Consortium. The funders had no role in study design, data collection and analysis, decision to publish, or preparation of the manuscript.
References
- 1. Swinburn BA, Sacks G, Hall KD, McPherson K, Finegood DT, et al. (2011) The global obesity pandemic: shaped by global drivers and local environments. Lancet 378: 804–814. [DOI] [PubMed] [Google Scholar]
- 2.World Health Organization (2004) Global strategy on diet, physical activity and health. World Health Assembly Resolution 57.17. Geneva: World Health Organization [Google Scholar]
- 3.World Health Organization (2010) Global status report on noncommunicable diseases 2010. Geneva: World Health Organization [Google Scholar]
- 4. Abegunde DO, Mathers CD, Adam T, Ortegon M, Strong K (2007) The burden and costs of chronic diseases in low-income and middle-income countries. Lancet 370: 1929–1938. [DOI] [PubMed] [Google Scholar]
- 5.World Health Organization (2008) The global burden of disease: 2004 update. Geneva, World Health Organization, 2008. Geneva: World Health Organization [Google Scholar]
- 6.Atkins Nutritionals (2011) New Atkins. http://sa.atkins.com/. Atkins Nutritionals.
- 7.WebMD (2012) The Atkins Diet. http://www.webmd.com/diet/atkins-diet-what-it-is. WebMD.
- 8. Noakes TD (2013) Low-carbohydrate and high-fat intake can manage obesity and associated conditions: Occasional survey. S Afr Med J 103: 826–830. [DOI] [PubMed] [Google Scholar]
- 9. Lagiou P, Sandin S, Lof M, Trichopoulos D, Adami HO, et al. (2012) Low carbohydrate-high protein diet and incidence of cardiovascular diseases in Swedish women: prospective cohort study. BMJ 344: e4026. [DOI] [PMC free article] [PubMed] [Google Scholar]
- 10. Noto H, Goto A, Tsujimoto T, Noda M (2013) Low-carbohydrate diets and all-cause mortality: a systematic review and meta-analysis of observational studies. PLoS One 8: e55030. [DOI] [PMC free article] [PubMed] [Google Scholar]
- 11. Sjogren P, Becker W, Warensjo E, Olsson E, Byberg L, et al. (2010) Mediterranean and carbohydrate-restricted diets and mortality among elderly men: a cohort study in Sweden. Am J Clin Nutr 92: 967–974. [DOI] [PubMed] [Google Scholar]
- 12.Australian National Health and Medical Research Council and the New Zealand Ministry of Health (2006) Nutrient Reference Values for Australia and New Zealand: Including Recommended Dietary Intakes. Canberra: Australian National Health and Medical Research Council and the New Zealand Ministry of Health. [Google Scholar]
- 13.EFSA Panel on Dietetic Products Nutrition and Allergies (NDA) (2010) Dietary Reference Values Parma: European Food Safety Authority (EFSA).
- 14.Institute of Medicine Food and Nutrition Board (2002/2005) Dietary Reference Intakes for Energy, Carbohydrate, Fiber, Fat, Fatty Acids, Cholesterol, Protein, and Amino Acids (Macronutrients). Washington, DC: National Academies Press. [Google Scholar]
- 15.NNR Project Group (2004) Nordic Nutrition Recommendations NNR 2004. Working Group on Diet and Nutrition, NKE, Nordic Committee of Senior Officials for Food Issues, EK-Livs.
- 16. Sacks FM, Bray GA, Carey VJ, Smith SR, Ryan DH, et al. (2009) Comparison of weight-loss diets with different compositions of fat, protein, and carbohydrates. N Engl J Med 360: 859–873. [DOI] [PMC free article] [PubMed] [Google Scholar]
- 17.Higgins D, Green S, editors (2011) Cochrane Handbook for Systematic Reviews of Interventions Version 5.1.1 [updated March 2011]. London: John Wiley & Sons, Ltd. [Google Scholar]
- 18.Rencher AC (2002) Characterizing and displaying multivariate data. Methods of Multivariate Analysis. Hoboken NJ: John Wiley. pp. 43–81. [Google Scholar]
- 19.The Nordic Cochrane Centre: The Cochrane Collaboration (2011) Review Manager (RevMan) 5.1 ed. Copenhagen: The Cochrane Collaboration, 2011. [Google Scholar]
- 20. Higgins JP, Thompson SG (2002) Quantifying heterogeneity in a meta-analysis. Stat Med 21: 1539–1558. [DOI] [PubMed] [Google Scholar]
- 21.GRADE Working Group (2004–2007) GRADEprofiler (GRADEpro). 3.2.2 ed.
- 22. Atkins D, Best D, Briss PA, Eccles M, Falck-Ytter Y, et al. (2004) Grading quality of evidence and strength of recommendations. BMJ 328: 1490. [DOI] [PMC free article] [PubMed] [Google Scholar]
- 23. Glenton C, Santesso N, Rosenbaum S, Nilsen ES, Rader T, et al. (2010) Presenting the results of Cochrane Systematic Reviews to a consumer audience: a qualitative study. Med Decis Making 30: 566–577. [DOI] [PubMed] [Google Scholar]
- 24. Aude YW, Agatston AS, Lopez-Jimenez F, Lieberman EH, Marie A, et al. (2004) The national cholesterol education program diet vs a diet lower in carbohydrates and higher in protein and monounsaturated fat: a randomized trial. Arch Intern Med 164: 2141–2146. [DOI] [PubMed] [Google Scholar]
- 25. Brinkworth GD, Noakes M, Parker B, Foster P, Clifton PM (2004) Long-term effects of advice to consume a high-protein, low-fat diet, rather than a conventional weight-loss diet, in obese adults with type 2 diabetes: one-year follow-up of a randomised trial. Diabetologia 47: 1677–1686. [DOI] [PubMed] [Google Scholar]
- 26. de Luis DA, Aller R, Izaola O, de la Fuente B, Conde R, et al. (2012) Evaluation of weight loss and adipocytokines levels after two hypocaloric diets with different macronutrient distribution in obese subjects with rs9939609 gene variant. Diabetes Metab Res Rev 28: 663–668. [DOI] [PubMed] [Google Scholar]
- 27. de Luis DA, Sagrado MG, Conde R, Aller R, Izaola O (2009) The effects of two different hypocaloric diets on glucagon-like peptide 1 in obese adults, relation with insulin response after weight loss. J Diabetes Complications 23: 239–243. [DOI] [PubMed] [Google Scholar]
- 28. Farnsworth E, Luscombe ND, Noakes M, Wittert G, Argyiou E, et al. (2003) Effect of a high-protein, energy-restricted diet on body composition, glycemic control, and lipid concentrations in overweight and obese hyperinsulinemic men and women. Am J Clin Nutr 78: 31–39. [DOI] [PubMed] [Google Scholar]
- 29. Frisch S, Zittermann A, Berthold HK, Gotting C, Kuhn J, et al. (2009) A randomized controlled trial on the efficacy of carbohydrate-reduced or fat-reduced diets in patients attending a telemedically guided weight loss program. Cardiovasc Diabetol 8: 36. [DOI] [PMC free article] [PubMed] [Google Scholar]
- 30. Guldbrand H, Dizdar B, Bunjaku B, Lindstrom T, Bachrach-Lindstrom M, et al. (2012) In type 2 diabetes, randomisation to advice to follow a low-carbohydrate diet transiently improves glycaemic control compared with advice to follow a low-fat diet producing a similar weight loss. Diabetologia 55: 2118–2127. [DOI] [PMC free article] [PubMed] [Google Scholar]
- 31. Keogh JB, Brinkworth GD, Clifton PM (2007) Effects of weight loss on a low-carbohydrate diet on flow-mediated dilatation, adhesion molecules and adiponectin. British Journal of Nutrition 98: 852–859. [DOI] [PubMed] [Google Scholar]
- 32. Klemsdal TO, Holme I, Nerland H, Pedersen TR, Tonstad S (2010) Effects of a low glycemic load diet versus a low-fat diet in subjects with and without the metabolic syndrome. Nutr Metab Cardiovasc Dis 20: 195–201. [DOI] [PubMed] [Google Scholar]
- 33. Krauss RM, Blanche PJ, Rawlings RS, Fernstrom HS, Williams PT (2006) Separate effects of reduced carbohydrate intake and weight loss on atherogenic dyslipidemia. Am J Clin Nutr 83: 1025–1031; quiz 1205. [DOI] [PubMed] [Google Scholar]
- 34. Krebs JD, Elley CR, Parry-Strong A, Lunt H, Drury PL, et al. (2012) The Diabetes Excess Weight Loss (DEWL) Trial: a randomised controlled trial of high-protein versus high-carbohydrate diets over 2 years in type 2 diabetes. Diabetologia 55: 905–914. [DOI] [PubMed] [Google Scholar]
- 35. Larsen RN, Mann NJ, Maclean E, Shaw JE (2011) The effect of high-protein, low-carbohydrate diets in the treatment of type 2 diabetes: a 12 month randomised controlled trial. Diabetologia 54: 731–740. [DOI] [PubMed] [Google Scholar]
- 36. Lasker DA, Evans EM, Layman DK (2008) Moderate carbohydrate, moderate protein weight loss diet reduces cardiovascular disease risk compared to high carbohydrate, low protein diet in obese adults: A randomized clinical trial. Nutr Metab (Lond) 5: 30. [DOI] [PMC free article] [PubMed] [Google Scholar]
- 37. Layman DK, Evans EM, Erickson D, Seyler J, Weber J, et al. (2009) A moderate-protein diet produces sustained weight loss and long-term changes in body composition and blood lipids in obese adults. J Nutr 139: 514–521. [DOI] [PubMed] [Google Scholar]
- 38. Lim SS, Noakes M, Keogh JB, Clifton PM (2010) Long-term effects of a low carbohydrate, low fat or high unsaturated fat diet compared to a no-intervention control. Nutr Metab Cardiovasc Dis 20: 599–607. [DOI] [PubMed] [Google Scholar]
- 39. Luscombe ND, Clifton PM, Noakes M, Farnsworth E, Wittert G (2003) Effect of a high-protein, energy-restricted diet on weight loss and energy expenditure after weight stabilization in hyperinsulinemic subjects. Int J Obes Relat Metab Disord 27: 582–590. [DOI] [PubMed] [Google Scholar]
- 40. Parker B, Noakes M, Luscombe N, Clifton P (2002) Effect of a high-protein, high-monounsaturated fat weight loss diet on glycemic control and lipid levels in type 2 diabetes. Diabetes Care 25: 425–430. [DOI] [PubMed] [Google Scholar]
- 41. Wycherley TP, Brinkworth GD, Clifton PM, Noakes M (2012) Comparison of the effects of 52 weeks weight loss with either a high-protein or high-carbohydrate diet on body composition and cardiometabolic risk factors in overweight and obese males. Nutr Diabetes 2: e40. [DOI] [PMC free article] [PubMed] [Google Scholar]
- 42.World Health Organization (1995) Physical status: the use and interpretation of anthropometry. Report of a WHO Expert Committee. Geneva: World Health Organization [PubMed] [Google Scholar]
- 43. Hall KD, Sacks G, Chandramohan D, Chow CC, Wang YC, et al. (2011) Quantification of the effect of energy imbalance on bodyweight. Lancet 378: 826–837. [DOI] [PMC free article] [PubMed] [Google Scholar]
- 44. Jensen MD, Ryan DH, Apovian CM, Ard JD, Comuzzie AG, et al. (2013) 2013 AHA/ACC/TOS Guideline for the Management of Overweight and Obesity in Adults: A Report of the American College of Cardiology/American Heart Association Task Force on Practice Guidelines and The Obesity Society. Circulation [Google Scholar]
- 45. Avenell A, Broom J, Brown TJ, Poobalan A, Aucott L, et al. (2004) Systematic review of the long-term effects and economic consequences of treatments for obesity and implications for health improvement. Health Technol Assess 8: iii–iv, 1–182. [DOI] [PubMed] [Google Scholar]
- 46. Douketis JD, Macie C, Thabane L, Williamson DF (2005) Systematic review of long-term weight loss studies in obese adults: clinical significance and applicability to clinical practice. Int J Obes (Lond) 29: 1153–1167. [DOI] [PubMed] [Google Scholar]
- 47. Neter JE, Stam BE, Kok FJ, Grobbee DE, Geleijnse JM (2003) Influence of weight reduction on blood pressure: a meta-analysis of randomized controlled trials. Hypertension 42: 878–884. [DOI] [PubMed] [Google Scholar]
- 48. Brehm BJ, Seeley RJ, Daniels SR, D'Alessio DA (2003) A randomized trial comparing a very low carbohydrate diet and a calorie-restricted low fat diet on body weight and cardiovascular risk factors in healthy women. J Clin Endocrinol Metab 88: 1617–1623. [DOI] [PubMed] [Google Scholar]
- 49. Foster GD, Wyatt HR, Hill JO, McGuckin BG, Brill C, et al. (2003) A randomized trial of a low-carbohydrate diet for obesity. New England Journal of Medicine 348: 2082–2090. [DOI] [PubMed] [Google Scholar]
- 50. Shai I, Schwarzfuchs D, Henkin Y, Shahar DR, Witkow S, et al. (2008) Weight loss with a low-carbohydrate, Mediterranean, or low-fat diet. N Engl J Med 359: 229–241. [DOI] [PubMed] [Google Scholar]
- 51. Yancy WS Jr, Olsen MK, Guyton JR, Bakst RP, Westman EC (2004) A low-carbohydrate, ketogenic diet versus a low-fat diet to treat obesity and hyperlipidemia: a randomized, controlled trial. Ann Intern Med 140: 769–777. [DOI] [PubMed] [Google Scholar]
- 52. Alhassan S, Kim S, Bersamin A, King AC, Gardner CD (2008) Dietary adherence and weight loss success among overweight women: results from the A TO Z weight loss study. Int J Obes (Lond) 32: 985–991. [DOI] [PMC free article] [PubMed] [Google Scholar]
- 53. Simons-Morton DG, Obarzanek E, Cutler JA (2006) Obesity research–limitations of methods, measurements, and medications. JAMA 295: 826–828. [DOI] [PubMed] [Google Scholar]
- 54. Vartiainen E, Laatikainen T, Peltonen M, Juolevi A, Mannisto S, et al. (2010) Thirty-five-year trends in cardiovascular risk factors in Finland. Int J Epidemiol 39: 504–518. [DOI] [PubMed] [Google Scholar]
- 55. Zatonski WA, Willett W (2005) Changes in dietary fat and declining coronary heart disease in Poland: population based study. BMJ 331: 187–188. [DOI] [PMC free article] [PubMed] [Google Scholar]
- 56. Mensink RP, Zock PL, Kester AD, Katan MB (2003) Effects of dietary fatty acids and carbohydrates on the ratio of serum total to HDL cholesterol and on serum lipids and apolipoproteins: a meta-analysis of 60 controlled trials. Am J Clin Nutr 77: 1146–1155. [DOI] [PubMed] [Google Scholar]
- 57. Jakobsen MU, O'Reilly EJ, Heitmann BL, Pereira MA, Balter K, et al. (2009) Major types of dietary fat and risk of coronary heart disease: a pooled analysis of 11 cohort studies. Am J Clin Nutr 89: 1425–1432. [DOI] [PMC free article] [PubMed] [Google Scholar]
- 58. Mozaffarian D, Micha R, Wallace S (2010) Effects on coronary heart disease of increasing polyunsaturated fat in place of saturated fat: a systematic review and meta-analysis of randomized controlled trials. PLoS Med 7: e1000252. [DOI] [PMC free article] [PubMed] [Google Scholar]
- 59. Jakobsen MU, Dethlefsen C, Joensen AM, Stegger J, Tjonneland A, et al. (2010) Intake of carbohydrates compared with intake of saturated fatty acids and risk of myocardial infarction: importance of the glycemic index. Am J Clin Nutr 91: 1764–1768. [DOI] [PubMed] [Google Scholar]
- 60. Baigent C, Keech A, Kearney PM, Blackwell L, Buck G, et al. (2005) Efficacy and safety of cholesterol-lowering treatment: prospective meta-analysis of data from 90,056 participants in 14 randomised trials of statins. Lancet 366: 1267–1278. [DOI] [PubMed] [Google Scholar]
- 61. Cohen JC, Boerwinkle E, Mosley TH Jr, Hobbs HH (2006) Sequence variations in PCSK9, low LDL, and protection against coronary heart disease. N Engl J Med 354: 1264–1272. [DOI] [PubMed] [Google Scholar]
- 62. Ference BA, Yoo W, Alesh I, Mahajan N, Mirowska KK, et al. (2012) Effect of long-term exposure to lower low-density lipoprotein cholesterol beginning early in life on the risk of coronary heart disease: a Mendelian randomization analysis. J Am Coll Cardiol 60: 2631–2639. [DOI] [PubMed] [Google Scholar]
- 63. Monteiro CA, Moubarac JC, Cannon G, Ng SW, Popkin B (2013) Ultra-processed products are becoming dominant in the global food system. Obes Rev 14 (Suppl 2) 21–28. [DOI] [PubMed] [Google Scholar]
- 64. Moodie R, Stuckler D, Monteiro C, Sheron N, Neal B, et al. (2013) Profits and pandemics: prevention of harmful effects of tobacco, alcohol, and ultra-processed food and drink industries. Lancet 381: 670–679. [DOI] [PubMed] [Google Scholar]
- 65. Galani C, Schneider H (2007) Prevention and treatment of obesity with lifestyle interventions: review and meta-analysis. Int J Public Health 52: 348–359. [DOI] [PubMed] [Google Scholar]
- 66. Groeneveld IF, Proper KI, van der Beek AJ, Hildebrandt VH, van Mechelen W (2010) Lifestyle-focused interventions at the workplace to reduce the risk of cardiovascular disease–a systematic review. Scand J Work Environ Health 36: 202–215. [DOI] [PubMed] [Google Scholar]
- 67.Zone Labs (2012) Dr Sears Zone Diet. http://www.zonediet.com/. Zone Labs Inc.
- 68.Barnett J (2009) The Zone Diet Explained. http://crossfitimpulse.com/the-zone-diet-explained-edited. Crossfit Impulse.
- 69.British Dietetic Association (2013) Weight wise Eating well: Your weight loss plan. http://www.bdaweightwise.com/eating/eating_plan.html. British Dietetic Association.
- 70. Becker W, Lyhne N, Pedersen AN, Aro A, Fogelholm M, et al. (2004) Nordic Nutrition Recommendations 2004 - integrating nutrition and physical activity. Scandinavian Journal of Nutrition 48: 178–187. [Google Scholar]
- 71. Abete I, Parra D, De Morentin BM, Alfredo Martinez J (2009) Effects of two energy-restricted diets differing in the carbohydrate/protein ratio on weight loss and oxidative changes of obese men. International Journal of Food Sciences & Nutrition 60: 1–13. [DOI] [PubMed] [Google Scholar]
- 72. Carter JD, Vasey FB, Valeriano J (2006) The effect of a low-carbohydrate diet on bone turnover. Osteoporos Int 17: 1398–1403. [DOI] [PubMed] [Google Scholar]
- 73. Wang YF, Yancy WS Jr, Yu D, Champagne C, Appel LJ, et al. (2008) The relationship between dietary protein intake and blood pressure: results from the PREMIER study. J Hum Hypertens 22: 745–754. [DOI] [PubMed] [Google Scholar]
- 74. Nielsen JV, Jonsson E, Nilsson AK (2005) Lasting improvement of hyperglycaemia and bodyweight: low-carbohydrate diet in type 2 diabetes–a brief report. Ups J Med Sci 110: 69–73. [DOI] [PubMed] [Google Scholar]
- 75. Al-Sarraj T, Saadi H, Calle MC, Volek JS, Fernandez ML (2009) Carbohydrate restriction, as a first-line dietary intervention, effectively reduces biomarkers of metabolic syndrome in Emirati adults. Journal of Nutrition 139: 1667–1676. [DOI] [PubMed] [Google Scholar]
- 76. Ashton EL, Pomeroy S, Foster JE, Kaye RS, Nestel PJ, et al. (2000) Diet high in monounsaturated fat does not have a different effect on arterial elasticity than a low-fat, high-carbohydrate diet. Journal of the American Dietetic Association 100: 537–542. [DOI] [PubMed] [Google Scholar]
- 77. Baba NH, Sawaya S, Torbay N, Habbal Z, Azar S, et al. (1999) High protein vs high carbohydrate hypoenergetic diet for the treatment of obese hyperinsulinemic subjects. Int J Obes Relat Metab Disord 23: 1202–1206. [DOI] [PubMed] [Google Scholar]
- 78. Bradley U, Spence M, Courtney CH, McKinley MC, Ennis CN, et al. (2009) Low-fat versus low-carbohydrate weight reduction diets: effects on weight loss, insulin resistance, and cardiovascular risk: a randomized control trial. Diabetes 58: 2741–2748. [DOI] [PMC free article] [PubMed] [Google Scholar]
- 79. Buscemi S, Verga S, Tranchina MR, Cottone S, Cerasola G (2009) Effects of hypocaloric very-low-carbohydrate diet vs. Mediterranean diet on endothelial function in obese women*. Eur J Clin Invest 39: 339–347. [DOI] [PubMed] [Google Scholar]
- 80. De Natale C, Annuzzi G, Bozzetto L, Mazzarella R, Costabile G, et al. (2009) Effects of a plant-based high-carbohydrate/high-fiber diet versus high-monounsaturated fat/low-carbohydrate diet on postprandial lipids in type 2 diabetic patients. Diabetes Care 32: 2168–2173. [DOI] [PMC free article] [PubMed] [Google Scholar]
- 81. Dreon DM, Fernstrom HA, Williams PT, Krauss RM (1999) A very low-fat diet is not associated with improved lipoprotein profiles in men with a predominance of large, low-density lipoproteins. Am J Clin Nutr 69: 411–418. [DOI] [PubMed] [Google Scholar]
- 82. Egert S, Kratz M, Kannenberg F, Fobker M, Wahrburg U (2010) Effects of high-fat and low-fat diets rich in monounsaturated fatty acids on serum lipids, LDL size and indices of lipid peroxidation in healthy non-obese men and women when consumed under controlled conditions. Eur J Nutr 50: 71–79. [DOI] [PubMed] [Google Scholar]
- 83. Gerhard GT, Ahmann A, Meeuws K, McMurry MP, Duell PB, et al. (2004) Effects of a low-fat diet compared with those of a high-monounsaturated fat diet on body weight, plasma lipids and lipoproteins, and glycemic control in type 2 diabetes. Am J Clin Nutr 80: 668–673. [DOI] [PubMed] [Google Scholar]
- 84. Halyburton AK, Brinkworth GD, Wilson CJ, Noakes M, Buckley JD, et al. (2007) Low- and high-carbohydrate weight-loss diets have similar effects on mood but not cognitive performance. Am J Clin Nutr 86: 580–587. [DOI] [PubMed] [Google Scholar]
- 85. Holloway CJ, Cochlin LE, Emmanuel Y, Murray A, Codreanu I, et al. (2011) A high-fat diet impairs cardiac high-energy phosphate metabolism and cognitive function in healthy human subjects. Am J Clin Nutr 93: 748–755. [DOI] [PubMed] [Google Scholar]
- 86. Hodson L, Harnden KE, Roberts R, Dennis AL, Frayn KN (2010) Does the DASH diet lower blood pressure by altering peripheral vascular function? J Hum Hypertens 24: 312–319. [DOI] [PubMed] [Google Scholar]
- 87. Jenkins DJ, Wong JM, Kendall CW, Esfahani A, Ng VW, et al. (2009) The effect of a plant-based low-carbohydrate (“Eco-Atkins”) diet on body weight and blood lipid concentrations in hyperlipidemic subjects. Arch Intern Med 169: 1046–1054. [DOI] [PubMed] [Google Scholar]
- 88. Jeppesen J, Schaaf P, Jones C, Zhou MY, Chen YD, et al. (1997) Effects of low-fat, high-carbohydrate diets on risk factors for ischemic heart disease in postmenopausal women. Am J Clin Nutr 65: 1027–1033. [DOI] [PubMed] [Google Scholar]
- 89. Johnston CS, Tjonn SL, Swan PD (2004) High-protein, low-fat diets are effective for weight loss and favorably alter biomarkers in healthy adults. Journal of Nutrition 134: 586–591. [DOI] [PubMed] [Google Scholar]
- 90. Johnston CS, Tjonn SL, Swan PD, White A, Hutchins H, et al. (2006) Ketogenic low-carbohydrate diets have no metabolic advantage over nonketogenic low-carbohydrate diets. Am J Clin Nutr 83: 1055–1061. [DOI] [PubMed] [Google Scholar]
- 91. Johnstone AM, Lobley GE, Horgan GW, Bremner DM, Fyfe CL, et al. (2011) Effects of a high-protein, low-carbohydrate v. high-protein, moderate-carbohydrate weight-loss diet on antioxidant status, endothelial markers and plasma indices of the cardiometabolic profile. British Journal of Nutrition 106: 282–291. [DOI] [PubMed] [Google Scholar]
- 92. Kasim-Karakas SE, Almario RU, Cunningham W (2009) Effects of protein versus simple sugar intake on weight loss in polycystic ovary syndrome (according to the National Institutes of Health criteria). Fertil Steril 92: 262–270. [DOI] [PubMed] [Google Scholar]
- 93. Kleiner RE, Hutchins AM, Johnston CS, Swan PD (2006) Effects of an 8-week high-protein or high-carbohydrate diet in adults with hyperinsulinemia. MedGenMed 8: 39. [PMC free article] [PubMed] [Google Scholar]
- 94. Krauss RM, Dreon DM (1995) Low-density-lipoprotein subclasses and response to a low-fat diet in healthy men. Am J Clin Nutr 62: 478S–487S. [DOI] [PubMed] [Google Scholar]
- 95. Labayen I, Diez N, Gonzalez A, Parra D, Martinez JA (2003) Effects of protein vs. carbohydrate-rich diets on fuel utilisation in obese women during weight loss. Forum Nutr 56: 168–170. [PubMed] [Google Scholar]
- 96. Layman DK, Boileau RA, Erickson DJ, Painter JE, Shiue H, et al. (2003) A reduced ratio of dietary carbohydrate to protein improves body composition and blood lipid profiles during weight loss in adult women. Journal of Nutrition 133: 411–417. [DOI] [PubMed] [Google Scholar]
- 97. Lefevre M, Champagne CM, Tulley RT, Rood JC, Most MM (2005) Individual variability in cardiovascular disease risk factor responses to low-fat and low-saturated-fat diets in men: body mass index, adiposity, and insulin resistance predict changes in LDL cholesterol. Am J Clin Nutr 82: 957–963. [DOI] [PubMed] [Google Scholar]
- 98. Mangravite LM, Chiu S, Wojnoonski K, Rawlings RS, Bergeron N, et al. (2011) Changes in atherogenic dyslipidemia induced by carbohydrate restriction in men are dependent on dietary protein source. Journal of Nutrition 141: 2180–2185. [DOI] [PMC free article] [PubMed] [Google Scholar]
- 99. Meckling KA, O'Sullivan C, Saari D (2004) Comparison of a low-fat diet to a low-carbohydrate diet on weight loss, body composition, and risk factors for diabetes and cardiovascular disease in free-living, overweight men and women. Journal of Clinical Endocrinology & Metabolism 89: 2717–2723. [DOI] [PubMed] [Google Scholar]
- 100. Miller M, Beach V, Sorkin JD, Mangano C, Dobmeier C, et al. (2009) Comparative effects of three popular diets on lipids, endothelial function, and C-reactive protein during weight maintenance. Journal of the American Dietetic Association 109: 713–717. [DOI] [PMC free article] [PubMed] [Google Scholar]
- 101. Papakonstantinou E, Triantafillidou D, Panagiotakos DB, Koutsovasilis A, Saliaris M, et al. (2010) A high-protein low-fat diet is more effective in improving blood pressure and triglycerides in calorie-restricted obese individuals with newly diagnosed type 2 diabetes. European Journal of Clinical Nutrition 64: 595–602. [DOI] [PubMed] [Google Scholar]
- 102. Pereira MA, Swain J, Goldfine AB, Rifai N, Ludwig DS (2004) Effects of a low-glycemic load diet on resting energy expenditure and heart disease risk factors during weight loss. JAMA 292: 2482–2490. [DOI] [PubMed] [Google Scholar]
- 103. Petersen M, Taylor MA, Saris WH, Verdich C, Toubro S, et al. (2006) Randomized, multi-center trial of two hypo-energetic diets in obese subjects: high- versus low-fat content. Int J Obes 30: 552–560. [DOI] [PubMed] [Google Scholar]
- 104. Phillips SA, Jurva JW, Syed AQ, Kulinski JP, Pleuss J, et al. (2008) Benefit of low-fat over low-carbohydrate diet on endothelial health in obesity. Hypertension 51: 376–382. [DOI] [PMC free article] [PubMed] [Google Scholar]
- 105. Segal-Isaacson CJ, Johnson S, Tomuta V, Cowell B, Stein DT (2004) A randomized trial comparing low-fat and low-carbohydrate diets matched for energy and protein. Obes Res 12: 130S–140S. [DOI] [PubMed] [Google Scholar]
- 106. Sharman MJ, Gomez AL, Kraemer WJ, Volek JS (2004) Very low-carbohydrate and low-fat diets affect fasting lipids and postprandial lipemia differently in overweight men. Journal of Nutrition 134: 880–885. [DOI] [PubMed] [Google Scholar]
- 107. Stamets K, Taylor DS, Kunselman A, Demers LM, Pelkman CL, et al. (2004) A randomized trial of the effects of two types of short-term hypocaloric diets on weight loss in women with polycystic ovary syndrome. Fertil Steril 81: 630–637. [DOI] [PubMed] [Google Scholar]
- 108. Stoernell CK, Tangney CC, Rockway SW (2008) Short-term changes in lipoprotein subclasses and C-reactive protein levels of hypertriglyceridemic adults on low-carbohydrate and low-fat diets. Nutr Res 28: 443–449. [DOI] [PubMed] [Google Scholar]
- 109. Te Morenga LA, Levers MT, Williams SM, Brown RC, Mann J (2011) Comparison of high protein and high fiber weight-loss diets in women with risk factors for the metabolic syndrome: a randomized trial. Nutrition Journal 10: 40. [DOI] [PMC free article] [PubMed] [Google Scholar]
- 110. Torbay N, Hwalla Baba N, Sawaya S, Bajjani R, Habbal Z, et al. (2002) High protein vs high carbohydrate hypoenergetic diet in treatment of obese normoinsulinemic and hyperinsulinemic subjects. Nutrition research (New York, NY) 22: 587–598. [Google Scholar]
- 111. Turley ML, Skeaff CM, Mann JI, Cox B (1998) The effect of a low-fat, high-carbohydrate diet on serum high density lipoprotein cholesterol and triglyceride. European Journal of Clinical Nutrition 52: 728–732. [DOI] [PubMed] [Google Scholar]
- 112. Varady KA, Bhutani S, Klempel MC, Phillips SA (2011) Improvements in vascular health by a low-fat diet, but not a high-fat diet, are mediated by changes in adipocyte biology. Nutrition Journal 10: 8. [DOI] [PMC free article] [PubMed] [Google Scholar]
- 113. Volek JS, Sharman MJ, Gomez AL, Scheett TP, Kraemer WJ (2003) An isoenergetic very low carbohydrate diet improves serum HDL cholesterol and triacylglycerol concentrations, the total cholesterol to HDL cholesterol ratio and postprandial pipemic responses compared with a low fat diet in normal weight, normolipidemic women. Journal of Nutrition 133: 2756–2761. [DOI] [PubMed] [Google Scholar]
- 114. Keogh JB, Brinkworth GD, Noakes M, Belobrajdic DP, Buckley JD, et al. (2008) Effects of weight loss from a very-low-carbohydrate diet on endothelial function and markers of cardiovascular disease risk in subjects with abdominal obesity. Am J Clin Nutr 87: 567–576. [DOI] [PubMed] [Google Scholar]
- 115. Belobrajdic DP, Frystyk J, Jeyaratnaganthan N, Espelund U, Flyvbjerg A, et al. (2010) Moderate energy restriction-induced weight loss affects circulating IGF levels independent of dietary composition. Eur J Endocrinol 162: 1075–1082. [DOI] [PubMed] [Google Scholar]
- 116. Berglund L, Oliver EH, Fontanez N, Holleran S, Matthews K, et al. (1999) HDL-subpopulation patterns in response to reductions in dietary total and saturated fat intakes in healthy subjects. Am J Clin Nutr 70: 992–1000. [DOI] [PubMed] [Google Scholar]
- 117. Camhi SM, Stefanick ML, Katzmarzyk PT, Young DR (2009) Metabolic syndrome and changes in body fat from a low-fat diet and/or exercise randomized controlled trial. Obesity (Silver Spring) 18: 548–554. [DOI] [PMC free article] [PubMed] [Google Scholar]
- 118. Campbell DD, Meckling KA (2012) Effect of the protein:carbohydrate ratio in hypoenergetic diets on metabolic syndrome risk factors in exercising overweight and obese women. Br J Nutr 108: 1658–1671. [DOI] [PubMed] [Google Scholar]
- 119. Carty CL, Kooperberg C, Neuhouser ML, Tinker L, Howard B, et al. (2010) Low-fat dietary pattern and change in body-composition traits in the Women's Health Initiative Dietary Modification Trial. Am J Clin Nutr 93: 516–524. [DOI] [PMC free article] [PubMed] [Google Scholar]
- 120. Daly ME, Paisey R, Millward BA, Eccles C, Williams K, et al. (2006) Short-term effects of severe dietary carbohydrate-restriction advice in Type 2 diabetes–a randomized controlled trial. Diabet Med 23: 15–20. [DOI] [PubMed] [Google Scholar]
- 121. Davis NJ, Tomuta N, Schechter C, Isasi CR, Segal-Isaacson CJ, et al. (2009) Comparative study of the effects of a 1-year dietary intervention of a low-carbohydrate diet versus a low-fat diet on weight and glycemic control in type 2 diabetes. Diabetes Care 32: 1147–1152. [DOI] [PMC free article] [PubMed] [Google Scholar]
- 122. Donnelly JE, Sullivan DK, Smith BK, Jacobsen DJ, Washburn RA, et al. (2008) Alteration of dietary fat intake to prevent weight gain: Jayhawk Observed Eating Trial. Obesity 16: 107–112. [DOI] [PubMed] [Google Scholar]
- 123. Erlinger TP, Miller ER 3rd, Charleston J, Appel LJ (2003) Inflammation modifies the effects of a reduced-fat low-cholesterol diet on lipids: results from the DASH-sodium trial. Circulation 108: 150–154. [DOI] [PubMed] [Google Scholar]
- 124. Estruch R, Martinez-Gonzalez MA, Corella D, Salas-Salvado J, Ruiz-Gutierrez V, et al. (2006) Effects of a Mediterranean-style diet on cardiovascular risk factors: a randomized trial. Ann Intern Med 145: 1–11. [DOI] [PubMed] [Google Scholar]
- 125. Hartwich J, Malec MM, Partyka L, Perez-Martinez P, Marin C, et al. (2009) The effect of the plasma n-3/n-6 polyunsaturated fatty acid ratio on the dietary LDL phenotype transformation - insights from the LIPGENE study. Clin Nutr 28: 510–515. [DOI] [PubMed] [Google Scholar]
- 126. Haufe S, Engeli S, Kast P, Bohnke J, Utz W, et al. (2011) Randomized comparison of reduced fat and reduced carbohydrate hypocaloric diets on intrahepatic fat in overweight and obese human subjects. Hepatology 53: 1504–1514. [DOI] [PubMed] [Google Scholar]
- 127. Hoy MK, Winters BL, Chlebowski RT, Papoutsakis C, Shapiro A, et al. (2009) Implementing a low-fat eating plan in the Women's Intervention Nutrition Study. Journal of the American Dietetic Association 109: 688–696. [DOI] [PMC free article] [PubMed] [Google Scholar]
- 128. Lindeberg S, Jonsson T, Granfeldt Y, Borgstrand E, Soffman J, et al. (2007) A Palaeolithic diet improves glucose tolerance more than a Mediterranean-like diet in individuals with ischaemic heart disease. Diabetologia 50: 1795–1807. [DOI] [PubMed] [Google Scholar]
- 129. Paniagua JA, Perez-Martinez P, Gjelstad IM, Tierney AC, Delgado-Lista J, et al. (2011) A low-fat high-carbohydrate diet supplemented with long-chain n-3 PUFA reduces the risk of the metabolic syndrome. Atherosclerosis 218: 443–450. [DOI] [PubMed] [Google Scholar]
- 130. Pascale RW, Wing RR, Butler BA, Mullen M, Bononi P (1995) Effects of a behavioral weight loss program stressing calorie restriction versus calorie plus fat restriction in obese individuals with NIDDM or a family history of diabetes. Diabetes Care 18: 1241–1248. [DOI] [PubMed] [Google Scholar]
- 131. Shaw DI, Tierney AC, McCarthy S, Upritchard J, Vermunt S, et al. (2008) LIPGENE food-exchange model for alteration of dietary fat quantity and quality in free-living participants from eight European countries. British Journal of Nutrition 101: 750–759. [DOI] [PubMed] [Google Scholar]
- 132. Baron JA, Schori A, Crow B, Carter R, Mann JI (1986) A randomized controlled trial of low carbohydrate and low fat/high fiber diets for weight loss. Am J Public Health 76: 1293–1296. [DOI] [PMC free article] [PubMed] [Google Scholar]
- 133. de Lorgeril M, Renaud S, Mamelle N, Salen P, Martin JL, et al. (1994) Mediterranean alpha-linolenic acid-rich diet in secondary prevention of coronary heart disease. Lancet 343: 1454–1459. [DOI] [PubMed] [Google Scholar]
- 134. Sheppard L, Kristal AR, Kushi LH (1991) Weight loss in women participating in a randomized trial of low-fat diets. Am J Clin Nutr 54: 821–828. [DOI] [PubMed] [Google Scholar]
- 135. de Luis DA, Aller R, Izaola O, Gonzalez Sagrado M, Bellioo D, et al. (2007) Effects of a low-fat versus a low-carbohydrate diet on adipocytokines in obese adults. Horm Res 67: 296–300. [DOI] [PubMed] [Google Scholar]
- 136. Chen YD, Coulston AM, Zhou MY, Hollenbeck CB, Reaven GM (1995) Why do low-fat high-carbohydrate diets accentuate postprandial lipemia in patients with NIDDM? Diabetes Care 18: 10–16. [DOI] [PubMed] [Google Scholar]
- 137. Flechtner-Mors M, Boehm BO, Wittmann R, Thoma U, Ditschuneit HH (2010) Enhanced weight loss with protein-enriched meal replacements in subjects with the metabolic syndrome. Diabetes Metab Res Rev 26: 393–405. [DOI] [PubMed] [Google Scholar]
- 138. Treyzon L, Chen S, Hong K, Yan E, Carpenter CL, et al. (2008) A controlled trial of protein enrichment of meal replacements for weight reduction with retention of lean body mass. Nutrition Journal 7: 23. [DOI] [PMC free article] [PubMed] [Google Scholar]
- 139. Gardner CD, Kiazand A, Alhassan S, Kim S, Stafford RS, et al. (2007) Comparison of the Atkins, Zone, Ornish, and LEARN diets for change in weight and related risk factors among overweight premenopausal women: the A TO Z Weight Loss Study: a randomized trial. JAMA 297: 969–977. [DOI] [PubMed] [Google Scholar]
- 140. Layman DK, Evans E, Baum JI, Seyler J, Erickson DJ, et al. (2005) Dietary Protein and Exercise Have Additive Effects on Body Composition during Weight Loss in Adult Women. The Journal of nutrition 135: 1903–1910. [DOI] [PubMed] [Google Scholar]
- 141. Sebregts EH, Falger PR, Bar FW, Kester AD, Appels A (2003) Cholesterol changes in coronary patients after a short behavior modification program. Int J Behav Med 10: 315–330. [DOI] [PubMed] [Google Scholar]
- 142. Fabricatore AN, Wadden TA, Ebbeling CB, Thomas JG, Stallings VA, et al. (2011) Targeting dietary fat or glycemic load in the treatment of obesity and type 2 diabetes: a randomized controlled trial. Diabetes Res Clin Pract 92: 37–45. [DOI] [PMC free article] [PubMed] [Google Scholar]
- 143. Fito M, Guxens M, Corella D, Saez G, Estruch R, et al. (2007) Effect of a traditional Mediterranean diet on lipoprotein oxidation: a randomized controlled trial. Arch Intern Med 167: 1195–1203. [DOI] [PubMed] [Google Scholar]
- 144. Luscombe-Marsh ND, Noakes M, Wittert GA, Keogh JB, Foster P, et al. (2005) Carbohydrate-restricted diets high in either monounsaturated fat or protein are equally effective at promoting fat loss and improving blood lipids. Am J Clin Nutr 81: 762–772. [DOI] [PubMed] [Google Scholar]
- 145. Larsen TM, Dalskov SM, van Baak M, Jebb SA, Papadaki A, et al. (2010) Diets with high or low protein content and glycemic index for weight-loss maintenance. New England Journal of Medicine 363: 2102–2113. [DOI] [PMC free article] [PubMed] [Google Scholar]
- 146. Hockaday TD, Hockaday JM, Mann JI, Turner RC (1978) Prospective comparison of modified fat-high-carbohydrate with standard low-carbohydrate dietary advice in the treatment of diabetes: one year follow-up study. Br J Nutr 39: 357–362. [DOI] [PubMed] [Google Scholar]
- 147. Morgan LM, Griffin BA, Millward DJ, DeLooy A, Fox KR, et al. (2009) Comparison of the effects of four commercially available weight-loss programmes on lipid-based cardiovascular risk factors. Public Health Nutrition 12: 799–807. [DOI] [PubMed] [Google Scholar]
- 148. Walker KZ, O'Dea K, Nicholson GC, Muir JG (1995) Dietary composition, body weight, and NIDDM. Comparison of high-fiber, high-carbohydrate, and modified-fat diets. Diabetes Care 18: 401–403. [DOI] [PubMed] [Google Scholar]
- 149. Dansinger ML, Gleason JA, Griffith JL, Selker HP, Schaefer EJ (2005) Comparison of the Atkins, Ornish, Weight Watchers, and Zone diets for weight loss and heart disease risk reduction: a randomized trial. JAMA 293: 43–53. [DOI] [PubMed] [Google Scholar]
- 150. Dyson PA, Beatty S, Matthews DR (2007) A low-carbohydrate diet is more effective in reducing body weight than healthy eating in both diabetic and non-diabetic subjects. Diabet Med 24: 1430–1435. [DOI] [PubMed] [Google Scholar]
- 151. Foster GD, Wyatt HR, Hill JO, Makris AP, Rosenbaum DL, et al. (2010) Weight and metabolic outcomes after 2 years on a low-carbohydrate versus low-fat diet: a randomized trial. Ann Intern Med 153: 147–157. [DOI] [PMC free article] [PubMed] [Google Scholar]
- 152. Fleming RM (2002) The effect of high-, moderate-, and low-fat diets on weight loss and cardiovascular disease risk factors. Prev Cardiol 5: 110–118. [DOI] [PubMed] [Google Scholar]
- 153. Greenberg I, Stampfer MJ, Schwarzfuchs D, Shai I (2009) Adherence and success in long-term weight loss diets: the dietary intervention randomized controlled trial (DIRECT). J Am Coll Nutr 28: 159–168. [DOI] [PubMed] [Google Scholar]
- 154. Iqbal N, Vetter ML, Moore RH, Chittams JL, Dalton-Bakes CV, et al. (2009) Effects of a low-intensity intervention that prescribed a low-carbohydrate vs. a low-fat diet in obese, diabetic participants. Obesity (Silver Spring) 18: 1733–1738. [DOI] [PubMed] [Google Scholar]
- 155. Samaha FF, Iqbal N, Seshadri P, Chicano KL, Daily DA, et al. (2003) A low-carbohydrate as compared with a low-fat diet in severe obesity. New England Journal of Medicine 348: 2074–2081. [DOI] [PubMed] [Google Scholar]
- 156. Seshadri P, Iqbal N, Stern L, Williams M, Chicano KL, et al. (2004) A randomized study comparing the effects of a low-carbohydrate diet and a conventional diet on lipoprotein subfractions and C-reactive protein levels in patients with severe obesity. American Journal of Medicine 117: 398–405. [DOI] [PubMed] [Google Scholar]
- 157. Seshadri P, Samaha FF, Stern L, Chicano KL, Daily DA, et al. (2005) Free fatty acids, insulin resistance, and corrected qt intervals in morbid obesity: effect of weight loss during 6 months with differing dietary interventions. Endocr Pract 11: 234–239. [DOI] [PubMed] [Google Scholar]
- 158. Shai I, Schwarzfuchs D, Henkin Y, Shahar DR, Witkow S, et al. (2008) Weight loss with a low-carbohydrate, Mediterranean, or low-fat diet. New England Journal of Medicine 359: 229–241. [DOI] [PubMed] [Google Scholar]
- 159. Summer SS, Brehm BJ, Benoit SC, D'Alessio DA (2011) Adiponectin changes in relation to the macronutrient composition of a weight-loss diet. Obesity (Silver Spring) 19: 2198–2204. [DOI] [PubMed] [Google Scholar]
- 160. Aquilani R, Tramarin R, Pedretti RF, Bertolotti G, Sommaruga M, et al. (1999) Despite good compliance, very low fat diet alone does not achieve recommended cholesterol goals in outpatients with coronary heart disease. Eur Heart J 20: 1020–1029. [DOI] [PubMed] [Google Scholar]
- 161. Bowden RG, Lanning BA, Doyle EI, Slonaker B, Johnston HM, et al. (2007) Systemic glucose level changes with a carbohydrate-restricted and higher protein diet combined with exercise. J Am Coll Health 56: 147–152. [DOI] [PubMed] [Google Scholar]
- 162. Brehm BJ, Lattin BL, Summer SS, Boback JA, Gilchrist GM, et al. (2009) One-year comparison of a high-monounsaturated fat diet with a high-carbohydrate diet in type 2 diabetes. Diabetes Care 32: 215–220. [DOI] [PMC free article] [PubMed] [Google Scholar]
- 163. Campbell WW, Tang M (2010) Protein intake, weight loss, and bone mineral density in postmenopausal women. J Gerontol A Biol Sci Med Sci 65: 1115–1122. [DOI] [PMC free article] [PubMed] [Google Scholar]
- 164. Clifton PM, Keogh JB, Noakes M (2008) Long-term effects of a high-protein weight-loss diet. Am J Clin Nutr 87: 23–29. [DOI] [PubMed] [Google Scholar]
- 165. Djuric Z, Lababidi S, Heilbrun LK, Depper JB, Poore KM, et al. (2002) Effect of low-fat and/or low-energy diets on anthropometric measures in participants of the women's diet study. J Am Coll Nutr 21: 38–46. [DOI] [PubMed] [Google Scholar]
- 166. Due A, Larsen TM, Hermansen K, Stender S, Holst JJ, et al. (2008) Comparison of the effects on insulin resistance and glucose tolerance of 6-mo high-monounsaturated-fat, low-fat, and control diets. Am J Clin Nutr 87: 855–862. [DOI] [PubMed] [Google Scholar]
- 167. Esposito K, Maiorino MI, Ciotola M, Di Palo C, Scognamiglio P, et al. (2009) Effects of a Mediterranean-style diet on the need for antihyperglycemic drug therapy in patients with newly diagnosed type 2 diabetes: a randomized trial. Ann Intern Med 151: 306–314. [DOI] [PubMed] [Google Scholar]
- 168. Esposito K, Marfella R, Ciotola M, Di Palo C, Giugliano F, et al. (2004) Effect of a mediterranean-style diet on endothelial dysfunction and markers of vascular inflammation in the metabolic syndrome: a randomized trial. JAMA 292: 1440–1446. [DOI] [PubMed] [Google Scholar]
- 169. Guay V, Lamarche B, Charest A, Tremblay AJ, Couture P (2012) Effect of short-term low- and high-fat diets on low-density lipoprotein particle size in normolipidemic subjects. Metabolism 61: 76–83. [DOI] [PubMed] [Google Scholar]
- 170. Hays NP, Starling RD, Liu X, Sullivan DH, Trappe TA, et al. (2004) Effects of an ad libitum low-fat, high-carbohydrate diet on body weight, body composition, and fat distribution in older men and women: a randomized controlled trial. Arch Intern Med 164: 210–217. [DOI] [PubMed] [Google Scholar]
- 171. Knopp RH, Retzlaff B, Walden C, Fish B, Buck B, et al. (2000) One-year effects of increasingly fat-restricted, carbohydrate-enriched diets on lipoprotein levels in free-living subjects. Proc Soc Exp Biol Med 225: 191–199. [DOI] [PubMed] [Google Scholar]
- 172. Knopp RH, Walden CE, Retzlaff BM, McCann BS, Dowdy AA, et al. (1997) Long-term cholesterol-lowering effects of 4 fat-restricted diets in hypercholesterolemic and combined hyperlipidemic men. The Dietary Alternatives Study. JAMA 278: 1509–1515. [PubMed] [Google Scholar]
- 173. Leidy HJ, Carnell NS, Mattes RD, Campbell WW (2007) Higher protein intake preserves lean mass and satiety with weight loss in pre-obese and obese women. Obesity (Silver Spring) 15: 421–429. [DOI] [PubMed] [Google Scholar]
- 174. Louheranta AM, Schwab US, Sarkkinen ES, Voutilainen ET, Ebeling TM, et al. (2000) Insulin sensitivity after a reduced-fat diet and a monoene-enriched diet in subjects with elevated serum cholesterol and triglyceride concentrations. Nutr Metab Cardiovasc Dis 10: 177–187. [PubMed] [Google Scholar]
- 175. McManus K, Antinoro L, Sacks F (2001) A randomized controlled trial of a moderate-fat, low-energy diet compared with a low fat, low-energy diet for weight loss in overweight adults. Int J Obes Relat Metab Disord 25: 1503–1511. [DOI] [PubMed] [Google Scholar]
- 176. Moore C, Gitau R, Goff L, Lewis FJ, Griffin MD, et al. (2009) Successful manipulation of the quality and quantity of fat and carbohydrate consumed by free-living individuals using a food exchange model. Journal of Nutrition 139: 1534–1540. [DOI] [PMC free article] [PubMed] [Google Scholar]
- 177. Noakes M, Keogh JB, Foster PR, Clifton PM (2005) Effect of an energy-restricted, high-protein, low-fat diet relative to a conventional high-carbohydrate, low-fat diet on weight loss, body composition, nutritional status, and markers of cardiovascular health in obese women. Am J Clin Nutr 81: 1298–1306. [DOI] [PubMed] [Google Scholar]
- 178. Patterson RE, Hutchinson F (2004) Dietary adherence in the Women's Health Initiative Dietary Modification Trial. Journal of the American Dietetic Association 104: 654–658. [DOI] [PubMed] [Google Scholar]
- 179. Raatz SK, Torkelson CJ, Redmon JB, Reck KP, Kwong CA, et al. (2005) Reduced glycemic index and glycemic load diets do not increase the effects of energy restriction on weight loss and insulin sensitivity in obese men and women. Journal of Nutrition 135: 2387–2391. [DOI] [PubMed] [Google Scholar]
- 180. Rodriguez-Hernandez H, Morales-Amaya UA, Rosales-Valdez R, Rivera-Hinojosa F, Rodriguez-Moran M, et al. (2009) Adding cognitive behavioural treatment to either low-carbohydrate or low-fat diets: differential short-term effects. British Journal of Nutrition 102: 1847–1853. [DOI] [PubMed] [Google Scholar]
- 181. Simkin-Silverman L, Wing RR, Hansen DH, Klem ML, Pasagian-Macaulay AP, et al. (1995) Prevention of cardiovascular risk factor elevations in healthy premenopausal women. Prev Med 24: 509–517. [DOI] [PubMed] [Google Scholar]
- 182. Skov AR, Toubro S, Ronn B, Holm L, Astrup A (1999) Randomized trial on protein vs carbohydrate in ad libitum fat reduced diet for the treatment of obesity. Int J Obes Relat Metab Disord 23: 528–536. [DOI] [PubMed] [Google Scholar]
- 183. Swinburn BA, Woollard GA, Chang EC, Wilson MR (1999) Effects of reduced-fat diets consumed ad libitum on intake of nutrients, particularly antioxidant vitamins. Journal of the American Dietetic Association 99: 1400–1405. [DOI] [PubMed] [Google Scholar]
- 184. Tuttle KR, Shuler LA, Packard DP, Milton JE, Daratha KB, et al. (2008) Comparison of low-fat versus Mediterranean-style dietary intervention after first myocardial infarction (from The Heart Institute of Spokane Diet Intervention and Evaluation Trial). Am J Cardiol 101: 1523–1530. [DOI] [PubMed] [Google Scholar]
- 185. Jebb SA, Lovegrove JA, Griffin BA, Frost GS, Moore CS, et al. (2010) Effect of changing the amount and type of fat and carbohydrate on insulin sensitivity and cardiovascular risk: the RISCK (Reading, Imperial, Surrey, Cambridge, and Kings) trial. Am J Clin Nutr 92: 748–758. [DOI] [PMC free article] [PubMed] [Google Scholar]
- 186. Das SK, Gilhooly CH, Golden JK, Pittas AG, Fuss PJ, et al. (2007) Long-term effects of 2 energy-restricted diets differing in glycemic load on dietary adherence, body composition, and metabolism in CALERIE: a 1-y randomized controlled trial. Am J Clin Nutr 85: 1023–1030. [DOI] [PubMed] [Google Scholar]
- 187. Ebbeling CB, Leidig MM, Feldman HA, Lovesky MM, Ludwig DS (2007) Effects of a low-glycemic load vs low-fat diet in obese young adults: a randomized trial. JAMA 297: 2092–2102. [DOI] [PubMed] [Google Scholar]
- 188. Noakes M, Foster PR, Keogh JB, James AP, Mamo JC, et al. (2006) Comparison of isocaloric very low carbohydrate/high saturated fat and high carbohydrate/low saturated fat diets on body composition and cardiovascular risk. Nutr Metab (Lond) 3: 7. [DOI] [PMC free article] [PubMed] [Google Scholar]
- 189. Tay J, Brinkworth GD, Noakes M, Keogh J, Clifton PM (2008) Metabolic effects of weight loss on a very-low-carbohydrate diet compared with an isocaloric high-carbohydrate diet in abdominally obese subjects. J Am Coll Cardiol 51: 59–67. [DOI] [PubMed] [Google Scholar]
- 190. Al-Sarraj T, Saadi H, Volek JS, Fernandez ML (2009) Carbohydrate restriction favorably alters lipoprotein metabolism in Emirati subjects classified with the metabolic syndrome. Nutr Metab Cardiovasc Dis 20: 720–726. [DOI] [PubMed] [Google Scholar]
- 191. Ben-Avraham S, Harman-Boehm I, Schwarzfuchs D, Shai I (2009) Dietary strategies for patients with type 2 diabetes in the era of multi-approaches; review and results from the Dietary Intervention Randomized Controlled Trial (DIRECT). Diabetes Res Clin Pract 86 (Suppl 1) S41–48. [DOI] [PubMed] [Google Scholar]
- 192. Brinkworth GD, Noakes M, Buckley JD, Keogh JB, Clifton PM (2009) Long-term effects of a very-low-carbohydrate weight loss diet compared with an isocaloric low-fat diet after 12 mo. Am J Clin Nutr 90: 23–32. [DOI] [PubMed] [Google Scholar]
- 193. Dyson PA, Beatty S, Matthews DR (2010) An assessment of low-carbohydrate or low-fat diets for weight loss at 2 year's follow-up. Diabet Med 27: 363–364. [DOI] [PubMed] [Google Scholar]
- 194. Estruch R, Martinez-Gonzalez MA, Corella D, Basora-Gallisa J, Ruiz-Gutierrez V, et al. (2009) Effects of dietary fibre intake on risk factors for cardiovascular disease in subjects at high risk. J Epidemiol Community Health 63: 582–588. [DOI] [PubMed] [Google Scholar]
- 195. Gulseth HL, Gjelstad IM, Tierney AC, Shaw DI, Helal O, et al. (2010) Dietary fat modifications and blood pressure in subjects with the metabolic syndrome in the LIPGENE dietary intervention study. Br J Nutr 104: 160–163. [DOI] [PubMed] [Google Scholar]
- 196. Haufe S, Utz W, Engeli S, Kast P, Bohnke J, et al. (2012) Left ventricular mass and function with reduced-fat or reduced-carbohydrate hypocaloric diets in overweight and obese subjects. Hypertension 59: 70–75. [DOI] [PubMed] [Google Scholar]
- 197. Howard BV, Curb JD, Eaton CB, Kooperberg C, Ockene J, et al. (2010) Low-fat dietary pattern and lipoprotein risk factors: the Women's Health Initiative Dietary Modification Trial. Am J Clin Nutr 91: 860–874. [DOI] [PMC free article] [PubMed] [Google Scholar]
- 198. Howard BV, Manson JE, Stefanick ML, Beresford SA, Frank G, et al. (2006) Low-fat dietary pattern and weight change over 7 years: the Women's Health Initiative Dietary Modification Trial. JAMA 295: 39–49. [DOI] [PubMed] [Google Scholar]
- 199. Howard BV, Van Horn L, Hsia J, Manson JE, Stefanick ML, et al. (2006) Low-fat dietary pattern and risk of cardiovascular disease: the Women's Health Initiative Randomized Controlled Dietary Modification Trial. JAMA 295: 655–666. [DOI] [PubMed] [Google Scholar]
- 200. Hu T, Reynolds K, Yao L, Bunol C, Liu Y, et al. (2013) The Long-term Effect of a Low-Carbohydrate Diet on Endothelial Dysfunction and Insulin Resistance: A Randomized Controlled Trial. Circulation 127: AP165. [Google Scholar]
- 201. Hu T, Reynolds K, Yao L, Bunol C, Liu Y, et al. (2013) Effect of a low-carbohydrate diet on adipocytokines and inflammatory markers: A randomized controlled trial. Circulation 127: AP166. [Google Scholar]
- 202. Hu T, Reynolds K, Yao L, Bunol C, Liu Y, et al. (2013) The Long-term Effect of a Low-Carbohydrate Diet on Appetite Hormones: A Randomized Controlled Trial. Circulation 127: AP167. [Google Scholar]
- 203. Iqbal N, Seshadri P, Stern L, Loh J, Kundu S, et al. (2005) Serum resistin is not associated with obesity or insulin resistance in humans. Eur Rev Med Pharmacol Sci 9: 161–165. [PubMed] [Google Scholar]
- 204. Jimenez-Gomez Y, Marin C, Peerez-Martinez P, Hartwich J, Malczewska-Malec M, et al. (2010) A low-fat, high-complex carbohydrate diet supplemented with long-chain (n-3) fatty acids alters the postprandial lipoprotein profile in patients with metabolic syndrome. J Nutr 140: 1595–1601. [DOI] [PubMed] [Google Scholar]
- 205. McAuley KA, Smith KJ, Taylor RW, McLay RT, Williams SM, et al. (2006) Long-term effects of popular dietary approaches on weight loss and features of insulin resistance. Int J Obes (Lond) 30: 342–349. [DOI] [PubMed] [Google Scholar]
- 206. Mohler ER 3rd, Sibley AA, Stein R, Davila-Roman V, Wyatt H, et al. (2013) Endothelial function and weight loss: comparison of low-carbohydrate and low-fat diets. Obesity (Silver Spring) 21: 504–509. [DOI] [PMC free article] [PubMed] [Google Scholar]
- 207. Moore SD, King AC, Kiernan M, Gardner CD (2010) Outcome expectations and realizations as predictors of weight regain among dieters. Eat Behav 12: 60–63. [DOI] [PMC free article] [PubMed] [Google Scholar]
- 208. Shikany JM, Margolis KL, Pettinger M, Jackson RD, Limacher MC, et al. (2011) Effects of a low-fat dietary intervention on glucose, insulin, and insulin resistance in the Women's Health Initiative (WHI) Dietary Modification trial. Am J Clin Nutr 94: 75–85. [DOI] [PMC free article] [PubMed] [Google Scholar]
- 209. Swinburn BA, Metcalf PA, Ley SJ (2001) Long-term (5-year) effects of a reduced-fat diet intervention in individuals with glucose intolerance. Diabetes Care 24: 619–624. [DOI] [PubMed] [Google Scholar]
- 210. Tierney AC, McMonagle J, Shaw DI, Gulseth HL, Helal O, et al. (2011) Effects of dietary fat modification on insulin sensitivity and on other risk factors of the metabolic syndrome–LIPGENE: a European randomized dietary intervention study. Int J Obes (Lond) 35: 800–809. [DOI] [PubMed] [Google Scholar]
- 211. Westman EC, Yancy WS Jr, Olsen MK, Dudley T, Guyton JR (2006) Effect of a low-carbohydrate, ketogenic diet program compared to a low-fat diet on fasting lipoprotein subclasses. Int J Cardiol 110: 212–216. [DOI] [PubMed] [Google Scholar]
- 212. Yancy WS Jr, Olsen MK, Dudley T, Westman EC (2007) Acid-base analysis of individuals following two weight loss diets. European Journal of Clinical Nutrition 61: 1416–1422. [DOI] [PubMed] [Google Scholar]
- 213. McClain AD, Otten JJ, Hekler EB, Gardner CD (2013) Adherence to a low-fat vs. low-carbohydrate diet differs by insulin resistance status. Diabetes Obes Metab 15: 87–90. [DOI] [PMC free article] [PubMed] [Google Scholar]
- 214. Bazzano LA, Reynolds K, Hu T, Yao L, Bunol C, et al. (2012) Effect of a low-carbohydrate diet on weight and cardiovascular risk factors: A randomized controlled trial. Circulation 125: AP306. [Google Scholar]
- 215. Due A, Toubro S, Skov AR, Astrup A (2004) Effect of normal-fat diets, either medium or high in protein, on body weight in overweight subjects: a randomised 1-year trial. Int J Obes Relat Metab Disord 28: 1283–1290. [DOI] [PubMed] [Google Scholar]
- 216. McAuley KA, Hopkins CM, Smith KJ, McLay RT, Williams SM, et al. (2005) Comparison of high-fat and high-protein diets with a high-carbohydrate diet in insulin-resistant obese women. Diabetologia 48: 8–16. [DOI] [PubMed] [Google Scholar]
- 217. Sloth B, Due A, Larsen TM, Holst JJ, Heding A, et al. (2009) The effect of a high-MUFA, low-glycaemic index diet and a low-fat diet on appetite and glucose metabolism during a 6-month weight maintenance period. British Journal of Nutrition 101: 1846–1858. [DOI] [PubMed] [Google Scholar]
- 218. Volek JS, Ballard KD, Silvestre R, Judelson DA, Quann EE, et al. (2009) Effects of dietary carbohydrate restriction versus low-fat diet on flow-mediated dilation. Metabolism 58: 1769–1777. [DOI] [PubMed] [Google Scholar]
- 219. Wolever TM, Mehling C, Chiasson JL, Josse RG, Leiter LA, et al. (2008) Low glycaemic index diet and disposition index in type 2 diabetes (the Canadian trial of carbohydrates in diabetes): a randomised controlled trial. Diabetologia 51: 1607–1615. [DOI] [PubMed] [Google Scholar]
- 220. Delbridge EA, Prendergast LA, Pritchard JE, Proietto J (2009) One-year weight maintenance after significant weight loss in healthy overweight and obese subjects: does diet composition matter? Am J Clin Nutr 90: 1203–1214. [DOI] [PubMed] [Google Scholar]
- 221. Kasim SE, Martino S, Kim PN, Khilnani S, Boomer A, et al. (1993) Dietary and anthropometric determinants of plasma lipoproteins during a long-term low-fat diet in healthy women. Am J Clin Nutr 57: 146–153. [DOI] [PubMed] [Google Scholar]
- 222. Elhayany A, Lustman A, Abel R, Attal-Singer J, Vinker S (2010) A low carbohydrate Mediterranean diet improves cardiovascular risk factors and diabetes control among overweight patients with type 2 diabetes mellitus: a 1-year prospective randomized intervention study. Diabetes Obes Metab 12: 204–209. [DOI] [PubMed] [Google Scholar]
- 223. McLaughlin T, Carter S, Lamendola C, Abbasi F, Schaaf P, et al. (2007) Clinical efficacy of two hypocaloric diets that vary in overweight patients with type 2 diabetes: comparison of moderate fat versus carbohydrate reductions. Diabetes Care 30: 1877–1879. [DOI] [PubMed] [Google Scholar]
- 224. Mueller C, Masri B, Hogg J, Mastrogiacomo M, Chiu YL (2010) Carbohydrate- vs fat-controlled diet effect on weight loss and coronary artery disease risk: a pilot feeding study. Nutrition in Clinical Practice 25: 542–547. [DOI] [PubMed] [Google Scholar]
- 225. Soenen S, Bonomi AG, Lemmens SG, Scholte J, Thijssen MA, et al. (2012) Relatively high-protein or ‘low-carb’ energy-restricted diets for body weight loss and body weight maintenance? Physiol Behav 107: 374–380. [DOI] [PubMed] [Google Scholar]
- 226. Wycherley TP, Brinkworth GD, Keogh JB, Noakes M, Buckley JD, et al. (2009) Long-term effects of weight loss with a very low carbohydrate and low fat diet on vascular function in overweight and obese patients. J Intern Med 267: 452–461. [DOI] [PubMed] [Google Scholar]
- 227. Wycherley TP, Noakes M, Clifton PM, Cleanthous X, Keogh JB, et al. (2010) A high-protein diet with resistance exercise training improves weight loss and body composition in overweight and obese patients with type 2 diabetes. Diabetes Care 33: 969–976. [DOI] [PMC free article] [PubMed] [Google Scholar]
- 228. Evangelista LS, Heber D, Li Z, Bowerman S, Hamilton MA, et al. (2009) Reduced body weight and adiposity with a high-protein diet improves functional status, lipid profiles, glycemic control, and quality of life in patients with heart failure: a feasibility study. J Cardiovasc Nurs 24: 207–215. [DOI] [PMC free article] [PubMed] [Google Scholar]
Associated Data
This section collects any data citations, data availability statements, or supplementary materials included in this article.
Supplementary Materials
(PDF)
A critical summary of existing systematic reviews.
(DOCX)
Forest plots of meta-analyses in overweight and obese adults without type 2 diabetes mellitus. Figure S2A: Forest plot of low carbohydrate versus balanced diets in overweight and obese adults for body mass index (kg/m2) at three to six months. Figure S2B: Forest plot of low carbohydrate versus balanced diets in overweight and obese adults for body mass index (kg/m2) at one year. Figure S2C: Forest plot of low carbohydrate versus balanced diets in overweight and obese adults for diastolic blood pressure (mmHg) at three to six months. Figure S2D: Forest plot of low carbohydrate versus balanced diets in overweight and obese adults for diastolic blood pressure (mmHg) at one to two years. Figure S2E: Forest plot of low carbohydrate versus balanced diets in overweight and obese adults for systolic blood pressure (mmHg) at three to six months. Figure S2F: Forest plot of low carbohydrate versus balanced diets in overweight and obese adults for systolic blood pressure (mmHg) at one to two years. Figure S2G: Forest plot of low carbohydrate versus balanced diets in overweight and obese adults for serum LDL cholesterol (mmol/L) at three to six months. Figure S2H: Forest plot of low carbohydrate versus balanced diets in overweight and obese adults for serum LDL cholesterol (mmol/L) at one to two years. Figure S2I: Forest plot of low carbohydrate versus balanced diets in overweight and obese adults for serum HDL cholesterol (mmol/L) at three to six months. Figure S2J: Forest plot of low carbohydrate versus balanced diets in overweight and obese adults for HDL cholesterol (mmol/L) at one to two years. Figure S2K: Forest plot of low carbohydrate versus balanced diets in overweight and obese adults for serum total cholesterol (mmol/L) at three to six months. Figure S2L: Forest plot of low carbohydrate versus balanced diets in overweight and obese adults for serum total cholesterol (mmol/L) at one to two years. Figure S2M: Forest plot of low carbohydrate versus balanced diets in overweight and obese adults for serum triglycerides (mmol/L) at three to six months. Figure S2N: Forest plot of low carbohydrate versus balanced diets in overweight and obese adults for serum triglycerides (mmol/L) at one to two years. Figure S2O: Forest plot of low carbohydrate versus balanced diets in overweight and obese adults for fasting blood glucose (mmol/L) at three to six months. Figure S2P: Forest plot of low carbohydrate versus balanced diets in overweight and obese adults for fasting blood glucose (mmol/L) at one to two years.
(DOCX)
Forest plots of meta-analyses in overweight and obese adults with type 2 diabetes mellitus. Figure S3A: Forest plot of low carbohydrate versus balanced diets in overweight and obese adults with type 2 diabetes mellitus for body mass index (kg/m2) at three to six months. Figure S3B: Forest plot of low carbohydrate versus balanced diets in overweight and obese adults with type 2 diabetes mellitus of body mass index (kg/m2) at two years. Figure S2C: Forest plot of low carbohydrate versus balanced diets in overweight and obese adults with type 2 diabetes mellitus for glycosylated hemoglobin (%) at three to six months. Figure S3D: Forest plot of low carbohydrate versus balanced diets in overweight and obese adults with type 2 diabetes mellitus for glycolosated hemoglobin (%) at one to two years. Figure S3E: Forest plot of low carbohydrate versus balanced diets in overweight and obese adults with type 2 diabetes mellitus for fasting blood glucose (mmol/L) at three to six months. Figure S3F: Forest plot of low carbohydrate versus balanced diets in overweight and obese adults with type 2 diabetes mellitus for fasting blood glucose (mmol/L) at 15 months. Figure S3G: Forest plot of low carbohydrate versus balanced diets in overweight and obese adults with type 2 diabetes mellitus for diastolic blood pressure (mmHg) at three to six months. Figure S3H: Forest plot of low carbohydrate versus balanced diets in overweight and obese adults with type 2 diabetes mellitus for diastolic blood pressure (mmHg) at one to two years. Figure S3I: Forest plot of low carbohydrate versus balanced diets in overweight and obese adults with type 2 diabetes mellitus for systolic blood pressure (mmHg) at three to six months. Figure S3J: Forest plot of low carbohydrate versus balanced diets in overweight and obese adults with type 2 diabetes mellitus for systolic blood pressure (mmHg) at one to two years. Figure S3K: Forest plot of low carbohydrate versus balanced diets in overweight and obese adults with type 2 diabetes mellitus for LDL cholesterol (mmol/L) at three to six months. Figure S3L: Forest plot of low carbohydrate versus balanced diets in overweight and obese adults with type 2 diabetes mellitus for LDL cholesterol (mmol/L) at one to two years. Figure S3M: Forest plot of low carbohydrate versus balanced diets in overweight and obese adults with type 2 diabetes mellitus for HDL cholesterol (mmol/L) at three to six months. Figure S3N: Forest plot of low carbohydrate versus balanced diets in overweight and obese adults with type 2 diabetes mellitus for HDL cholesterol (mmol/L) at one to two years. Figure S3O: Forest plot of low carbohydrate versus balanced diets in overweight and obese adults with type 2 diabetes mellitus of total cholesterol (mmol/L) at three to six months. Figure S3P: Forest plot of low carbohydrate versus balanced diets in overweight and obese adults with type 2 diabetes mellitus for total cholesterol (mmol/L) at one to two years. Figure S3Q: Forest plot of low carbohydrate versus balanced diets in overweight and obese adults with type 2 diabetes mellitus for triglycerides (mmol/L) at three to six months. Figure S3R: Forest plot of low carbohydrate versus balanced diets in overweight and obese adults with type 2 diabetes mellitus for triglycerides (mmol/L) at one to two years.
(DOCX)