Abstract
Guanine methylation is a ubiquitous process affecting DNA and various RNA species. N-7 guanine methylation (7-MG), though relatively less studied, could have a significant role in normal transcriptional regulation as well as in the onset and development of pathological conditions. The lack of a sensitive method to accurately quantify trace amounts of altered bases like 7-MG, has been a major deterrent in delineating its biological function(s). Here we report the development of methods to detect trace amounts of 7-MG in biological samples using electrochemical detection combined with HPLC separation of compounds. We further sought to assess global alterations in DNA methylation in Huntington's disease (HD) in which transcriptional dysregulation, is a major factor in pathogenesis. The developed method was used to study guanine methylation in cytoplasmic and nuclear nucleic acids from human and transgenic mouse HD brain and controls. Significant differences were observed in the guanine methylation levels in mouse and human samples, consistent with the known transcriptional pathology of HD. The sensitivity of the method makes it capable of detecting subtle aberrations. Identification of changes in methylation pattern will provide insights into the molecular mechanisms changes that translate into onset and/or development of symptoms in diseases like HD.
Keywords: 7-methyl guanine (7-MG), Guanine (G), Huntington disease (HD), electrochemical detection (ECD)
Introduction
The term epigenetics refers to heritable changes in genetic material caused by covalent modifications that do not alter the underlying genetic sequence [1]. One of the major epigenetic processes is methylation of cytosine in CpG islands (region of chromatin rich in CG pairs), which plays a critical role in regulating gene expression in a number of ways. Decreased gene expression is in part accounted for by the methyl group at position 5 of cytosine interfering with the normal interaction between DNA and transcription factors [2]. Also, methylation can result in changes in DNA conformation. It has been shown that methylated cytosines interact with specific protein complexes that recruit co-repressors and histone deacetylases (HDACs). Removal of acetyl groups from histones by HDACs results in a compact chromatin structure that decreases gene expression [3].
While methylation of cytosine residues and the resulting biological effects have been studied extensively, the role of methylation at the N-7 position of guanine (7-MG) is not yet well understood [4]. 7-MG does not directly interfere with DNA replication like another common methylation byproduct, 3-methyladenine [5, 6, 7]. However, alterations in association/dissociation of specific proteins with methylated bases can disturb normal biological functions. Increased N-7 guanine methylation in CpG islands with existing methylated cytosines results in protein dissociation and chromatin remodeling leading to increased gene expression [8]. Oxidative stress, characterized by heightened levels of reactive oxygen species (ROS) is also associated with pathological changes. Both methylation and oxidation of guanine at positions 7 and 8 respectively results in decreased interactions with methylated DNA binding proteins and associated proteins [9].
RNA methylation is also an important regulator of cell phenotype and function [10]. About two third of known RNA modifications involve the addition of methyl groups [11]. N-7 guanine methylation is observed in multiple RNA species like mRNA and tRNA. Despite an abundance of data on RNA methylation, little is understood about its biological relevance [10]. The difficulty in identifying trace amounts of nucleotide methylation has hampered its study.
Here we report the development of sensitive and specific methods for measuring guanine methylation that can be used effectively with different types of biological samples. High performance liquid chromatography coupled to coulometric electrochemical detection (HPLCECD) was used to measure 7-MG to G ratios; a measure of methylation with guanine (G) values being used to normalize 7-MG values. Different methods were developed for whole blood samples and buffy coat samples to obtain optimal separation of the 7-MG peak. The HPLC-ECD method developed for buffy coats worked well with brain samples also. Significant differences were observed in guanine methylation in the nuclear fractions of brain samples from two murine HD models compared to the respective control samples. Interestingly, we also observed significant differences in the methylation of cytoplasmic RNA from the same sample sets. This is the first time such a difference has been reported. This study demonstrates the value of developing sensitive methods to detect trace compounds like modified bases that have significant biological activity and may contribute to disease pathogenesis.
Materials and methods
HPLC grade acetonitrile (ACN), methanol, acetic acid (HAC) were obtained from Fisher Scientific (Pittsburg, PA). 7-methylguanine (7-MG), guanine (G), adenine, 1-octane sulfonic acid (OSA), sodium dodecylsulfate (SDS), lithium hydroxide monohydrate, phosphoric acid were obtained from Sigma Aldrich (St. Louis, MO). MilliQ purified water (Millipore, Bedford, MA) was used to prepare all standards and buffers. Nylon membrane filters (0.2μ) from Millipore, Billerica, MA were used to filter all the buffers. Savant speedvac concentrator, SVC100H, was used for drying the samples. The cells were disrupted using a Sonifier cell disruptor 350 (Branson Sonic Power Co., Danbury, CT) set at 20% duty cycle and output 4.
CoulArray instrumentation
The standards and samples were analyzed using an ESA model 5600 detector set up in series with ESA model 450 pumps, thermal chamber (ESA), autosampler model 540 (ESA), HPLC columns and UV detector (Linear UVIS-201). Two C-18 columns, CAPCELLPAK 18, 4.6mm I.D. × 75mm in series with 4.6mm I.D. × 250mm, were maintained at 35°C using a thermal chamber. The CoulArray is a multi-electrode electrochemical detector which has a series of electrochemical cells (14 were used in this study) that are set up at different potentials. This arrangement allows for generation of multiple chromatograms that are highly specific for a particular compound. Each compound generates a specific trace that differentiates it from the other compounds.
Separation of bases
Specific concentrations of a standard mix of G, adenine, and 7-MG were run on the HPLC-ECD system. Buffer composition, gradient, run time, and cell potentials were varied to obtain adequate separation between the bases. Lithium phosphate buffers were used for running the samples. OSA and SDS were used as ion pairing components for better separation between 7-MG and G.
The initial method (method A) was standardized for separating the bases in whole blood samples. The step gradient method used two buffer systems, buffer A and B. 3% solution B (0.05M LiPO4 in methanol), in 0.05M LiPO4 containing 50mg/L OSA as buffer A and 5% solution B, 2% ACN in 0.05M LiPO4 containing 200mg/L OSA as buffer B was used to separate the bases. Method A: 0% buffer B upto 22 min, 0 - 100% buffer B from 22 – 33 min, 100% buffer B at 35 min, 0% buffer B at 36 min, 0% buffer B upto 45 min. The cell potentials set for the different channels were: 0 mV (CH1), 60 mV (CH2), 120 mV (CH3), 150 mV (CH4), 270 mV (CH5), 385 mV (CH6), 450 mV (CH7), 500 mV (CH8), 600 mV (CH9), 650 mV (CH10), 750 mV (CH11), 800 mV (CH12), 840 mV (CH13), 860 mV (CH14).
A second step gradient method developed for buffy coat samples was also used for brain samples. The final standardized method (method B) used 0.05M LiPO4 containing 5% methanol and 20mg/L SDS as buffer A and 0.05M LiPO4 containing 10% methanol, 10% ACN and 200mg/L SDS as buffer B. The cell potentials were kept same as above. Method B: 5% - 100% buffer B from 0-20 min, 100% buffer B from 20 – 32 min, 0% buffer B at 35 min, 5% buffer B at 38 min.
Calibration curves and stability of standards
Calibration curves were prepared for G (0-40μg/ml) and 7-MG (0-78ng/ml). To detect 7-MG and G in the same run, a UV detector was coupled in series with ECD so as to get a linear curve for G for the range expected in human tissue samples like blood and brain.
For testing the stability of the bases in HCl, 25μl of 7-MG (31.2ng/ml) and G (40μg/ml) were taken along with 100μl of 5N HCl. After incubation for specific periods of time (0 min – o/n) the samples were dried in speed vac. Following resuspension in CoulArray buffer A, the samples were run in the HPLC-ECD system using method A.
Samples
For studying methylation in HD, we used brain tissue from 2 different murine HD models as well as from HD patients. R6/2 transgenic mice express an exon-1 fragment of the HD gene and rapidly develop a neurodegenerative phenotype that is fatal by about 14 weeks. The CAG140 Knock-in (CAG140 KI) mice express a full length mutant huntingtin gene, exhibit subtle pathological phenotypes, and have a normal lifespan. Brain tissues were collected from R6/2 mice at 4, 8 and 12 weeks of age and from CAG140 KI mice at 6, 12, 18 and 24 months (n=10/group). Brain samples were collected from respective wt control mice at the same time points. All animal experiments were carried out in accordance with the NIH Guide for the Care and Use of Laboratory animals and were approved by local animal care committee. Postmortem human brain samples from HD patients and age and gender matched controls were obtained from the New York brain bank. Blood used for method standardization was from a normal healthy volunteer. Buffy coat samples were isolated from the blood of the same healthy volunteer.
Sample preparations
Blood: Normal whole blood was first extracted with ice cold ACN containing 0.4% HAC (acidified ACN) by spinning at 15,000 rpm, 25 min, 4°C. After removing the ACN fraction, the pellet was hydrolyzed with 6N HCl for 30 min at RT followed by spinning to dryness in a speed vac. The pellet was extracted into acidified ACN twice as described earlier. The ACN supernatant fractions were then dried in speedvac and reconstituted in CoulArray buffer A.
Buffy coat
Buffy coat samples prepared from blood of a healthy volunteer were lyzed with ice cold 1ml Tris-Cl (10mM) by spinning at 15,000 rpm for 20 min at 4°C. After removing the supernatant, the pellet was washed again with ice cold Tris-Cl. 50% methanol was added to the resulting pellet and spun as before. After removing the supernatant, the pellet was resuspended in 100% methanol and spun again. The final pellet was resuspended in 0.6N HCl and kept at RT for 10 min. The sample was then dried in a speedvac, extracted into acidified ACN and processed as described previously.
Brain
Frozen brain samples were fractionated using a modified protocol for lyzing cells with hypotonic solution and mechanical shearing [12, 13, 14]. In brief, the brain sample was first lyzed with ice cold cell lysis buffer (10 mM Tris-Cl, pH 8.0, 10 mM KCl, 0.1 mM MgCl2, 0.1 mM EDTA) by homogenizing with a hand held homogenizer. We used Tris-Cl instead of HEPES in the buffer as the latter interferes with ECD (by generating background noise). Also, addition of detergent was avoided as it may interfere with analysis later. The homogenized samples were spun at 3500 rpm for 10 min at 4°C. The supernatant (cytoplasmic fraction) was dried in a speed vac. The pellet (nuclear fraction) and the dried cytoplasmic fraction were then extracted with 100% methanol (to remove metabolites) by spinning at 15,000 rpm for 15 min at 4°C. After removing the methanol supernatant, the remaining pellet fractions were hydrolyzed with 0.6N HCl, dried in a speedvac and extracted into acidified ACN as described previously.
7-MG detection in biological samples
Whole blood was initially used for standardization of the method. The cell potentials were adjusted for optimal sensitivity and resolution for 7-MG, present in nM range in blood. Verification of a specific peak was done by comparing with known standards and spiking with known amounts of specific standards. An ion pair component was added to obtain better separation; the charged 7-MG is retained more on the column than the uncharged guanine in the presence of an ion pair component. Method A, mentioned earlier was optimized for whole blood samples, while method B was optimized for buffy coat samples and also used with brain samples.
Statistical analysis
The statistical differences between different data sets were calculated using 2-tailed T tests.
Results
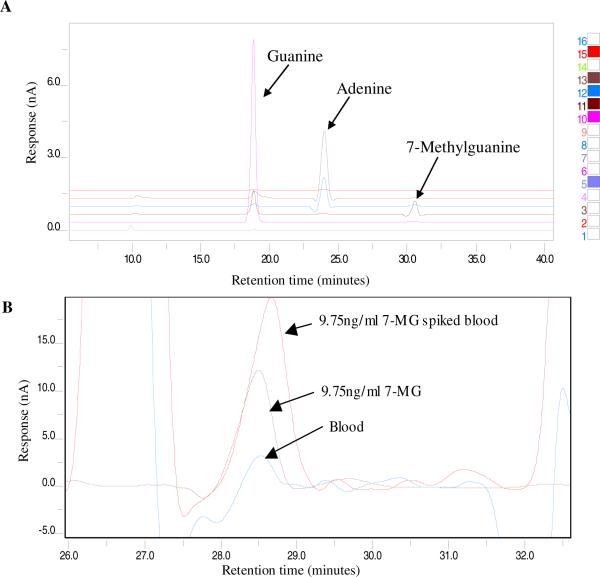
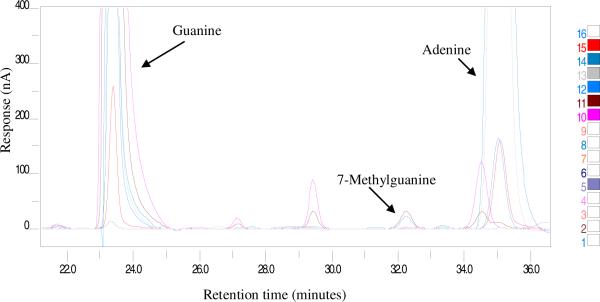
Developing a method to detect 7-MG in blood is complicated as there are a number of electroactive compounds eluting in the region of 7-MG. Also 7-MG is present in trace amounts (ng/ml) compared to guanine (μg/ml). Several factors like mobile phase composition, organic content of the buffer, ion pair component, buffer gradient and electrode potentials had to be taken into consideration. After rigorous standardization steps, the optimal conditions for detection of the modified base (7-MG) along with the unmodified base (G) in the same run were established as method A (Fig.1A). Using method A for blood samples, the 7-MG peak was confirmed by spiking with known amounts of 7-MG (Fig. 1B).
Fig. 1.
Chromatograms generated upon HPLC separation followed by ECD in conjunction with UV absorbance. A) Trace obtained with CoulArray software (channels highlighted on right of panel) shows separation of labeled standards. B) CoulArray wizard profile comparing 7-MG peak in whole blood (7-MG unspiked and spiked samples) and known standard. The samples were prepared and run using method A as explained in materials and methods.
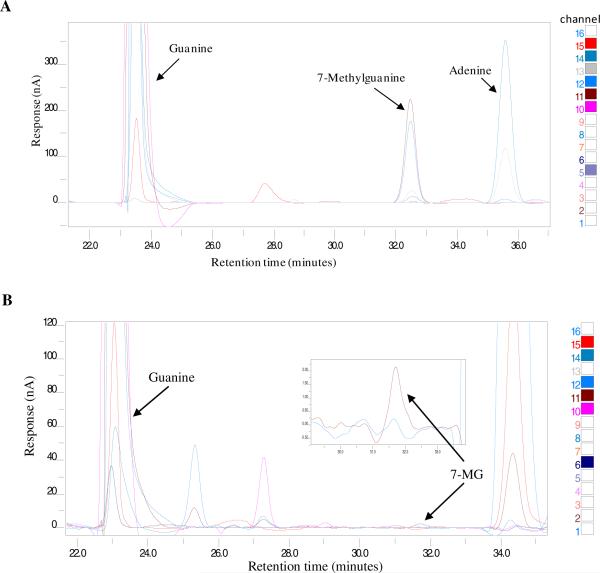
While this method (method A) worked well for whole blood, the run conditions had to be changed for buffy coat samples. The chromatogram obtained with finalized method (method B) showed separation of the standard bases (Fig. 2A). Method B was used to successfully separate the bases and get a highly resolved 7-MG peak (Fig. 2B) with buffy coat samples. The peak was verified by spiking with known amounts of 7-MG (data not shown).
Fig. 2.
Chromatogram obtained from CoulArray software. A) Shows trace of different standards (labeled) obtained using method B described in materials and methods. B) Buffy coat sample with labeled G and 7-MG peaks. UV absorbance (CH 15) and electrochemical array activity (CH 11) were used to analyze G and 7-MG respectively.
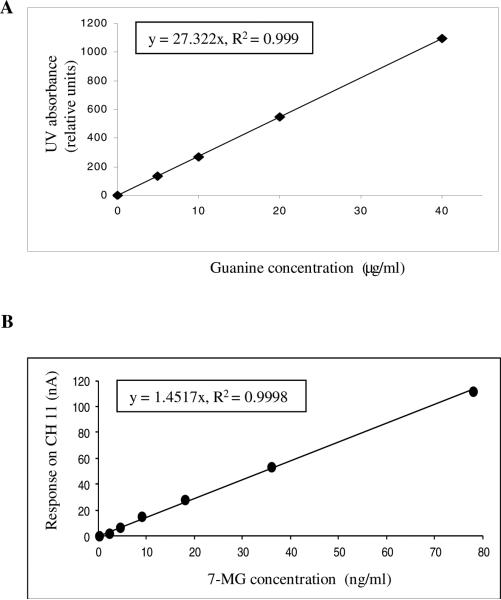
The calibration curves were plotted using a concentration range expected in biological samples. For guanine, standards ranging from 0 - 40 μg/ml were used. Guanine response was maximal on CH 11 (750 mV). But as the response was too high for the desired concentration range, UV absorption values were used to plot the linear calibration curve (Fig 3A) and for quantification of guanine in samples subsequently. 7-MG with detection limit in ng/ml showed a maximum response on CH 11 (750 mV) (Fig 3B).
Fig. 3.
Calibration curves for G and 7-MG. A) Guanine standards ranging from 0 – 40 μg/ml and B) 7-MG standards ranging from 0 - 80 ng/ml were run as explained in materials and methods.
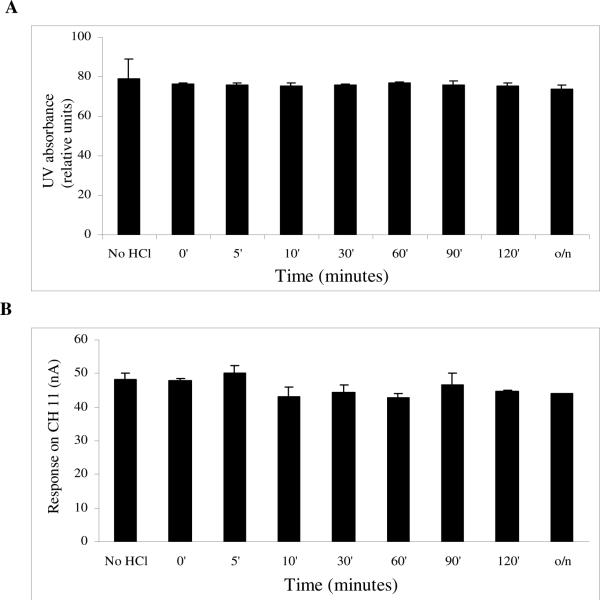
Both G and 7-MG levels were unaffected by incubation with HCl for different time periods, even with o/n incubation (Fig. 4 A, B). So, acidic hydrolysis does not alter the bases.
Fig. 4.
Effect of HCl on A) guanine and B) 7-methyl guanine.
The HPLC-ECD method standardized for buffy coat samples (method B) worked well with brain samples also (Fig. 5). The brain samples were processed to obtain separate cytoplasmic and nuclear fractions. P1 nuclease (P1) is an enzyme that digests DNA and RNA to yield nucleoside 5' monophosphates while alkaline phosphatases (AP) are enzyme hydrolases that remove phosphate groups. Guanosine and deoxyguanosine, the end products for P1AP digestions of RNA and DNA respectively, were detected using specifically developed HPLC-ECD methods. The nuclear fractions had both guanosine and deoxyguanosine (from RNA and DNA respectively) and cytoplasmic fractions had only guanosine (from RNA) following P1AP digestions (data not shown).
Fig. 5.
Chromatogram of a brain sample. The CAG140 KI mice brain samples were processed as described in materials and methods. The chromatogram shows separation of 7-MG from G.
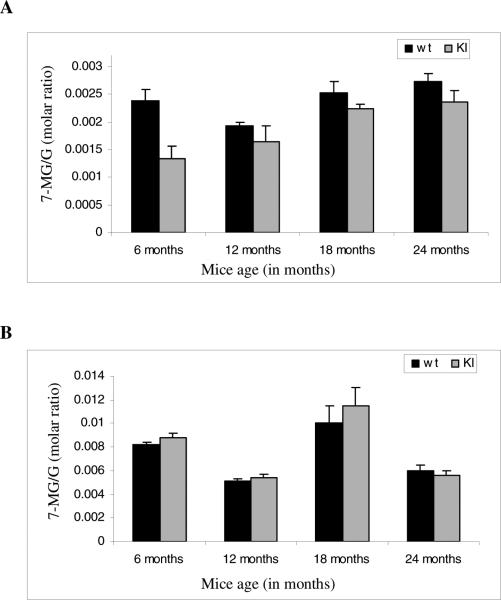
We studied guanine methylation differences in the nuclear and cytoplasmic fractions of wild type (wt) control and CAG140 KI mice brain samples. It was observed that the CAG140 KI nuclear pellet fractions had decreased guanine methylation as compared to wt nuclear pellet fractions (Fig. 6A). The differences were highly significant in 6 to 24 month old CAG140 KI mice (Fig. 6A) and suggested DNA hypomethylation. In contrast, methylation was significantly increased in the cytoplasmic fraction (RNA) in 6 to 18 month CAG140 KI brain samples when compared with wt samples (Fig. 6B). No significant differences were observed between the 24 month old CAG140 KI and wt cytoplasmic fractions methylation patterns (Fig. 6B).
Fig. 6.
Methylation in pellet and cytoplasmic fractions of CAG140 KI mice. The cytoplasmic and pellet fractions were separated and processed as explained in materials and methods. A) In the pellet fractions a significant decrease in methylation was seen from 6 months on (6 months, p=8E-06, 12 months, p= 0.039618; 18 months, p=0.000432; 24 months, p=0.004036). B) For cytoplasmic fractions there was observed a significant increase in methylation in 6 to 18 months samples (6 months, p= 0.0046; 12 months, p= 0.040924; 18 months, p=0.048682; 24 months, p=0.227172).
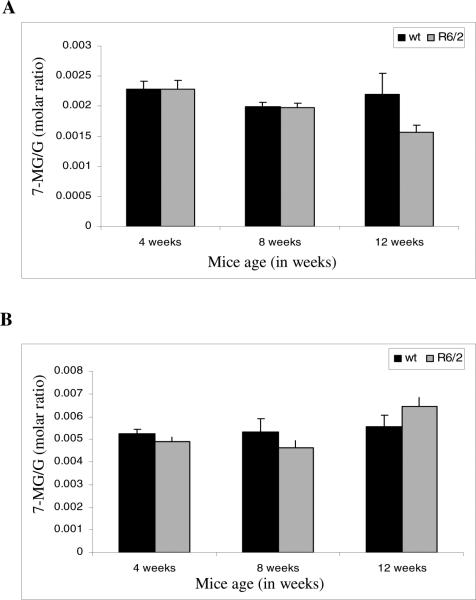
For R6/2 mice, the methylation pattern differed somewhat from CAG140 KI mice (Fig. 7). It was observed that while the nuclear pellet fraction of 4 and 8 weeks brain samples showed no obvious difference, a significant decrease in N-7 guanine methylation was evident in 12 week R6/2 mice brain samples compared to controls (Fig. 7A). Interestingly, with the R6/2 cytoplasmic fraction there was an initial significant decrease in methylation (4 weeks and 8 weeks) followed by a significant increase in methylation at 12 weeks in comparison to wt controls (Fig. 7B).
Fig. 7.
Methylation in pellet and cytoplasmic fractions of R6/2 mice: The cytoplasmic and pellet fractions were separated and processed as explained in materials and methods. A) In the pellet fractions a significant decrease in methylation was seen at 12 weeks. (4 weeks, p=0.618; 8 weeks, p=0.687; 12 weeks, p=1.007E-08). B) For R6/2 cytoplasmic fractions there was observed a significant decrease in methylation for 4 week and 8 weeks brain samples. But at 12 weeks a significant increase was seen in R6/2 samples as compared to control wt mice. (4 weeks, p=0.0213; 8 weeks, p=0.0113; 12 weeks, p=7.53E-06).
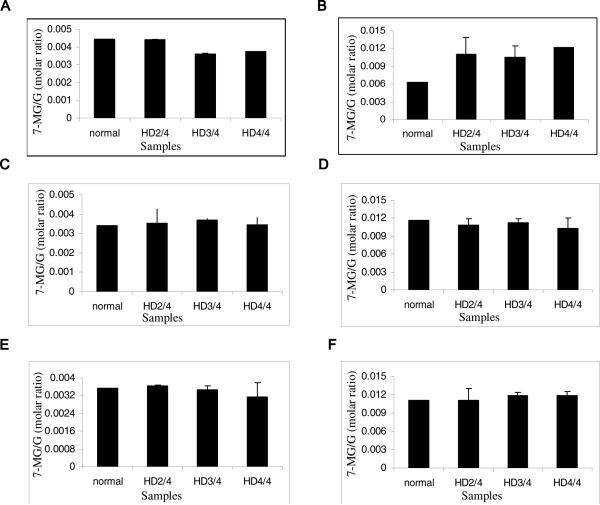
To explore whether these methylation differences also occur in human HD patients as well, a preliminary experiment was carried out with human brain samples (normal controls and HD patients). Three different regions were selected in descending order of expected severity, namely BA4 (motor cortex), BA17 (primary visual cortex), and the cingulate gyrus. While no major differences in N-7 guanine methylation was seen in the BA17 and cingulate gyrus region (Fig. 8C-F) of HD brains, the BA4 region had an aberrant methylation pattern that corresponded with disease progression (pathologic grade of disease) (Fig. 8A,B). Decreased methylation was seen in the nuclear fraction of HD samples comprising BA4 region (Fig. 8A) and increased methylation was seen in the cytoplasmic fraction of the same as compared to normal control (Fig. 8B).
Fig. 8.
Methylation in pellet and cytoplasmic fractions of human brain samples: The pellet and cytoplasmic fractions were separated and processed as explained in materials and methods. A) In the nuclear pellet fractions of cortex, a decrease in methylation was seen in later stages of HD (HD3/4 and HD4/4). B) Cortex cytoplasmic fractions show increase in methylation disease progression. For BA17 nuclear (C) and cytoplasmic (D) fractions and cingulated gyrus nuclear (E) and cytoplasmic (F) fractions, no differences were seen between normal and HD samples.
Discussion
Changes in epigenetic processes like DNA methylation can result in the silencing or enhanced expression of specific genes that may be in reaction to or contribute to conditions that lead to the expression of disease [15, 16, 3]. Though methylation of N-7 guanine often leads to spontaneous depurination, it can interfere with epigenetic modifications like 5-methylcytosine and 8-hydroxyguanine [17]. There has been increasing interest in RNA epigenetics (chemical modifications of RNA) especially micro RNAs (miRNAs) as more evidence has pointed to their roles in transcriptional regulation [18].
Methylation of the N-7 position of guanine is a normally occurring modification of both DNA and RNA that may contribute to normal and aberrant regulation of transcription. The spontaneous depurination of 7-MG creates apurinic sites [19] that may lead to mutagenic events [20]. In an effort to develop efficient and sensitive method(s) to detect N-7 guanine methylation in different biological samples, a combination of HPLC-ECD processes was used. There are previous reports using HPLC coupled to ECD to detect 7-MG [19, 21]. Electrochemical detection was the preferred detection method as its high sensitivity [22, 23] was necessary for detecting 7-MG which is present in trace amounts in biological samples. The step gradient elution used here for separation of electroactive compounds in complex samples like whole blood and brain allows better resolution than isocratic elution [19] and so enhances the sensitivity of the developed methods. The methods developed using an array of coulometric sensors differs from previous electrochemical methods using flat plate amperometric sensors [19, 21] in several ways. First, the sensitivity to 7-MG is 1ng/ml versus 10ng/ml allowing smaller sample sizes. Second, the array yields a specific signature for 7-MG with a characteristic response ratio of 1 to 10 to 3 for sequential sensors, 9,10 and 11, allowing a measure of peak purity and subsequently allowing the use of more complex samples with fewer sample preparation steps. Third, using UV in series with electrochemical detection of guanine at ca. 103 the concentration of 7-MG allows assessment of the 7-MG/G in a single sample, eliminating the need to determine the total amount of DNA or RNA and the requirement to correct for the differences in base pair distribution. A number of articles for detecting 7-MG using mass spectrometry have also been published [24, 25, 26]. While mass spectrometry provides excellent sensitivity it is at the same time very cost prohibitive. So, development of the methods presented in this article that utilize coulometric ECD in series with UV detector for simultaneous quantification of 7-MG and G, is ideal for large scale analysis of complex biological samples.
There are various chemical and enzymatic methods for breaking down nucleic acids to generate free bases that can be detected by coulometric ECD. However, enzymatic hydrolysis may result in incomplete hydrolysis of the large nucleic acid macromolecules [21]. In the present study, acidic hydrolysis was thus used to ensure complete digestion of the nucleic acids (DNA and RNA). Even prolonged exposure (up to 24 h) to acidic conditions did not alter the concentrations of the bases.
Huntington disease (HD), a progressive autosomal dominant inherited neurodegenerative disorder, is characterized by motor, cognitive and psychiatric dysfunction due to progressive pathology in striatum, cerebral cortex and other regions of the brain [27]. The disease is caused by a mutation encoding an abnormal expansion of the CAG repeats in the huntingtin gene (htt). The CAG repeats are translated into polyglutamine repeats in huntingtin protein. Normally there are 10-29 consecutive CAG repeats that code for glutamine. But HD patients have an expanded number of repeats ranging usually between 36-121 repeats. The age of onset of disease is inversely proportional to number of repeats [28]. Aberrant htt protein fragments are known to enter the nucleus and interfere with gene transcription by directly interacting with multiple transcription factors and by causing a variety of epigenetic histone modifications that alter nucleosome dynamics [29, 30]. Our data suggests that N-7 guanine methylation in DNA and RNA might also ensue in concert with these other transcriptional effects.
Transcriptional dysregulation is considered to be a major contributor to the pathogenesis of HD [31]. Changes in methylation pattern of bases are known to play a critical role in transcriptional dysregulation [32]. Interesting results were obtained when we used the method to assay guanine methylation levels in HD murine models/human patients’ samples. There was some disparity in the methylation results for CAG140 KI mice and R6/2 mice especially in the cytoplasmic fractions. For CAG140 KI mice, which better approximate human HD, we observed a consistent decrease in methylation in the nuclear pellet fractions when compared to wt controls (Fig. 6A). At the same time, a consistent increase in methylation was seen with the cytoplasmic fractions (Fig. 6B). While no obvious difference was observed for 4 and 8 week old brain samples, there was a significant decrease in N-7 guanine methylation of nuclear pellets of 12 weeks old R6/2 mice compared to control wt mice brains. In R6/2 cytoplasmic fractions, we observed an initial decrease (4 and 8 week old samples) followed by a significant increase in guanine methylation (12 weeks old samples). The genetics of the two murine models tested may account for the differences in appearance of aberrations in methylation pattern reported here. While both the CAG140 KI and R6/2 mice have similar numbers of repeats (140 and 138 respectively), the context in which the gene is expressed is different. CAG140 KI mice express the entire mutant protein while R6/2 mice express only the first exon [33]. Here we present evidence for changes in guanine methylation levels that may be playing a role in the onset/development of disease phenotype(s) in both models.
Aberrant guanine methylation may directly affect the gene expression. Decreased DNA methylation, as we detected in nuclear pellets, could result in chromatin remodeling. Methylation of N-7 G in already methylated CpG islands results in dissociation of methylated-DNA binding domain protein (MBD1) from methylpurine-DNA glycosylase (MPG). MPG removes damaged bases that are alkylated, deaminated, or oxidized as a result of cellular metabolism or exogenous agents [34, 35, 8]. As the presence of 7-MG results in dissociation of MBD1, there will be a deficit of MPG reservoir available for repairing damaged DNA [8]. Also, dissociation of the MBD protein complexes from DNA results in chromatin remodeling leading to increased gene expression [8]. On the other hand a decrease in 7-MG may result in increased MBD association and repressed gene expression.
The interaction of aberrant htt with specific DNA binding proteins can also decrease histone acetylation resulting in repression of gene expression. Deacetylation of histones results in more compact chromatin structures which are less amenable to methylation than more open DNA strands. Aberrant histone modifications in HD could thus contribute to the alterations in methylation we have observed.
Another factor to be considered is oxidative stress. It has been recently demonstrated that methylation pattern changes occur under oxidative stress conditions [36]. Oxidative stress can result in a variety of oxidative base lesions that impair methylation resulting in global hypomethylation [9]. The N-7 position of guanine functions as a hydrogen bond acceptor leading to the formation of methyl binding protein (MBP)-DNA complex. Oxidation at position 8 of guanine to form 8-oxoguanine results in converting the N 7 position to a hydrogen donor. Also the presence of an oxygen atom at position 8 of guanine significantly decreases interaction with MBPs when 8-oxoguanine is adjacent to 5-methylcytosine [9].
Methylation accounts for a major component of post-transcriptional modifications taking place in RNA and appears to play multiple roles. Methylation of guanine at position 7 has been shown to be critical for mRNA stability and subsequent gene expression and cell viability [37]. Guanine N-7 methylation of tRNA has been shown to be conserved and critical for tRNA stability. Here we observed significant differences in the methylation pattern in the cytoplasmic fractions of murine HD models and their wt controls. In human brain samples also we observed increase in guanine methylation in cytoplasmic fractions of HD patient brain samples. It will be interesting to study how the methylation pattern changes for different RNA species, especially miRNA that have a significant regulatory role in gene expression.
There has been much examination of the similarities and differences in the molecular mechanisms of disease between murine models for HD and human HD. Here we report similarities in the pattern of aberrant guanine methylation in the CAG140 KI mice, older R6/2 mice and human HD brains. Such similarity in alterations in a potentially regulatory process across different murine models and across species is suggestive of its significant role in disease onset/progression and has therapeutic implications. The specificity and sensitivity of the developed method makes it a valuable tool for exploring in more detail the methylation status in humans as well as animal models and it could also serve as a marker to enable the development of novel treatments. Such studies will go a long way towards better understanding of the processes leading to onset/development of HD as well as other neurodegenerative diseases.
Acknowledgments
This research was supported by National Institutes of Health (NIH)/National Institute of Neurological Disorders and Stroke (NINDS) grant (PO1NS058793). We would also like to acknowledge VA medical center, Bedford, MA, USA.
Footnotes
Publisher's Disclaimer: This is a PDF file of an unedited manuscript that has been accepted for publication. As a service to our customers we are providing this early version of the manuscript. The manuscript will undergo copyediting, typesetting, and review of the resulting proof before it is published in its final citable form. Please note that during the production process errors may be discovered which could affect the content, and all legal disclaimers that apply to the journal pertain.
References
- 1.Probst AV, Dunleavy E, Almouzni G. Epigenetic inheritance during the cell cycle. Nat Rev Mol Cell Biol. 2009;10:192–206. doi: 10.1038/nrm2640. [DOI] [PubMed] [Google Scholar]
- 2.Razin A, Riggs AD. DNA methylation and gene function. Science. 1980;210:604–610. doi: 10.1126/science.6254144. [DOI] [PubMed] [Google Scholar]
- 3.Narayan P, Dragunow M. Pharmacology of epigenetics in brain disorders. Br J Pharmacol. 2010;159:285–303. doi: 10.1111/j.1476-5381.2009.00526.x. [DOI] [PMC free article] [PubMed] [Google Scholar]
- 4.Herron DC, Shank RC. In vivo kinetics of O6-methylguanine and 7-methylguanine formation and persistence in DNA of rats treated with symmetrical dimethylhydrazine. Cancer Res. 1981;41:3967–3972. [PubMed] [Google Scholar]
- 5.Ezaz-Nikpay K, Verdine GL. The effects of N7-methylguanine on duplex DNA structure. Chem Biol. 1994;1:235–240. doi: 10.1016/1074-5521(94)90016-7. [DOI] [PubMed] [Google Scholar]
- 6.Rinne ML, He Y, Pachkowski BF, Nakamura J, Kelley MR. N-methylpurine DNA glycosylase overexpression increases alkylation sensitivity by rapidly removing non-toxic 7-methylguanine adducts. Nucleic Acids Res. 2005;33:2859–2867. doi: 10.1093/nar/gki601. [DOI] [PMC free article] [PubMed] [Google Scholar]
- 7.Boysen G, Pachkowski BF, Nakamura J, Swenberg JA. The formation and biological significance of N7-guanine adducts. Mutat Res. 2009;678:76–94. doi: 10.1016/j.mrgentox.2009.05.006. [DOI] [PMC free article] [PubMed] [Google Scholar]
- 8.Watanabe S, Ichimura T, Fujita N, Tsuruzoe S, Ohki I, Shirakawa M, Kawasuji M, Nakao M. Methylated DNA-binding domain 1 and methylpurine-DNA glycosylase link transcriptional repression and DNA repair in chromatin. Proc Natl Acad Sci U S A. 2003;100:12859–12864. doi: 10.1073/pnas.2131819100. [DOI] [PMC free article] [PubMed] [Google Scholar]
- 9.Donkena KV, Young CY, Tindall DJ. Oxidative stress and DNA methylation in prostate cancer. Obstet Gynecol Int. 2010;2010:302051. doi: 10.1155/2010/302051. [DOI] [PMC free article] [PubMed] [Google Scholar]
- 10.Motorin Y, Helm M. RNA nucleotide methylation. Wiley Interdiscip Rev RNA. 2011;2:611–631. doi: 10.1002/wrna.79. [DOI] [PubMed] [Google Scholar]
- 11.Czerwoniec A, Dunin-Horkawicz S, Purta E, Kaminska KH, Kasprzak JM, Bujnicki JM, Grosjean H, Rother K. MODOMICS: a database of RNA modification pathways. 2008 update. Nucleic Acids Res. 2009;37:D118–121. doi: 10.1093/nar/gkn710. [DOI] [PMC free article] [PubMed] [Google Scholar]
- 12.Blondeau N, Widmann C, Lazdunski M, Heurteaux C. Activation of the nuclear factor-kappaB is a key event in brain tolerance. J Neurosci. 2001;21:4668–4677. doi: 10.1523/JNEUROSCI.21-13-04668.2001. [DOI] [PMC free article] [PubMed] [Google Scholar]
- 13.Bourke E, Moynagh PN. Antiinflammatory effects of glucocorticoids in brain cells, independent of NF-kappa B. J Immunol. 1999;163:2113–2119. [PubMed] [Google Scholar]
- 14.Gilad E, Wong HR, Zingarelli B, Virág L, O'Connor M, Salzman AL, Szabó C. Melatonin inhibits expression of the inducible isoform of nitric oxide synthase in murine macrophages: role of inhibition of NFkappaB activation. FASEB J. 1998;12:685–693. doi: 10.1096/fasebj.12.9.685. [DOI] [PubMed] [Google Scholar]
- 15.Halusková J. Epigenetic studies in human diseases. Folia Biol (Praha) 2010;56:83–96. [PubMed] [Google Scholar]
- 16.Santos-Rebouças CB, Pimentel MM. Implication of abnormal epigenetic patterns for human diseases. Eur J Hum Genet. 2007;15:10–17. doi: 10.1038/sj.ejhg.5201727. [DOI] [PubMed] [Google Scholar]
- 17.Ames BN. Endogenous oxidative DNA damage, ageing and cancer. Free Rad Res Commun. 1989;7:121–128. doi: 10.3109/10715768909087933. [DOI] [PubMed] [Google Scholar]
- 18.Ebert MS, Sharp PA. Roles for microRNAs in conferring robustness to biological processes. Cell. 2012;149:515–524. doi: 10.1016/j.cell.2012.04.005. [DOI] [PMC free article] [PubMed] [Google Scholar]
- 19.Park JW, Ames BN. 7-Methylguanine adducts in DNA are normally present at high levels and increase on aging: analysis by HPLC with electrochemical detection. Proc Natl Acad Sci U S A. 1988;85:7467–7470. doi: 10.1073/pnas.85.20.7467. Erratum in: Proc Natl Acad Sci U S A 85(1988):9508. [DOI] [PMC free article] [PubMed] [Google Scholar]
- 20.Kunkel TA, Shearman CW, Loeb LA. Mutagenesis in vitro by depurination of ΦX174 DNA. Nature. 1981;291:349–351. doi: 10.1038/291349a0. [DOI] [PubMed] [Google Scholar]
- 21.Kaur H, Halliwell B. Measurement of oxidized and methylated DNA bases by HPLC with electrochemical detection. Biochem J. 1996;318:21–23. doi: 10.1042/bj3180021. [DOI] [PMC free article] [PubMed] [Google Scholar]
- 22.Petrlova J, Mikelova R, Stejskal K, Kleckerova A, Zitka O, Petrek J, Havel L, Zehnalek J, Vojtech A, Trnkova L, Kizek R. Simultaneous determination of eight biologically active thiol compounds using gradient elution-liquid chromatography with Coul-Array detection. J Sep Sci. 2006;29:1166–1173. doi: 10.1002/jssc.200500425. [DOI] [PubMed] [Google Scholar]
- 23.Ebbel EN, Leymarie N, Schiavo S, Sharma S, Gevorkian S, Hersch S, Matson WR, Costello CE. Identification of phenylbutyrate-generated metabolites in Huntington disease patients using parallel liquid chromatography/electrochemical array/mass spectrometry and off-line tandem mass spectrometry. Anal Biochem. 2010;399:152–161. doi: 10.1016/j.ab.2010.01.010. [DOI] [PMC free article] [PubMed] [Google Scholar]
- 24.Zhang F, Bartels MJ, Pottenger LH, Gollapudi BB, Schisler MR. Simultaneous quantitation of 7-methyl- and O6-methylguanine adducts in DNA by liquid chromatography-positive electrospray tandem mass spectrometry. J Chromatogr B Analyt Technol Biomed Life Sci. 2006;833:141–148. doi: 10.1016/j.jchromb.2006.01.035. [DOI] [PubMed] [Google Scholar]
- 25.Barak R, Vincze A, Bel P, Dutta SP, Chedda GB. Mass spectrometric investigation of the presence of 7-methyl ring-opened guanine derivatives in urine. Chem Biol Interact. 1993;86:29–40. doi: 10.1016/0009-2797(93)90109-c. [DOI] [PubMed] [Google Scholar]
- 26.Chadt J, Sykora D, Nilsson R, Vodicka P. Monitoring of dimethyl sulphate-induced N3-methyladenine, N7-methylguanine and O(6)-methylguanine DNA adducts using reversed-phase high performance liquid chromatography and mass spectrometry. J Chromatogr B Analyt Technol Biomed Life Sci. 2008;867:43–48. doi: 10.1016/j.jchromb.2008.03.008. [DOI] [PubMed] [Google Scholar]
- 27.Cepeda C, Wu N, André VM, Cummings DM, Levine MS. The corticostriatal pathway in Huntington's disease. Prog Neurobiol. 2007;81:253–271. doi: 10.1016/j.pneurobio.2006.11.001. [DOI] [PMC free article] [PubMed] [Google Scholar]
- 28.Kremer B, Goldberg P, Andrew SE, Theilmann J, Telenius H, Zeisler J, Squitieri F, Lin B, Bassett A, Almqvist E, Bird Thomas D., Hayden Michael R. A worldwide study of the Huntington's disease mutation: The sensitivity and specificity of measuring CAG repeats. N Engl J Med. 1994;330:1401–1406. doi: 10.1056/NEJM199405193302001. [DOI] [PubMed] [Google Scholar]
- 29.Stack EC, Del Signore SJ, Luthi-Carter R, Soh BY, Goldstein DR, Matson S, Goodrich S, Markey AL, Cormier K, Hagerty SW, Smith K, Ryu H, Ferrante RJ. Modulation of nucleosome dynamics in Huntington's disease. Hum Mol Genet. 2007;16:1164–1175. doi: 10.1093/hmg/ddm064. [DOI] [PubMed] [Google Scholar]
- 30.Truant R, Atwal RS, Burtnik A. Nucleocytoplasmic trafficking and transcription effects of huntingtin in Huntington's disease. Prog Neurobiol. 2007;83:211–227. doi: 10.1016/j.pneurobio.2006.11.004. [DOI] [PubMed] [Google Scholar]
- 31.Hodges A, Strand AD, Aragaki AK, Kuhn A, Sengstag T, Hughes G, Elliston LA, Hartog C, Goldstein DR, Thu D, Hollingsworth ZR, Collin F, Synek B, Holmans PA, Young AB, Wexler NS, Delorenzi M, Kooperberg C, Augood SJ, Faull RL, Olson JM, Jones L, Luthi-Carter R. Regional and cellular gene expression changes in human Huntington's disease brain. Hum Mol Genet. 2006;15:965–977. doi: 10.1093/hmg/ddl013. [DOI] [PubMed] [Google Scholar]
- 32.Sharma S, Kelly TK, Jones PA. Epigenetics in cancer. Carcinogenesis. 2010;31:27–36. doi: 10.1093/carcin/bgp220. [DOI] [PMC free article] [PubMed] [Google Scholar]
- 33.Kumar P, Kalonia H, Kumar A. Huntington's disease: pathogenesis to animal models. Pharmacol Rep. 2010;62:1–14. doi: 10.1016/s1734-1140(10)70238-3. [DOI] [PubMed] [Google Scholar]
- 34.Wyatt MD, Allan JM, Lau AY, Ellenberger TE, Samson LD. 3-methyladenine DNA glycosylases: structure, function, and biological importance. Bioessays. 1999;21:668–676. doi: 10.1002/(SICI)1521-1878(199908)21:8<668::AID-BIES6>3.0.CO;2-D. [DOI] [PubMed] [Google Scholar]
- 35.Hurley LH. DNA and its associated processes as targets for cancer therapy. Nat Rev Cancer. 2002;2:188–200. doi: 10.1038/nrc749. [DOI] [PubMed] [Google Scholar]
- 36.Chan CT, Dyavaiah M, DeMott MS, Taghizadeh K, Dedon PC, Begley TJ. A quantitative systems approach reveals dynamic control of tRNA modifications during cellular stress. PLoS Genet. 2010;6:e1001247. doi: 10.1371/journal.pgen.1001247. [DOI] [PMC free article] [PubMed] [Google Scholar]
- 37.Cowling VH. Regulation of mRNA cap methylation. Biochem J. 2009;425:295–302. doi: 10.1042/BJ20091352. [DOI] [PMC free article] [PubMed] [Google Scholar]


