Abstract
Similar to optical tweezers, a tightly focused ultrasound microbeam is needed to manipulate microparticles in acoustic tweezers. The development of highly sensitive ultrahigh frequency ultrasonic transducers is crucial for trapping particles or cells with a size of a few microns. As an extra lens would cause excessive attenuation at ultrahigh frequencies, two types of 200-MHz lensless transducer design were developed as an ultrasound microbeam device for acoustic tweezers application. Lithium niobate single crystal press-focused (PF) transducer and zinc oxide self-focused transducer were designed, fabricated and characterized. Tightly focused acoustic beams produced by these transducers were shown to be capable of manipulating single microspheres as small as 5 μm two-dimensionally within a range of hundreds of micrometers in distilled water. The size of the trapped microspheres is the smallest ever reported in the literature of acoustic PF devices. These results suggest that these lensless ultrahigh frequency ultrasonic transducers are capable of manipulating particles at the cellular level and that acoustic tweezers may be a useful tool to manipulate a single cell or molecule for a wide range of biomedical applications.
Keywords: ultrasonic transducer, acoustic tweezers, particle manipulation
Introduction
Devices for micro particle manipulation have been developed for many biophysical applications including quantifying mechanical properties of various cells and molecules (Bustamante et al., 2003; Neuman and Nagy, 2008; Subra, 2007; Wang et al., 1998). Among them, optical tweezers are the most well-known. These devices are based on the conservation of momentum in order to trap the particles with a tightly focused optical beam. They have been shown to be capable of producing forces at pico-newton level to manipulate particles of a size from tens of nanometers to tens of micrometers (Ashkin, 1992; Grier, 2003). They also have been found to have drawbacks that may have limited their practical limitations. (1) The high-resolution optical devices are commonly limited to optically purified samples. (2) The high intensity of focused lasers may damage the targeted biological samples by inducing local heating. (3) The force is too small to manipulate larger cells or particles.
Acoustic tweezers which may overcome some of these problems have recently been demonstrated (Choe et al., 2011; Liu and Hu, 2009; Marston, 2006; Shi et al., 2009; Woodside et al., 1997; Wu, 1991). Comparing to the optical tweezers, the acoustic counterpart is simpler and the cost may be lower. The initial research on acoustic tweezers was reported by Wu (1991) using two opposing sound beams to capture latex spheres and frog eggs. Other modes of operation for particle manipulation have also been reported including standing wave and Bessel beams (Choe et al., 2011; Liu and Hu, 2009; Marston, 2006; Shi et al., 2009; Woodside et al., 1997). The standing wave approach works on groups of particles. In contrast, single beam acoustic trapping is much more attractive because it can trap individual particles with a single acoustic beam. Tightly focused ultrasound microbeams at 96 and 30 MHz have been reported to be capable of trapping small lipid particles of a size at 50 and 120 μm in distilled water, respectively (Lee et al., 2009, 2010). To allow more practical biomedical applications at the cellular level, the size of particles that can be trapped must be further reduced. This goal cannot be met without the development of highly sensitive ultrahigh frequency ultrasonic transducers since the beam width is inversely proportional to the transducer frequency. More recently, a 200-MHz lens-focused transducer based on a traditional design with a sapphire lens was shown to be capable of trapping cell of a size of 15–20 μm diameter (Lee et al., 2011). To push the frequency to an even higher plateau, a lensless design which eliminates the attenuation of the ultrasound beam in the lens would be preferred (Cannata et al., 2000; Snook et al., 2002).
A lensless piezoelectric transducer could be fabricated by shaping the piezoelectric element via hard pressing (Lockwood et al., 1994), pressure defection (Chandrana et al., 2010), mechanical dimpling (Lam et al., 2012), or sputtering on a spherically shaped surface (Cannata et al., 2008). Compared to the lensed transducer design, a lensless transducer design with a shaped piezoelectric element is simpler and more cost effective.
For ultrasound microbeam applications, two 200 MHz transducers were designed and fabricated, and tested using press-focused (PF) and self-focused (SF) methods, respectively. In addition, the capability of these two lensless UHF transducers in trapping microparticles was experimentally demonstrated.
Materials and Methods
A PF ultrasonic transducer was fabricated using a lithium niobate single crystal while an SF transducer was fabricated by sputtering a zinc oxide film on a curved substrate.
Lithium Niobate PF Ultrasonic Transducer
The UHF lithium niobate (LiNbO3) PF ultrasonic transducer was fabricated using conventional transducer technology. The LiNbO3 single crystal was selected because it exhibits good electromechanical coupling capability, low dielectric permittivity, and high longitudinal sound velocity. These material properties are ideal for designing large aperture and high sensitivity single-element transducers.
The aperture size and proper thickness of acoustic stacks, such as LiNbO3 single crystal transducer element and parylene matching layer, were optimized by a Krimholtz, Leedom, and Matthaei model. Firstly, a conductive silver epoxy (E-Solder 3022, Von Roll Isola Inc., New Haven, CT) was cast onto the back side of a gold-electroplated 36° rotated Y-cut LiNbO3 plate (Boston Piezo-Optics, Bellingham, MA) as a backing material by centrifuging it at 1,200g for 15 min. After curing at room temperature overnight and lapping the backing layer, the front side of the LiNbO3 single crystal was lapped to its designed thickness of 17 μm. The sample was then diced into the designated dimension of 0.8 × 0.8 mm2. A lead wire was connected to the backing layer of the acoustic stack using conductive epoxy. The acoustic stack was then concentrically placed in the brass housing. The gap between the stack and housing was filled in by an insulating epoxy (Epo-Tek 301; Epoxy Technologies, Billerica, MA). The stack was PF at a focal length of 1.3 mm to obtain an f-number (f#) of ~1.6. The transducer surface was then sputtered with chrome/gold layers of approximately 1,500 Å in total thickness to make ground connection between the stack and the brass housing. A ~1.5 μm-thick parylene layer was vapor-deposited on the front face of the transducer to serve as an acoustic matching layer and a protection layer using a PDS 2010 Labcoater (SCS, Indianapolis, IN). The transducer was assembled in an SMA connector for further measurements, for example, pulse-echo characterization.
Zinc Oxide SF Ultrasonic Transducer
The UHF SF transducer was fabricated using a technique which was utilized previously to fabricate transducers at lower frequencies (Cannata et al., 2008; Robert et al., 2004). With using the SF transducer fabrication technique, the concave surface can be fabricated by simply spherically pressing the metal substrate before sputtering the transducer material. This method is particularly useful to fabricate low f# transducers. Zinc oxide (ZnO) is one of the most common sputtered piezoelectric films for ultrasonic transducer applications. Similar to the LiNbO3 single crystal, low dielectric permittivity and acceptable electromechanical coupling performance make ZnO to be an excellent candidate of large aperture single element transducers.
Because of its good conductive characteristics and machinability, a 3.2-mm diameter aluminum (Al) rod was selected as a backing substrate. After machining and polishing process, a rod of a length of 15 mm with well-polished flat surface on one end was obtained. A 2-mm diameter highly polished chrome/steel ball bearing was then used to press the spherical shape into the polished end so as to obtain a focal length of 1 mm at room temperature. To achieve an f# of 1.0, the Al rod was machined down to a 1-mm diameter and 5-mm long using a lathe. After fabrication of the Al backing material, ZnO piezoelectric films were deposited on the spherical polished surface of the Al rod using an RF sputtering machine. A 14.5-μm thick ZnO layer was sputtered under O2:Ar (1:1) gas pressure of 10 mTorr at 300°C with an RF power of 300 W. The deposition rate was ~0.6 μm/h. Once cooled to the room temperature, the lead wire was connected to the backing substrate with a small amount of conductive E-Solder 3022 epoxy. The later housing procedures, electrode sputtering and parylene coating conditions were identical to those mentioned for the PF transducer above. The SF transducer was also assembled with an SMA connector.
Transducer Characterizations
The performance of the transducer, including bandwidth (BW) and insertion loss (IL), was evaluated in distilled water from conventional pulse-echo response measurements (Cannata et al., 2003). During the measurement, the transducer was connected to a Panametrics (Waltham, MA) model 5910PR pulser/receiver and excited by an electrical impulse at 200 Hz repetition rate and 50Ω damping An X-cut quartz plate was used as a target. The testing distance was at the focal length of the transducer. The reflected waveform was received and digitized by a 1-GHz LC534 LeCroy (Chestnut Ridge, NY) oscilloscope with 50Ω coupling. The built-in math feature of the oscilloscope was used to perform the fast Fourier transform of the received waveform. The center frequency (fc) and the −6 dB BW were determined from the measured frequency spectrum:
| (1) |
| (2) |
where f1 and f2 represent the lower and upper −6 dB frequencies, respectively.
To measure the IL, a Sony/Tektronix (Beaverton, OR) model AFG2020 function generator with 50Ω output impedance was used to generate a tone burst of a sine wave at the center frequency of the transducer, as measured by an oscilloscope in 1 MΩ coupling mode. By connecting the transducer to the function generator, the received echo voltage amplitude was measured using the oscilloscope in 50Ω coupling mode. Due to transmission into the quartz crystal, the 18% receive pressure/voltage lost was compensated in the final IL calculation. The signal loss due to attenuation in the water bath was also compensated using an attenuation of 2.2 × 10⁻⁴ dB/mm MHz2 (Lockwood et al., 1994).
The lateral beam profile of the transducer was evaluated with a wire target. Wire scanning was performed using a three-axis positioning system (Inchworm, Burleigh Inc., Fishers, NY) with an in-house computer-controlled exposimetry system at a resolution of about 0.5 μm. A 6-μm diameter tungsten wire (California Fine Wire, Grover Beach, CA) was used as a target. The pulse intensity integral (PII) was calculated from the received echoes, which were reflected from the wire target. PII is defined as the time integral of the intensity of an echo taken over the time where the acoustic pressure is non-zero (Raum and O’Brien, 1997).
Acoustic Trapping Experiments
Figure 1 shows an acoustic trapping experimental setup. A micro particle trapping device was set with the focused single-element ultrasonic transducer in a chamber of distilled water. The chamber had an opening with an acoustically transparent mylar film at its bottom. The transducer mounted on a three-axis motorized linear stage (LMG26 T50 MM; OptoSigma, Santa Ana, CA) was manipulated perpendicularly to the beam axis at the focal distance above an acoustically transparent mylar film. The linear stage was controlled by a customized LabVIEW programs. The movement of the transducer could be varied from 1 to 10 μm by programmed increments. The trapped motions of the particles were recorded via a CMOS camera (ORCA-Flash2.8, Hamamatsu, Japan) combined with an inverted microscope (IX-71, Olympus, Japan). The images as well as videos captured by the CMOS camera were recorded with a computer.
Figure 1.
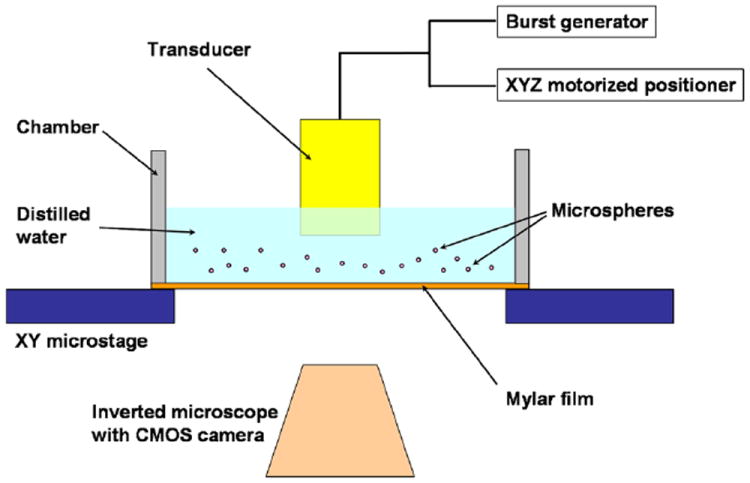
Schematic diagram of the micro particle trapping measurement setup.
Prior to the acoustic trapping experiment, a pulse-echo test was performed to ensure that the targeted particles were located on the focal plane. In this work, the micro particles used for trapping experiment were polystyrene microspheres of 5 and 10 μm mean diameter (Microbead NIST traceable particle size standard, Polyscience, Inc., Warrington, PA). During the experiment, the microspheres were suspended above the mylar membrane in distilled water. In order to achieve desirable peak-to-peak voltage amplitude, duty factor and pulse repetition frequency, the transducer was driven in a sinusoidal burst mode by a function generator (AFG3251, Tektronix, Anaheim, CA) and then amplified by a 50-dB power amplifier (525LA, ENI, Rochester, MN). A single microsphere was then randomly targeted within the field of view of the microscope. To demonstrate the capability of two-dimensional single micro particle manipulation, the transducer with the trapped particle was moved in a random path by the motorized stages.
Results and Discussions
Transducers Characteristics
LiNbO3 PF Transducer
The receive-echo response and frequency spectra of the LiNbO3 PF transducer are shown in Figure 2. It was found that the center frequency of the transducer was around 200 MHz and the −6 dB BW was determined to be ~29%. The IL of the PF transducer was measured and determined to be 26 dB. Its sensitivity is much higher than that of a high-frequency PZT transducer (160 MHz) reported in the literature (Lukacs et al., 2000).
Figure 2.
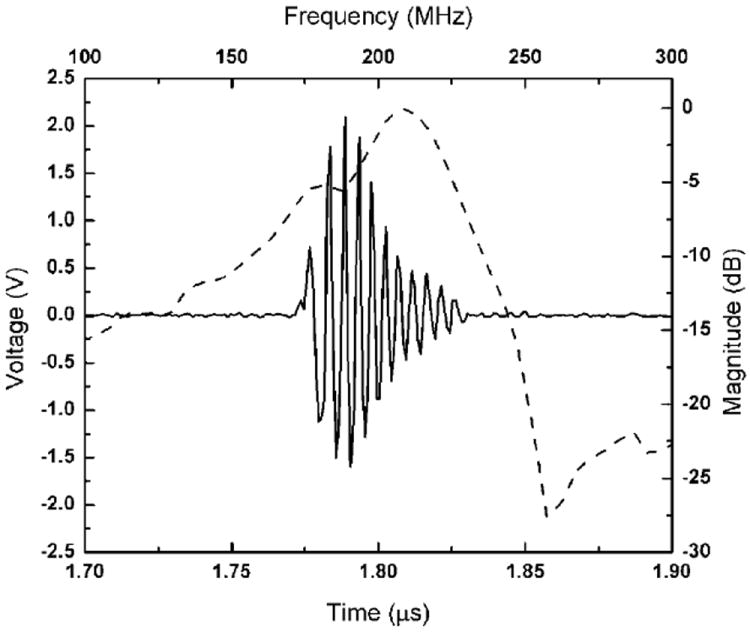
Time-domain pulse/echo response (solid line) and frequency spectrum (dashed line) of the 200 MHz LiNbO3 PF transducer.
Figure 3 shows the lateral beam profile of the LiNbO3 PF transducer. The beam width was obtained by detecting a spatial point at which its PII value is reduced by 6 dB from the peak. As shown in Figure 4, the beam width was determined to be 16.8 μm, which was close to the theoretical value of 12.0 μm (=f#* wavelength) (Shung, 2006).
Figure 3.
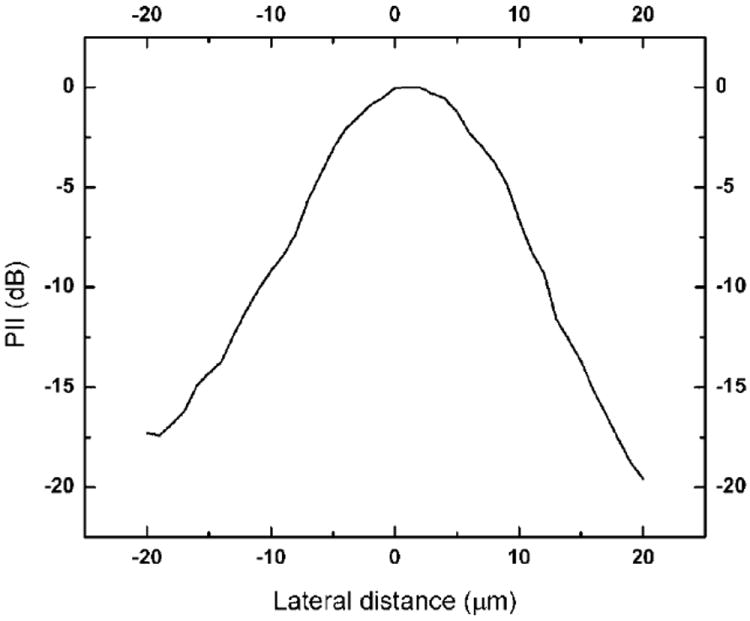
Lateral beam profile of the 200 MHz LiNbO3 PF transducer.
Figure 4.
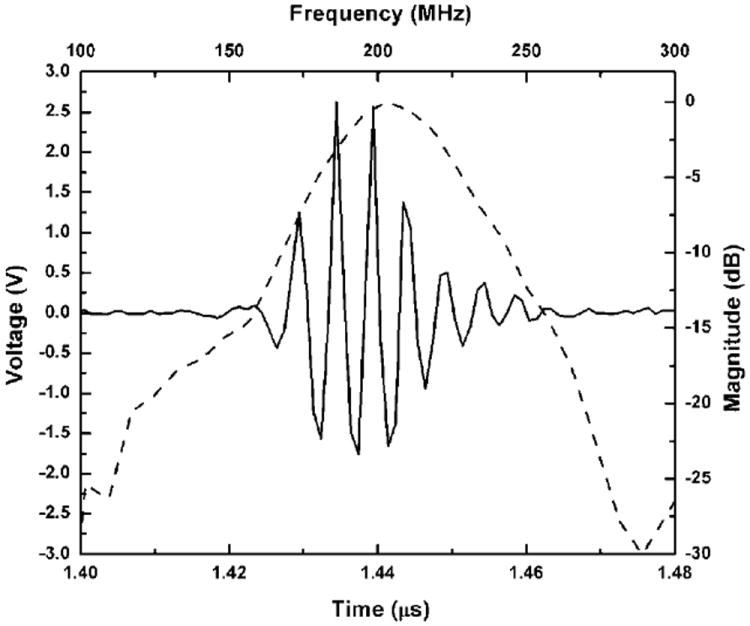
Time-domain pulse/echo response (solid line) and frequency spectrum (dashed line) of the 200 MHz ZnO SF transducer.
ZnO SF Transducer
The measured pulse-echo waveform and normalized frequency spectrum of the ZnO SF transducer are shown in Figure 4. f1 and f2 of the transducer were found to be 177 and 231 MHz, respectively. From Equations (1) and (2), the SF transducer was determined to exhibit a center frequency of 204 MHz and the −6 dB BW of ~27%. The measured IL of the SF transducer was 61 dB, which was comparable to our previous work (Cannata et al., 2008).
Figure 5 shows the lateral beam profile of the ZnO SF transducer. The measured beam width of the SF transducer was estimated to be 8.5 μm. The result was in approximate agreement with the theoretical width of 7.5 μm.
Figure 5.
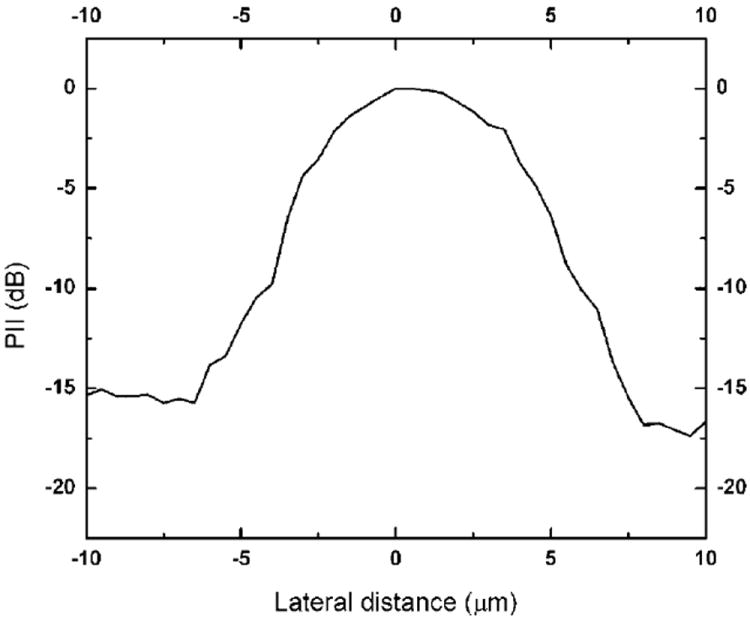
Lateral beam profile of the 200 MHz ZnO SF transducer.
Discussions
Table I summarizes the performance of the PF and SF transducers. It is shown that both transducers have an ultrahigh center frequency of 200 MHz. Although the transducers were fabricated using different approaches, their BW characteristics were similar. The only major difference is that the IL of the SF transducer is much higher than that of the PF one. It may be attributable to the lower electromechanical coupling coefficient of ZnO. Nevertheless, compared to the PF method, the SF method is much easier to fabricate low f# transducers without taking a risk of electrical short-circuit through the cracked transducer element. At an f# of 1.0, the tightly focused SF transducer still showed a well-behaved beam profile.
Table I.
Summary of transducers performance.
| Transducer | f (no.) | fc (MHz) | BW (%) | IL (dB) | Beam width (μm) |
|---|---|---|---|---|---|
| LiNbO3 PF | 1.6 | 200 | 29 | 26 | 16.8 |
| ZnO SF | 1.0 | 204 | 27 | 61 | 8.5 |
Two-Dimensional Acoustic Trapping Performance
The capability of these 200-MHz microbeam devices in trapping a single microsphere was clearly demonstrated. Figure 6 shows an example of a single microsphere manipulation using the LiNbO3 PF microbeam device. A series of images were captured at a frame rate of 10 frames/s. The bright circular structure is the projection of the transducer. As seen in the images, two sizes (5 and 10 μm) of microsphere were involved. A yellow dot is given as a reference point to show the location change of the microsphere. The PF transducer was driven by a sinusoidal burst under the following conditions: an excitation frequency of 200 MHz, a driving voltage of 30 Vpp, a duty cycle of 0.2% and a pulse repetition frequency of 1 kHz. It was observed that a single 5 μm microsphere (a red circle) was manipulated along with the movement of the microbeam device. As the device manipulated the single microsphere to different paths, the microspheres nearby were only slightly affected. The small affected area was an evidence of the transducer having a tightly focused microbeam. Supplementary Figure 7 shows the motion of a trapped single 5 μm microsphere which could be manipulated effectively without being affected by neighbor microspheres.
Figure 6.

Example of microsphere manipulation using the 200-MHz LiNbO3 PF transducer. A single 5 μm microsphere was manipulated along the movement of the 200-MHz PF transducer. A red circle is a trapped microsphere while a yellow dot is given as a reference point to show the location change of the microsphere. (The capturing frame rate was 10 frames/s.)
Similar results were obtained for the ZnO SF transducer. The sinusoidal burst was set to the following parameters: the operating frequency was 204 MHz with a peak-to-peak voltage of 32 Vpp, a duty factor of 0.1% and a pulse repetition frequency of 1 kHz. Supplementary Figure 8 shows the motion of a trapped polystyrene microsphere (10 μm) in the focal plane using the SF transducer. Owing to the tightly focused beam, the microsphere was firmly immobilized to the spot and held stationary. It was observed that without any contact between the transducer and microspheres, the single trapped microsphere could be moved over a wide range by simply moving the transducer.
As the size of the particle trapped is already at the cellular level, the 200-MHz microbeam devices have great potential to be a single cell manipulator for wide range of applications in biomedical and chemical sciences including investigating intercellular adhesion processes and cell stimulation.
Conclusions
Results obtained from this study show that both 200-MHz LiNbO3 PF and ZnO SF transducers can be used as a microbeam device for acoustic tweezers application. The transducers were found to exhibit BW and beam width comparable to the theoretical values. The microparticle trapping experiments demonstrate that a single microsphere (5 or 10 μm) can be successfully trapped by these 200-MHz lensless microbeam devices within a range of tens of micrometers in distilled water. The realization of ultrasound microbeams paves the way for exploring new biomedical applications of acoustic tweezers including intercellular kinetics studies and cell fusion control.
Supplementary Material
Acknowledgments
The authors would like to thank Jay Williams, Jonathan Cannata, and Jae Youn Hwang for their help in this work.
Contract grant sponsor: NIH
Contract grant number: R01-EB12058; P41-EB2182
Footnotes
Additional supporting information may be found in the online version of this article.
References
- Ashkin A. Forces of a single-beam gradient laser trap on a dielectric sphere in the ray optics regime. Biophys J. 1992;61:569–582. doi: 10.1016/S0006-3495(92)81860-X. [DOI] [PMC free article] [PubMed] [Google Scholar]
- Bustamante C, Bryant Z, Smith SB. Ten years of tension: Single-molecule DNA mechanics. Nature. 2003;421:423–427. doi: 10.1038/nature01405. [DOI] [PubMed] [Google Scholar]
- Cannata JM, Ritter TA, Chen WH, Shung KK. Design of focused single element (50–100 MHz) transducers using lithium niobate. Proc IEEE Ultra Sym. 2000;2:1129–1133. [Google Scholar]
- Cannata JM, Ritter TA, Chen WH, Silverman RH, Shung KK. Design of efficient, broadband single-element (20–80 MHz) ultrasonic transducers for medical imaging applications. IEEE Trans Ultrason Ferroelectr Freq Control. 2003;50:1548–1557. doi: 10.1109/tuffc.2003.1251138. [DOI] [PubMed] [Google Scholar]
- Cannata JM, Williams JA, Zhou QF, Sun L, Shung KK, Yu H, Kim ES. Self-focused ZnO transducers for ultrasonic biomicroscopy. J Appl Phys. 2008;103:084109. [PMC free article] [PubMed] [Google Scholar]
- Chandrana C, Kharin N, Vince GD, Roy S, Fleischman AJ. Demonstration of second-harmonic IVUS feasibility with focused broadband miniature transducers. IEEE Trans Ultrason Ferroelectr Freq Control. 2010;57:1077–1085. doi: 10.1109/TUFFC.2010.1519. [DOI] [PubMed] [Google Scholar]
- Choe Y, Kim JW, Shung KK, Kim ES. Microparticle trapping in an ultrasonic Bessel beam. Appl Phys Lett. 2011;99:233704. doi: 10.1063/1.3665615. [DOI] [PMC free article] [PubMed] [Google Scholar]
- Grier DG. A revolution in optical manipulation. Nature. 2003;424:810–816. doi: 10.1038/nature01935. [DOI] [PubMed] [Google Scholar]
- Lam KH, Chen Y, Cheung KF, Dai JY. PMN-PT single crystal focusing transducer fabricated using a mechanical dimpling technique. Ultrasonics. 2012;52:20–24. doi: 10.1016/j.ultras.2011.06.004. [DOI] [PubMed] [Google Scholar]
- Lee J, Teh S, Lee A, Kim HH, Lee C. Single beam acoustic trapping. Appl Phys Lett. 2009;95:073701. doi: 10.1063/1.3206910. [DOI] [PMC free article] [PubMed] [Google Scholar]
- Lee C, Lee J, Lau ST, Zhou Q, Shung KK. Single microparticle manipulation by an ultrasound microbeam. Proc IEEE Ultra Sym. 2010:849–852. [Google Scholar]
- Lee J, Lee C, Kim HH, Jakob A, Lemor R, Teh SY, Lee A, Shung KK. Targeted cell immobilization by ultrasound microbeam. Biotechnol Bioeng. 2011;108:1643–1650. doi: 10.1002/bit.23073. [DOI] [PMC free article] [PubMed] [Google Scholar]
- Liu Y, Hu J. Ultrasonic trapping of small particles by a vibrating rod. IEEE Trans Ultrason Ferroelectr Freq Control. 2009;56:798–805. doi: 10.1109/TUFFC.2009.1102. [DOI] [PubMed] [Google Scholar]
- Lockwood GR, Turnbull DH, Foster FS. Fabrication of high frequency spherically shaped ceramic transducers. IEEE Trans Ultrason Ferroelect Freq Control. 1994;41:231–235. [Google Scholar]
- Lukacs M, Sayer M, Foster S. Single element high frequency (>50 MHz) PZT sol gel composite ultrasound transducers. IEEE Trans Ultrason Ferroelect Freq Control. 2000;47:148–159. doi: 10.1109/58.818757. [DOI] [PubMed] [Google Scholar]
- Marston PL. Axial radiation force of a Bessel beam on a sphere and direction reversal of the force. J Acoust Soc Am. 2006;120:3518–3524. doi: 10.1121/1.2361185. [DOI] [PubMed] [Google Scholar]
- Neuman K, Nagy A. Single-molecule force spectroscopy: Optical tweezers, magnetic tweezers and atomic force microscopy. Nat Methods. 2008;5:491–505. doi: 10.1038/nmeth.1218. [DOI] [PMC free article] [PubMed] [Google Scholar]
- Raum K, O’Brien WD., Jr Pulse-echo field distribution measurement technique of high-frequency ultrasound sources. IEEE Trans Ultrason Ferroelect Freq Control. 1997;44:810–815. [Google Scholar]
- Robert M, Molingou G, Snook K, Cannata J, Shung KK. Fabrication of focused poly(vinylidene fluoride-trifluoroethylene) P(VDF-TrFE) copolymer 40–50 MHz ultrasound transducers on curved surfaces. J Appl Phys. 2004;96:252–256. [Google Scholar]
- Shi J, Ahmed D, Mao X, Lin SCS, Lawit A, Huang TJ. Acoustic tweezers: Patterning cells and microparticles using standing surface acoustic waves (SSAW) Lab Chip. 2009;9:2890–2895. doi: 10.1039/b910595f. [DOI] [PubMed] [Google Scholar]
- Shung KK. Diagnostic ultrasound: Imaging and blood flow measurements. Boca Raton, FL: CRC Press; 2006. [Google Scholar]
- Snook KA, Zhao JZ, Alves CHF, Cannata JM, Chen WH, Meyer JJ, Ritter TA, Shung KK. Design, fabrication, and evaluation of high frequency, single-element transducers incorporating different materials. IEEE Trans Ultrason Ferroelectr Freq Control. 2002;49:169–176. doi: 10.1109/58.985701. [DOI] [PubMed] [Google Scholar]
- Subra S. Biomechanics and biophysics of cancer cells. Acta Biomater. 2007;3:413–438. doi: 10.1016/j.actbio.2007.04.002. [DOI] [PMC free article] [PubMed] [Google Scholar]
- Wang MD, Schnitzer MJ, Yin H, Landick R, Gelles J, Block SM. Force and velocity measured for single molecules of RNA polymerase. Science. 1998;282:902–907. doi: 10.1126/science.282.5390.902. [DOI] [PubMed] [Google Scholar]
- Woodside SM, Bowen BD, Piret JM. Measurement of ultrasonic forces for particle-liquid separations. AICHE J. 1997;43:1727–1736. [Google Scholar]
- Wu JR. Acoustical tweezers. J Acoust Soc Am. 1991;89:2140–2143. doi: 10.1121/1.400907. [DOI] [PubMed] [Google Scholar]
Associated Data
This section collects any data citations, data availability statements, or supplementary materials included in this article.


