Abstract
Presence of the hydrogen bonding near a metal center can influence the properties of the complex. Here, we describe changes in redox and spectral properties in discrete dioxo-molybdenum centers coordinated by a single thiolato ligand that can support an intra-ligand hydrogen bond. We have utilized thiophenolato ligands that can harbor hydrogen bonding between the thiophenolato sulfur with an amide functionality creating either a five- or a six-member ring. Methylation of the amide functionality removes the NH⋯S hydrogen bonding thus provides a basis for understanding the effect of hydrogen bonding. These thiophenolato ligands have been used in synthesizing dioxo-MoVI complexes of type Tp*MoO2(S-o-RC6H4), where R = CONHMe (11), CONMe2 (12), NHCOMe (13), and N(Me)COMe (14). The complexes have been characterized by NMR, infrared, and UV-visible spectroscopy. Spectroscopic data clearly indicate the presence of hydrogen bonding in both 11 and 13, and stronger in 13, where hydrogrn bonding stabilizes a five-member ring. All complexes exhibit MoVI/MoV redox couple and redox potentials are modulated by the nature of H-bonding. Compound 14 with the electron-releasing N(Me)COMe group has the highest reduction potential and is more difficult to reduce.
Introduction
The presence of hydrogen bonding is extensive in biological systems.1 They play important roles in functioning of biological molecules such as structural organization, control of redox potential, substrate entry and product release. Hydrogen bonding is ubiquitous in metalloenzymes including mononuclear molybdenum enzymes, which carry out many essential life processes.2 We are interested in understanding how hydrogen bonding can influence the redox properties of oxo-molybdenum centers, which are the active centers of mononuclear molybdenum enzymes. Extended hydrogen bonding constitutes catalytic pockets often creating a positively charged channel conducive to binding of anionic product or substrate. For example, the active site of sulfite oxidase (SO), a network of H-bonded water molecules from SO32− to the oxomolybdenum center has been observed,2,3,4 which raises questions about the roles of hydrogen bonding in modulating properties of the metal center. Sulfite oxidase is considered to be a prototypical oxotransferase, where water serves as the ultimate source of oxygen atom.7 A simplified view of the reductive half cycle of sulfite oxidase is shown in Figure 1, where water molecule is hydrogen bonded to the substrate– sulfite. In this model, the product, sulfate is generated via electron and proton transfer processes.
Figure 1.

Transfer of oxygen atom from the H-bonded remote second coordination sphere water molecule to oxidizing sulfide to sulfate.7
Synthetic models of molybdenum enzymes generally use two main approaches for introducing hydrogen bonding – one that harbors H-bonding within the ligand, and one where H-bonding involves an anion, cation or a solvent molecule.8,9,10 Both approaches have been successfully utilized in developing molybdenum enzyme models. We are primarily interested in the former approach, where a hydrogen bonding unit is placed by design. Several synthetic models for the oxo-molybdenum center of molybdoenzymes have been synthesized, where ligand provides one or more hydrogen bonded unit(s) in the close proximity of a metal center. This proximity strongly influences the properties of the metal center. Much emphasis has been given to the 5-membered, 2-(acylamino)benzene thiolate ligands (type B, Figure 2), which exhibited a large positive shift in redox potential in alkylammonium salts of [MoVO(S-o-R′CONHC6H4)411,12 and [MoIVO{1,2-S2-3,6-(R′CONH)2C6H2}2] (R′ = CH3, CF3, t-Bu, Ph3C).13,14 The effect of intramolecular hydrogen bonding was evaluated by comparing the corresponding N-methylated complexes where such hydrogen bonding is not present. Sensitivity of redox potential on similar hydrogen bonding has been reported for molybdenum nitrosyl compound, Tp*Mo(NO)(SCH2CONHCH3)2.15 Several other metals such as tungsten,16 iron,17 zinc,18 cadmium,18(d),19 mercury,20 cobalt,21 copper,22 platinum, and palladium23 have also been reported to form complex with 2-(acylamino)benzene thiolate type ligands. In these complexes, various thiolato ligands impart influence on the properties of metal center. The presence of a NH⋯S hydrogen bond not only contributes to the positive shifts in the redox potentials in complexes, but also affects their spectral and structural properties by modulating the metal-sulfur interaction.
Figure 2.
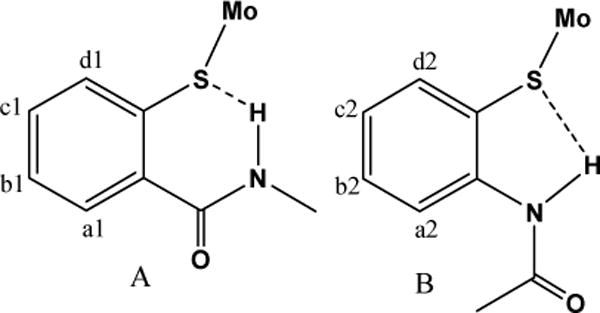
Two modes of intra-ligand NH⋯S hydrogen bonding, used in this investigation.
2-(alkylcarbamoyl)benzene thiolate ligands (type A, Figure 2) constitute a different class of ligands, which potentially can exhibit intramolecular hydrogen bonding such as SH⋯O=C or S⋯HN in protonated thiol forms or in deprotonated thiolato forms, respectively. While such units have not been fully explored in oxo-molybdenum chemistry, their mercury, platinum, palladium, iron, and gallium complexes have been reported.23,24,25 These complexes e.g. [Pt(bpy)(S-o-MeNHCOC6H4)2] and (NEt4)2[Hg(S-o-MeNHCOC6H4)4], posses weak NH⋯S intra-ligand (type A) hydrogen bonding.24 In the alkyl analogue of type A thiolates, based on infrared studies Zuppiroli et al. have proposed extended structures of neutral HSC2H4CONHCH3 ligand.26 This was also found in Tp*Mo(NO)(S(CH2)2CONHCH3)15, where no six-membered cyclic structure containing S⋯HN was found in its crystal structure. Instead, an interligand O⋯HN was observed. Interestingly, complexes like Tp*Mo(NO)(S(CH2)2CONHCH3) and Tp*Mo(NO)(S(CH2)2CONH(CH2)2S)27 do not possess intra-ligand H-bond but their redox potentials are shifted towards higher values compared to the N-methylated complexes.
Herein we report the syntheses and characterization of dioxo-molybdenum complexes with ligands harboring type A and type B hydrogen bonding units. In addition, we also report the syntheses and characterization of complexes of the corresponding N-methylated ligands that cannot exhibit similar hydrogen bonding. We demonstrate that in both types (type A and type B) H-bonding can influence the spectral as well as the electrochemical properties of the complexes.
Experimental Section
Unless otherwise specified, all the reactions were carried out in oven dried glassware in dry atmospheres of argon using standard Schlenk techniques. All work up and chromatographic purifications of complexes were conducted in air using distilled solvents. Solvents were purified as follows: dichloromethane (CH2Cl2) from CaH2; toluene, hexane, and tetrahydrofuran (THF) from Na-benzophenone; ethanol (EtOH) by refluxing with freshly prepared sodium ethoxide. Triethylamine and pyridine were purified by distilling over KOH pellets. For adsorption chromatography, silica gel (60 Å, 63–200 μm) from Sorbent Technologies was used. Thin layer chromatography (TLC) was performed on silica gel-coated plastic plates also purchased from Sorbent Technologies.
Room temperature 1H and 13C NMR spectra were recorded using a Bruker ACP-300 spectrometer at 300.133 MHz and 75.469 MHz frequencies, respectively. Additional 1H NMR spectra were collected on a Bruker 400 MHz spectrometer. Deuterated solvents were obtained from Cambridge Isotope laboratories and were used without further purification. Solid-state infrared spectra were recorded on a Perkin-Elmer FT-IR 1760X spectrometer in KBr pellets. Solution IR spectra were recorded using a flow through CaF2 cell with 0.1mm solvent path length. Mass spectra were collected on Micromass ZMD mass spectrometer using both negative and positive ionization modes. Acetonitrile (or methanolic) solutions of the samples were injected via a syringe pump with a flow rate of 0.1 – 0.2 ml/min. Electronic spectra of complexes were collected on a Cary 3 spectrophotometer. Cyclic voltammograms (CVs) of complexes were recorded on a Bioanalytical systems (BAS) model CV-50W using a standard three electrode system, consisting of Pt-disk working and reference electrodes and a Pt-wire auxiliary electrode. Measurements were performed in dry and degassed acetonitrile using 0.2M NBu4ClO4 of supporting electrolyte, and internally referenced with Fc+/Fc couple, and the potentials are expressed with respect to Fc+/Fc couple.
Synthesis
Tp*MoO2Cl and Tp*MoO2(SPh) were prepared following the published methods.28 Similarly, N-[2-(2-Acetylamino-phenyl disulfanyl)-phenyl]-acetamide, 7, and N-{2-[2-(Acetyl-methyl-amino)-phenyl disulfanyl]-phenyl}-N-methyl-acetamide, 8, were synthesized according to the literature procedure.29
2-caboxylphenyl disulfanyl benzoic acid, 1
To a solution of 2-mercapto benzoic acid (1.5 g, 9.74 mmoles) in 95% EtOH (100 ml) was added a saturated solution of I2 in 95% EtOH in an open atmosphere until a light yellow color of the reaction mixture persisted. Precipitation of a white solid occurred after ~30 min of stirring, which was collected and washed with ethanol. Solid was further dried under vacuum at 50 °C. Yield, 60% (0.9 g, 2.94 mmoles). NMR (1H, δ, ppm) in (CD3)2SO: 7.33 (t, 2H, J = 7.3 Hz,); 7.55 (t, 2H, J = 7.3 Hz); 7.62 (d, 2H, J = 8.1 Hz); 8.02 (d, 2H, J = 7.5 Hz). NMR (13C, δ, ppm) in (CD3)2SO: 125.04; 125.96; 128.12; 131.55; 133.21; 138.93; 167.58. IR (KBr, cm−1): 2920, 2661, 1683, 1587, 1561, 1461, 1416, 1310, 1292, 1260, 1151, 1056, 1038, 898, 809, 738, 695, 651. ESI−-MS (CH3OH): m/z: 153.03 [1/2(M-2H)]2−, (M = C14H10O4S2, 306.36).
2-Chlorocarbonyl-phenyl disulfanyl benzyl chloride, 2
To a mixture of 1 (3 g, 9.8 mmoles) and N,N-dimethylformamide (1 ml) in THF (25 ml) was oxalyl chloride (8.5 ml, 97.4 mmoles) slowly added at 0 ºC. The reaction mixture was gradually warmed to the room temperature and further stirred for 3 h. Evaporation of solvents to dryness under reduced pressure afforded a yellow solid in quantitative yield, which was characterized without further purifications. NMR (1H, δ, ppm) in (CD3)2SO: δ = 7.39 (t, 2H, J = 7.2 Hz); 7.55 (t, 2H, J = 7.6 Hz); 7.76 (d, 2H, J = 9.1 Hz); 8.38 (d, 2H, J = 7.8 Hz). NMR (13C, δ, ppm) in (CD3)2SO: 126.18; 126.44; 130.46; 135.12; 135.60; 141.55; 167.50. IR (KBr, cm−1): 1718, 1583, 1555, 1446, 1435, 1199, 1133, 1039, 898, 879, 764, 721, 695, 655.
N-Methyl-(2-methyl carbomyl-phenyl disulfanyl) benzamide, 3
A solution of freshly prepared 2 (3.36 g, 9.8 mmoles) in CH2Cl2 (30 ml) was slowly added to a mixture of MeNH2·HCl (2.0 g, 29.6 mmoles) and Et3N (8.2 ml, 58.9 mmoles) in CH2Cl2 (15 ml) at 0 ºC. The reaction mixture was gradually warmed to the room temperature and stirred overnight. The reaction was quenched with water and a white precipitate was filtered, washed with water and dried in a desiccator. Yield, 75% (2.44 g, 7.35mmoles). NMR (1H, δ, ppm) in (CD3)2SO: 2.73 (d, 6H, J = 4.3 Hz); 7.30 (t, 2H, J = 7.4 Hz); 7.45 (t, 2H, J = 7.3 Hz); 7.63 (m, 4H); 8.58 (m, 2H). This compound was sparingly soluble in CHCl3. NMR (1H, δ, ppm) in CDCl3 2.99 (d, 6H, J = 4.8 Hz), 6.16 (s, 2H), 7.25 (t, J = 7.3Hz), 7.37 (t, 2H, J = 8.0 Hz), 7.48 (d, 2H, J = 7.7 Hz), 7.76 (d, 2H, J = 7.8 Hz). NMR (13C, δ, ppm) in (CD3)2SO: 26.18; 125.85; 127.80; 131.04; 133.71; 136.64; 167.24. IR (KBr, cm−1): 3284, 3084, 1632, 1551, 1406, 1327, 745, 695. ESI+-MS (CH3CN): m/z: 333.31 [M+H]+, (M = C16H16N2O2S2, 332.07).
2-(dimethylcarbamoyl-phenyldisulfanyl)-N,N-dimethyl benzamide, 4
This compound was synthesized by following the procedure described for 3 using compound 2 (4.48 g, 13.06 mmoles), Me2NH·HCl (3.26 g, 40 mmoles), and Et3N (11.0 ml, 79.5 mmoles) in CH2Cl2 (50 ml). After the addition of water, the organic layer was separated, dried over anhydrous MgSO4 and evaporated to yield a light pink solid, which was further purified by silica column using a 5–30% gradient of acetonitrile in toluene. Yield, 80% (3.77 g, 10.45 mmoles). NMR (1H, δ, ppm) in CD3CN: 2.74 (s, 6H); 3.05 (s, 6H); 7.24 (d, 2H, J = 7.4 Hz); 7.34 (t, 2H, J = 7.3Hz); 7.41 (t, 2H, J = 7.8 Hz), 7.73 (d, 2H, J = 7.7 Hz). NMR (13C, δ, ppm) in CD3CN: 22.06; 35.98; 127.19; 128.40; 128.67; 129.41; 135.26; 141.65; 165.8. NMR (1H, δ, ppm) in CDCl3: 2.84 (s, 6H); 3.12 (s, 6H); 7.20 (d, 2H, J = 7.0 Hz); 7.26 (t, 2H, J = 7.2 Hz); 7.33 (t, 2H, J = 7.4 Hz); 7.68 (d, 2H, J = 7.2 Hz). NMR (13C, δ, ppm) in CDCl3: 35.00; 38.90; 127.01; 127.64; 128.83; 130.03; 134.24; 136.75; 169.39. IR (KBr, cm−1): 3049, 2926, 1648, 1620, 1586, 1508, 1392. ESI+-MS (CH3CN): m/z: 360.1 [M+H]+, (M = C18H20N2O2S2, 360.49).
2 Mercapto N-methyl benzamide, 5
To a solution of 3 (1.65 g, 1.99 mmoles) in EtOH (20 ml) and THF (20 ml) was added NaBH4 (0.30 g, 7.96 mmoles) in small portions at 0 ºC and reaction mixture was warmed to the room temperature and stirred for 4h. Solvents were removed under vacuum, the resulting yellow solid was dissolved in distilled water (10 ml) and dilute AcOH was added to acidify the solution to pH ~ 4. A yellowish oily material separated out from the solution, which was extracted with EtOAc (60 ml) and dried over anhydrous MgSO4. Evaporation of EtOAc yielded a yellow liquid, which was purified by adsorption chromatography on silica gel using a 1:3 mixture of acetonitrile and toluene to yield 90% (1.49 g, 3.58 mmoles) of final product. NMR (1H, δ, ppm) in CD3CN: 2.84 (d, 3H, J = 5.8Hz); 5.00 (s, 1H); 6.85 (m, 1H); 7.17 (t, 1H, J = 7.2 Hz); 7.28 (t, 1H, J = 7.3 Hz); 7.35 (d, 1H, J = 7.2 Hz); 7.45 (d, 1H, J = 7.3 Hz). NMR (13C, δ, ppm) in CD3CN: 26.69; 126.02; 129.05; 131.50; 134.10; 169.82. IR (KBr, cm−1): 3315, 2936, 2538, 1621, 1588, 1544, 1407, 1319, 1269, 1173, 1042, 1007, 745, 714. ESI−-MS (CH3CN): m/z: 166 [M-H]−, (M = C8H9NOS, 167).
2 Mercapto N,N-dimethyl benzamide, 6
This compound was synthesized by reducing 4 (2.0 g, 5.55 mmoles) with NaBH4 (0.85 g, 22.37mmoles) in THF/EtOH (12 ml/12 ml) as described for the synthesis of 5. Yield, 87.5% (1.75 g, 9.71 mmoles). NMR (1H, δ, ppm) in CD3CN: 2.83 (s, 3H); 3.09 (s, 3H); 3.74 (s, 1H); 7.15–7.20 (m, 3H); 7.29 (d, 1H, J = 7.4 Hz). NMR (13C, δ, ppm) in CD3CN: 34.57, 38.27; 125.78; 126.71; 128.15; 129.09; 130.69; 136.47; 169.90. IR (KBr, cm−1): 2929, 2515, 1619, 1394. ESI−-MS (CH3OH): m/z: 180.2 [M-H]−, (M = C9H11NOS, 181.25).
N-(2-Mercaptophenyl)acetamide, 9
This compound was synthesized by reducing the corresponding disulfide, 7 (1.1 g, 3.31 mmoles), following the procedure described for the synthesis of 5 with NaBH4 (0.51 g, 13.4 mmoles) in THF/EtOH (16 ml/16 ml). Yield, 83% (0.92 g, 5.5 mmoles). NMR (1H, δ, ppm) in CD3CN: 2.53 (s, 3H); 7.11 (t, 1H, J = 7.3 Hz); 7.22 (t, 1H, J = 7.3Hz); 7.63 (d, 1H, J = 7.4Hz); 7.72 (d, 1H, J = 7.4 Hz). NMR (13C, δ, ppm) in CD3CN: 22.13; 122.45; 122.91; 125.53; 126.73; 136.56; 154.23; 168.09. IR (KBr, cm−1): 3235, 2939, 2546, 1640, 1577, 1528, 1437, 1437, 1298, 1263, 1077, 752. ESI−-MS (CH3CN): m/z: 166 [M-H]−, (M = C8H9NOS, 167).
N-(2-Mercaptophenyl) N-methyl acetamide, 10
It was synthesized by reducing the corresponding disulfide, 8 (1.5 g, 4.16 mmoles), by following the procedure described for the synthesis of 5 using NaBH4 (0.64 g, 16.84 mmoles) in THF/EtOH (20 ml/20 ml) media. Yield, 95% (1.43 g, 7.90 mmoles). NMR (1H, δ, ppm) in D2O/(CD3)2SO: 3.05 (s, 3H); 4.19 (s, 3H); 7.67 (t, 1H, J = 7.0 Hz); 7.77 (t, 1H, J = 7.2Hz); 7.97 (d, 1H, J = 7.4 Hz); 8.08 (d, 1H, J = 7.4 Hz). NMR (13C, δ, ppm) in D2O/(CD3)2SO: 18.07; 37.31; 117.79; 125.16; 129.99; 131.14; 143.07; 177.55. IR (KBr, cm−1): 2415, 1662, 1512, 1462, 1443, 760. ESI+-MS (CH3CN): m/z: 363.29 [2M+H]-, (M = C9H11NOS, 181.06).
Tp*MoO2(S-o-MeNHCOC6H4), 11
A mixture of thiol 5 (0.39g, 2.34 mmoles) and Et3N (1 ml, 7.2 mmoles) in CH2Cl2 (15 ml) was added to the suspension of Tp*MoO2Cl (1.10 g, 2.38 mmoles) in CH2Cl2 (25 ml) at the room temperature and the reaction mixture was stirred for 6 h. Solvent was removed under vacuum and the brown solid residue was chromatographed on silica gel using a mixture of MeCN/toluene (1:4). The first brown band was collected and the solvent was evaporated. Yield, 25% (0.35 g, 0.59 mmoles). NMR (1H, δ, ppm) in CDCl3: 2.36 (s, 3H); 2.41 (s, 6H); 2.61 (s, 3H); 2.63 (s, 6H); 2.90 (d, 3H, J = 4.3Hz); 5.86 (s, 3H); 6.62 (m, 1H); 7.11 (t, 1H, J = 7.3 Hz); 7.44 (t, 1H, J = 7.5); 7.73 (d, 1H, J = 7.2); 8.02 (d, 1H, J = 8.4 Hz). NMR (13C, δ, ppm) in (CD)3SO: 12.52; 12.80; 15.09; 15.25, 26.70; 107.34; 107.53; 125.39; 129.23; 130.15; 136.57; 136.95; 140.54; 144.79; 147.2; 153.26; 154.44; 168.95. ESI+-MS (CH3CN+0.05%TFA): m/z: 616 [M+Na]+, (M = C23H30O3N7SBMo, 593).
Tp*MoO2(S-o-Me2NCOC6H4), 12
This complex was synthesized using a similar procedure described for the synthesis of 11 using Tp*MoO2Cl (1.27 g, 2.74 mmoles), thiol 6 (0.51 g, 2.81 mmoles), and Et3N (1.16 ml, 8.4 mmoles) in CH2Cl2 (45 ml). The reaction mixture was stirred for 18h. The brown liquid was evaporated to dryness and redissolved in 1:1 mixture of MeCN and toluene and loaded in the silica column. A gradient of MeCN and toluene starting from 10% (MeCN in toluene) was used for purification. Yield, 28% (0.47 g, 0.77 mmoles). NMR (1H, δ, ppm) in CDCl3: 2.36 (s, 6H); 2.39 (s, 3H); 2.65 (s, 9H); 2.83 (s, 3H); 3.03 (s, 3H); 5.86 (m, 3H); 7.15–7.26 (m); 7.42 (m, 1H); 8.1 (d, 1H, J = 7.5). NMR (13C, δ, ppm) in (CD)3SO: 12.95; 13.02; 16.04; 34.80, 38.40; 51.20; 107.44; 124.89; 126.88; 128.75; 129.36; 133.04; 140.50; 169.50. ESI+-MS (CH3CN+0.05%TFA): m/z: 608 [M+H]+, (M = C24H32O3N7SBMo, 607).
Tp*MoO2(S-o-MeCONHC6H4), 13
This complex was synthesized using a similar procedure described for the synthesis of 11 using Tp*MoO2Cl (0.80 g, 1.73 mmoles), thiol 7 (0.36 g, 1.80 mmoles), and Et3N (0.75 ml, 5.4 mmoles) in CH2Cl2 (35 ml). The reaction mixture was stirred for 7h. Solvent was removed at a reduced pressure and the residue was chromatographed on silica gel using a mixture of MeCN/toluene (1:4). The first brown band was collected and the solvent was evaporated to give a solid compound. Yield, 30% (0.31 g, 0.52 mmoles). NMR (1H, δ, ppm) in CDCl3: 2.16 (s, 3H); 2.36 (s, 3H); 2.42 (s, 6H); 2.56 (s, 3H); 2.69 (s, 6H); 5.86 (s, 1H); 5.90(s, 2H); 7.08 (t, 1H, J = 7.3 Hz); 7.18 (t, 1H, J = 7.3); 7.83 (d, 1H, J = 7.3); 8.20 (s, 1H); 8.30 (d, 1H, J = 7.4 Hz). NMR (13C, δ, ppm) in CDCl3: 12.50; 12.76; 15.19; 24.87; 30.82; 107.33; 107.62; 120.01; 123.56; 127.26; 131.56; 134.83; 137.66; 144.96; 147.16; 153.23; 154.26; 168.22. ESI+-MS (CH3CN+0.05%TFA): m/z: 594 [M+H]+, (M = C23H30O3N7SBMo, 593).
Tp*MoO2(S-o-MeCONMeC6H4), 14
This complex was synthesized using a similar procedure described for the synthesis of 12 using Tp*MoO2Cl (1.0 g, 2.16 mmoles), thiol 10 (0.35 g, 1.93 mmoles), and Et3N (0.80 ml, 5.8 mmoles) in CH2Cl2 (40 ml). The reaction mixture was stirred for overnight. Solvent was removed at reduced pressure and the residue was chromatographed on silica gel using a mixture of MeCN/toluene (1:4). The first brown band was collected and the solvent was evaporated resulting in a solid brown compound. Yield, 18% (0.24 g, 0.39 mmoles). NMR (1H, δ, ppm) in: δ = 1.83 (s, 3H); 2.36 (s, 3H); 2.40 (s, 6H); 2.60 (s, 6H); 2.62 (s, 3H); 3.18 (s, 3H); 5.86–5.92 (m, 3H); 7.22 (d, 1H, J = 7.0 Hz); 7.35 (t, 1H, J = 7.5); 7.45 (t, 1H, J = 7.5); 7.62 (d, 1H, J = 7.6 Hz). NMR (13C, δ, ppm) in (CD)3SO: 7.52; 18.60; 22.05; 58.70, 115.20; 116.10, 140.15; 142.50, 143.22; 150.64; 163.20; 163.92; 164.45; 171.80; 172.50.
Results and Discussion
Syntheses and Characterization
The functionalized thiol ligands used in this investigation were synthesized by reducing preformed disulfides as outlined in Scheme 1. 2-mercaptobenzoic acid was oxidized to 1 using I2 in ethanol.1 Disulfides 3 and 4 were synthesized by modifying a literature procedure,31 which included first reacting 1 with oxalyl chloride to prepare the acid chloride, 2, followed by its reaction with MeNH2 or Me2NH. Compound 2 was found to be sensitive to moisture and readily hydrolyzed to 1 upon contact with moisture. Disulfides 3 and 4 were obtained in good yields and were stable in air. Disulfides were reduced to thiol ligands using NaBH4 in THF/ethanol media. Thiols were found to be moderately sensitive towards air and methyl sulfoxide.
Scheme 1.
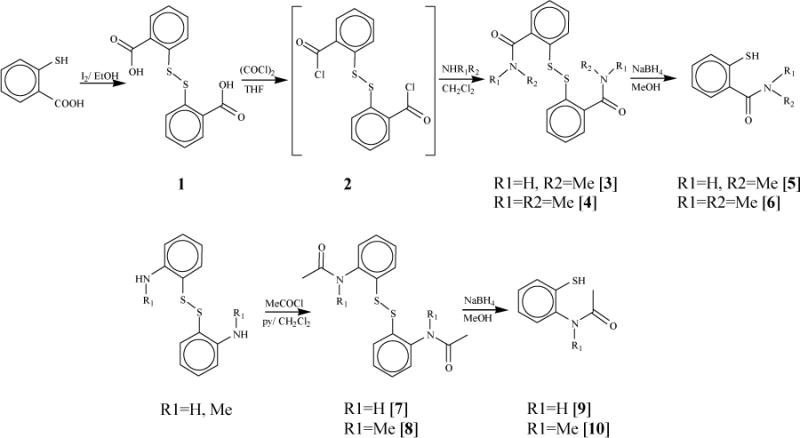
Ligands were characterized by solution phase 1H and 13C NMR spectroscopy and infrared spectroscopy. Due to the low solubility of thiols in chloroform, the NMR spectra were recorded in CD3CN with the exception of compound 10 which was recorded in (CD3)2SO. The aromatic signals of thiols 5, 6, 9, and 10 show downfield shifts compared to its corresponding disulfides 3, 4, 8, and 9 respectively; however, methyl protons show an opposite upfield shift in thiols compared to the disulfides. The thiols also exhibit a characteristic strong infrared stretch around 2530 cm−1 for S-H group.
Scheme 2 represents the synthetic route to dioxo-MoVI complexes possessing ortho-substituted thiophenol ligands, which follows the ligand substitution reaction similar to Tp*MoO2(SPh). Upon addition of a thiol/Et3N solution into a suspension of Tp*MoO2Cl in CH2Cl2, the reaction mixture changes color from yellow to brown. The progress of the reactions was monitored by thin layer chromatography. In general, however, the reactions took longer time for completion. Syntheses of complexes 11 and 13 took about 6–7 h, while their methylated partners 12 and 14 required overnight for the reaction to be completed. In all four cases, multiple spots on the TLC plate were observed indicating side reactions and/or decomposition. Complexes 11–14 were successfully purified by column chromatography over silica gel using a solvent gradient of MeCN in toluene. Complexes 12 and 14, were further purified by crystallization using toluene and hexane. The molybdenum complexes were found to be sensitive in solution and spontaneously degrade releasing the thiophenolo ligand. The sensitivity poses a challenge towards chromatographic separation and contributes to the lower yields. We were unable to obtain suitable quality crystals for structural studies. In fact in most cases we obtained dimeric molybdenum complexes without any thiols coordinated even when we started with spectroscopically (NMR) pure solutions of the complexes. This problem has also resulted in less than optimal elemental analysis.
Scheme 2.
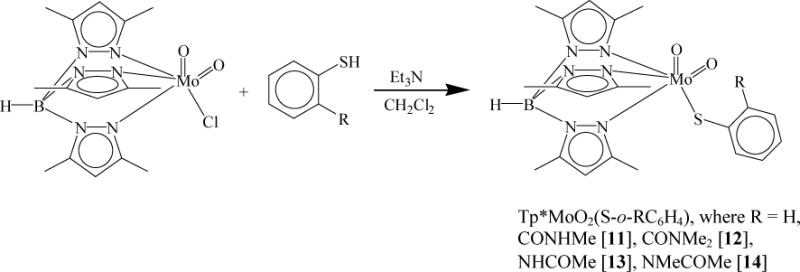
1H NMR Spectroscopy
The 1H NMR spectra of molybdenum complexes have a 2:1 ratio for the three-pyrazole methyl groups indicating the Cs local symmetry in solution.28,30 The amide NH signal in 11 appeared at 6.68 ppm in chloroform-d, which is about 0.52 ppm downfield compared to the NH signal in corresponding disulfide 3 (6.16 ppm in chloroform). Similarly, the amide NH signal in 13 appeared at 8.20 ppm that is shifted about 0.30 ppm downfield compared to corresponding disulfide, 7.11 These shifts are consistent with the presence of H-bond in 11 and 13 as described for other metal complexes.20–25 Additional support comes from the 1H-NMR spectra of the complexes containing amide –NHCO- and N-methylated –NMeCO- moieties. Figure 3 shows 1H NMR chemical shifts of aromatic protons of thiophenolato ligand in the molybdenum-complexes. The doublet resonances (represented as red bars) are due to the protons next to the sulfur and the amide substituent, which show upfield shifts upon N-methylation, e.g., two doublets (a1 and d1) of thiophenol ligand in 11 move from 7.73 ppm and 8.02 ppm (peak separation ~0.29 ppm) to 7.39 ppm (c1) and 7.67 ppm (b1) (peak separation ~0.28 ppm) in 12. Similar shifts in doublets (a2 and d2) are also observed from 13 to 14. The NMR chemical shifts are primarily due to electronic effects of substituents and the presence of H-bonding. The substituents containing amide functionality and the corresponding N-methylated species have similar electronic coefficients32 and thus are unlikely to give such a large shift of the NMR signals. Thus, we propose the presence of intramolecular H-bonding in 11 and 13, which is consistent with solution IR spectra (vide infra). The formation of NH⋯S hydrogen bond can decrease the electron density on the sulfur atom, which results in a downfield shift of ring protons compared to N-methylated complexes where there is no H-bonding present. A larger shifts in the pairs of doublets and triplets in 13 to 14 indicate stronger H-bonding compared to 11, which is again consistent with solution IR-spectra (vide infra).
Figure 3.
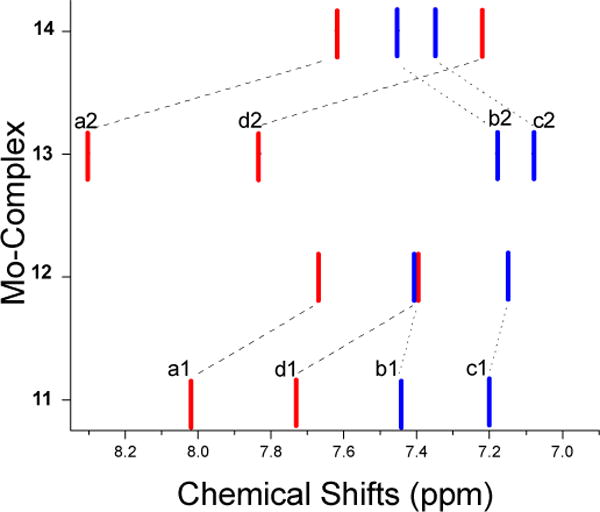
1H NMR chemical shifts of the thiophenol phenyl-ring in Mo-complexes (blue lines represent triplet resonances whereas red lines represent doublets). All spectra were collected in chloroform-d at room temperature in freshly prepared solutions.
IR Spectroscopy
Infrared spectra of the dioxo-Mo(VI) complexes have two strong bands due to the cis-MoO2 unit around 924 cm−1 and 893 cm−1 assigned as symmetric and asymmetric vibrational modes, respectively. In addition, a sharp B-H stretch is present at 2545 cm−1 in all the molybdenum complexes (Table 1). IR bands for amide ν(N-H) and ν(C=O) for 11 and 13 are summarized in Table 2, which also lists similar bands for the corresponding thiols and disulfides. Figure 4 represents the amide region ν(N-H) and ν(C=O) in the solid-state IR spectra of complex, 11 and corresponding thiol 5 and disulfide 3. Complex 11 exhibits broad N-H and C=O bands indicating poor crystal packing. Thiol 5 exhibits slightly larger shift in NH band compared to the disulfide 3, which is consistent with 2-tBuNHCOC6H4SH (ν(N-H) ~ 3303 cm−1) and (S-2-tBuNHCOC6H4)2 (ν(N-H) ~ 3294 cm−1).24 The thiol ligands of type-A have been proposed to form a SH⋯O=C H-bond, whereas the thiolato form of the ligand harbors a NH⋯S H-bonding.24 In the case of thiol 9, the ν(N-H) vibration appears at 3202 cm−1 and for the corresponding disulfide 7 the ν(N-H) band appears at ~3238 cm−1, opposite to the type A motif described previously. It should be noted that thiol 9 is likely to form intramolecular NH⋯S hydrogen bonding.23
Table 1.
Spectroscopic Properties of Molybdenum Complexes
| Selected IR Bands in KBr pellet, cm−1 | Electronic Spectra in MeCN γ, nm (ɛ, M−1cm−1) |
Redox potential,a E1/2, V (ΔEp, V) |
||
|---|---|---|---|---|
| ν(MoO2) | ν(B-H) | |||
| 11 | 893, 924 | 2549 | 258 (12980); 403 (2825); 517 (sh, 465) | −1.04 (0.23) |
| 12 | 890, 924 | 2553 | 252 (3580); 407 (970); 520 (sh, 125) | −1.14 (0.24) |
| Tp*MoO2(SPh) | 894, 921 | 2538 | 255 (13645); 398 (2350); 519 (sh, 397) | −1.11 (0.12) |
| 13 | 896, 925 | 2548 | 254 (15945); 396 (2785); 504 (sh, 825) | −1.11 (0.12) |
| 14 | 895, 923 | 2549 | 262 (4140); 409 (1225); 526 (sh, 120) | −1.30 (0.15) |
In MeCN, room temperature. Scan Rate: 0.1V/s. Pt-disk working and reference electrodes and a Pt-wire auxiliary electrode; 0.2M NBu4ClO4 of supporting electrolyte.
Table 2.
IR Bands of Amine and Carbonyl Stretches
| Disulfide | Thiol | Molybdenum Complexes | ||||||
|---|---|---|---|---|---|---|---|---|
|
| ||||||||
| 3 | 7 | 5 | 9 | 11 | 13 | |||
| KBra | KBra | NaClb | NaClb | KBra | CDCl3c | KBra | CDCl3c | |
| ν(N-H) | 3284 | 3238 | 3315 | 3202 | 3313 | 3325, 3452 | 3375 | 3370, 3611 |
| ν(C=O) | 1634 | 1662 | 1620 | 1662 | 1650 | 1650 | 1700 | 1686 |
KBr pellet
NaCl plate
chloroform-d solution.
Figure 4.
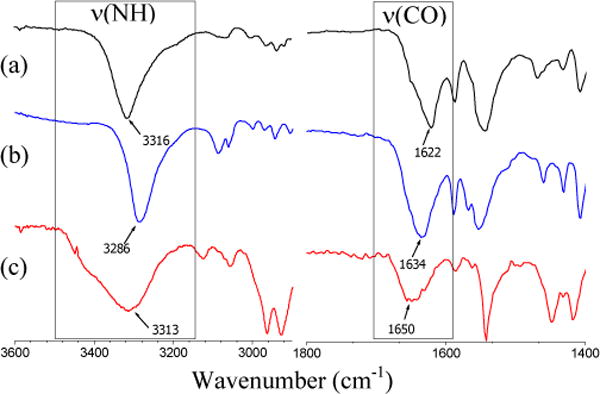
IR Spectra of (a) thiol 5 (on NaCl plate), (b) disulfide 3 (in KBr pellet), and (c) complex 11 (in KBr pellet).
The presence of intramolecular H-bonding in Mo-complexes was examined in solutions of chloroform-d. Table 2 also summarizes the vibrational frequencies of ν(N-H) and ν(C=O) in the Mo-complexes in solid and in chloroform-d. Both 11 and 13 exhibit two ν(N-H) amide stretching bands in solution compared to single band in solid state indicating the presence of hydrogen-bonded ν(N-Hbound) and non-hydrogen-bonded ν(N-Hfree) groups as shown in Figure 5. In solution state, 11 exhibits two distinct N-H bands at 3325 cm−1 and 3452 cm−1 while in solid state only one broad N-H band at 3313 cm−1 appears. Thus, in solution the two vibrations are separated by 127 cm−1. Similarly, for 13, the N-H vibration at 3375 cm−1 in the solid state, appears as two bands at 3370 cm−1 and 3611 cm−1 in solution, a separation of 241 cm−1. The extent of dissociation into ν(N-Hbound) and ν(N-Hfree) is determined by integrating the intensities of the ν(N-H) peaks of 11 and 13 in chloroform-d. Thus, the N-H⋯S hydrogen bonds in 11 and 13 are dissociated ~ 26% and ~11%, respectively to the ν(N-Hfree) forms. Complex 13 shows larger separation between ν(N-Hbound) and ν(N-Hfree) compared to 11, by 114 cm−1, indicating stronger N-H⋯S hydrogen bonding in 13. This is consistent with the 1H NMR data described above.
Figure 5.

Comparison of IR spectra in solid and liquid phases: (a) 11 in KBr pellet, (b) 11 in chloroform-d; (c) 13 in KBr pellet, and (d) 13 in chloroform-d. Liquid spectra were recorded using a CaF2 flow through cell. (Solution path length = 0.1 mm and concentration ~ 20 mM).
UV-visible spectroscopy
UV-visible spectra of dioxo complexes were recorded in MeCN at the room temperature (Figure 6) and the characteristic band positions are listed in Table 1. A band around 400 nm is due to the S → Mo charge transfer transition.33 Interestingly, from 13 to 14, a red shift of 13 nm was observed due to the absence of intramolecular H-bonding from thiophenolato ligand. Similar electronic effects has also been observed for complexes, 11, 12, and 14, where a blue shift was observed from the electron donating ligand (NMeCOMe, 409 nm) to the electron-withdrawing group (CONHMe, 403 nm). A shoulder of low intensity around 515 nm is found to be more sensitive for electronic effects. From 13 to 14 the band position shifts from 504 nm to 526 nm indicating the involvement of intramolecular H-bonding in 13 as discussed earlier. From 11 to 14 the band showed a positive shift of 13 nm. A strong charge transfer transition around 260 nm can be assigned to the ligand-to-ligand change transfer. In addition, the intensity of the low-energy transition (i.e., ~500 nm) for complexes with H-bonding (11 and 13), is higher than that in the N-methylated complexes (12 and 14). These observations indicate that NHCOMe induces stronger H-bonding than CONHMe.
Figure 6.
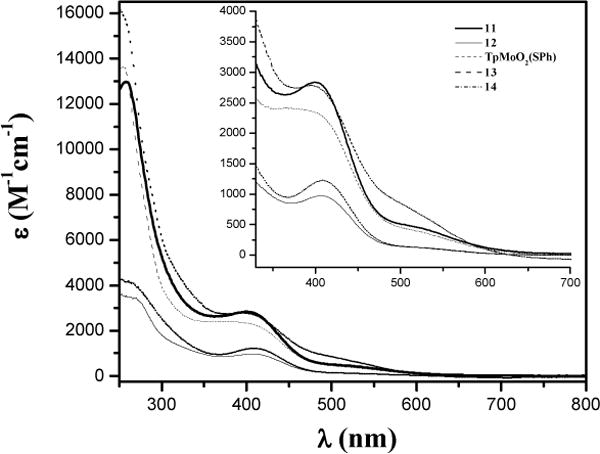
Electronic spectra of Mo-complexes in MeCN at room temperature.
Electrochemistry
The electrochemical behavior of the Mo-complexes, 11–14, was studied by cyclic voltammetry along with Tp*MoO2(SPh) and the redox potentials are summarized in Table 1. Cyclic voltammograms for all dioxo complexes are shown in Figure 7, which show one-electron quasi-reversible redox couple, assigned to MoV/MoVI process.30,34 No other reductive response was observed within the solvent window. Consistent with the diffusion controlled process the peak currents follow linear relation with the square root of the scan rate while the half-wave potentials remain independent. Interestingly, the ratios of the peak currents are significantly different from 1, indicating irreversible nature of the redox couple. Consequently, no attempt was made to generate the corresponding Mo(V) complexes.
Figure 7.
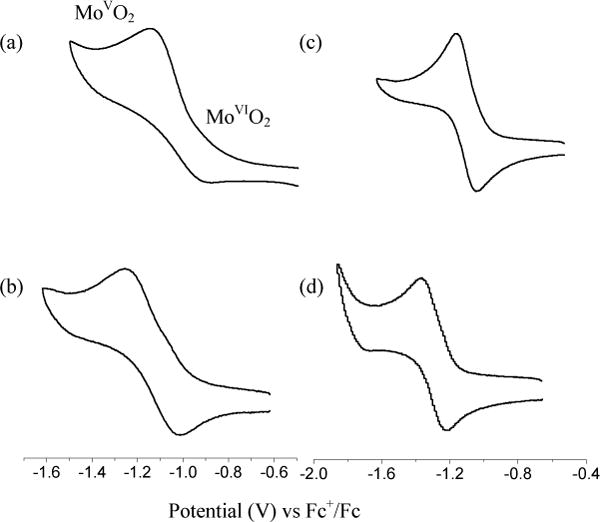
Cyclic voltammograms of (a) 11, (b) 12, (c) 13, and (d) 14 in MeCN at room temperature. Scan rate: 0.1V/s
The unsubstituted dioxo-Mo(VI) complex, Tp*MoO2(SPh) also exhibits an one-electron redox couple at −1.11 V vs Fc+/Fc. Compared to Tp*MoO2(SPh), the redox potential in complex, 11 is shifted by 70 mV in the positive direction, while in complex 13 it is invariant. We interpret the results as 13 has two competing factors influencing the redox potential – S•••H(N) interaction that shifts the potential in the positive direction and the electron donating effect of the NHCOCH3 group that shifts the potential towards the negative direction. Interestingly, in the case of [MoVO(S-o-R′CONHC6H4)4]− the Mo(V/IV) couple is shifted towards the positive direction by ~88 mV per ligand with respect to the corresponding N-methylated complex. Because each ligand can provide one S•••H(N) interaction, 88 mV serves as an estimate for the magnitude of the shift. In the present case, we observe a larger difference in the redox potentials between the compounds with methylated and non-methylated ligands. Thus, redox potentials in 11 and 12 exhibit a difference of 100 mV, while the redox potentials in 13 and 14 are separated by 190 mV. The larger change in 13 compared to 11 indicates higher strength of H-bond in the complex, which is consistent with the IR and 1H NMR analyses. Complex 11 is easier to reduce than 13, even though CONHMe group, as such is an electron withdrawing and NHCOMe is an electron-donating substituent. The counter intuitive results reflect the strength of hydrogen bonding.
Conclusion
Dioxo-MoVI complexes containing ortho-substituted thiophenolato ligands have been synthesized and characterized by variety of spectroscopic techniques. Infrared and 1H NMR spectra support the presence of H-bonding in 11 and 13 with a higher strength of H-bonding in 13. UV/visible spectra exhibit higher extinction coefficients for complexes harboring intramolecular hydrogen bonding. Electrochemistry of 13 shows a large positive shift in the redox potential compared to corresponding the N-methylated 14. Thus, intramolecular hydrogen bonding with the thiolato sulfur can influence the properties of the metal center. Importantly, the extent of the influence is dependent on the nature of the hydrogen bonding units present. Based on the results described in here and coupled with those in the literature it is provocative to suggest that the hydrogen bonding may be less stable in higher oxidation state, though it may have a great influence in the functioning of molybdenum enzymes.
Acknowledgments
Financial support from the National Institutes of Health (GM61555) and an equipment grant from the National Science Foundation (CHE 0614785) are gratefully acknowledged. We acknowledge Ms. Tina Bhatnagar for preliminary experiments and Ms Eranda Perera for valuable experimental assistance and discussion.
References
- 1.Stryer L. Biochemistry. 4. W.H. Freeman; NewYork: 1995. [Google Scholar]
- 2.Bertini I, Gray HB, Stiefel EI, Valentine JS. Biological Inorganic Chemistry, Structure and Reactivity. University Sceince Books; Sausalito, CA: 2006. [Google Scholar]
- 3.Kisker C, Schindelin H, Pacheco A, Wehbi WA, Garrett RM, Rajagopalan KV, Enemark JH, Rees DC. Cell. 1997;91:973–83. doi: 10.1016/s0092-8674(00)80488-2. [DOI] [PubMed] [Google Scholar]
- 4.Schrader N, Fischer K, Karsten K, Mendel RR, Schwarz G, Kisker C. Structure. 2003;11:1251–1263. doi: 10.1016/j.str.2003.09.001. [DOI] [PubMed] [Google Scholar]
- 5.Karakas E, Wilson HL, Graf TN, Xiang S, Jaramillo-Busquets S, Rajagopalan KV, Kisker C. J Biol Chem. 2005;280:33506–33515. doi: 10.1074/jbc.M505035200. [DOI] [PubMed] [Google Scholar]
- 6.Fischer K, Barbier GG, Hecht HJ, Mendel RR, Campbell WH, Schwarz G. Plant Cell. 2005;17:1167–1179. doi: 10.1105/tpc.104.029694. [DOI] [PMC free article] [PubMed] [Google Scholar]
- 7.Burgmayer SJN. In: Dithiolenes in Biology in Dithiolene Chemistry Synthesis, Properties, and Applications. Stiefel EI, Karlin KD, editors. Vol. 52. 2004. pp. 491–537. [Google Scholar]
- 8.Conry RR, Tipton AA. J Biol Inorg Chem. 2001;6:359–366. doi: 10.1007/s007750100207. [DOI] [PubMed] [Google Scholar]
- 9.Maiti R, Nagarajan K, Sarkar S. J Mole Struc. 2003;656:169–176. [Google Scholar]
- 10.Cooney JJA, Carducci MD, McElhaney AE, Selby HD, Enemark JH. Inorg Chem. 2002;41:7086–7093. doi: 10.1021/ic025856e. [DOI] [PubMed] [Google Scholar]
- 11.Baba K, Okamura T, Suzuki C, Yamamoto H, Yamamoto T, Ohama M, Ueyama N. Inorg Chem. 2006;45:894–901. doi: 10.1021/ic051493h. [DOI] [PubMed] [Google Scholar]
- 12.Ueyama N, Okamura T, Nakamura A. J Am Chem Soc. 1992;114:8129–8137. [Google Scholar]
- 13.Baba K, Okamura T, Yamamoto H, Yamamoto T, Ohama M, Ueyama N. Chem Lett. 2005;34:44–45. [Google Scholar]
- 14.Baba K, Okamura T, Suzuki C, Yamamoto H, Yamamoto T, Ohama M, Ueyama N. Inorg Chem. 2006;45:894–901. doi: 10.1021/ic051493h. [DOI] [PubMed] [Google Scholar]
- 15.Huang J, Ostrander RL, Rheingold AL, Leung Y, Walters MA. J Am Chem Soc. 1994;116:6769–6776. [Google Scholar]
- 16.Baba K, Okamura T, Yamamoto H, Yamamura T, Ohama M, Ueyama N. Inorg Chem. 2006;45:8365–8371. doi: 10.1021/ic060719t. [DOI] [PubMed] [Google Scholar]
- 17.Representative references include:; (a) Ueyama N, Nishikawa N, Yamada Y, Okamura T, Nakamura A. J Am Chem Soc. 1996;118:12826–12827. [Google Scholar]; (b) Ueno T, Ueyama N, Nakamura A. J Chem Soc Dalton Trans. 1996:3859–3863. [Google Scholar]; (c) Ueyama N, Nishikawa N, Yamada Y, Okamura T, Oka S, Sakurai H, Nakamura A. Inorg Chem. 1998;37:2415–2421. [Google Scholar]; (d) Tsai F-T, Chiou S-J, Tsai M-C, Tsai M-L, Huang H-W, Chiang M-H, Liaw W-F. Inorg Chem. 2005;44:5872–5881. doi: 10.1021/ic0505044. [DOI] [PubMed] [Google Scholar]
- 18.(a) Chiou SJ, Riordan CG, Rheingold AL. Proc Nat Acad Sci U.S.A. 2003;100:3695–3700. doi: 10.1073/pnas.0637221100. [DOI] [PMC free article] [PubMed] [Google Scholar]; (b) Smith JN, Shirin Z, Carrano CJ. J Am Chem Soc. 2003;125:868–869. doi: 10.1021/ja029418i. [DOI] [PubMed] [Google Scholar]; (c) Smith JN, Hoffman JT, Shirin Z, Carrano CJ. Inorg Chem. 2005;44:2012–2017. doi: 10.1021/ic048630f. [DOI] [PubMed] [Google Scholar]; (d) Sun WY, Zhang KB, Yu J. J Chem Soc Dalton Trans. 1999:795–798. [Google Scholar]; (e) Morlok MM, Janak KE, Zhu G, Quarless DA, Parkin G. J Am Chem Soc. 2005;127:14039–14050. doi: 10.1021/ja0536670. [DOI] [PubMed] [Google Scholar]
- 19.Sun WY, Shi XF, Zhang L, Hu J, Wei JH. J Inorg Biochem. 1999;76:259–263. [Google Scholar]
- 20.Ueyama N, Taniuchi K, Okamura T, Nakamura A, Maeda H, Emura S. Inorg Chem. 1996;35:1945–1951. [Google Scholar]
- 21.Okamura T, Takamizawa S, Ueyama N, Nakamura A. Inorg Chem. 1998;37:18–28. doi: 10.1021/ic970640b. [DOI] [PubMed] [Google Scholar]
- 22.Okamura T, Ueyama N, Nakamura A, Ainscough EW, Brodie AM, Waters JM. J Chem Soc Chem Commun. 1993:1658–1660. [Google Scholar]
- 23.Kato M, Okamura T, Yamamoto H, Ueyama N. Inorg Chem. 2005;44:1966–1972. doi: 10.1021/ic0490167. [DOI] [PubMed] [Google Scholar]
- 24.Kato M, Kojima K, Okamura T, Yamamoto H, Yamamura T, Ueyama N. Inorg Chem. 2005;44:4037–4044. doi: 10.1021/ic0481780. [DOI] [PubMed] [Google Scholar]
- 25.Okamura T, Iwamura T, Yamamoto H, Ueyama N. J Organomet Chem. 2007;692:248–256. [Google Scholar]
- 26.Zuppiroli G, Perchard C, Baron MH, de Loze C. J Mol Struct. 1980;69:1–16. [Google Scholar]
- 27.Huang J, Ostrander RL, Rheingold AL, Walters MA. Inorg Chem. 1995;34:1090–1093. [Google Scholar]
- 28.Roberts SA, Young CG, Kipke CA, Cleland WE, Jr, Yamanouchi K, Carducci MD, Enemark JH. Inorg Chem. 1990;29:3650–6. [Google Scholar]
- 29.Ueyama N, Okamura T, Yamada Y, Nakamura A. J Org Chem. 1995;60:4893–4899. [Google Scholar]
- 30.Sengar RS, Basu P, P Inorg Chim Acta. 2007;360:2092–2099. doi: 10.1016/j.ica.2006.10.041. [DOI] [PMC free article] [PubMed] [Google Scholar]
- 31.Gryff-Keller A, Szczeciski P. Mag Res Chem. 1985;23:655–658. [Google Scholar]
- 32.Sengar RS, Nemykin VN, Basu P. New J Chem. 2003;27:1115–1123. [Google Scholar]
- 33.Izumi Y, Glaser T, Rose K, McMaster J, Basu P, Enemark JH, Hedman B, Hodgson KO, Solomon EI. J Am Chem Soc. 1999;121:10035–10046. [Google Scholar]
- 34.Xiao Z, Bruck MA, Doyle C, Enemark JH, Grittini C, Gable RW, Wedd AG, Young CG. Inorg Chem. 1995;34:5950–62. doi: 10.1021/ic961983x. [DOI] [PubMed] [Google Scholar]


