

Abstract
Many of our behavioral and physiological processes display daily oscillations that are under the control of the circadian clock. The core molecular clock network is present in both the brain and peripheral tissues and is composed of a complex series of interlocking transcriptional/translational feedback loops that oscillate with a periodicity of ∼24 h. Recent evidence has implicated NAD+ biosynthesis and the sirtuin family of NAD+-dependent protein deacetylases as part of a novel feedback loop within the core clock network, findings which underscore the importance of taking circadian timing into consideration when designing and interpreting metabolic studies, particularly in regard to sirtuin biology. Thus, this chapter introduces both in vivo and in vitro circadian methods to analyze various sirtuin-related endpoints across the light–dark cycle and discusses the transcriptional, biochemical, and physiological outputs of the clock.
Keywords: Circadian, Clock, Metabolism, Constant darkness, Synchronization, NAD, Sirtuins
1 Introduction
While the French astronomer JeanJacques d'Ortous de Mairan first noted that the diurnal leaf movements of the Mimosa plant persisted in constant darkness in the 1700s, it was not until more than 200 years later that it became established that circadian rhythms were driven by an internal endogenous circadian clock, rather than being just passive responses to a light–dark cycle. The highly conserved nature of the clock across diverse organisms, including cyanobacteria, fungi, plants, Drosophila, and mammals, suggests an evolutionary advantage to being able to synchronize behavioral and physiological processes to daily environmental cues in order to optimize energy homeostasis and enhance survival.
Many of our behavioral and physiological processes, including sleep–wake cycles, locomotor activity, hormone secretion, body temperature, and metabolism, display daily oscillations. Epidemiologic studies have revealed that many acute catastrophic events, including heart attacks, pulmonary edema, and hypertensive crises, tend to occur at specific times of day [1]. Furthermore, there is an increased risk of obesity and cardiovascular disease in shift workers, who have altered patterns of sleep/wake and fasting/feeding cycles, highlighting the close link between circadian rhythms and metabolism [2–4]. Other physiological processes, such as glucose metabolism, vary during the day. For example, humans are more glucose tolerant in the morning than in the evening, correlating with enhanced insulin sensitivity and insulin secretion in the early morning hours [5–10]. Of note, loss of rhythms in glucose metabolism is associated with the development of metabolic diseases such as type 2 diabetes [11, 12].
Although the main “driver” of circadian rhythms resides within the suprachiasmatic nucleus (SCN) of the hypothalamus in the brain, the circadian clock network is also present within most, if not all, peripheral tissues. The SCN neurons receive light input from the retinohypothalamic tract and synchronize peripheral tissue clocks through both neuronal and hormonal connections. The core molecular machinery underlying circadian rhythms within both the SCN and peripheral tissues has recently come to light through a combination of molecular and genetic studies. The core clock network consists of interwoven positive and negative transcription–translation feedback loops that function as a molecular oscillator with near 24 h precision (reviewed in ref. 13). The positive limb of the clock is composed of the basic helix-loop-helix transcription factors CLOCK and BMAL1, which heterodimerize and activate transcription of downstream targets, including the Period (Perl, 2, 3) and Cryptochrome (Cry 1, 2) genes. PER and CRY proteins then heterodimerize, translocate back to the nucleus, and bind and inhibit the activity of CLOCK/BMAL1, thereby repressing their own transcription. Additional modifying components of the core clock network have been identified, including the casein kinases I epsilon and delta, which phosphorylate PER and CRY, ultimately leading to their degradation, and the orphan nuclear receptors REV-ERBα and ROR1α, both of which are transactivated by CLOCK/BMAL1, and in turn repress and activate Bmall transcription, respectively (see Fig. 1).
Fig. 1.
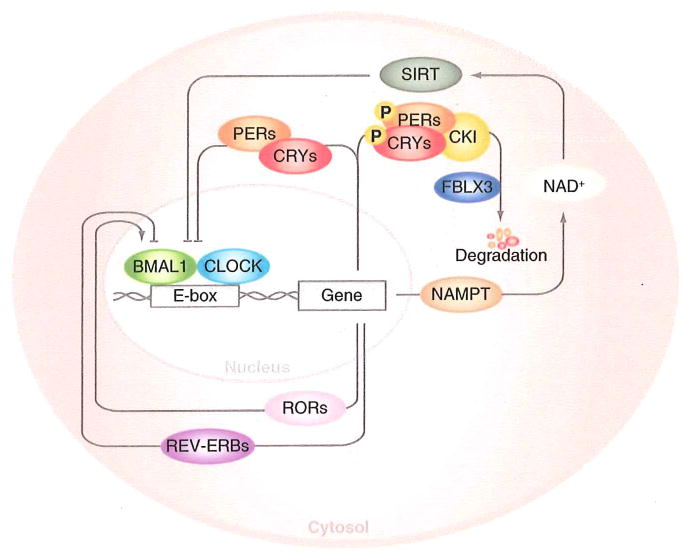
Molecular overview of core clock network. The core molecular clock network consists of a series of positive and negative transcription/translation feedback loops. The positive limb consists of CLOCK/BMAL1, which heterodimerizes and transactivates expression of downstream target genes containing an E-box in their promoters, including the Period, Cryptochrome, Ror, Rev-erb, and Nampt genes. The PER and CRY proteins multimerize and inhibit the activity of CLOCK/BMAL1, until they are degraded following CKI- and FBLX3-mediated phosphorylation and ubiquitination, respectively. Rhythmic generation of Nampt results in oscillations in NAD+ and SIRT activity, which feeds back to regulate the positive limb of the clock
Of particular interest, several recent studies have demonstrated that NAD+ biosynthesis and the sirtuin family of NAD+-dependent protein deacetylases constitute part of a novel feedback loop within the core clock network [14–17]. CLOCK/BMAL1 directly regulate the expression of the gene encoding the rate-limiting enzyme in NAD+-biosynthesis, nicotinamide phosphoribosyltransferase (NAMPT), in peripheral tissues, and NAD+ levels oscillate across the light-dark cycle. Not only is NAD+ an essential cofactor for metabolic redox reactions, but it is also a substrate for SIRT1, which has been shown to deacetylate and regulate the activity of core clock proteins PER2 and BMAL1 [14, 15]. In addition, both genetic and pharmacologic modulation of NAD+ levels has been shown to alter clock transcriptional activity and circadian behavior and metabolism [18–20], completing a novel metabolic feedback loop within the core clock machinery. The identification of NAMPT and the sirtuin deacetylases as nutrient sensors at the nexus of circadian and metabolic pathways will likely shed additional light on how peripheral tissues coordinate fuel utilization and metabolism with the fasting/feeding and sleep/wake cycles.
Given the relatively recent finding that NAD+ biosynthesis and sirtuin biology are intimately connected to the circadian clock, it is important to keep the time of day in mind when designing sirtuin-related experiments. An interesting anecdote described by Ueli Schibler in his keynote lecture at the conference for the Society for Research of Biological Rhythms [21] demonstrates the significance of the time of day at which experiments are performed—a graduate student who had inherited a former postdoc's project involving DBP (albumin site D-binding protein) struggled for weeks to even detect its presence in liver, until he realized that DBP was essentially undetectable in the early morning hours (the time when he, as a “morning lark,” collected his tissue samples), while it was induced more than 100-fold by the evening (the time when the “night-owl” post-doc collected his samples). While most biological changes are not nearly as dramatic as the 100-fold difference observed in DBP levels throughout the day, even differences as small as twofold throughout the day can contribute to significant variations in experimental outcomes. Further, genomic and proteomic profiling studies have revealed that approximately 5–20% of the transcriptome or proteome displays circadian oscillations in peripheral tissues, while metabolomics studies demonstrate robust oscillations in many critical metabolites, reinforcing the importance of timing in the majority of metabolic processes [22–24]. Together, these observations underscore the importance of taking circadian timing and light cycles into consideration when designing and interpreting metabolic studies, particularly with regard to sirtuin biology. When designing such an experiment, one should ask: Has the appropriate time of day been chosen for the experiment? Have all samples been collected at the same time point? Can we gain additional physiological insight into the process by performing analyses at multiple time points throughout the day? Given the intense focus on mammalian sirtuins in the past several years, the goal of this chapter is to highlight both in vivo and in vitro methods to analyze various endpoints across the light-dark cycle, whether they are transcriptional, biochemical, physiological, or behavioral outputs of the clock. For example, given the role of the sirtuins in multiple metabolic processes, including gluconeogenesis, insulin secretion, and fatty acid oxidation, it will be important to understand the dynamics of how the sirtuins regulate these processes throughout the day at both physiological and molecular levels. Briefly, Subheading 3.1 outlines how to set up in vivo “circadian” studies in which the process of interest is analyzed over the course of 48 h in mice maintained in constant darkness, while Subheading 3.2 describes how to monitor in vivo circadian rhythms of locomotor activity as a behavioral output of the clock. Subheading 3.3 discusses how brief treatment of cultured cells with various compounds synchronizes rhythms of clock gene expression that persist for several days, thereby creating a powerful cell culture-based system to study sirtuin-related processes across the circadian cycle.
2 Materials
2.1 Circadian In Vivo Studies (48 h Constant Darkness Experiment)
C57BL/6J mice, aged 12 weeks (Jackson Labs).
Light-tight circadian cabinets with computer-controlled light–dark cycles.
Red light, red light-equipped room, and/or infrared nightvision goggles.
Standard housing mouse cages.
Dissection equipment (scissors, forceps, etc.).
Eppendorf tubes for tissue collection.
Liquid nitrogen.
2.2 Circadian In Vivo Studies (Locomotor Activity Rhythms)
-
1–3
Same as above.
-
4
Mouse cages equipped with running wheel and microswitch.
-
5
Computer equipped with data acquisition and analysis software.
2.3 Circadian In Vitro Studies
NIH-3T3 MEF cells (ATCC# CRL-1658).
NIH-3T3 MEF cells infected with PER2-LUC-expressing lentivirus [25, 26] or MEFs isolated from PER2-LUC mice [27].
MEF culture medium: Dulbecco's modified Eagle medium (DMEM) w/4.5 g/L glucose, 10% FBS, 4 mM glutamine, 1 mM sodium pyruvate, 100 U/ml penicillin/streptomycin.
3.5 and 10 cm tissue culture dishes.
37 °C incubator (C02-free) with LumiCycle apparatus (Actimetrics).
Luciferin cell culture medium: DMEM (no phenol red) plus 10 % FBS, 10 mM HEPES buffer, 0.035 % (w/v) sodium bicarbonate, 4 mM glutamine, 1 mM sodium pyruvate, penicillin/streptomycin, 0.1 mM luciferin (added immediately before use).
1× sterile PBS.
4 cm glass cover slips.
Sterile vacuum grease.
Forskolin.
Cell scrapers.
1.5 ml Eppendorf tubes for cell collection.
3 Methods
3.1 Measuring Circadian Rhythms In Vivo over the Course of 48 h in Constant Darkness
For a biological process to be classified as circadian, it must display an endogenous, entrainable oscillation of approximately 24 h that is invariant across a wide temperature range. Experimentally, the rhythm must (1) repeat its cycle every 24 h for at least two cycles and (2) persist in the absence of external cues (i.e., constant darkness). Therefore, to determine whether a process is under circadian control, such as whether NAD+ levels are dynamically regulated by the clock, the procedure described below uses tissues that were collected for NAD+ measurement every 4 h over the course of 48 h in mice that have been maintained in constant darkness (12 total collection time points with 4 mice per time point = 48 mice). This approach can be applied to any process of interest, including gene or protein expression profiles, sirtuin activity, or sirtuin-related biochemistry (e.g., acetylation) or physiology (e.g., gluconeogenesis and fatty acid oxidation).
House C57BL/6J mice in light-tight boxes set to a 12:12 light–dark (LD) cycle in a temperature-controlled room (see Notes 1 and 2). Arrange 4 mice per cage in a total of 12 cages, each of which corresponds to 1 of the 12 collection time points. Maintain animals in these conditions for a minimum of 1 week prior to the start of the experiment to allow animals to acclimate to their new surroundings.
Change bedding, food, and water as needed, taking care not to disturb the light conditions, as even brief exposure to altered light conditions can affect the clock (see Note 3).
Switch the light cycle to constant darkness (DD) 36 h prior to the first tissue collection time point, which ensures that a full circadian period has passed without entraining cues (i.e., light), but not so long that all of the individual animals become desynchronized from one another (see Note 4, Fig. 2, and Table 1).
18 h prior to the first collection, remove food from the first set of mice (circadian time 0 (CT0) time point). Other mice are then serially fasted for 18 h prior to each collection time (CT4-CT44) so that each animal experiences the same length of fasting. Since fasting and food consumption are centrally regulated circadian behaviors which in turn regulate sirtuin expression and activity, fasting each mouse minimizes the effect of feeding behavior on sirtuins across the circadian cycle (see Note 5, Fig. 2, and Table 1).
Continue to remove food from mice from subsequent time points every 4 h, taking care not to introduce light during the food removal (see Note 6, Fig. 2, and Table 1).
Thirty-six hours following the switch to DD, remove the first set of 4 mice from the light-tight box and euthanize using C02. Euthanasia should be carried out in complete darkness (with the use of infrared goggles) or in very dim red light. After the mice have been euthanized and the light-box sealed, the lights can be turned on for the dissection (see Note 7).
Dissect desired tissues and collect into the appropriately labeled tubes. Tissues used for NAD+ measurement must be snap-frozen immediately in liquid nitrogen (details of methods to measure NAD+ can be found in elsewhere in this volume). Tissues for RNA and protein analysis of clock, sirtuins, or sirtuin targets can also be collected. Nuclear and mitochondrial fractions can also be collected at this time for further subcellular analysis of sirtuin activity. Continue to collect tissues every 4 h for 48 h (see Notes 8–10).
Fig. 2.
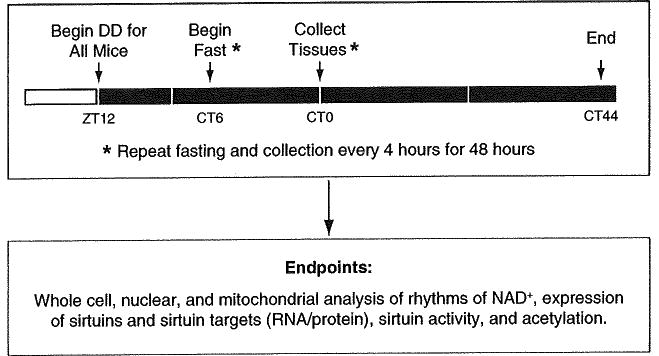
In vivo experimental timeline for 48 h tissue collection in constant darkness. Mice are released into DD at ZT12 in order to coordinate with the start of the normal dark period. Food is removed from the first set of mice at CT6, which is 18 h prior to the first tissue collection (indicated by CTO). The fasting and tissue collection is then repeated every 4 h for 44 h in order to get a full set of samples to be analyzed for rhythms of the process of interest
Table 1. Example experimental setup for 48 h tissue collection in constant darkness.
| Time Point | Remove Food | Tissue Collection | ||
|---|---|---|---|---|
| CT0 | Day 2 | 2pm | Day 3 | 6am |
| CT4 | 6pm | 10am | ||
| CT8 | 10pm | 2pm | ||
| CT12 | Day 3 | 2am | 6pm | |
| CT16 | 6am | 10pm | ||
| CT20 | 10am | Day 4 | 2am | |
| CT24 | 2pm | 6am | ||
| CT28 | 6pm | 10am | ||
| CT32 | 10pm | 2pm | ||
| CT36 | Day 4 | 2am | 6pm | |
| CT40 | 6am | 10pm | ||
| CT44 | 10am | Day5 | 2am | |
3.2 Measuring Circadian Rhythms of Locomotor Activity In Vivo
The most robust and widely used method to examine the function of the endogenous circadian clock in rodents is monitoring behavioral rhythms of locomotor activity. Here, we describe how to monitor rhythms of activity by means of wheel running, a highly precise assessment of locomotor activity given that rodents actively run on the wheels for the majority of their wake time [28]. Infrared beam crossing, an alternative to wheel running, is discussed in Subheading 4. These experiments are useful to determine whether the sirtuin-related pathway of interest within brain or periphery might affect central behavioral activity rhythms.
Place mice in individual cages that contain a running wheel in light-tight boxes approximately 1 h prior to the start of the active (i.e., dark) period (see Note 11). Place just a handful of bedding in the cage so as to not prevent the running wheel from moving freely. A microswitch is attached to the side of the cage and transmits a signal for every revolution of the wheel. These signals are then passed to the collection computer (see Note 12).
Maintain mice in 12:12 LD conditions for a minimum of 1 week to allow acclimation to the new surroundings and to collect baseline activity data (see Note 13).
Switch the light cycle to constant darkness and continue to collect activity data for an additional 2–3 weeks (see Note 14).
-
Activity data is recorded continuously by data acquisition and analysis software such as ClockLab (http://www.actimetrics. com). Wheel running records (i.e., actograms) are then double plotted by vertically stacking the data in overlapping 48-h traces (see Fig. 3). The following fundamental circadian parameters can then be estimated using both visual inspection and available analyses programs (see Note 15):
Free-running period: The time interval between phase reference points (i.e., two peaks).
Amplitude: The difference between peak and trough values of the rhythm.
Phase: The timing of a reference point in the cycle (i.e., the peak) relative to a fixed event (i.e., the beginning of the night phase).
Daytime activity profile: The total number of wheel running turns recorded during subjective day (or night) over the total activity during a circadian cycle or 24 h.
Fig. 3.
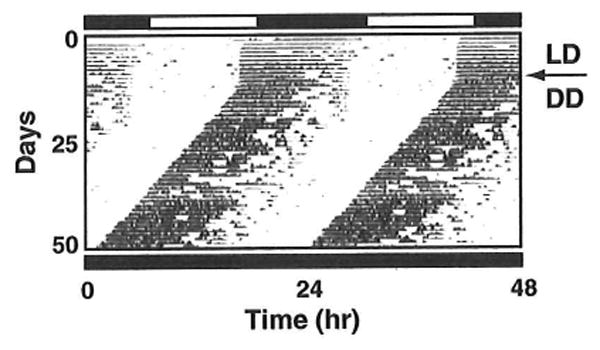
Example of double-plotted actogram of locomotor activity. Wheel turns are recorded in 5-min blocks and plotted as histograms along a horizontal line representing the time of day. The actogram is double plotted, meaning that 2 consecutive days are positioned next to each other both horizontally and vertically. Lighting conditions are indicated to the right. The arrow denotes the switch from 12:12 LD to constant darkness (DD) on day 10
3.3 Measuring Circadian Rhythms In Vitro
A major breakthrough in our understanding of the molecular components of the clock came with the discovery that isolated cultured fibroblasts are able to display approximately 24 h oscillations of core clock genes following brief exposure to 50 % serum, demonstrating that cells have the ability to generate cell-autonomous rhythms independent of signals from the SCN [29]. In addition to serum shock, several other compounds that activate a variety of signaling pathways have also been shown to induce circadian rhythms of gene expression in cultured cells. These include activators of protein kinase A (forskolin and butyryl cAMP), the glucocorticoid receptor (dexamethasone) [30], G-protein-coupled receptors (endothelin), as well as temperature cycles and heat shock [31, 32]. The ability to study circadian rhythms in cultured cells is a valuable tool and has numerous advantages over more timeconsuming in vivo studies, including the ease in which cells can be genetically manipulated to either overexpress or knockdown clock-or sirtuin-related genes. Here, we outline an experiment in which MEF cells are pharmacologically synchronized using forskolin to generate coordinated ∼24 h oscillations of the molecular clock transcription factors and their downstream metabolic targets. Rather than synchronization of all of the cells at one time point, followed by a continuous collection of samples every 4 h for 44 h, we describe here a more convenient method whereby cells are synchronized at four time points over 36 h and then collected at three time points on the final day of the experiment (see Fig. 4 (Method 3) and Table 2). In addition, we describe a method to simultaneously monitor circadian rhythmicity during the time course experiment using a biological circadian clock reporter construct, Period2-luciferase (Fig. 5) [27]. Various outputs, including rhythms of gene or protein expression, NAD+, or other biochemical or physiological endpoints of interest, can then be examined in the samples collected from the WT-MEFs.
Fig. 4.
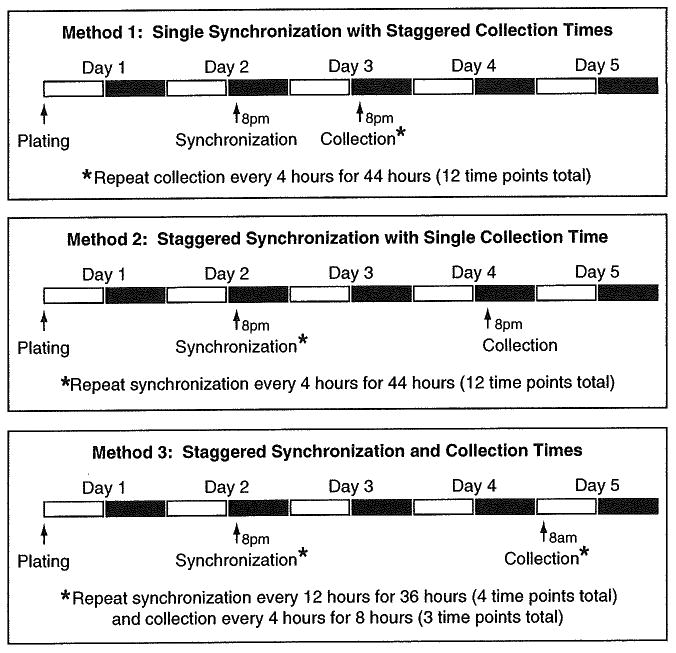
In vitro experimental timelines for synchronization and 48 h collection time points in cells. Three different experimental setups for synchronizing cells in culture are presented. Method 1 entails synchronization of all cells at one time point, followed by collection of samples every 4 h over the course of 48 h. Method 2 entails synchronization of the cells every 4 h, enabling a single collection time point (which may be necessary if a particular assay requires all samples be run at the same time). Finally, Method 3 (described in text) outlines a convenient approach whereby cells are synchronized at four time points over 36 h and then collected at three time points on the final day of the experiment such that no overnight stays are required
Table 2. Example experimental setup for synchronization and 48 h collection in cells.
| Time Point | Synchronization Time | Collection Time | ||
|---|---|---|---|---|
| 44 | Day 2 | 8pm | Day 5 | 4pm |
| 40 | 12pm | |||
| 36 | 8am | |||
| 32 | Day 3 | 8am | 4pm | |
| 28 | 12pm | |||
| 24 | 8am | |||
| 20 | 8pm | 4pm | ||
| 16 | 12pm | |||
| 12 | 8am | |||
| 8 | Day 4 | 8am | 4pm | |
| 4 | 12pm | |||
| 0 | 8am | |||
Fig. 5.
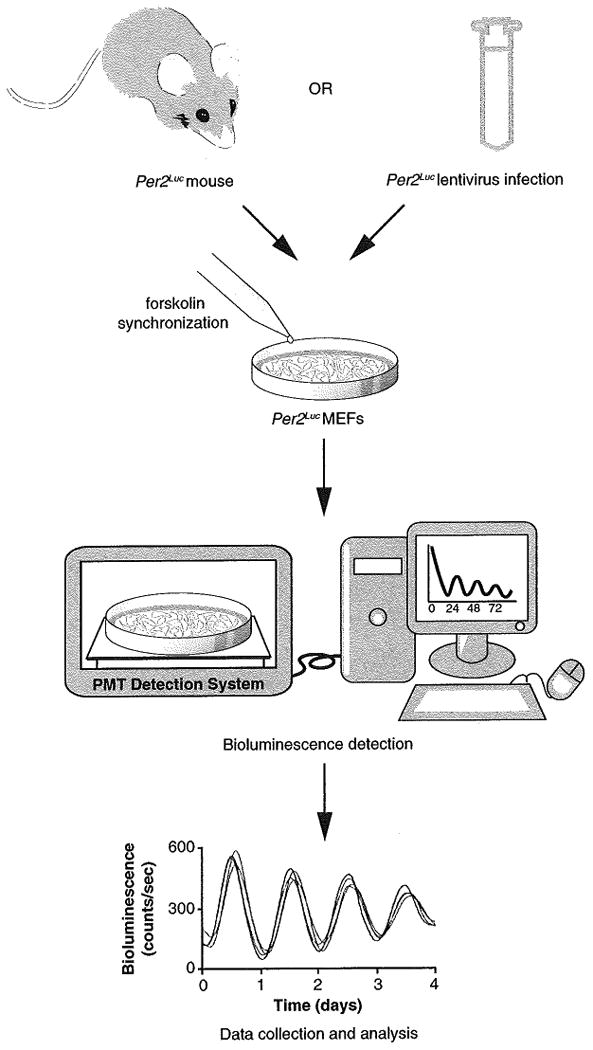
Monitoring PER2-LUC oscillations in vitro. MEFs can be isolated from either PER2-LUC mice or can be infected with PER2-LUC lentivirus. Cells are then synchronized by the addition of forskolin directly to the media, and bioluminescence can be monitored for the remainder of the experiment in a Lumicycler machine. Each plate should display ∼24 h rhythms of luminescence beginning from 12 to 24 h after forskolin treatment. An example trace is shown
Passage MEF cells in 10 cm dishes according to ATCC instructions (see Note 16). MEF cells that have been stably infected with PER2-LUC-expressing lentivirus can also be plated in parallel, allowing for real-time bioluminescence monitoring in order to assess synchronization (see Note 17).
One day prior to synchronization, passage 12 near-confluent (∼90 %) 10 cm dishes of MEFs into twenty-four 10 cm dishes in normal MEF culture media (12 time points × 2 duplicates =24 plates) and plate four 3.5 cm dishes of the PER2-LUC MEFs, such that all dishes are at least 70 % confluent at the start of the experiment the following day (∼1.2 × 10⁶ cells per 10 cm dish, ∼2 × 10⁵ cells per 3.5 cm dish).
For the 10 cm dishes, add forskolin directly to media in each dish at the designated time (see Fig. 4 and Table 2) to a final concentration of 10 μM. Incubate at 37 °C for 30 min, wash once with 1× PBS, replace with fresh MEF culture medium, and return to 37 °C until the time of collection (continue to step 5) (see Notes 18 and 19).
For the 3.5 cm dishes, add forskolin directly to media in each dish at the designated time (see Fig. 4 and Table 2) to a final concentration of 10 μM and incubate at 37 °C for 30 min. Wash once with 1× PBS and add 1.2 ml luciferin-containing medium. Coat the top rim of the plate with a thin layer of sterile vacuum grease and place cover glass on top to prevent evaporation. Gently press on cover glass to create a seal and place plates in the Lumicycler (maintained at 37 °C without CO2) in order to monitor bioluminescence for the remainder of the experiment (see Fig. 5). Each plate should display ∼24 h rhythms of luminescence beginning from 12 to 24 h after forskolin treatment (data analysis software (Clocklab) is available with the Actimetrics Lumicycle apparatus). In addition, plates synchronized at different times should display similar period lengths, amplitudes, and be in phase with one another (i.e., peaks and troughs should occur at similar times post-synchronization).
For the 10 cm dishes, aspirate media and wash cells once with PBS at the designated collection time points (see Note 20). Add 1.5 ml PBS, scrape cells and collect in microcentrifuge tubes, and centrifuge at 1,000 × g for 2 min. Aspirate supernatant and resuspend cells in 1 ml PBS, repeat spin, and freeze cell pellets at −80 °C. Depending on the goals of the experiment, various endpoints can then be examined, including RNA, protein, biochemical analyses, or NAD+ quantification. For NAD+ analysis, an aliquot of the cells can be set aside prior to freezing for protein quantification in order to normalize for any difference in cell number between samples. NAD+ measurement is described elsewhere in this volume.
If PER2-LUC bioluminescence monitoring is not performed, then it will be necessary to confirm proper synchronization by the analysis of transcript levels of canonical clock genes. RNA should be extracted from the frozen cell pellets, reverse transcribed, and the resultant cDNA should be amplified by RT-PCR with specific primers for canonical clock genes, including Clock, Bmall, Per1-3, Cry1-2, Rev-Erbα, Rorα, and Dbp. Rhythms of expression of other genes of interest, including Nampt, the sirtuins, and downstream targets can also be analyzed in parallel.
Footnotes
Here, we describe the use of wild-type C57BL/6J mice for circadian analysis of sirtuin-related endpoints. However, this strategy can also be applied to transgenic or knockout mouse models of the sirtuin-related genes in order to gain insight into the role of the sirtuins or their targets in the circadian regulation of the process of interest.
Light-tight circadian cabinets with computer-controlled light–dark cycles can be purchased through Phenome Technologies. However, an alternative is to simply place the mouse cages in a temperature-controlled room with light-tight doors and a timed light cycle that can be manipulated (see Note 3).
Small amounts of light contamination in animal facilities during the night have been shown to not only shift the phase of the clock but also disrupt normal rhythms of endocrine metabolism and physiology, including plasma glucose, fatty acid, and corticosterone levels [33, 34]. It is therefore very important to make sure that doors are fitted with gaskets and sweeps and that any windows on the doors should be sealed in order to minimize light exposure to the mice. It is also critical to use either infrared goggles or a very dim red light (≤1 lx) anytime the light-tight box is opened during the dark phase. It can also be useful to have a dead bolt on the door on the inside of the room to prevent any accidental entries when performing experiments in the dark.
In normal light–dark cycles, light is a strong entraining cue that synchronizes the rhythms of all of the mice with the environment. In constant darkness, individual mice will continue to experience rhythms governed by the period of their endogenous clock (which is slightly less than 24 h in mice), a condition called free-running (see Fig. 3). However, when the animals are free-running, each mouse will have a slightly different period length and eventually the colony will be desynchronized from each other.
Animals display a strong feeding rhythm that corresponds with their locomotor activity. Mice eat primarily during the dark period and fast during the light period, thus generating rhythms of feeding and fasting that affect the rhythm of sirtuin expression and function. For example, SIRT1 expression is induced during fasting and peaks after 18 h of fasting in liver tissue. Thus the fasting length in this experiment was set to 18 h in order to normalize fasting-induced rhythms of expression [35]. However, depending on the goals of the experiment, they can also be performed on mice fed ad libitum.
During alternating light–dark conditions, time is measured with respect to the time cues (zeitgebers), such that zeitgeber time (ZT) 0 corresponds with the start of the light period. In constant darkness, zeitgeber time is replaced with circadian time (CT) in which CT12 corresponds with the onset of the animal's normal active phase.
If brain tissue is collected, optic nerve transection at the chiasm should be performed, followed by excision of the eye, before turning on the light.
As an alternative to performing a continuous 48 h experiment, it is also possible to break the experiment into two separate 24 h experiments consisting of collections from CT0–CT20 and CT24–CT44. In this case, the second set of mice should be placed into constant darkness 60 h prior to the first collection (CT24) to achieve equivalent free-running conditions.
Sampling every 4 h is sufficient to detect six different phases of the circadian cycle; sampling less frequently than 4 h results in a dramatic decrease in the ability to detect 24 h rhythms [36].
If the circadian rhythms of the variable of interest have previously been determined and mice number are limiting, one can choose to perform experiments simply at the peak and trough of expression or activity.
Mice are transferred to wheel running cages 1–2 h prior to the start of the active (i.e., lights off) period in order to (1) avoid disturbing the mice during their normal rest period and (2) to minimize any novelty-induced phase shifts in circadian behavior that might arise due to introducing wheel cages during their normal sleep time [37, 38].
While wheel running is most standard method to monitor rhythms of locomotor activity, an alternative method involves the use of infrared beams to monitor the horizontal locomotor activity of an individual mouse by recording the number of times the mouse breaks the IR beams. An advantage of dais method is that it eliminates potential effects of exercise promoted by the wheels, an important consideration when dealing with metabolic genes or pathways.
To ensure proper functioning of the wheels, daily activity can be monitored using the data collection software or by visually inspecting the mice during either the light period or using infrared night-vision goggles during the dark period.
In order to simultaneously monitor rhythms of food intake, one can perform daily manual measurements of food intake (e.g., measurements of the weight of food at the start of both the light and dark periods over the course of several days). Alternatively, one can also take advantage of Feed-Scale electronic food monitoring chambers (Columbus Instruments) to measure the mass of food removed from a container that resides on a precision balance. Food measurements are taken every 6 min and recorded by the computer. Locomotor activity can be simultaneously measured using cages equipped with infrared beams.
More detailed descriptions of how to analyze and interpret actogram data using Clocklab software can be found in [28].
While the synchronization of immortalized NIH-3T3 MEF cell lines is described here, similar experiments can be performed in other cell lines, though optimization is required to determine the proper synchronization method for each cell line. In addition, synchronization experiments can be performed in isolated primary cells such as islets [39], organ explant culture such as liver, lung, or SCN [31], or in MEFs isolated from mice harboring mutations in clock genes and/or sirtuin-related factors. Typically, rapidly dividing cells, such as tumor cells, are harder to synchronize than non-transformed cells because rapid cell division leads to desynchronization [40].
As an alternative to monitoring PER2-LUC bioluminescence in lentivirally-infected MEFs, similar experiments can be performed using non-immortalized primary MEF cells isolated from mice expressing PER2-LUC [27]. If non-immortalized MEF cells are used, however, special considerations must be taken into account for cell death over time. It is best to use fresh cells (thawed 1–2 days before the start of experiment).
Several approaches can be taken to synchronize cells, as multiple cell lines have differential responses to the various synchronizing agents. Here, we outline experiments in which MEFs are synchronized with the adenylyl cyclase agonist forskolin [41]. Activators of the adenylyl cyclase pathway have been shown to induce circadian clock phase shifts and “reset” circadian oscillations in cell culture systems potentially through the cAMP/PKA-dependent transcription factor CREB [42, 43]. Other stimuli that have been shown to control clock phase resetting in cell and tissue culture-based systems include: (1) horse/bovine serum shock (2 h treatment in 50 % serum, followed by culturing cells in 0.5 % serum-containing media) [29,44], (2) glucocorticoid receptor agonist dexamethasone (2 h treatment with 0.1 μM dexamethasone) [30, 45], (3) heat shock (multiple methods, including a single shock treatment of ∼38–39 °C for 10–60 min (1–6 h for tissue explants) or repeated daily temperature shifts (∼35.5–38.5 °C) using a tightly temperature-controlled incubator [31, 32, 46, 47]).
In some cases, forskolin treatment can significantly slow cell growth (particularly when using non-immortalized MEFs). Therefore it is sometimes recommended to plate later time points at a higher cell density to ensure similar culture confluence at the end of the experiment for each plate. Large differences in confluence between plates can affect total NAD+ concentrations.
This method allows for 24 h of recovery after shock prior to measurement. Thus, cell collections are done at 24–68 h after forskolin treatment. This delay in collection is due to the fact that cells display poor PER2-LUC rhythmicity until ∼12–24 h after shock. Approximately 24 h after shock, robust ∼24 h PER2-LUC oscillations begin and can be observed for 3–7 days.
References
- 1.Maron BJ, Kogan J, Proschan MA, Hecht GM, Roberts WC. Circadian variability in the occurrence of sudden cardiac death in patients with hypertrophic cardiomyopathy. J Am Coll Cardiol. 1994;23(6):1405–1409. doi: 10.1016/0735-1097(94)90384-0. pii: 0735-1097 (94)90384-0. [DOI] [PubMed] [Google Scholar]
- 2.Di Lorenzo L, De Pergola G, Zocchetti C, L'Abbate N, Basso A, Pannacciulli N, Cignarelli M, Giorgino R, Soleo L. Effect of shift work on body mass index: results of a study performed in 319 glucose-tolerant men working in a Southern Italian industry. Int J Obes Relat Metab Disord. 2003;27(11):1353–1358. doi: 10.1038/sj.ijo.0802419. pii: 0802419. [DOI] [PubMed] [Google Scholar]
- 3.Karlsson B, Knutsson A, Lindahl B. Is there an association between shift work and having a metabolic syndrome? Results from a population based study of 27,485 people. Occup Environ Med. 2001;58(11):747–752. doi: 10.1136/oem.58.11.747. [DOI] [PMC free article] [PubMed] [Google Scholar]
- 4.Karlsson BH, Knutsson AK, Lindahl BO, Alfredsson LS. Metabolic disturbances in male workers with rotating three-shift work. Results of the WOLF study. Int Arch Occup Environ Health. 2003;76(6):424–430. doi: 10.1007/s00420-003-0440-y. [DOI] [PubMed] [Google Scholar]
- 5.Jarrett RJ, Keen H. Diurnal variation of oral glucose tolerance: a possible pointer to the evolution of diabetes mellitus. Br Med J. 1969;2(5653):341–344. doi: 10.1136/bmj.2.5653.341. [DOI] [PMC free article] [PubMed] [Google Scholar]
- 6.la Fleur SE, Kalsbeek A, Wortel J, Fekkes ML, Buijs RM. A daily rhythm in glucose tolerance: a role for the suprachiasmatic nucleus. Diabetes. 2001;50(6):1237–1243. doi: 10.2337/diabetes.50.6.1237. [DOI] [PubMed] [Google Scholar]
- 7.Lee A, Ader M, Bray GA, Bergman RN. Diurnal variation in glucose tolerance. Cyclic suppression of insulin action and insulin secretion in normal-weight, but not obese, subjects. Diabetes. 1992;41(6):742–749. doi: 10.2337/diab.41.6.750. [DOI] [PubMed] [Google Scholar]
- 8.Roberts HJ. Afternoon glucose tolerance testing: a key to the pathogenesis, early diagnosis and prognosis of diabetogenic hyperinsulinism. J Am Geriatr Soc. 1964;12:423–472. doi: 10.1111/j.1532-5415.1964.tb05730.x. [DOI] [PubMed] [Google Scholar]
- 9.Boden G, Ruiz J, Urbain JL, Chen X. Evidence for a circadian rhythm of insulin secretion. Am J Physiol. 1996;271(2 pt 1):E246–E252. doi: 10.1152/ajpendo.1996.271.2.E246. [DOI] [PubMed] [Google Scholar]
- 10.Carroll KF, Nestel PJ. Diurnal variation in glucose tolerance and in insulin secretion in man. Diabetes. 1973;22(5):333–348. doi: 10.2337/diab.22.5.333. [DOI] [PubMed] [Google Scholar]
- 11.Velasco A, Huerta I, Marin B. Plasma corticosterone, motor activity and metabolic circadian patterns in streptozotocin-induced diabetic rats. Chronobiol Int. 1988;5(2):127–135. doi: 10.3109/07420528809079553. [DOI] [PubMed] [Google Scholar]
- 12.Van Cauter E, Polonsky KS, Scheen AJ. Roles of circadian rhythmicity and sleep in human glucose regulation. Endocr Rev. 1997;18(5):716–738. doi: 10.1210/edrv.18.5.0317. [DOI] [PubMed] [Google Scholar]
- 13.Lowrey PL, Takahashi JS. Mammalian circadian biology: elucidating genome-wide levels of temporal organization. Annu Rev Genomics Hum Genet. 2004;5:407–441. doi: 10.1146/annurev.genom.5.061903.175925. 10.1146/annurev.genom.5.061903. 175925. [DOI] [PMC free article] [PubMed] [Google Scholar]
- 14.Asher G, Gatfield D, Stratmann M, Reinke H, Dibner C, Kreppel F, Mostoslavsky R, Alt FW, Schibler U. SIRT1 regulates circadian clock gene expression through PER2 deacetylation. Cell. 2008;134(2):317–328. doi: 10.1016/j.cell.2008.06.050. pii: S0092-8674(08)00837-4. [DOI] [PubMed] [Google Scholar]
- 15.Nakahata Y, Kaluzova M, Grimaldi B, Sahar S, Hirayama J, Chen D, Guarente LP, Sassone-Corsi P. The NAD+-dependent deacetylase SIRT1 modulates CLOCK-mediated chromatin remodeling and circadian control. Cell. 2008;134(2):329–340. doi: 10.1016/j.cell.2008.07.002. [DOI] [PMC free article] [PubMed] [Google Scholar]
- 16.Ramsey KM, Yoshino J, Brace CS, Abrassart D, Kobayashi Y, Marcheva B, Hong HK, Chong JL, Buhr ED, Lee C, Takahashi JS, Imai SI, Bass J. Circadian clock feedback cycle through NAMPT-mediated NAD+ biosynthesis. Science. 2009;324(5927):651–654. doi: 10.1126/science.1171641. pii: 1171641. [DOI] [PMC free article] [PubMed] [Google Scholar]
- 17.Nakahata Y, Sahar S, Astarita G, Kaluzova M, Sassone-Corsi P. Circadian control of the NAD+ salvage pathway by CLOCK-SIRT1. Science. 2009;324(5927):654–657. doi: 10.1126/science.1170803. pii: 1170803. [DOI] [PMC free article] [PubMed] [Google Scholar]
- 18.Rutter J, Reick M, Wu LC, McKnight SL. Regulation of clock and NPAS2 DNA binding by the redox state of NAD cofactors. Science. 2001;293(5529):510–514. doi: 10.1126/science.1060698. pii: 1060698. [DOI] [PubMed] [Google Scholar]
- 19.Sahar S, Nin V, Barbosa MT, Chini EN, Sassone-Corsi P. Altered behavioral and metabolic circadian rhythms in mice with disrupted NAD+ oscillation. Aging (Albany NY) 2011;3(8):794–802. doi: 10.18632/aging.100368. pii: 100368. [DOI] [PMC free article] [PubMed] [Google Scholar]
- 20.Yoshino J, Mills KF, Yoon MJ, Imai S. Nicotinamide mononucleotide, a key NAD(+) intermediate, treats the pathophysiology of diet- and age-induced diabetes in mice. Cell Metab. 2011;14(4):528–536. doi: 10.1016/j.cmet.2011.08.014. [DOI] [PMC free article] [PubMed] [Google Scholar]
- 21.Schibler U. The 2008 Pittendrigh/Aschoff lecture: peripheral phase coordination in the mammalian circadian timing system. J Biol Rhythms. 2009;24(1):3–15. doi: 10.1177/0748730408329383. [DOI] [PubMed] [Google Scholar]
- 22.Panda S, Antoch MP, Miller BH, Su AI, Schook AB, Straume M, Schultz PG, Kay SA, Takahashi JS, Hogenesch JB. Coordinated transcription of key pathways in the mouse by the circadian clock. Cell. 2002;109(3):307–320. doi: 10.1016/s0092-8674(02)00722-5. pii: S0092867402007225. [DOI] [PubMed] [Google Scholar]
- 23.Reddy AB, Karp NA, Maywood ES, Sage EA, Deery M, O'Neill JS, Wong GK, Chesham J, Odell M, Lilley KS, Kyriacou CP, Hastings MH. Circadian orchestration of the hepatic proteome. Curr Biol. 2006;16(11):1107–1115. doi: 10.1016/j.cub.2006.04.026. pii: S0960-9822(06)01487-4. [DOI] [PubMed] [Google Scholar]
- 24.Pronina EA, Shvidenko IG, Shub GM, Shapoval OG. Influence of electromagnetic emission at the frequencies of molecular absorption and emission spectra of oxygen and nitrogen oxide on the adhesion and formation of Pseudomonas aeruginosa biofilm. Zhurnal mikrobiologii, epidemiologii, i immunobiologii. 2011;(6):61–64. [PubMed] [Google Scholar]
- 25.Liu AC, Tran HG, Zhang EE, Priest AA, Welsh DK, Kay SA. Redundant function of REV-ERBalpha and beta and non-essential role for Bmal1 cycling in transcriptional regulation of intracellular circadian rhythms. PLoS Genet. 2008;4(2):el000023. doi: 10.1371/joumal.pgen.1000023. [DOI] [PMC free article] [PubMed] [Google Scholar]
- 26.Liu AC, Welsh DK, Ko CH, Tran HG, Zhang EE, Priest AA, Buhr ED, Singer O, Meeker K, Verma IM, Doyle FJ, III, Takahashi JS, Kay SA. Intercellular coupling confers robustness against mutations in the SCN circadian clock network. Cell. 2007;129(3):605–616. doi: 10.1016/j.cell.2007.02.047. [DOI] [PMC free article] [PubMed] [Google Scholar]
- 27.Yoo SH, Yamazaki S, Lowrey PL, Shimomura K, Ko CH, Buhr ED, Siepka SM, Hong HK, Oh WJ, Yoo OJ, Menaker M, Takahashi JS. PERIOD2::LUCIFERASE real-time reporting of circadian dynamics reveals persistent circadian oscillations in mouse peripheral tissues. Proc Natl Acad Sci U S A. 2004;101(15):5339–5346. doi: 10.1073/pnas.0308709101. [DOI] [PMC free article] [PubMed] [Google Scholar]
- 28.Siepka SM, Takahashi JS. Methods to record circadian rhythm wheel running activity in mice. Methods Enzymol. 2005;393:230–239. doi: 10.1016/S0076-6879(05)93008-5. [DOI] [PMC free article] [PubMed] [Google Scholar]
- 29.Balsalobre A, Damiola F, Schibler U. A serum shock induces circadian gene expression in mammalian tissue culture cells. Cell. 1998;93(6):929–937. doi: 10.1016/s0092-8674(00)81199-x. pii: S0092-8674(00)81199-X. [DOI] [PubMed] [Google Scholar]
- 30.Balsalobre A, Brown SA, Marcacci L, Tronche F, Kellendonk C, Reichardt HM, Schutz G, Schibler U. Resetting of circadian time in peripheral tissues by glucocorticoid signaling. Science. 2000;289(5488):2344–2347. doi: 10.1126/science.289.5488.2344. pii: 8856. [DOI] [PubMed] [Google Scholar]
- 31.Buhr ED, Yoo SH, Takahashi JS. Temperature as a universal resetting cue for mammalian circadian oscillators. Science. 2010;330(6002):379–385. doi: 10.1126/science.1195262. 10.1126/science. 1195262. [DOI] [PMC free article] [PubMed] [Google Scholar]
- 32.Saini C, Morf J, Stratmann M, Gos P, Schibler U. Simulated body temperature rhythms reveal the phase-shifting behavior and plasticity of mammalian circadian oscillators. Genes Dev. 2012;26(6):567–580. doi: 10.1101/gad.l83251.111. [DOI] [PMC free article] [PubMed] [Google Scholar]
- 33.Dauchy RT, Dauchy EM, Tirrell RP, Hill CR, Davidson LK, Greene MW, Tirrell PC, Wu J, Saner LA, Blask DE. Dark-phase light contamination disrupts circadian rhythms in plasma measures of endocrine physiology and metabolism in rats. Comp Med. 2010;60(5):348–356. [PMC free article] [PubMed] [Google Scholar]
- 34.Dauchy RT, Dupepe LM, Ooms TG, Dauchy EM, Hill CR, Mao L, Belancio VP, Slakey LM, Hill SM, Blask DE. Eliminating animal facility light-at-night contamination and its effect on circadian regulation of rodent physiology, tumor growth, and metabolism: a challenge in the relocation of a cancer research laboratory. J Am Assoc Lab Anim Sci. 2011;50(3):326–336. [PMC free article] [PubMed] [Google Scholar]
- 35.Kim HS, Xiao C, Wang RH, Lahusen T, Xu X, Vassilopoulos A, Vazquez-Ortiz G, Jeong WI, Park O, Ki SH, Gao B, Deng CX. Hepaticspecific disruption of SIRT6 in mice results in fatty liver formation due to enhanced glycolysis and triglyceride synthesis. Cell Metab. 2010;12(3):224–236. doi: 10.1016/j.cmet.2010.06.009. [DOI] [PMC free article] [PubMed] [Google Scholar]
- 36.Hughes ME, DiTacchio L, Hayes KR, Vollmers C, Pulivarthy S, Baggs JE, Panda S, Hogenesch JB. Harmonics of circadian gene transcription in mammals. PLoS Genet. 2009;5(4):el000442. doi: 10.1371/journal.pgen.l000442. [DOI] [PMC free article] [PubMed] [Google Scholar]
- 37.Janik D, Godfrey M, Mrosovsky N. Phase angle changes of photically entrained circadian rhythms following a single nonphotic stimulus. Physiol Behav. 1994;55(1):103–107. doi: 10.1016/0031-9384(94)90016-7. [DOI] [PubMed] [Google Scholar]
- 38.Van Reeth O, Turek FW. Stimulated activity mediates phase shifts in the hamster circadian clock induced by dark pulses or benzodiazepines. Nature. 1989;339(6219):49–51. doi: 10.1038/339049a0. [DOI] [PubMed] [Google Scholar]
- 39.Marcheva B, Ramsey KM, Buhr ED, Kobayashi Y, Su H, Ko CH, Ivanova G, Omura C, Mo S, Vitaterna MH, Lopez JP, Philipson LH, Bradfield CA, Crosby SD, Jebailey L, Wang X, Takahashi JS, Bass J. Disruption of the clock components CLOCK and BMAL1 leads to hypoinsulinaemia and diabetes. Nature. 2010;466(7306):571–572. doi: 10.1038/nature09253. pii: nature09253. [DOI] [PMC free article] [PubMed] [Google Scholar]
- 40.Nagoshi E, Saini C, Bauer C, Laroche T, Naef F, Schibler U. Circadian gene expression in individual fibroblasts: cell-autonomous and self-sustained oscillators pass time to daughter cells. Cell. 2004;119(5):693–705. doi: 10.1016/j.cell.2004.11.015. [DOI] [PubMed] [Google Scholar]
- 41.Seamon KB, Padgett W, Daly JW. Forskolin: unique diterpene activator of adenylate cyclase in membranes and in intact cells. Proc Nad Acad Sci U S A. 1981;78(6):3363–3367. doi: 10.1073/pnas.78.6.3363. [DOI] [PMC free article] [PubMed] [Google Scholar]
- 42.Eskin A, Takahashi JS. Adenylate cyclase activation shifts the phase of a circadian pacemaker. Science. 1983;220(4592):82–84. doi: 10.1126/science.6298939. [DOI] [PubMed] [Google Scholar]
- 43.Yagita K, Okamura H. Forskolin induces circadian gene expression of rPerl, rPer2 and dbp in mammalian rat-1 fibroblasts. FEBS Lett. 2000;465(1):79–82. doi: 10.1016/s0014-5793(99)01724-x. [DOI] [PubMed] [Google Scholar]
- 44.Welsh DK, Yoo SH, Liu AC, Takahashi JS, Kay SA. Bioluminescence imaging of individual fibroblasts reveals persistent, independendy phased circadian rhythms of clock gene expression. Curr Biol. 2004;14(24):2289–2295. doi: 10.1016/j.cub.2004.11.057. pii: S0960982204009157. [DOI] [PMC free article] [PubMed] [Google Scholar]
- 45.Meng QJ, McMaster A, Beesley S, Lu WQ, Gibbs J, Parks D, Collins J, Farrow S, Donn R, Ray D, Loudon A. Ligand modulation of REV-ERBalpha function resets the peripheral circadian clock in a phasic manner. J Cell Sci. 2008;121(Pt 21):3629–3635. doi: 10.1242/jcs.035048. pii: 121/21/3629. [DOI] [PMC free article] [PubMed] [Google Scholar]
- 46.Brown SA, Zumbrunn G, Fleury-Olela F, Preitner N, Schibler U. Rhythms of mammalian body temperature can sustain peripheral circadian clocks. Curr Biol. 2002;12(18):1574–1583. doi: 10.1016/s0960-9822(02)01145-4. [DOI] [PubMed] [Google Scholar]
- 47.Prolo LM, Takahashi JS, Herzog ED. Circadian rhythm generation and entrainment in astrocytes. J Neurosci. 2005;25(2):404–408. doi: 10.1523/JNEUROSCI.4133-04.2005. [DOI] [PMC free article] [PubMed] [Google Scholar]