Introduction
The analysis of phenolic analytes is routine in a broad range of disciplines, e.g. environmental sciences, medicinal chemistry, pharmacology and toxicology (Hovander et al, 2002; Kraimer, 1995; Qiu et al, 2007, Halket et al, 2004). Before phenols can be analyzed by GC they need to be derivatized. Commonly a derivatization reaction by O-methylation using the explosive gas diazomethane (DM) is employed. The main advantages of DM are its quantitative and clean reactions (Hovander et al, 2002; Kraimer, 1995; Qiu et al, 2007; Halket et al, 2004). These advantages come with great risks including: spontaneous explosions and toxic reactions upon inhalation or by contact with skin and eyes (USDOL, 2000). There are numerous references to the explosive and toxic nature of DM (USDOL, 2000; Warr, 2002; NIOSH, 2008). DM is classified as carcinogenic in laboratory animals, and as an allergen in humans (USDOL, 2000). The OSHA Permissible Exposure Limit (PEL) for DM is (0.2 ppm or 0.4 mg/m3) (USDOL, 2000), which is comparable to that of ozone (0.1 ppm or 0.2 mg/m3) (NIOSH, 2005) and benzene (1 ppm or 3.19 mg/m3) (NIOSH, 2005). However there were no statistical data on the number of accidents or fatalities to give a broader overview of the dangers of DM. Preparing and handling DM is not straight-forward, requiring skilled operators, special glassware (Sigma-Aldrich, AL-180), working behind blast shields at all times (USDOL, 2000), working in well ventilated hoods (USDOL, 2000) and the grounding and discharging of both operator and equipment (USDOL, 2000). As the benefits of using DM come at such high risk, our current study assesses trimethylsilyldiazomethane (TMS-DM) as a reliable, clean, safe, easier to handle, time-saving and cost-efficient alternative.
TMS-DM has been described as an O-methylation reagent in synthetic organic reactions, including the Arndt-Eistert homologation (Podlech, 1998), O-methylation of carboxylic acids (Podlech, 1998) and even phenols in pure solvents (Podlech, 1998; Aoyama et al, 1984). TMS-DM is frequently used as derivatization agent in the analysis of carboxylic acids (Kuehnel et al, 2007; Park, 2001). However, there has been little effort to investigate the factors influencing the effect of steric hindrance and acidity of the analytes in real matrices. This is surprising, since TMS-DM is commercially available (Podlech, 1998) and has in fact an unlimited shelf life, while DM needs to be freshly prepared and has very limited storage time even in a freezer. Presently, reactions involving TMS-DM and phenolic analytes have been published only for organic synthesis involving clean solvents (Podlech, 1998; Aoyama et al., 1984).
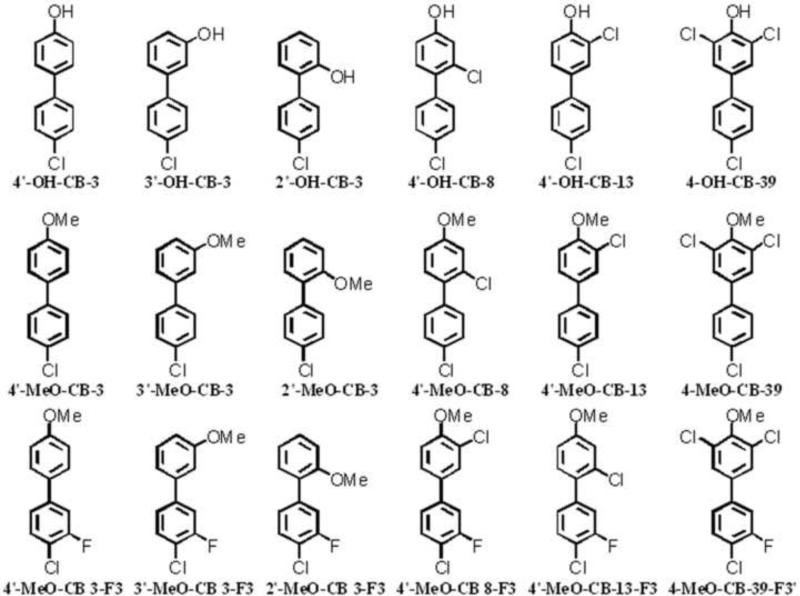
In the present study phenolic metabolites of polychlorinated biphenyls (OH-PCBs) were chosen as model compounds to investigate the potential of TMS-DM as O-methylation derivatization reagent for phenolic analytes, see Figure 1. OH-PCB metabolites are perfect as model compounds due to the variety of structures available, allowing the investigation of steric and electronic effects on the O-methylation by ortho-chloro-substitution; see Figure 1. In addition, extensive research is currently probing the biological effects of both parent PCBs and their metabolites (McLean et al., 1996; Lehmann et al., 2007; Espandiari et al., 2004).
Figure 1.
[top] Hydroxy-PCBs (OH-PCBs), [middle] methoxy-PCBs (MeO-PCBs) and [bottom] fluoro-substituted methoxy-PCBs (MeO-F-PCBs) used as model compounds. Nomenclature is according to Ballschmiter-Zell and Ballschmiter-Zell-Luthe systems.
Fluorine-tagged analogues (MeO-F-PCBs) of the expected methoxy PCB (MeO-PCBs) derivatives were used in this study as internal standards to monitor: discrimination effects, analyte losses and competing reactions. Fluoro-substituted or tagged analogues of aromatic analytes, e.g. PCBs, polybrominated diphenyl ethers and polycyclic aromatic hydrocarbons have shown their potential as internal standards in previous studies (Klösener et al., 2009). Fluorine tagged analogues of aromatic compounds have the advantage that they resemble their parent compounds, but do not tend to scramble like deuterated standards and are easier accessible compared with 13C labeled analogues. In addition, they have advantages in their detection behavior, e.g. a mass difference of 18 m/z (Luthe et al., 2003).
In this study MeO-PCBs and MeO-F-PCBs were synthesized by an improved Suzuki-coupling (Luthe et al., 2006); the corresponding hydroxy-PCB (OH-PCBs) congeners were prepared by dealkylation of the corresponding MeO-PCB using borontribromide (Lehmler and Robertson, 2001). As a real matrix, a denatured extract of rat liver microsomes was used. Rat liver microsomal fraction is highly complex, consisting of lipophilic, hydrophilic and bipolar components with the tendency to form micelles (Hayes, 2001). Various components within the microsomal matrix are capable of reacting competitively with the derivatization regents including fatty acids and other phenols. We investigated the yields at a fixed time point with varying amounts of excess of TMS-DM and diisopropylethylamine (DIPEA) and optimized this to comparable levels as with DM. Kinetic studies were preformed under these optimized conditions. In addition, we conducted safety and cost analyses for both reagents.
2. Materials and Methods
2.1 Chemicals
Trimethylsilyldiazomethane (TMS-DM) in hexanes (p.a.) and N,N-diisopropylethylamine (DIPEA) (99.5%) were purchased from Acros Organics (Morris Plains, NJ, USA). N-methyl-N-nitroso-p-toluenesulphonamide (diazald) (99%) was purchased as DM precursor from Sigma Aldrich (St. Louis, MO, USA). CAUTION: DM is an explosive gas, and should be prepared in a well ventilated hood. Operation of equipment should be carried out from a remote location behind safety glass. Exposure above the Occupational Exposure Limits (OEL = 0.2 ppm as TWA; (ACGIH 2004)) may result in death. 4-bromo-2-chlorophenol (99%) 4-bromo-3-chloroanisole (99%) and 4-chloro-3-fluorophenylboronic acid (99%), were purchased from Oakwood Products (Greenville, SC, USA), 2,6-dichlorophenol (99%) 4-bromo-2-fluoro-chlorobenzene (98+%), 4-chlorophenylboronic acid (97%), 2-methoxyphenylboronic acid (97+%), 3-methoxyphenylboronic acid (97+%), 4-methoxyphenylboronic acid (97+%), anhydrous magnesium sulfate (p.a.), anhydrous sodium sulfate (p.a.), hydrochloric acid (p.a.) (1N) and CDCl3 (99.8%) containing tetramethylsilane (0.03 %) were purchased from Acros Organics (Morris Plains, NJ, USA). Methanol (HPLC grade), n-hexane (95%), acetonitrile (anhydrous), silica gel (60 Å C: C 40-63 μm) were purchased from Fisher Chemical (Pittsburgh, PA, USA). Tetrakis (triphenylphosphine) palladium (0) (99%) was purchased from Acros Organics (Morris Plains, NJ, USA).
The internal standards 4’-methoxy-3-fluoro-4-chlorobiphenyl (4’-MeO-CB-3-F3), 3’-methoxy-3-fluoro-4-chlorobiphenyl (3’ MeO-CB-3-F3), 2’-methoxy-3-fluoro-4-chlorobiphenyl (2’-MeO-CB-3-F3), 4’-methoxymethoxyl-3-fluoro-3,4’-dichlorobiphenyl (4’-MeO-CB-13-F3), 4’-methoxy-3-fluoro-2,4’-dichlorobiphenyl (4’-MeO-CB-8-F3) and 4-methoxy-3’-fluoro-3,4’,5-trichlorobiphenyl (4-MeO-CB-39-F3’), reference compounds and precursors to demethylation 4’-methoxy-3’,4-dichlorobiphenyl (4’-MeO-CB-13), and 4-methoxy-3,4’,5-trichlorobiphenyl (4-MeO-CB-39), were synthesized by an improved method utilizing a palladium-catalyzed Suzuki-cross coupling between substituted boronic acids and bromobenzenes, please see Figure 1 for structural formulas.
4’-Methoxy-4-chlorobiphenyl (4’-MeO-CB-3), 3’-methoxy-4-chlorobiphenyl (3’-MeOCB-3), 2’-methoxy-4-chlorobiphenyl (2’-MeO-CB-3), 4’-methoxy-2,4’-dichlorobiphenyl (4’-MeO-CB-8), 4’-hydroxy-4-chlorobiphenyl (4’-OH-CB-3), 3’-hydroxy-4-chlorobiphenyl (3’-OH-CB-3), 2’-hydroxy-4-chlorobiphenyl (2’-OH-CB-3) and 4’-hydroxy-2,4’-dichlorobiphenyl (4’-OH-CB-8) were obtained at 99.5 % purity.
4’-hydroxy-3,4’-dichlorobiphenyl (4’-OH-CB-13) and 4-hydroxy-3,4’,5-trichlorobiphenyl (4-OH-CB-39) were synthesized by demethylation from the corresponding methoxy analogues with boron tribromide under stirring for 24 h in a protected atmosphere (argon). All compounds were purified using flash silica gel column chromatography followed by re-crystallization from methanol. The purity determined by GC-MS, was > 99.5% (n=5).
2.2 Nomenclature
The nomenclature for the methoxy-PCBs (MeO-PCBs) and hydroxy-PCBs (OH-PCBs) is based on the Ballschmiter-Zell system (Luthe et al., 2006). The nomenclature for the monofluoro substituted methoxy PCBs (MeO-F-PCBs) is according the Ballschmiter-Zell-Luthe system (Luthe et al., 2006).
2.3 Synthesis
The series of MeO-PCBs (4’-MeO-CB-13, 4-MeO-CB-39) and MeO-F-PCBs (4’-MeOCB-3-F3, 3’-MeO-CB-3-F3, 2’-MeO-CB-3-F3, 4’-MeO-CB-13-F3, 4’-MeO-CB-8-F3, 4-MeO-CB-39-F3’) were prepared using an improved Suzuki Coupling (Luthe et al., 2006), while OH-PCBs (4’-OH-CB-13, 4-OH-CB-39) were prepared by demethylation (Lehmler and Robertson, 2006), and were synthesized for the first time. The purity of all model compounds was 99.5 % (GC-MS). Yields for the Suzuki Coupling ranged between 16.1 % (4’-MeO-CB-8 F 3) and 75.1 % (2’-MeO-CB-3 F 3); see Supplementary tables 1, 2 and 3. The demethylation yielded 45.5% (4’-OH-CB-13) and 68.1% (4-OH-CB-39). These values are in line with the literature (Lehmler and Robertson, 2006), and are good to excellent compared with other congeners (Luthe et al., 2006).
2.4 1H, 13C and 19F NMR characterization
All synthesized analytes, internal standards and reference compounds were characterized by means of proton (1H), carbon (13C), and where appropriate fluorine (19F) nuclear magnetic resonance (NMR) spectroscopy. The 1H and 13C NMR spectra were recorded on 300 MHz NMR spectrometer (Bruker, Billerica, MA, USA), using CDCl3 as solvent. Chemical shifts, δ, are given in ppm relative to TMS (0.03 %), coupling constants, J, in Hz. 19F NMR spectra were obtained with a 5 mm QNP probe, operating at 282.4 MHz. Chemical shifts were calibrated against hexafluorobenzene (C6F6) as standard. Supplementary table 4 lists all NMR characterization spectra.
2.5 GC-MS analysis of synthesized compounds
Analysis of synthesized analytes, internal standards and reference compounds were carried out on a Thermo Trace 2000 GC-MS (Thermo Fisher, San Jose, CA, USA) coupled with a Thermo Voyager inert MS detection and auto sampler (Thermo AS 3000). 1 μL aliquots (1mg/mL) were injected split less. The injection temperature was set at 225 °C. Separation was performed on a SLB-5ms capillary column (60 m × 0.25 mm I.D., 0.25 μm film thickness). Helium was used as the carrier gas at a flow of 1.2 mL/min. The split was opened after 2 min. The column temperature was programmed from 50°C to 250°C with 5°C/min. The final temperature was held for twenty minutes. Detection was based on EIMS mode in the total ion count mode (m/z 50-500) over the entire time range. Hydrogen was used as reagent gas at a flow of 3 mL/min. The ion source temperature was 200°C. Supplementary table 4 lists all GC-MS characterization spectra for the synthesized compounds.
2.6 Preparation of DM
DM was prepared using an Aldrich Mini Diazald® apparatus. According to the manufacturers specifications; paraphrasing: the apparatus is filled with ethanol (95%, 10 mL), potassium hydroxide (5 g) and water (8 mL). Cool the receiver in dry ice/isopropanol bath. Place a separatory funnel over the reaction vessel and charge the funnel with Diazald® (5.0 g, 23 mmol) in ether (45 mL). Warm the apparatus to 65 °C. Add the Diazald® solution over 20 minutes. When finished add another 10 mL of ether and continue the distillation until the yellow color disappears. The ether will contain 700 mg to 900 mg (16.6 mmol to 21.4 mmol) of DM (Method according to Sigma-Aldrich bulletin A180). DM was stored at −80 °C in sealed 10 mL aliquots, and was used within a month of preparation.
2.7 Preparation of denatured microsomal extract
Pooled microsomes were prepared from the livers of 10 male Sprague-Dawley rats (120-170 g). The animals were euthanized, their livers excised and homogenized in 0.25 M sucrose solution containing 0.1 mM ethylenediaminetetraacetic acid (EDTA). The microsomal fraction was prepared by differential centrifugation, at 10,000 × g for 20 min, and then at 100,000 × g for 1 h. The microsomal pellet was resuspended in the sucrose solution and then denatured by adding isopropanol (37 mL), hydrochloric acid (100 mL, 1mM), and sodium chloride (5 g) in nanopure water (100 mL); the mixture was extracted using diethyl ether (250 mL). The extract was homogenized by vortexing (5 min), the layers where separated, and the organic layer dried using MgSO4. Solvent was evaporated using nitrogen and replaced with 100 mL acetonitrile/methanol (9:1, v:v), aliquoted and the extract stored at −80 °C until use.
2.8 GC-MS analysis
Analysis of the derivatization mixtures were carried out on a Thermo Trace 2000 GCMS (Thermo Fisher, San Jose, CA, USA) coupled with a Thermo Voyager inert MS detection and auto sampler (Thermo AS 3000). 5 μL aliquots were injected split less. The injection temperature was set at 225 °C. Separation was performed on a SLB-5ms capillary column (60 m × 0.25 mm I.D., 0.25 μm film thickness). Helium was used as the carrier gas at a flow of 1.2 mL/min. The split was opened after 2 min. The column temperature was programmed from 50°C to 250°C with 5°C/min. The final temperature was held for twenty minutes. Detection was based on EI-MS in the single ion monitoring mode (SIM) selecting for six masses (218, 236, 255, 272, 289 and 306). Hydrogen was used as reagent gas at a flow of 3 mL/min. The ion source temperature was 200°C. Supplementary figure 3 displays a typical GC chromatogram at an analyte concentration of 10 μmol.
2.9 Validation of the F-tagged MeO-PCBs analogues as internal standards
A mixture composed of MeO-F-PCBs (4’-MeO-CB-3-F3, 3’-MeO-CB-3-F3, 2’-MeOCB-3-F3, 4’-MeO-CB-13-F3, 4’-MeO-CB-8-F3, 4-MeO-CB-39-F3’) and MeO-PCBs (4’-MeO-CB-3, 3’-MeO-CB-3, 2’-MeO-CB-3, 4’-MeO-CB-8, 4’-MeO-CB-13, 4-MeO-CB-39) (each analyte 10 μmol) were dissolved in ethyl acetate (1 mL) as stock solution I. An aliquot (5 μL) of stock solution I was added to the microsomal extract (1 mL) (real matrix) and to acetonitrile/methanol (9:1 v:v) (1 mL) (reference matrix), homogenized (vortexed, 10 min) and kept at +4 °C in the dark until use. The analytical process for both matrices was followed according to the O-methylation with TMS-DM, see Figure 2. The relative responses of the compounds were determined before and after extraction. These numbers where normalized and parent CB response was divide by internal standard response.
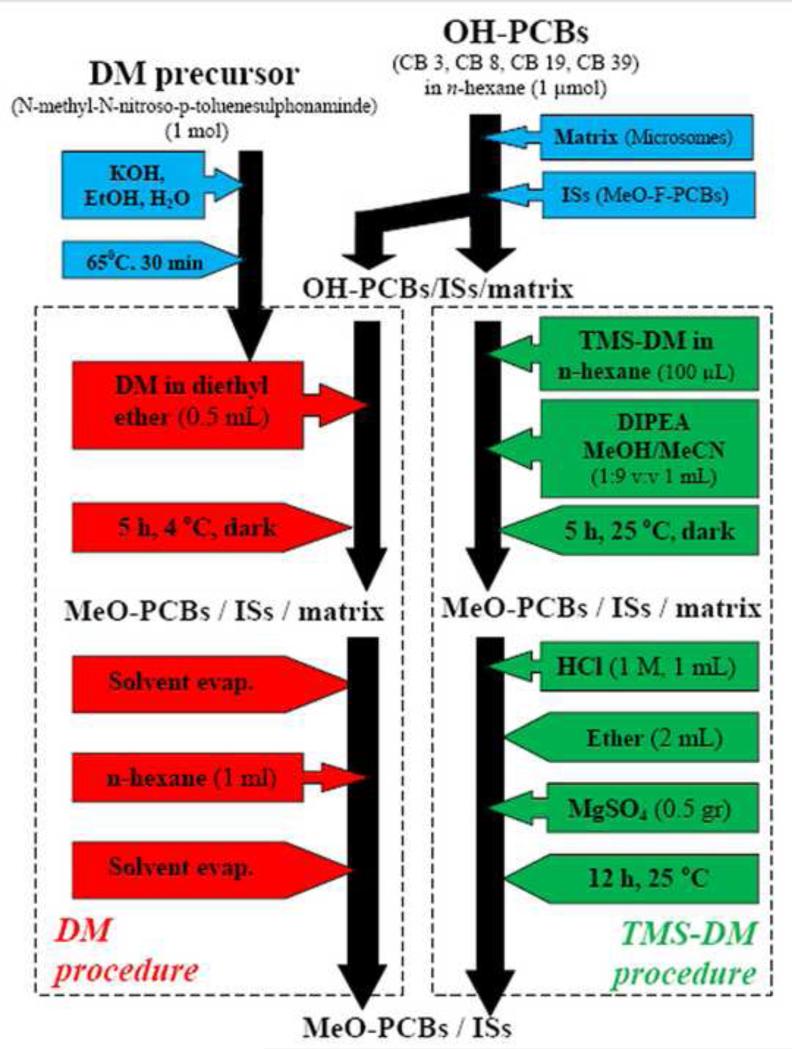
Figure 2.
General workflow chart showing the DM and TMS-DM derivatization procedures.
2.10 Stock solution for O-methylation of OH-PCBs with DM and TMS-DM
A mixture composed of MeO-F-PCBs (4’-MeO-CB-3-F3, 3’-MeO-CB-3-F3, 2’-MeOCB-3-F3, 4’-MeO-CB-13-F3, 4’-MeO-CB-8-F3, 4-MeO-CB-39-F3’) and OH-PCBs (4’-OH-CB-3, 3’-OH-CB-3, 2’-OH-CB-3, 4’-OH-CB-8, 4’-OH-CB-13, 4-OH-CB-39) (each analyte 10 μmol) were dissolved in ethyl acetate (1 mL) as stock solution II. An aliquot (5 μL) of stock solution II was added to the microsomal extract (1 mL) (real matrix) and to acetonitrile/methanol (9:1 v:v) (1 mL) (reference matrix), homogenized (vortexed, 10 min) and kept at +4°C in the dark until use; these solutions are further referred to as spiked matrices. Final concentration of each standard and analyte is 5 μM.
2.11 O-methylation with DM
1 mL Aliquots of the spiked matrices were derivatized by DM in diethyl ether (0.5 mL, 0.07 M). The reaction mixture was kept at +40C for 3-4 h under stirring in the dark. Excess DM and diethyl ether was evaporated under a gentle stream of nitrogen, see Figure 2. The total volume was corrected to 1 mL with n-hexane and transferred to GC vials for analysis. To investigate the time line of the reaction, an aliquot (20 mL) of spiked matrix was derivatized with DM (10 mL, 0.07 M). Aliquots (1 mL) were taken at 0, 1, 7.5, 15, 30, 60, 120, 240, 1440 min; the procedure followed according to Figure 2.
2.12 O-methylation with TMS-DM
To 1 mL aliquots of the spiked matrices, DIPEA (80 mg, 62.6 μL, (0.62 mmol) and TMS-DM solution (100 μL, 0.76 mmol, 2 M) in n-hexane were added with stirring at room temperature. The reaction mixture was stirred for 24 h at room temperature in the dark. Hydrochloric acid (1 mL, 1 M) was added to terminate the reaction, and diethyl ether (1 mL) was added for extraction. The organic layer was dried over MgSO4. Please see Figure 2. To investigate the time line of the reaction, an aliquot (20 mL) of spiked matrix was derivatized with DIPEA (1.6 g, 12.4 mmol) and TMS-DM (2 mL, 15.2 mmol). Aliquots (2 × 1 mL) were taken at 0, 1, 7.5, 15, 30, 60, 120, 240, 1440 min, the procedure followed according to Figure 2.
2.13 Optimization of O-methylation with TMS-DM
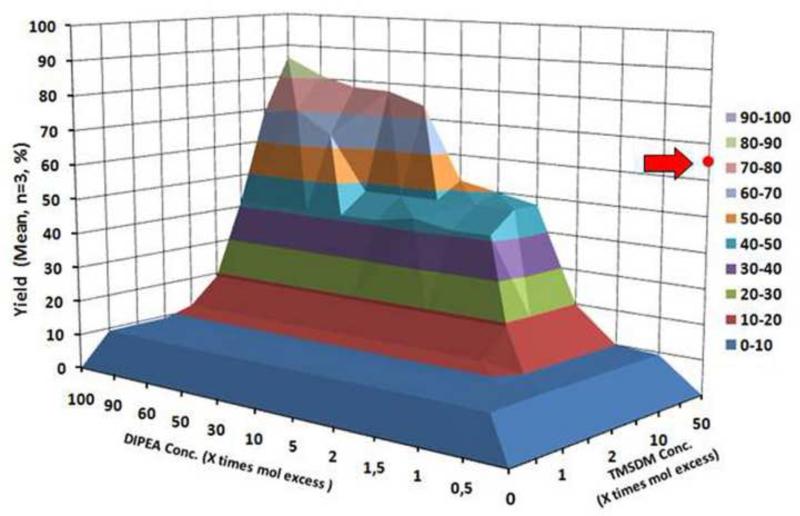
To 1 mL aliquots of the spiked matrices excess TMS-DM and DIPEA were added. Please see Figure 4.
Figure 4.
Reaction optimization chart, with the DIPEA (base) mole excess plotted on the X axis and the TMS-DM (reagent) mole excess plotted on the Y axis. Yield represents mean of all six analytes measured 3 times individually. The red dot represents a derivatization of the same matrix with DM at 40 time excess and NO DIPEA. Both reaction were carried out in a real matrix (MeCN/MeOH (9:1) + denatured microsomal fraction extract). Standard deviation varies between 0.002 and 0.2.
2.14 Comparison of derivatization capability
To 1 mL aliquots of the spiked matrices, the DM and TMS-DM methods were applied under optimal conditions to compare both reactions on a statistical level. The statistical comparison was done using the Pearson correlation test.
2.15 Cost comparison
To compare the cost advantages of the TMS-DM and the DM methods, estimates were compiled based on the initial costs, e.g. stirrers, preparation apparatus, etc; and on the cost per reaction, e.g. chemicals and person hours. Prices for chemicals where converted into their various units and the costs were calculated for a single and multiple reactions. The manufacture's website (http://www.acros.com, http://www.sigmaaldrich.com) was used as a reference and no specific discounts for universities or large corporations were taken into account. Salary per hour was based on a “Postdoctoral fellow” at the University of Iowa in 2008.
2.16 Hazard analysis
A hazard analysis was carried out for both DM and TMS-DM applying the Preliminary Hazard Analysis method as described by (USDOD, 2000; Mohr, 2002). We identified the three most prominent hazards encountered during the application of both reagents: 1) explosion of solution or vapors of the chemicals, 2) spill of the chemicals, and 3) exposure to the chemicals. For each hazard, we considered the potential hazard target including equipment damage, personal injury, downtime, and leaks into the environment. We estimated the risk level (severity and probability) for each potential hazard target. The severity was estimated on a scale from catastrophic to negligible, and the probability was estimated on a scale from frequent to improbable. Countermeasures recommended by OSHA were identified and the magnitudes of risk before and after these countermeasures were inventoried. The authors used official Material Safety Data Sheets, previous publications, work experience, and professional judgment in the identification of hazards and the classification of associated risks.
3. Results and Discussion
3.1 Congener reaction profiles
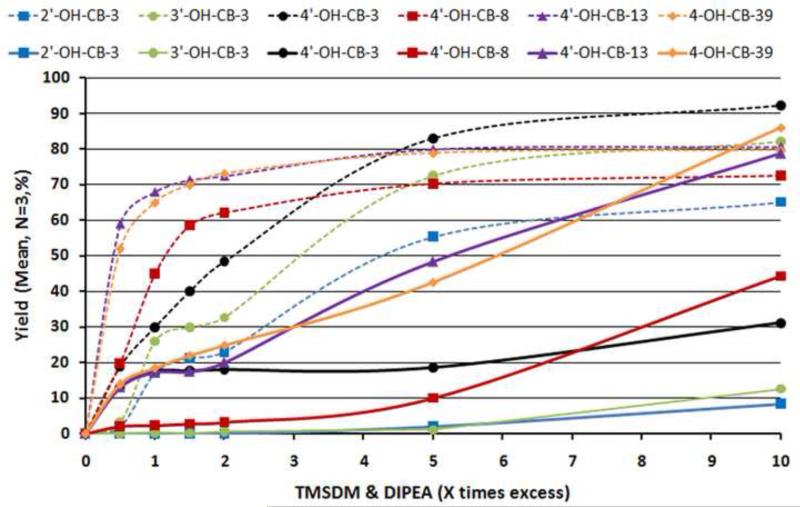
The differences in reaction yields for the different analytes (2’-OH-CB-3, 3’-OH-CB-3, 4’-OH-CB-3, 4’-OH-CB-13, 4’-OH-CB-8, 4-OH-CB-39) (for synthesis and characterization see supporting materials) in the reference and real matrices with a 10 times excess of reagents are shown in Figure 3. In this experiment, MeO-F-PCBs (for synthesis and characterization see supporting materials) were used as internal standards. In general reaction yields in the real matrix were far lower than values found for the reference matrix at equal reaction conditions (time: 24 h, TMS-DM & DIPEA excess 0.5 – 10 ×). Lower chlorinated OH-PCBs (4’-OH-CB-3, 3’-OH-CB-3, 2’-OH-CB-3) showed yields of around 10%, while higher chlorinated phenols (4-OH-CB-39 and 4’-OH-CB-13) reached comparable yields to the reference matrix (80%). The difference in yields and reaction times are due to higher pKa or acidity of the phenol groups by negative inductive effect of the chlorines. The di-ortho-chloro-substituted 4-OH-CB-39, with the lowest pKa value of our model compounds (calculated using software obtained from www.acdlabs.com/products/phys_chem_lab), showed the fastest reaction, and the highest reaction yield followed by the mono-ortho-chloro-substituted 4’-OH-CB-13. The effect of the meta-chloro-substituent in 4’-OH-CB-8 on the acidity of the hydroxy group was clearly lower, resulting in the lowest reaction turn-over of the three congeners. The difference between the OH-CB-3s is due to the position of the hydroxy group in relation to the chlorophenyl substituent on the second phenyl ring, determining the acidity of the hydroxy-group. Steric effects are secondary to acidity when looking at reaction kinetics.
Figure 3.
Yields of the derivatization of OH-PCBs (2’-OH-CB-3, 3’-OH-CB-3, 4’-OH-CB-3, 4’-OH-CB-13, 4’-OH-CB-8, 4-OH-CB-39) by TMS-DM at various conc. of TMS-DM and DIPEA in a real matrix (MeCN/MeOH (9:1) + denatured microsomal fraction extract) (solid line) compared to a reference matrix (MeCN/MeOH (9:1) (dotted line) determined by GC-MS, utilizing MeO-F-PCBs analogues (4’-MeO-CB-3-F3, 3’-MeO-CB-3-F3, 2’-MeO-CB-3-F3, 4’-MeO-CB-13-F3, 4’-MeO-CB-8-F3, 4-MeO-CB-39-F3’) as internal standards. The reaction time was a constant 24 h. Standard deviation range was between 0.002 and 0.2 %.
3.2 Effects of excess DIPEA
Excess of DIPEA increased yields in the real matrix from 50% (5 times excess), up to 80% (30 times and above) determined on an average basis of all six analytes. As seen in Figure 4, the optimum was reached with an 85 % average yield of the six analytes in real matrix with a 50 times excess of TMS-DM and 100 times DIPEA; This is higher than reactions with DM (65%).
3.3 Validation of F-tagged PCBs as internal standards
The recovery factors after extraction with diethyl ether of the investigated MeO-PCBs (for synthesis and characterization see supporting materials) were between 79 % and 95 % in the reference matrix and between 55% and 91% in the real matrix. Standard deviations were within 0.02 to 0.04 % determined using MeO-F-PCBs as internal standards. Recovery factor determination of internal standards and derivatized analytes were determined in matrix between 0.998 and 1.002. Results are shown in supplementary Figure 2.
3.4 Congener kinetics
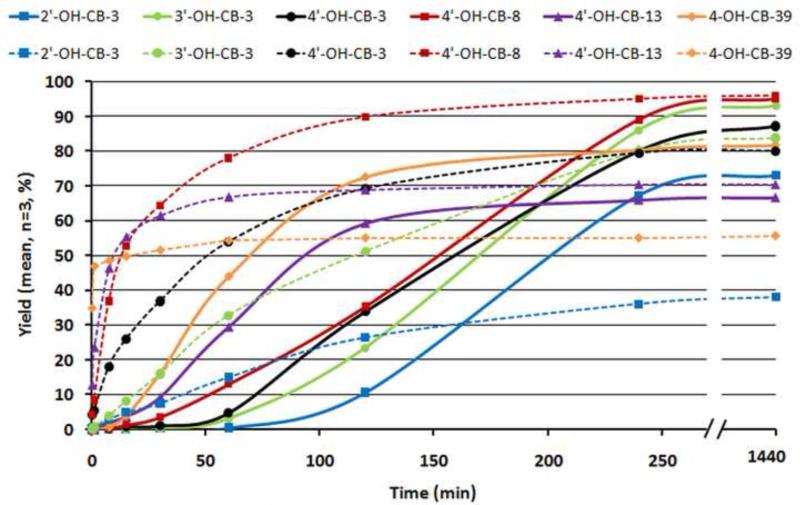
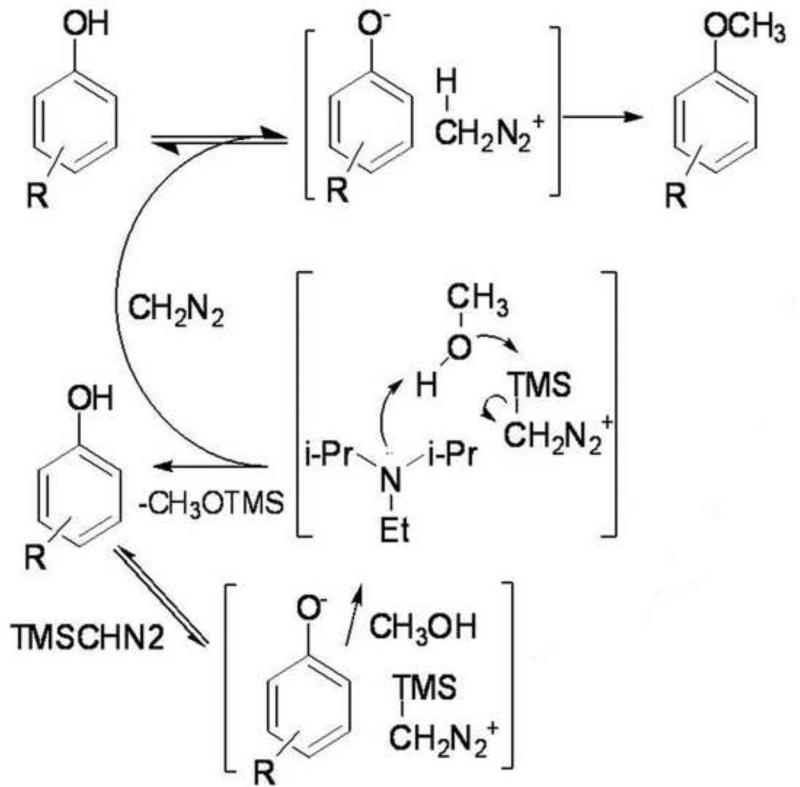
The general kinetic trend; seen in Figure 5, shows that reactions with DM reach their maximum yield after 50 min, a yield reached with TMS-DM after 100 to 250 min depending on the substitution pattern. Taking into account the fact that derivatizations utilizing DM are, in most cases, carried out over night (8 to 15 h), the difference in reaction time between the methods are equalized. More interestingly, for all OH-PCBs investigated, reactions with TMS-DM demonstrated comparable or higher yields at an incubation time of 250 min and beyond. The difference in the reaction slopes is due to the different mechanisms followed by the reagents. While DM reacts spontaneously with the phenols, TMS-DM needs to be activated by the base DIPEA prior to reacting with the phenol, (see Figures 6) resulting in a sigmoid reaction increase.
Figure 5.
Comparison of the derivatization reagent (TMS-DM) (solid line) with the conventional reagent (DM) (dotted line) over time, exhibiting the different kinetics and yields of both reagent with model compounds (2’-OH-CB-3, 3’-OH-CB-3, 4’-OH-CB-3, 4’-OH-CB-13, 4’-OH-CB-8, 4-OH-CB-39). MeO-F-PCBs (4’-MeO-CB-3-F3, 3’-MeOCB-3-F3, 2’-MeO-CB-3-F3, 4’-MeO-CB-13-F3, 4’-MeO-CB-8-F3, 4-MeO-CB-39-F3’) were used as IS.
Figure 6.
Proposed reaction mechanism of the O-methylation with TMS-DM and DM as based on Kuehnel et al, 2007. The mechanism shows the abstraction of a hydrogen from the phenol with subsequent in situ generation of diazomethane which after a second hydrogen abstraction can react with the hydroxyl group of the analyte to form a methoxy derivate.
3.5 Cost analysis
To compare the cost of performing the derivatization reaction with either reagent, a detailed list of the initial costs for equipment and reagent preparation, and the individual running costs for each reagent was inventoried (Table 1). The initial costs were approximately $400 higher for DM compared to TMS-DM, due to the purchase of additional equipment to prepare fresh quantities of DM. While the costs for derivitizing a single sample were $ 0.90 lower for DM ($7.54) compared with TMS-DM ($8.47), this does not translate in lower costs for the overall method. For small lab scale experiment of approximately 100 samples, the costs are $ 600 lower when TMS-DM is used ($1,577.14, DM: $2,324.04). This trend continues when larger sample volumes are derivatized; $2,300 for 1,000 samples (DM: $12,561.54, TMS-DM: $9,200.14) and $29,500 for 10,000 samples (DM: $114,936.54, TMS-DM: $85,430.14).
Table 1.
Diazomethane (DM)
| Initial costs ($) | Reaction Costs ($) | ||||
|---|---|---|---|---|---|
| Equipment | Cost($) | Item | Cost($)/unit | Quantity | Cost($) |
| Stirrer | 726.60 | Labor | 30.00/h | 0.15h | 4.50 |
| Stirrer bar | 3.54 | KOH | 0.04/g | 0.05 g | 0.01 |
| Flask | 42.90 | EtOH | 0.01/ml | 0.09ml | 0.01 |
| Funnel | 120.00 | Ether | 0.01 /ml | 0.50ml | 0.01 |
| Total | 1186.54 | Diazald | 0.64 Ig | 0.05 g | 0.03 |
| Tube | 1/reaction | 1 tube | 1.00 | ||
| Screwcap | 1/reaction | 1 cap | 1.00 | ||
| Labor / (100 samples) | 90.00 | Isopropanol | 0.05/ml | 0.45ml | 0.02 |
| Mini diazald | 293.50 | Dryice | 0.80g | 1g | 0.80 |
| total | 383.50 | Nitrogen | 160/2000 psi | 2 psi | 0.16 |
| Total | 1570.04 | Total | 7.54 | ||
| Trimethylsilyldiazomethane (TMS DM) | |||||
|---|---|---|---|---|---|
| Initial costs ($) | Reaction Costs ($) | ||||
| Equipment | Cost($) | Item | Cost($) /unit | Quantity | Cost($) |
| Stirrer | 726.60 | Labor | 30.00/h | 0.20h | 6.00 |
| Stirrer bar | 3.54 | DIPEA | O.55/g | 0.08g | 0.04 |
| Total | 730.14 | Ether | 0.01 /ml | 2.00ml | 0.03 |
| MqSO2 | 0.10/g | 1.00 g | 0.10 | ||
| MeCN | 0 05/ml | 0.90ml | 0.05 | ||
| MeOH | 0 05/ml | 0.10ml | 0.00 | ||
| Tube | 1/reaction | 1 tube | 1.00 | ||
| Screwcop | 1/reaction | 1 cap | 1.00 | ||
| TMS-DM | 2.45/ml | 0.10ml | 0.25 | ||
| Total | 730.14 | Total | 8.47 | ||
| Cost ($) / sample volume | TMS-DM | DM |
|---|---|---|
| 100 samples | 1,577.14 | 2,324.04 |
| 1,000 samples | 9,200.14 | 12,S61.S4 |
| 10,000 samples | 85,430.14 | 114,936.S4 |
3.6 Hazard analysis
To evaluate the risks involved of using either TMS-DM or DM as a derivatizing reagent, a preliminary hazard analysis was performed, as shown in Table 2. The use of TMS-DM as reagent virtually eliminates the explosion risk associated with the use of DM. The explosion risk is present with TMS-DM only in extreme situations, such as additional heating. The TMS-DM reagent is sold commercially as a solution in hexanes. While the reagent TMS-DM itself adds no risk of explosion; the hexane is classified as highly flammable (NIOSH, 2005).
Table 2.
| Hazard | Target effect | risk category | |||||
|---|---|---|---|---|---|---|---|
| DM method | TMS–DM method | ||||||
| Beforecounter measures | After counter measures | Before counter measures | After counter measures | ||||
| DM | DM | TMS-DM | DIPEA | TMS-DM | DIPEA | ||
| Explosion | Equipment damage or destruction | lb | lc | lllc | lVe | llld | lVe |
| Personal injury to operator or others | lb | lc | llc | lVe | llc | lVe | |
| Downtime ot laboratory space | lb | llc | llc | lVe | lld | lVe | |
| Leak of toxic compounds into environment | llld | llld | lllc | lVe | llld | lVe | |
| Spill | Personal injury to operator or others | lb | lc | llc | lllc | llc | lllc |
| Downtime of laboratory space | lllb | lllc | lllb | lVb | lllc | lVc | |
| Leak of toxic compounds into environment | llld | llld | lllc | llld | lllc | llld | |
| Exposure | Personal injury to operator or others | llb | llc | llb | lllb | llc | lllc |
| Leak of toxic compounds into environment | llld | llld | llb | lllb | lllc | lllc | |
The risk level related to spills is high with the use of DM, as any DM spill involves the risk of explosion. The inhalation risk from airborne contaminants is considerable for both reagents. The OSHA Permissible Exposure Limit (PEL) for DM is 0.2 ppm. No PEL has been issued for TMS-DM. There is no OSHA PEL issued for DIPEA. With general laboratory countermeasures, hazardous exposures to DIPEA are minimized. Overall even after countermeasures, the explosion hazard associated with DM remained in the high hazard zone, where it would be imperative to suppress the risk to a lower level.
4. Conclusions
As demonstrated in these experiments, derivatization with TMS-DM produces comparable results to the generally and routinely used DM for the derivatization of phenolic analytes. Derivatization using TMS-DM results in higher yields under optimized conditions. This occurs in clean samples as well as matrices, (microsomal fraction from rat liver). Use of TMS-DM as a derivatization reagent is cost effective with an estimated reduction of up to 25% in material and labor costs. TMS-DM is also safer, based on the preliminary hazard analysis. The reduced risks of explosion and health effects favor TMSDM as the reagent of choice on both low and high sample volume experiments and routine analysis. Since derivatization of phenols is carried out on a routine basis in a wide variety of disciplines, these results will be of major importance for several fields of research, including toxicology, pharmacy, analytical and medicinal chemistry, environmental and forensic sciences and public and occupational health.
Supplementary Material
Risk category coding:
Green Low: operation permissible using customary laboratory safety measures.
Yellow Medium: operation requires caution and strict adherence to counter measures
Red High: operation requires suppressing risk to a lower level
Severity classification:
Catastrophic. Death, loss exceeding $1M, or irreversible severe environmental damage that violates regulation.
Critical. Permanent partial disability, loss between $200K and $1M, or reversible environmental damage that violates regulation.
Marginal. Lost-time injury or illness, loss between $10K and $200K, or mitigatible environmental damage without violation of regulation.
Negligible. Non-lost-time injury or illness, loss up to $10K, or minimal environmental damage not violating regulation.
Frequency classification:
Frequent
Probable
Occasional
Remote
Improbable
Acknowledgments
This research was supported by the Alexander von Humboldt Foundation, Bonn, Germany, the National Institute of Environmental Health Sciences (P42 ES 013661 and P30 ES 05605), United States Environmental Protection Agency (RD-2902102) and the National Institute for Occupational Safety and Health through the University of Iowa Great Plains Center for Agricultural Health (U50 OH 07548). We thank Dr. Lynn Teesch and Vic Parcell of the University of Iowa High Resolution Mass Spectrometry Facility for their excellent support during GC-MS analysis.
Footnotes
Publisher's Disclaimer: This is a PDF file of an unedited manuscript that has been accepted for publication. As a service to our customers we are providing this early version of the manuscript. The manuscript will undergo copyediting, typesetting, and review of the resulting proof before it is published in its final citable form. Please note that during the production process errors may be discovered which could affect the content, and all legal disclaimers that apply to the journal pertain.
References
- Aoyama T, Terasawa S, Sudo K, Shioiri T. New methods and reagents in organic synthesis 46. Trimethylsilyldiazomethane - a convenient reagent for the o-methylation of phenols and enols. Chemical & Pharmaceutical Bulletin. 1984;32(9):3759–3760. [Google Scholar]
- Bergman A, Klasson Wehler E, Kuroki H, Nilsson A. Synthesis and mass spectrometry of some methoxylated PCB. Chemosphere. 1995;30(10):1921–1938. [Google Scholar]
- Espandiari P, Glauert HP, Lehmler HJ, Lee EY, Srinivasan C, Robertson LW. Initiating activity of 4-chlorobiphenyl metabolites in the resistant hepatocyte model. Toxicological Sciences. 2004;79:41–46. doi: 10.1093/toxsci/kfh097. [DOI] [PubMed] [Google Scholar]
- Halket JM, Zaikin VG. Derivatization in mass spectrometry-3. Alkylation (arylation). European Journal of Mass Spectrometry. 2004;10(1):1–19. doi: 10.1255/ejms.619. [DOI] [PubMed] [Google Scholar]
- Hayes AW. Principles and Methods of Toxicology. 3rd. Philadelphia: 2001. [Google Scholar]
- Hovander L, Malmberg T, Athanasiadou M, Athanassiadis L, Rahm S, Bergman A, Wehler EK. Identification of hydroxyllated PCB metabolites and other phenolic halogenated pollutants in human blood plasma. Archives of Environmental Contamination and Toxicology. 2002;42(1):105–117. doi: 10.1007/s002440010298. [DOI] [PubMed] [Google Scholar]
- Klösener J, Peters TM, Adamcakova-Dodd A, Teesch LM, Thorne PS, Robertson LW, Luthe G. Innovative Application of Fluoro Tagging To Trace Airborne Particulate and Gas-Phase Polybrominated Diphenyl Ether Exposures. Chemical Research in Toxicology. 2009;22(1):179–186. doi: 10.1021/tx8003032. [DOI] [PMC free article] [PubMed] [Google Scholar]
- Kraimer JA. Comparison of two different derivatization procedures for the determination of urinary chlorophenol excretions. Fresenius J Anal Chem. 1995;(351) [Google Scholar]
- Kuehnel E, Laffan DDR, Lloyd-Jones GC, del Campo TM, Shepperson IR, Slaughter JL. Mechanism of methyl esterification of carboxylic acids by trimethylsilyldiazomethane. Angewandte Chemie-International Edition. 2007;46(37):7075–7078. doi: 10.1002/anie.200702131. [DOI] [PubMed] [Google Scholar]
- Lehmann L, Esch HL, Kirby PA, Robertson LW, Ludewig G. 4-monochlorobiphenyl (PCB3) induces mutations in the livers of transgenic Fisher 344 rats. Carcinogenesis. 2007;28:471–478. doi: 10.1093/carcin/bgl157. [DOI] [PubMed] [Google Scholar]
- Lehmler H-J, Robertson LW. Synthesis of hydroxylated PCB metabolites with the Suzuki-coupling. Chemosphere. 2001;45(8):1119–1127. doi: 10.1016/s0045-6535(01)00052-2. [DOI] [PubMed] [Google Scholar]
- Luthe G, Ramos L, Dalluge J, Brinkman UAT. Monofluorinated analogues of polycyclic aromatic hydrocarbons as internal standards for GC-MS in environmental analysis. Chromatographia. 2003;57(5-6):379–383. [Google Scholar]
- Luthe GM, Schut BG, Aaseng JE. Monofluorinated analogues of polychlorinated biphenyls (F-PCBs): Synthesis using the Suzuki-coupling, characterization, specific properties and intended use. Chemosphere. 2009;77:1242–1248. doi: 10.1016/j.chemosphere.2006.02.029. [DOI] [PubMed] [Google Scholar]
- McLean MR, Bauer U, Amaro AR, Robertson LW. Identification of catechol and hydroquinone metabolites of 4-monochlorobiphenyl. Chemical Research in Toxicology. 1996;9(1):158–164. doi: 10.1021/tx950083a. [DOI] [PubMed] [Google Scholar]
- Mohr R. Prelimenary Hazard Analysis. 5th ed. 2002 [Google Scholar]
- NIOSH (National Institute of Safety and Health) The Registry of Toxic Effects of Chemical Substances. 2008 [Google Scholar]
- NIOSH (National institutes for occupational safety and health) Pocket Guide to Chemical Hazards. 2005 http://www.cdc.gov/niosh/npg.
- Park Y, Albright KJ, Cai ZY, Pariza MW. Comparison of methylation procedures for conjugated linoleic acid and artifact formation by commercial (trimethylsilyl)diazomethane. Journal of Agricultural and Food Chemistry. 2001;49(3):1158–1164. doi: 10.1021/jf001209z. [DOI] [PubMed] [Google Scholar]
- Podlech J. Trimethylsilyldiazomethane (TMS-CHN2) and lithiated trimethylsilyldiazomethane - Versatile substitutes for diazomethane. Journal Fur Praktische Chemie-Chemiker-Zeitung. 1998;340(7):679–682. [Google Scholar]
- Qiu XH, Mercado-Feliciano M, Bigsby RM, Hites RA. Measurement of polybrominated diphenyl ethers and metabolites in mouse plasma after exposure to a commercial pentabromodiphenyl ether mixture. Environmental Health Perspectives. 2007;115(7):1052–1058. doi: 10.1289/ehp.10011. [DOI] [PMC free article] [PubMed] [Google Scholar]
- Sigma-Aldrich S, Diazald MNNG. Diazomethane generators. Sigma Aldrich Technical bulletin (AL-180) [Google Scholar]
- USDOD (United States department of defense) Standard practice for system safety MIL STD-882D [Online] 2000 http://safetycenter.navy.mil/instructions/osh/milstd882d.pdf.
- USDOL (United States department of labor) OCCUPATIONAL SAFETY AND HEALTH GUIDELINE FOR DIAZOMETHANE. 2000 [Google Scholar]
- Warr L. D. P. a. A. J. Development of a Continuous Process for the Industrial Generation of Diazomethane. Organic Process Research & Development. 2002;6:884–892. [Google Scholar]
Associated Data
This section collects any data citations, data availability statements, or supplementary materials included in this article.


