

Abstract
The Fosb gene encodes subunits of the activator protein-1 transcription factor complex. Two mature mRNAs, Fosb and ΔFosb, encoding full-length FOSB and ΔFOSB proteins respectively, are formed by alternative splicing of Fosb mRNA. Fosb products are expressed in several brain regions. Moreover, Fosb-null mice exhibit depressive-like behaviors and adult-onset spontaneous epilepsy, demonstrating important roles in neurological and psychiatric disorders. Study of Fosb products has focused almost exclusively on neurons; their function in glial cells remains to be explored. In this study, we found that microglia express equivalent levels of Fosb and ΔFosb mRNAs to hippocampal neurons and, using microarray analysis, we identified six microglial genes whose expression is dependent on Fosb products. Of these genes, we focused on C5ar1 and C5ar2, which encode receptors for complement C5a. In isolated Fosb-null microglia, chemotactic responsiveness toward the truncated form of C5a was significantly lower than that in wild-type cells. Fosb-null mice were significantly resistant to kainate-induced seizures compared with wild-type mice. C5ar1 mRNA levels and C5aR1 immunoreactivity were increased in wild-type hippocampus 24 hours after kainate administration; however, such induction was significantly reduced in Fosb-null hippocampus. Furthermore, microglial activation after kainate administration was significantly diminished in Fosb-null hippocampus, as shown by significant reductions in CD68 immunoreactivity, morphological change and reduced levels of Il6 and Tnf mRNAs, although no change in the number of Iba-1-positive cells was observed. These findings demonstrate that, under excitotoxicity, Fosb products contribute to a neuroinflammatory response in the hippocampus through regulation of microglial C5ar1 and C5ar2 expression.
Keywords: Neuroinflammation, Kainic acid, AP-1 transcription factors
Introduction
FBJ osteosarcoma oncogene B (FOSB), a FOS family protein, heterodimerizes with JUN family proteins to form activator protein-1 (AP-1) transcription factor complexes that regulate gene expression within multiple signaling pathways and functional outcomes (Chinenov and Kerppola, 2001; Jochum et al., 2001; Wagner and Eferl, 2005). Two mature mRNAs, Fosb and ΔFosb, are formed by alternative splicing of the Fosb gene, thus producing multiple protein products (Nakabeppu and Nathans, 1991; Metz et al., 1994; Ohnishi et al., 2011). Because there are two translation initiation sites (Sabatakos et al., 2008), each of the mRNAs is translated into two proteins (FOSB and vFOSB from Fosb mRNA, ΔFOSB and Δ2ΔFOSB from ΔFosb mRNA, Fig. 1). The major translation products of the two mRNAs are FOSB and ΔFOSB, which have been reported to differentially regulate target genes as subunits of distinct AP-1 complexes (Nakabeppu and Nathans, 1991; McClung and Nestler, 2003). However, their precise functions in vivo remain unclear.
Figure 1.

Genomic organization of the mouse Fosb gene, and its transcripts (Fosb and ΔFosb mRNAs) and translation products (FOSB, vFOSB, ΔFOSB, and Δ2ΔFOSB proteins) are shown. Yellow box; FH, N-terminal Fos homology domain; light blue box; BZIP, basic region and leucine zipper; blue box; C-TA, C-terminal transactivation domain; orange box; TBP-BD, TBP-binding domain. Each pair of dotted lines indicates the splicing of each intron and a red box indicates an “exonic intron” in exon 4, which is alternatively spliced out (red dotted lines). The black line shows primer position; primer set A (Fosb [A]) is for qPCR analysis of total Fosb mRNAs; primer set B (Fosb [B] is for RT-PCR analysis of Fosb and ΔFosb mRNAs (Table 1).
ΔFOSB, a lesser extent FOSB, are expressed in specific regions of normal brain, such as the nucleus accumbens, dorsal striatum, dentate gyrus of hippocampus and cerebral cortex (Ohnishi et al., 2011). Fosb-null mice exhibit depressive-like behaviors (Ohnishi et al., 2011) and adult-onset spontaneous epilepsy (Yutsudo et al., 2013), demonstrating the importance of Fosb gene products in neurological and psychiatric disorders. Moreover, FOSB and ΔFOSB expression is dramatically induced in response to numerous stimuli, especially in the striatum, hippocampus, and cerebral cortex. Notably, chronic cocaine treatment or chronic seizures induce the selective accumulation of ΔFOSB (Hope et al., 1994; Hiroi et al., 1998; Kelz et al., 1999), whereas excitotoxicity induced by kainate or forebrain ischemia induces expression of FOSB and ΔFOSB (Mandelzys et al., 1997; Kurushima et al., 2005; Yutsudo et al., 2013). These observations indicate that FOSB and ΔFOSB have important roles during the neurodegenerative process as well as in normal brain function. To date, several down-stream targets of FOSB and ΔFOSB have been identified: e.g., Cdk5, GluR2, Nfkb1 and Pdyn in the striatum (Chen et al., 2000; Bibb et al., 2001; McClung et al., 2004; Nestler, 2008), and Gal, Trh and Penk in the hippocampus (Yutsudo et al., 2013). Expression and functions of these genes has been primarily studied in neurons, and little is known about functions of FOSB and ΔFOSB in glial cells.
Recently, it has been reported that glial cell functions are altered in psychiatric disorders, including autism, schizophrenia, and depression (Cotter et al., 2001). Importantly, neuroinflammation is involved in not only these psychiatric diseases (Vargas et al., 2005; Monji et al., 2009; Anisman and Hayley, 2012), but also in neurodegenerative diseases and epilepsy (Liu and Hong, 2003; Block and Hong, 2005; Vezzani et al., 2013). We thus hypothesized that Fosb gene products are involved in the regulation of glial cell functions. In this study, we focused on Fosb gene function in glial cells and found that expression levels of Fosb and ΔFosb mRNAs in microglia are equivalent to those in hippocampal neurons. We then explored downstream targets of Fosb gene products by microarray analysis of isolated wild-type and Fosb-null microglia.
Materials and Methods
Mice
Fosb+/G mice with a null-mutant allele (FosbG) and Fosb+/d mice with a Fosbd allele encoding ΔFOSB and Δ2ΔFOSB but not FOSB and vFOSB were established and maintained by backcrossing to C57BL/6J mice (Clea Japan Inc., Tokyo, Japan), as described previously (Ohnishi et al., 2008; Ohnishi et al., 2011). Fosb+/FN embryonic stem (ES) cell clones with a FosbFN allele encoding FOSB and vFOSB, but not ΔFOSB or Δ2ΔFOSB, and with a neomycin resistant gene cassette (Ohnishi et al., 2008), were injected into blastocysts prepared from C57BL/6J mice. Established FosB+/FN mice were crossed with mice carrying Meox2-cre, to obtain Fosb+/F mice carrying the FosbF allele encoding FOSB and vFOSB, but not ΔFOSB or Δ2ΔFOSB, without the neomycin resistant gene cassette. The Fosb+/F mouse line was maintained by backcrossing to C57BL/6J mice. To yield homozygous mutant mice, Fosb+/d (N24 generation) or Fosb+/G (N20 generation) mice were intercrossed. Fosb+/F (N7 generation) mice, in which all chromosomes except chromosome 7 carrying the Fosb locus were confirmed to be replaced by those derived from C57BL/6J using the speed congenic method (Markel et al., 1997), were also intercrossed. Genotyping of each allele was performed as previously described (Ohnishi et al., 2008). Homozygous mutant mouse lines FosbG/G (Fosb-null), Fosbd/d and FosbF/F were maintained by inbreeding. C57BL/6J mice were used as wild-type controls for all experiments. All animals were maintained in an air-conditioned, specific pathogen-free room with a time-controlled lighting system. The handling and killing of animals were carried out in accordance with nationally prescribed guidelines. Ethical approval for the study was granted by the Animal Care and Use Committee of Kyushu University, Fukuoka, Japan and of Mount Sinai, NYC, USA.
Primary culture of microglia and astrocytes
Primary microglial cells and astrocytes were prepared from the cerebral cortex of 2-day-old mice. Isolation of microglial cells has been described previously (Ifuku et al., 2007). Mixed glial cells were cultured in DMEM high glucose medium (Life Technologies Japan, Tokyo, Japan) supplemented with 10% FBS, 100 U/ml penicillin, 100 μg/ml streptomycin and 5 μg/ml insulin, in 75-cm2 flasks coated with Poly-D-lysine (PDL) (Sigma-Aldrich Japan, Tokyo, Japan), and the medium changed every three days. On the 10th day, microglial cells were isolated by shaking (80 rpm, 37°C, 10 min), and floating microglial cells were collected. After centrifugation, microglia were resuspended in medium and cultured. Microglia were harvested after 24 h. The cell composition of the cultures was checked by immunostaining using anti-GFAP (Mouse monoclonal anti-GFAP, G-A-5, 1:1500, Sigma-Aldrich Japan), anti-NeuN (mouse monoclonal anti-NeuN, A60, 1:250, Merck Millipore, Billerica, MA, USA), and anti-Iba-1 (rabbit polyclonal anti-Iba-1, 1:1000, Wako, Osaka, Japan). Cultures containing more than 95% Iba-1-positive cells were used (data not shown). For primary astrocyte cultures, mixed glial cells were cultured in PDL-coated dishes, and the medium changed every three days. On the 10th day, 8 μM 1-β-D-arabino-furanosylcytosine (AraC) (Wako) was added to the medium. On the 13th day, 75 mM L-Leucine methyl ester (Sigma-Aldrich Japan) was added to the cultures for 60 min, to remove microglial cells (Hamby et al., 2006). Astrocytes were harvested 24 h after L-Leucine methyl ester treatment. Only GFAP-positive cells, and no F4/80 (rat monoclonal anti-F4/80 antibody, CI:A4-1, 1:1000, SEROTEC, Oxford, UK) positive cells, were observed (data not shown).
Primary culture of hippocampal neurons
Primary hippocampal neurons were prepared from E18.5 mouse embryos (Brewer et al., 1993). After isolation, hippocampal tissue was treated with trypsin-EDTA solution (0.006% trypsin, 25 μM EDTA and 20 U/ml DNase I in Hanks’ balanced salt solution). Trypsinization was stopped by the addition of 10% inactivated FBS. After centrifugation, cells were suspended in medium (Neurobasal medium with B-27; Life Technologies Japan, 100 U/ml penicillin, 100 μg/ml streptomycin and 2 mM L-glutamine), and filtered through a 40 μm cell strainer. Cells were cultured in PDL-coated dishes. Two days after plating, 5 μM AraC, in medium, was added to the medium and cells were incubated for 2 days. Subsequently half of the medium was changed every 3 days. On the 8th day, half of the medium was changed and hippocampal neurons were harvested 24 h later. 80% of cells were NeuN-positive and 3% were GFAP-positive, and no Iba-1-positive cells were observed (data not shown).
Chemotaxis assay
The ChemoTx® Disposable Chemotaxis system (Neuro Probe, Inc, Gaithersburg, MD, USA) was used to examine the chemotaxis of cultured microglia in vitro. The lower wells were filled with serum-free DMEM with or without 120, 60, or 12 ng/ml C5a (R&D Systems, Inc., Minneapolis, MN, USA), 120, 60, or 12 ng/ml C5adesArg (Hycult Biotec, Uden, the Netherlands), or 100 μM ATP (Sigma-Aldrich Japan). After the framed filter (8-μm pore) was placed over the filled wells, 4.8 × 10⁴ cells were added to the upper wells. After 30-min incubation, the filter was washed in PBS and fixed in 100% methanol in addition to wiping away the cells in the upper well. Cells on the filter were stained with Giemsa stain solution (Wako), and digital images were acquired using an AxioImager microscope, equipped with an AxioCam HRc camera (Carl Zeiss Microimaging Japan, Tokyo, Japan) using a 20 x bright field objective. The number of microglial cells that had moved onto the filter was counted using Image J 1.42q (National Institutes of Health, Bethesda, MD, USA). Three independent experiments were performed.
Kainate treatment
Saline or 25 mg/kg kainate (Wako) dissolved in saline was administered to ten-week-old male mice by intraperitoneal injection. To estimate the degree of epileptiform seizure, we observed mice for 90 min after kainate administration, and scored the seizure according to previously described criteria: 0, no reaction; 1, arrest of motion; 2, myoclonic jerks of the head and neck with brief twitching movements; 3, unilateral clonic activity; 4, bilateral forelimb tonic and clonic activity; and 5, generalized tonic-clonic activity with loss of postural tone and death from continuous convulsion (Yang et al., 1997; Kajitani et al., 2009). Mice were sacrificed 24 h after kainate administration for further analysis.
RNA extraction and quantitative real-time PCR (qPCR)
Total RNA was extracted using ISOGEN (Nippon Gene, Tokyo, Japan), according to the manufacturer’s instructions. cDNA was synthesized using the High Capacity cDNA Reverse Transcription Kit (Life Technologies Japan). Quantitative real time PCR was performed using the Thunderbird qPCR kit (Toyobo, Osaka, Japan) and a Thermal Cycler Dice® Real Time System Single (Takara Bio, Shiga, Japan). The ΔΔCT method was used to calculate relative values, with Gapdh as an internal control, which did not alter under the experimental conditions used. Primer sets used in the present study are listed in Table 1.
Table 1.
Primers used for PCR analysis
| Primer set | Upstream (5’-3’) | Downstream (5’-3’) |
|---|---|---|
| qPCR | ||
| Gapdh | AAATGGTGAAGGTCGGTGTG | TGAAGGGGTCGTTGATGG |
| Fosb [A] | GCTCCCGGTGTAGCTCATCA | CTGAAGATCCTGGCTGGTTGTG |
| C5ar1 | GTCCTGTTCACGACCGTTTT | ACGGTCGGCACTAATGGTAG |
| C5ar2 | CTACCGTAGGCTGCTTCAGG | AGCCAAAGAGGAATCGAACA |
| Il1b | TGCACTACAGGCTCCGAGAT | AGGCCACAGGTATTTTGTCGT |
| Il6 | ACTTCACAAGTCGGAGGCTT | GCAAGTGCATCATCGTTGTTC |
| Tnf | TGTCCCTTTCACTCACTGGC | CATCTTTTGGGGGAGTGCCT |
|
| ||
| RT-PCR | ||
| Fosb [B] | GAAGAGACACTTACCCCAGAAG | CTCCTTGTTCCTTGCGGGTTTG |
Microarray analysis
Total RNA isolated with ISOGEN was cleaned up using RNeasy Mini kits (Qiagen KK, Tokyo, Japan). Expression profiles were determined using Affymetrix Mouse Gene 1.0 ST arrays (Affymetrix Japan, Tokyo, Japan), according to the manufacturer’s instructions. The Ambion WT Expression Kit (Ambion, Austin, TX, USA) and the GeneChip WT Terminal Labeling and Controls Kit (Affymetrix) were used to generate amplified and biotinylated sense-strand DNA targets from entire expressed transcripts (100 ng of total RNA). Manufacturer’s instructions were followed for the hybridization, washing and scanning steps. CEL files were generated and imported into GeneSpring GX software (version 11.5.1, Agilent Technologies, Palo Alto, CA, USA) for further data characterization, as described previously (Dan et al., 2008). Microarray data were deposited in the GEO database (accession number GSE40714).
Western blotting
Western blotting analysis was performed as described previously (Ohnishi et al., 2011). Cell pellets or hippocampal tissues were lysed in 2 x SDS sample buffer (125 mM Tris-HCl pH 6.8, 4% SDS, 10% glycerol) and sonicated. After centrifugation (15,000 x g, 4°C, 15 min), protein concentrations of the supernatants were determined using the DC Protein Assay kit (Bio-Rad Laboratories, Hercules, CA, USA). Samples were diluted in 1 x SDS sample buffer with 2-mercaptoethanol and bromophenol blue (BPB), boiled, separated on 12.5% SDS-polyacrylamide gels, and then transferred to Immobilon-P membranes (Merck Millipore). The membranes were washed with TBST buffer [10 mM Tris (pH 7.5), 150 mM NaCl and 0.1% Tween 20], and blocked in TBST buffer containing 5% BSA. Membranes were treated with rabbit monoclonal anti-FOSB (5G4) (1:1000; Cell Signaling Technology Japan, K.K., Tokyo, Japan) or mouse monoclonal anti-GAPDH (1:100000; Merck Millipore), and then horseradish peroxidase (HRP)-conjugated anti-rabbit IgG (1:10000; Merck Millipore) or HRP-conjugated anti-mouse Ig (1:2500; BD Biosciences, San Jose, CA, USA). Membranes were washed in TBST buffer and bound antibodies were visualized using Immobilon® Western HRP Detection Substrate (Merck Millipore). Digitized images were obtained with the LAS1000 Plus Luminescent Image Analyzer (Fuji Film, Tokyo, Japan).
Immunostaining
Animals were deeply anesthetized with pentobarbital (100 mg/kg, i.p.) then perfused intracardially with saline followed by 4% paraformaldehyde in PBS. Brains were removed and immersed in 4% paraformaldehyde, followed by 20% and 30% sucrose in PBS, for 24 h each at 4°C. The brains were embedded in Tissue-Tek® O.C.T compound (Sakura Finetek Co. Ltd. Tokyo, Japan) and frozen. Serial coronal sections (40 μm thickness) were prepared using a cryostat and collected as free-floating sections. After incubating with Block Ace (DS Pharma Biomedical Co., Ltd., Tokyo, Japan) for 30 min at room temperature, sections were incubated with rabbit polyclonal anti-Iba-1 (1:1000), rat monoclonal anti-C5aR1 (1:100, BIO-RAD Laboratories), rat monoclonal anti-CD68 (1:50, BIO-RAD Laboratories), or mouse monoclonal anti-Ki67 antibody (1:100, Leica Microsystems GmbH, Wetzler, Germany)at 4°C overnight, and then with an appropriate second antibody [Alexa Fluor® 488 Goat Anti-Rat IgG (H+L), Alexa Fluor® 488 Goat Anti-Mouse IgG (H+L), Alexa Fluor® 594 Goat Anti-Rabbit IgG (H+L) Antibody;1:300, Invitrogen] for 45 min at room temperature. The sections were further incubated with 0.05 μg/ml DAPI (Sigma-Aldrich Japan KK) for 10 min at room temperature, and mounted on slides with Vectashield (Vector Laboratories, Burlingame, CA, USA). Confocal immunofluorescence images were acquired using a laser scanning confocal microscope system, LSM510 META or LSM700 (Carl Zeiss MicroImaging Japan, Tokyo, Japan). The region of interest was selected in the CA3 region, including the stratum lucidum, and pyramidal layer. For C5aR1 and Iba-1 double immunostaining, individual plane images were acquired, while for CD68 or Ki67 and Iba-1 double immunostaining, projection images of z-stack series (Z step, 21 μm; 15 planes for low magnification, Z step, 30 μm; 30 planes for high magnification) were acquired. All sections from each experimental animal in the groups to be compared were processed in parallel. From each animal, six coronal sections, 160 μm apart (bregma -1.46 to -2.48 mm) were prepared from three mice from each group. To count CD68 positive microglial cells, 120 Iba-1 positive cells in each individual animal were selected without CD68 signals using Image J. Then, the expression levels of CD68 were evaluated in each Iba-1 positive cell, as Level 0 to Level 2: Level 0; completely CD68-negative, Level 1; exhibiting less than six CD68 positive dots in a single cell body, Level 2; carrying more than five CD68 positive dots or homogeneous immunoreactivity in a cell body. Three mice from each group were prepared for this analysis.
Morphological analysis of microglia
Confocal immunofluorescence images for Iba-1 were analyzed using Image J. Sixty microglial cells were analyzed in each mouse (n = 3). The images were converted to binary images, and the Iba-1 positive cell body area was measured. To count the number of processes in the Iba-1 positive cells, Iba-1 positive processes derived from each individual cell body were counted. The thickness of individual processes was measured at the boundary between each process and the cell body.
Counting Iba-1 positive cells using unbiased stereological counting techniques
To count Iba-1 positive microglia, free-floating sections were processed for immunohistochemistry using an anti-Iba-1 antibody (1:500) according to previously described methods (Kajitani et al., 2006). After visualization of peroxidase reaction product using 3’3’-diaminobenzidine-tetrahydrocloride (DAB) (Vector Laboratories), sections were stained with Mayer’s Hematoxylin (Muto Pure Chemicals, Tokyo, Japan) to detect cell nuclei and delineate the boundary of the hippocampal region. The sections were mounted on slides with Glycergel® Mounting Medium (Dako, Glostrup, Denmark). From each individual animal, six coronal sections, 160 μm apart (bregma -1.46 to -2.48 mm), were prepared following systematic random sampling. The number of Iba-1 positive cells in the hippocampal CA3 region, including the stratum lacunosum-moleculare, stratum radiatum, stratum lucidum, and pyramidal layer (Long et al., 1998) were counted blind, using the fractionator program of the Stereo Investigator system (MBF Bioscience, Williston, VT) (Yutsudo et al., 2013). For estimates of microglia density in the CA3 region, the area sampling fraction (asf) = 0.174 mm2 [a(step) = 0.0144 mm2; a(frame) = 0.0025 mm2]. Five mice of each group were examined.
Statistical analysis
All results are expressed as the mean ± SEM. Statistical analysis for all data except microarray data was performed using JMP® Pro 9.0.2 software (SAS Institute, Cary, NC, USA). Each method of statistical analysis is shown in detail in each figure legend. Microarray data were compared using unpaired t-test using GeneSpring GX software. A value of p < 0.05 was considered statistically significant.
Results
Expression of the Fosb gene in microglia, astrocytes and neurons
Primary microglia and astrocytes from the cerebral cortex, and neurons from the hippocampus, were prepared from neonatal C57BL/6J mice to analyze the expression of the Fosb gene. RNA was extracted from the cells and relative levels of total Fosb mRNAs were compared using qPCR (Fig. 2A). Total Fosb mRNA levels were approximately the same in microglia and hippocampal neurons. In astrocytes, total Fosb mRNA levels were 40% lower than in microglia and neurons. Because expression of Fosb gene products in microglia, in contrast to neurons, has not previously been characterized, we investigated Fosb gene function in microglia. We isolated microglia from the cerebral cortex of wild-type and Fosb-null mice and examined expression levels of Fosb and ΔFosb mRNAs by RT-PCR using a primer set amplifying the alternatively spliced region in exon 4. In wild-type microglia, two RT-PCR products corresponding to the Fosb and ΔFosb mRNAs, respectively, were detected, but none were detected in Fosb-null microglia (Fig.2B).
Figure 2.

Quantitative detection of Fosb and ΔFosb mRNAs in isolated cortical microglia, astrocytes and hippocampal neurons. A. Relative expression levels of total Fosb mRNAs in wild-type microglia, neurons and astrocytes. Relative expression levels of total Fosb were estimated using microglial expression as a standard. Error bars show mean ± SEM. B. Agarose gel electrophoresis of Fosb PCR products in wild-type (WT) and Fosb-null (Null) microglia. PCR amplification results in different size fragments of Fosb (624 bp) and ΔFosb (484 bp). Control PCR reactions contain pBSKS(-)Fosb and pBSKS(-)ΔFosb plasmids (Nakabeppu and Nathans, 1991), either in combination (lane Fosb+ΔFosb) or individually (lanes Fosb and ΔFosb), and were used to amplify Fosb and ΔFosb.
Microarray analysis of wild-type and Fosb-null microglia
To identify genes whose expression is controlled by Fosb gene products in microglia, we performed microarray analysis using RNA prepared from wild-type and Fosb-null microglia. The expression levels of six genes were significantly altered with a fold change of ≥1.5 (ANOVA, p < 0.05; Table 2), and all six genes were significantly decreased in Fosb-null microglia, compared with wild-type (Table 2). Among these six genes, we focused on C5ar1 and C5ar2. C5ar1 showed the highest raw expression levels in wild-type microglia. Both C5ar1 and C5ar2 encode complement C5a receptors (Klos et al., 2009; Ward, 2009). C5a is the final product of a complement pathway that is a part of the innate immune system. C5a has strong chemoattractant activity (Guo and Ward, 2005), and thus controls microglial motility (Nolte et al., 1996).
Table 2.
List of genes for which expression was significantly altered between microglia derived from wild-type and Fosb-null mice.
| Expression change | Raw expression level (Mean ± SD) | |||
|---|---|---|---|---|
|
|
||||
| Gene | Null/WT | Fold decrease* | WT | FosB-null |
| Apoc2 | down | 4.45 | 996.1 ± 48.8 | 223.4 ± 5.1 |
| C5ar2 | down | 3.39 | 885.2 ± 64.8 | 260.6 ± 11.7 |
| C5ar1 | down | 1.83 | 7917.8 ± 326.3 | 4330.8 ± 126.7 |
| Zfp111 | down | 1.73 | 524.4 ± 30.4 | 302.7 ± 11.1 |
| Vmn2r29 | down | 1.70 | 301.3 ± 13.0 | 177.6 ± 13.3 |
| Ercc2 | down | 1.51 | 777.3 ± 25.5 | 513.9 ± 5.3 |
Fold change ≥ 1.5 with p < 0.05 (unpaired t-test).
Expression of C5ar1 and C5ar2 genes and their functional significance in cultured microglia
To confirm the microarray data, we analyzed expression levels of C5ar1 and C5ar2 mRNAs using qPCR. Expression levels of C5ar1 and C5ar2 mRNAs in Fosb-null microglia were significantly decreased compared with those in wild-type (Fig. 3A & B). The C5ar1 and C5ar2 genes encode C5a anaphylatoxin chemotactic receptor 1 (C5aR1) and 2 (C5aR2), respectively. Strong C5aR1 immunoreactivity was found in the plasma membrane of cultured wild-type microglia, while no C5aR1 immunoreactivity was detectable in Fosb-null microglia (Fig. 3C).
Figure 3.

Expression of C5ar1 and C5ar2 in isolated microglia, astrocytes and hippocampal neurons. A & B. Relative expression levels of C5ar1 (A) and C5ar2 (B) mRNAs in wild-type (WT) and Fosb-null (Null) microglia. Relative expression levels were estimated using the expression level in wild-type as a standard. * p < 0.0001 (Student’s t-test). Error bars show mean ± SEM. C. C5aR1 expression in cultured microglia. Cultured microglia isolated from wild-type (WT) and Fosb-null (Null) mice were subject to laser scanning confocal immunofluorescence microscopy. Blue, DAPI; green, Iba-1; red, C5aR1. Scale bar = 20 μm. D. Chemotaxis assay of wild-type (WT) and Fosb-null (Null) microglia. Number of cells moved means the number of cells traversing the porous membrane. Each experiment was independently repeated three times. Ctrl, without any chemoattractant; C5a and C5adesArg, 120, 60, or 12 ng/ml of C5a or C5adesArg, respectively; ATP, 100 μM ATP. Fosb-null microglia exhibited significantly reduced chemotaxis towards 60 ng/ml C5adesArg but not C5a or ATP, compared with wild-type * p = 0.033 (Student’s t-test). Error bars show mean ± SEM. E & F Relative expression of C5ar1 (E) and C5ar2 (F) mRNAs in microglia, neurons and astrocytes. Relative expression levels were estimated using the expression level in astrocytes as a standard. E. One way ANOVA (F2,6 = 165.13, p <0.0001, * p < 0.0001, Tukey-Kramer HSD post hoc comparison). F. One way ANOVA (F2,6 = 68.64, p <0.0001, * p = 0.0001, Tukey-Kramer HSD post hoc comparison). Error bars show mean ± SEM. To quantify the expression level of each mRNA, total RNA was reverse-transcribed to cDNA and used for qPCR analysis using appropriate primer sets (Table 1).
Furthermore, we performed chemotaxis assays using the ChemoTx® Disposable Chemotaxis system with or without ATP, C5a and C5adesArg (Fig. 3D). When cultured microglial cells were exposed to ATP, equivalent numbers of wild-type and Fosb-null cells moved towards the ATP, indicating that Fosb deficiency has no effect on the basic motility of cells. When exposed to C5a at concentration of 12 to 120 ng/ml, Fosb-null microglia exhibited similar motility to wild-type microglia. In contrast, microglia exposed to C5adesArg exhibited dose-dependent motility, and Fosb-null microglia exhibited attenuated motility towards C5adesArg compared with wild-type microglia (Fig. 3D), thus suggesting that Fosb may be involved in the regulation of microglial function. C5adesArg is the desarginated form of C5a, and has higher affinity to C5aR2 than to C5aR1, while C5a binds to both C5aR1 and C5aR2 with similarly high affinity (Cain and Monk, 2002; Klos et al., 2009).
To compare the expression levels of C5ar1 and C5ar2 between the microglia, neurons and astrocytes, we examined levels of these two mRNAs in isolated microglia, astrocytes, and hippocampal neurons from wild-type mouse brains. Expression levels of both C5ar1 and C5ar2 mRNAs were highest in microglia, much lower in neurons and no expression was observed in astrocytes (Fig. 3E & F), indicating that C5ar1 and C5ar2 are mainly expressed in microglia in the mouse brain.
Fosb deficiency reduces basal and kainate-induced expression of C5ar1 and C5ar2 in the hippocampus
It has been reported that kainate can induce expression of both Fosb products and C5aR1 in the hippocampus (Mandelzys et al., 1997; Osaka et al., 1999; Yutsudo et al., 2013). Kainate is an agonist for kainate-class ionotropic glutamate receptors, and systemic administration of kainate to mice induces excitotoxity, neurodegeneration and neuroinflammation (Wang et al., 2005).
To investigate the in vivo effect of Fosb deficiency in microglia, particularly in the neuroinflammatory state, kainate or saline was systemically administered to wild-type and Fosb-null mice. Western blot analysis of hippocampal extracts revealed that kainate treatment increases ΔFOSB protein levels and to a lesser extent FOSB protein levels in wild-type but not Fosb-null hippocampus (Fig. 4A). Compared with wild-type, basal levels of C5ar1 mRNA were significantly decreased in Fosb-null hippocampus, and in kainate-treated hippocampus the C5ar1 mRNA level was less than 40% of the level detected in the wild-type condition (Fig. 4B). Basal levels of C5ar2 mRNA in Fosb-null hippocampus were likewise significantly decreased compared with wild-type; however, C5ar2 levels were not increased after kainate treatment (Fig. 4C).
Figure 4.
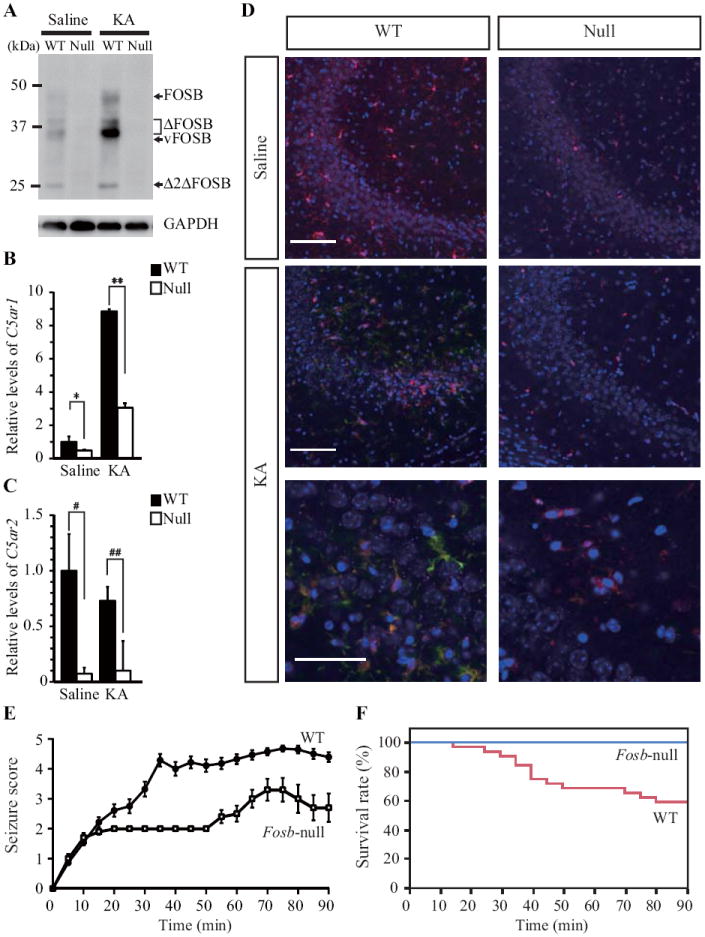
Fosb-dependent expression of C5ar1 and C5ar2 in mouse hippocampus. A. Western blotting of Fosb gene products. FOSB, 43 kDa; ΔFOSB, 34-37 kDa; vFOSB, 31 kDa (see Fig. 7A); Δ2ΔFOSB, 25 kDa; GAPDH protein was detected as an internal control. B & C. Expression levels of C5ar1 (B) and C5ar2 (C) mRNAs in wild-type (WT) and Fosb-null (Null) hippocampus, 24 h after saline, or kainate (KA) injection. Relative expression levels were estimated using the expression level in wild-type hippocampus treated with saline as a control. * p = 0.0059, ** p = 0.0089, # p = 0.0128, ## p < 0.0001 (Student’s t-test). Error bars show mean ± SEM. To quantify the expression level of each mRNA, total RNA was reverse-transcribed to cDNA and used for qPCR analysis using appropriate primer sets (Table 1). D. Inducible expression of C5aR1 in hippocampal CA3 region after kainate administration. Coronal sections prepared from wild-type (WT) and Fosb-null (Null) mouse brains were subjected to laser scanning confocal immunofluorescence microscopy with anti-C5aR1 and anti-Iba-1 antibodies. Nuclei were counter-stained with DAPI. Top panels: Merged images of samples 24 h after saline injection. Scale bar = 100 μm. Middle panels: Merged images of samples 24 h after kainate injection. Scale bar = 100 μm. Bottom panels: High magnification images of samples 24 h after kainate injection. Blue, DAPI; green, C5aR1; red, Iba-1. Scale bar = 50 μm. E. Seizure responses after kainate administration. Fosb-null mice exhibited significantly reduced seizure responses to kainate-induced excitotoxicity compared with wild-type mice (Generalized Linear Model, Difference; p < 0.0001, χ2=821.7, df = 39, Genotype; p < 0.0001, time; p < 0.0001, Interaction; p < 0.0001, WT N = 28, Fosb-null N = 10). Error bars show mean ± SEM. F. Survival rate after kainate administration. No Fosb-null mice died within 90 min after kainate administration (Kaplan-Meier method and log-rank test, p = 0.012, χ2 = 6.14, df = 1; WT, N = 32; Fosb-null, N = 12).
Laser scanning confocal immunofluorescence microscopy revealed that C5aR1 expression was induced in the CA3 region of wild-type but not Fosb-null hippocampus after kainate treatment (Fig. 4D). The hippocampal CA3 region is the most sensitive region to excitotoxicity induced by kainate administration (Pollard et al., 1994; Rogove and Tsirka, 1998), and microglial cells are known to be activated 24 hours after kainate administration (Chen et al., 2005). In the CA3 region of kainate-treated wild-type hippocampus, most C5aR1 immunoreactivity was colocalized with Iba-1 immunoreactivity, indicating that activated microglia in wild-type but not Fosb-null hippocampus express C5aR1, as we observed in cultured microglia in vitro (Fig. 3A & C).
We then observed the seizure response of mice during the 90 minutes after kainate administration. Wild-type mice exhibited a severe seizure response within 35 min after kainate administration, and typically showed score 4 or 5 seizures (Fig. 4E). Forty percent of wild-type mice died within 90 min (Fig. 4F). In contrast, Fosb-null mice exhibited a relatively mild seizure response within 60 min after kainate administration, and showed seizure scores below 4 (Fig. 4E). No death of Fosb-null mice was observed within 90 min after kainate administration (Fig. 4F). We thus concluded that Fosb-null mice acquired resistance to kainate-induced excitotoxicity compared with wild-type mice.
Attenuated neuroinflammatory response in Fosb-null hippocampus after kainate treatment
It has been reported that C5a induces a proinflammatory response (Rittirsch et al., 2008; Ward, 2009), and that complement activation and neuroinflammation occur after brain injuries (Woodruff et al., 2010). To evaluate whether Fosb deficiency affects microglial activation, we examined CD68 immunoreactivity in the hippocampus as a marker for activated microglia. CD68 is an oxidized LDL-binding protein and is highly expressed in activated microglia performing phagocytosis (Streit and Xue, 2009). CD68 immunoreactivity was found in both kainate-treated wild-type and Fosb-null hippocampal CA3 regions but only low levels were observed in both saline-treated wild-type and Fosb-null hippocampal CA3 regions (Fig. 5A). This immunoreactivity was mostly colocalized with that of Iba-1 (Fig. 5B). We then compared the percentages of CD68-positive microglial cells in the hippocampal CA3 regions between wild-type and Fosb-null mice (Fig. 5C). More than 90% of microglia detected in untreated wild-type or Fosb-null CA3 regions exhibited no (Level 0) or weak (Level 1) CD68 immunoreactivity. After kainite administration, percentages of microglia with a strong CD68 immunoreactivity (Level 2) were significantly increased in wild-type but not Fosb-null CA3 regions.
Figure 5.

Attenuated microglial activation in Fosb-null hippocampus 24 h after kainate administration. A. Detection of activated microglia in hippocampal CA3 region 24 h after kainate injection. Coronal sections prepared from wild-type (WT) and Fosb-null (Null) mouse brains were subjected to laser scanning confocal immunofluorescence microscopy with anti-CD68 and anti-Iba-1 antibodies. Nuclei were counter-stained with DAPI. Top panels: Merged z-staked images of samples 24 h after saline injection. Bottom panels: Merged z-stacked images of samples 24 h after kainate injection. Blue, DAPI; green, CD68; red, Iba-1. Scale bars = 100 μm. B. Higher magnification images of Figure 5A. Scale bars = 50 μm. C. The percentages of double CD68 and Iba-1 positive cells in Fosb-null (Null) CA3 regions 24 h after kainate administration compared with those in wild-type (WT). Level 0 (Lv. 0); completely CD68-negative cells, Level 1 (Lv. 1); exhibiting less than six CD68-positive dots in a single cell body, Level 2 (Lv. 2); carrying more than five CD68-positive dots or homogeneous immunoreactivity in a cell body. One way ANOVA (F3,8 = 26.35 , p = 0.0002 (Lv.2), F3,8 = 25.01, p = 0.0002 (Lv.1), * p = 0.0002, ** p = 0.003, # p = 0.0003, ## p = 0.0021, Tukey-Kramer HSD post hoc comparison). D. Microglial cell body areas in Fosb-null (Null) CA3 regions 24 h after kainate administration compared with those in wild-type (WT). One way ANOVA (F3,716 = 274.38, p < 0.0001, * p < 0.0001, Tukey-Kramer HSD post hoc comparison). E. Number of microglial processes in Fosb-null (Null) CA3 regions 24 h after kainate administration, compared with those in wild-type (WT). One way ANOVA (F3,716 = 64.96, p < 0.0001, * p < 0.0001, Tukey-Kramer HSD post hoc comparison). F. Thickness of microglial processes in Fosb-null CA3 regions 24 h after kainate administration compared with those in wild-type (WT). One way ANOVA (F3,716 = 91.61, p < 0.0001, * p < 0.0001, Tukey-Kramer HSD post hoc comparison). G. Reduced expression of Il1b, Il6, and Tnf mRNAs in Fosb-null (Null) hippocampus 24 h after kainate administration, compared with wild-type (WT). Saline, 24 h after saline injection; KA, 24 h after kainate injection. Relative expression levels were estimated using the expression level in wild-type treated with saline as a control. One way ANOVA [F3,8 = 10.98, p = 0.0033, * p = 0.0426, Hsu’s multiple comparisons with best (MCB)]. One way ANOVA (F3,8 = 31.50, p < 0.0001, # p = 0.0025, Tukey-Kramer HSD post hoc comparison). Error bars show mean ± SEM. To quantify expression level of each mRNA, total RNA was reverse-transcribed to cDNA and used for qPCR analysis using appropriate primer sets (Table 1).
It has been documented that activated microglia reduce the complexity of their shape by shortening (retracting) the branches of their processes so that they are resorbed into the cell body; the cell body thus becomes enlarged and the processes thicken (Kettenmann et al., 2011). To compare the extent of morphological changes in microglia between wild-type and Fosb-null mice, we measured microglial cell body areas and the number and thickness of their processes in the hippocampal CA3 region (Fig. 5D, E and F). After kainate administration, microglial cell body areas were markedly increased in both wild-type and Fosb-null mice; however, the extent of this increase was significantly reduced in Fosb-null mice compared with wild-type mice (Fig. 5D). Accordantly, kainite-induced increases in the number and thickness of microglial processes in Fosb-null mice were significantly attenuated compared with that in wild-type mice (Fig. 5E and F). We thus concluded that morphological changes in microglial cells induced under excitotoxicity largely depend on Fosb gene products.
Proinflammatory cytokine mRNAs, for example, Il1b, Il6 and Tnf, are known to be up-regulated during microglial activation (Zhang and Zhu, 2011). After kainate treatment, expression levels of Il6 and Tnf mRNAs were increased in wild-type hippocampus, while those in Fosb-null hippocampus were significantly lower compared to those in wild-type (Fig. 5G). We thus concluded that Fosb deficiency diminishes the neuroinflammatory response induced by kainate administration.
We further compared the density of Iba-1 positive cells in the hippocampal CA3 region between wild-type and Fosb-null mice using unbiased stereological counting techniques (Fig. 6A). There was no difference in the basal density of Iba-1 positive cells in hippocampal CA3 regions between wild-type and Fosb-null mice. An approximately 1.5-fold increase in the density of Iba-1 positive cells was observed in both wild-type and Fosb-null CA3 regions 24 hours after kainate administration. There were few Iba-1 positive cells expressing a proliferative marker, Ki67 in both wild-type and Fosb-null CA3 regions 24 hours after kainite administration (Fig. 6B & C), suggesting that Iba-1 positive cells detected in the hippocampal CA3 region after kainate administration are likely to have infiltrated from surrounding tissues or via circulation and that Fosb gene products do not affect their infiltration.
Figure 6.

Density of microglial cells in the hippocampal CA3 region was similarly increased in both wild-type and Fosb-null hippocampus 24 h after kainate administration. A. The density of Iba-1 positive cells in hippocampal CA3 region. One way ANOVA (F3,16 = 7.36, p = 0.0026, * p = 0.0178, ** p = 0.023, Tukey-Kramer HSD post hoc comparison). B & C. Detection of proliferating microglia in hippocampal CA3 region 24 h after kainate injection. Coronal sections prepared from wild-type (WT) (B) and Fosb-null (Null) (C) mouse brains were subjected to laser scanning confocal immunofluorescence microscopy with anti-Ki67 and anti-Iba-1 antibodies. Nuclei were counter-stained with DAPI. Blue, DAPI; green, Ki67; red, Iba-1. Scale bars = 50 μm.
Proteins encoded by both Fosb and ΔFosb mRNAs are required for expression of C5ar1 and C5ar2 genes in microglia
Our data demonstrated that Fosb gene products regulate the microglial expression of C5ar1 and C5ar2 genes both in vitro and in vivo. Because Fosb-null mice completely lack proteins encoded by both Fosb and ΔFosb mRNAs, we further investigated which proteins are required for expression of C5ar1 and C5ar2 genes in microglia. We have established two different mouse lines carrying a modified Fosb allele, FosbF or Fosbd; the former encodes only FOSB and vFOSB proteins and the latter encodes ΔFOSB and Δ2ΔFOSB proteins (Ohnishi et al., 2008; Ohnishi et al., 2011) (Fig. 7A).
Figure 7.

Reduced expression of C5ar1 and C5ar2 mRNAs in microglia isolated from several lines of Fosb mutant mice. A. Western blotting of Fosb gene products in wild-type (WT), Fosb-null (Null), FosbF/F (F/F), and Fosbd/d (d/d) hippocampus. FOSB, 43 kDa; ΔFOSB, 34-37 kDa; Δ2ΔFOSB, 25 kDa. vFOSB (31 kDa) was only detected in FosbF/F hippocampus. GAPDH protein was detected as an internal control. B. Expression levels of C5ar1 and C5ar2 mRNAs in wild-type (WT), Fosb-null (Null), FosbF/F (F/F) and Fosbd/d (d/d) microglial cells. Relative expression levels were estimated using the expression level in wild-type as a control. One way ANOVA (F3,8 = 14.60, p = 0.0013 (C5ar1), F3,8 = 98.10, p < 0.0001 (C5ar2), * p = 0.0026, ** p = 0.002, *** p = 0.0051, # p < 0.0001, Tukey-Kramer HSD post hoc comparison). Error bars show mean ± SEM. To quantify the expression level of each mRNA, total RNA was reverse-transcribed to cDNA and used for qPCR analysis using appropriate primer sets (Table 1).
Expression levels of C5ar1 and C5ar2 mRNAs were compared between microglia isolated from wild-type, Fosb-null, FosbF/F and Fosbd/d mice using qPCR analysis (Fig. 7B). Expression levels of C5ar1 and C5ar2 mRNAs in Fosb-null, FosbF/F and Fosbd/d microglial cells were significantly and similarly decreased compared with those in wild-type microglia. These results indicated that proteins encoded by both Fosb and ΔFosb mRNAs are required for normal expression of C5ar1 and C5ar2 genes in microglia.
Discussion
Our main conclusion is that in microglia Fosb gene products encoded by both Fosb and ΔFosb mRNAs are required for basal expression of both C5ar1 and C5ar2 genes, but only for kainate-induced expression of the C5ar1 gene, and are necessary for microglial activation in the brain. Furthermore, we showed that Fosb-null mice exhibited significant resistance to kainate-induced seizures with attenuated activation of microglia in the hippocampus.
To date, functions of Fosb gene products in brain have been characterized almost exclusively in neurons, because neurons uniquely express high levels of Fosb products in response to several brain stimuli (Hope et al., 1994; Mandelzys et al., 1997; McClung et al., 2004; Kurushima et al., 2005; Nestler, 2008; Ohnishi et al., 2011). In the present study, we revealed for the first time that the Fosb gene is also expressed in microglia as well as neurons in the brain, and regulates different target genes in each type of brain cell. Although basal levels of Fosb gene products in hippocampal neurons are low compared to their levels in striatal medium spiny neurons (Nestler, 2008), we found that in primary cultured microglial cells, total Fosb mRNA levels were as high as in primary cultured hippocampal neurons (Fig.2). Given the appreciable expression of the Fosb gene in cortical microglia, we explored downstream target genes of Fosb products in microglia using microarray analysis. Expression levels of six genes including C5ar1 and C5ar2 were significantly decreased in Fosb-null microglia compared with wild-type. We focused on C5ar1 and C5ar2, because of their function in the innate immune system.
The C5ar1 and C5ar2 genes encode C5aR1 and C5aR2, respectively; both are receptors for the anaphylatoxin C5a derived from complement C5. C5aR1 is present at the cell surface and mediates robust cell responses to C5a, while C5aR2 is predominantly intracellular and its function is still controversial (Bamberg et al., 2010; Li et al., 2013). Because microglia have higher expression levels of C5ar1 and C5ar2 mRNAs than neurons and astrocytes (Fig. 3), we further investigated properties of isolated microglia from wild-type and Fosb-null mice. Levels of both C5ar1 and C5ar2 mRNAs were significantly decreased in Fosb-null microglia, the former to less than 30% and the latter to less than 10% of wild-type microglial levels. C5aR1 immunoreactivity was detected mostly at the cell surface in wild-type microglia, and was not detected in Fosb-null microglia (Fig.3). Exposure of isolated microglia to C5a or C5adesArg, a desarginated form of C5a, induced a chemotactic response. Interestingly, a reduced chemotactic response was observed in comparison with wild-type, only when Fosb-null microglia were exposed to C5adesArg. The affinity of C5a for C5aR1 has been reported to be much higher than that of C5adesArg, and about 30% of the wild-type level of C5ar1 mRNA still remained in Fosb-null microglia, thus suggesting that the remaining C5aR1 in Fosb-null microglia might be enough to achieve a similar level of response to C5a as observed in wild-type microglia (Fig. 3D).
Two mature mRNAs, Fosb and ΔFosb, are formed by alternative splicing of the Fosb transcript in wild-type microglia (Fig. 1B). Because Fosb-null microglia express neither Fosb nor ΔFosb mRNAs, we used two different mouse lines carrying modified Fosb alleles, FosbF or Fosbd, the former encoding only FOSB and vFOSB proteins and the latter encoding only ΔFOSB and Δ2ΔFOSB proteins (Fig. 7A). Our results indicate that products produced from both Fosb and ΔFosb mRNAs play a role in regulating expression of C5ar1 and C5ar2 genes in microglia (Fig. 7B), probably through their interaction with certain cis-elements in the genes. To understand the precise molecular mechanism of the regulation, it is essential in future work to identify which forms of Fosb gene products bind such cis-elements.
In mouse hippocampus, expression of C5ar1 but not C5ar2 was highly induced in after kainate administration, although basal levels of both mRNAs were significantly decreased in Fosb-null hippocampus compared with wild-type (Fig. 4). The cultured microglial cells showed the highest expression of C5ar1 and C5ar2 among the three types of brain cells examined (Fig. 3E & F), suggesting that hippocampal expression of C5ar1 and C5ar2 can be attributed to their expression mainly in microglia. Because expression levels of both C5ar1 and C5ar2 genes were significantly decreased in microglia isolated from Fosb-null, FosbF/F and Fosbd/d mice compared with wild-type microglia (Fig. 7B), it is likely that other factor(s) are involved in kainate-induced expression of the C5ar1 gene in hippocampus. Furthermore, we investigated various aspects of microglial activation after kainate administration (Fig.5). The Fosb-null hippocampal CA3 region exhibited essentially the same density of microglial cells as seen in the wild-type with or without kainite administration (Fig. 6A). However, the Fosb-null microglia showed significant attenuation of morphological changes and expression of CD68, a marker of activated microglia with phagocytosis (Streit and Xue, 2009), upon kainate administration accompanied by decreased levels of Il6 and Tnf mRNAs in the hippocampus. We thus concluded that Fosb promotes a neuroinflammatory response through the regulation of C5ar1 and/or C5ar2 gene expression in hippocampus.
It has been shown that microglial proliferation takes place 2 to 3 days after acute neuronal injury (Ladeby et al., 2005). It is therefore likely that the increase of microglial cell density in the hippocampal CA3 region 24 hours after kainate administration resulted from cell migration or infiltration rather than from in situ-proliferation. It was reported that kainite injection into the hippocampus causes microglial activation in osteopetronic (op/op) mice in which injury-induced microglial proliferation does not take place, (Rogove et al., 2002). Excitotoxicity is thus likely to activate multiple pathways which differentially regulate microglial activation, proliferation and migration. Fosb gene products play a major role in this hippocampal microglial activation, including morphological and phagocytic changes accompanied by induction of Il6 and Tnf mRNAs (Fig. 5).
It is noteworthy that Fosb-null mice acquired significant resistance to the kainate-induced seizure response (Fig. 4E & F). In a previous study, mice deficient in Toll-like receptor 4 (TLR4) were resistant to kainate-induced seizures in which high mobility group box 1 protein (HMGB1), a proconvulsant released from neurons and glia, interacts with TLR4 (Maroso et al., 2010). In addition, C5aR2 is required for the release of HMGB1 during sepsis (Rittirsch et al., 2008). Moreover, TLR4-induced expression of proinflammatory cytokines, such as IL-6 and TNFα, is synergistically augmented by C5a (Zhang et al., 2007). Taken together with these previous findings, our data suggest that the decreased expression of C5aR1 and C5aR2 in Fosb-null microglia is responsible for the decreased acute seizure recurrence induced by kainate administration.
Neuroinflammation is a pivotal event in the CNS, especially in neurodegenerative disorders such as Alzheimer’s disease (AD) (Wyss-Coray and Mucke, 2002). In AD, accumulating amyloid-β results in complement activation and a local, chronic inflammatory response that leads to attraction and activation of glial cells, thus producing proinflammatory cytokines (Veerhuis et al., 2011). It has been shown that C5aR1 antagonists reduce neuroinflammation and AD pathology in AD mouse models (Ager et al., 2010; Woodruff et al., 2010); however, involvement of C5aR2 remains to be established. In addition, over-activated microglia mediate neurotoxicity and worsen the progression of neurodegenerative disorders such as AD (Block et al., 2007). Therefore, restriction of Fosb gene expression may prevent over-activation of microglia and slow the progression of neurodegenerative disorders.
Moreover, it has been reported that complement components C1q and C3 play an important role in activity-dependent synaptic pruning by microglia especially in the postnatal retinogeniculate system (Stevens et al., 2007; Schafer et al., 2012). Both C1q and C3 are upstream of C5a production, and C5a signaling may be involved in this mechanism. Moreover, C1q knockout mice display enhanced seizure liability (Chu et al., 2010), and Fosb-null mice display spontaneous seizures in adulthood (Yutsudo et al., 2013) and a significant delay in the development of tolerance to electroconvulsive seizures (Hiroi et al., 1998), despite their reduced sensitivity to kainate shown in the present study. Further work is needed to investigate the possibility that abnormal synapse pruning in Fosb-null mice, because of a reduction of C5aR1 and C5aR2 in microglia, contributes to their abnormal seizure activity.
In summary, Fosb gene products regulate the expression of C5ar1 and C5ar2 genes encoding complement C5a receptors in microglia. The lack of the Fosb gene causes decreased microglial activation after kainate treatment. To regulate C5ar1 and C5ar2, both FOSB and ΔFOSB proteins appear to be required. Consequently, Fosb gene products contribute to microglial activation in the brain by regulating the expression of the complement C5a receptor genes C5ar1 and C5ar2 in microglia.
Acknowledgments
Grant sponsor: JSPS KAKENHI; Grant Number:10J00463 (to H.N.), 22221004 & 23657116 (to Y.N.); Grant sponsor: NIH; R01MH51399 and P50MH096890 (to E.J.N.); Grant sponsor; Kyushu University Global COE Program (Cell-fate Decision: Function and Dysfunction in Homeostasis).
The authors thank Kevin A. Kelley and Ezekiell Mouzen (Icahn School of Medicine at Mount Sinai) for their assistance in establishing and maintaining the Fosb+/F mouse line; Michelle Tallquist (The University of Texas Southwestern Medical Center) for the gift of Meox2-cre mice; Cathy Steffen (The University of Texas Southwestern Medical Center) for maintaining Meox2-cre mice; K. Fukidome and Y. Matsuzaki (Laboratory for Technical Support, Medical Institute of Bioregulation) for microarray and sequencing analysis; and K. Nakabeppu, S. Kitamura, K. Asakawa, and T. Kuwano for technical assistance. We also thank M. Ifuku, M. Noda (Graduate School of Pharmaceutical Sciences, Kyushu University), A. Nishikimi, Y. Fukui (Division of Immunogenetics, Medical Institute of Bioregulation), and all members of our laboratory for helpful discussions.
References
- Ager RR, Fonseca MI, Chu SH, Sanderson SD, Taylor SM, Woodruff TM, Tenner AJ. Microglial C5aR (CD88) expression correlates with amyloid-ß deposition in murine models of Alzheimer’ disease. J Neurochem. 2010;113:389–401. doi: 10.1111/j.1471-4159.2010.06595.x. [DOI] [PMC free article] [PubMed] [Google Scholar]
- Anisman H, Hayley S. Inflammatory factors contribute to depression and its comorbid conditions. Sci Signal. 2012;5:pe45. doi: 10.1126/scisignal.2003579. [DOI] [PubMed] [Google Scholar]
- Bamberg CE, Mackay CR, Lee H, Zahra D, Jackson J, Lim YS, Whitfeld PL, Craig S, Corsini E, Lu B, Gerard C, Gerard NP. The C5a receptor (C5aR) C5L2 is a modulator of C5aR-mediated signal transduction. J Biol Chem. 2010;285:7633–7644. doi: 10.1074/jbc.M109.092106. [DOI] [PMC free article] [PubMed] [Google Scholar]
- Bibb JA, Chen J, Taylor JR, Svenningsson P, Nishi A, Snyder GL, Yan Z, Sagawa ZK, Ouimet CC, Nairn AC, Nestler EJ, Greengard P. Effects of chronic exposure to cocaine are regulated by the neuronal protein Cdk5. Nature. 2001;410:376–380. doi: 10.1038/35066591. [DOI] [PubMed] [Google Scholar]
- Block ML, Hong JS. Microglia and inflammation-mediated neurodegeneration: multiple triggers with a common mechanism. Prog Neurobiol. 2005;76:77–98. doi: 10.1016/j.pneurobio.2005.06.004. [DOI] [PubMed] [Google Scholar]
- Block ML, Zecca L, Hong JS. Microglia-mediated neurotoxicity: uncovering the molecular mechanisms. Nat Rev Neurosci. 2007;8:57–69. doi: 10.1038/nrn2038. [DOI] [PubMed] [Google Scholar]
- Brewer GJ, Torricelli JR, Evege EK, Price PJ. Optimized survival of hippocampal neurons in B27-supplemented Neurobasal, a new serum-free medium combination. J Neurosci Res. 1993;35:567–576. doi: 10.1002/jnr.490350513. [DOI] [PubMed] [Google Scholar]
- Cain SA, Monk PN. The orphan receptor C5L2 has high affinity binding sites for complement fragments C5a and C5a des-Arg74. J Biol Chem. 2002;277:7165–7169. doi: 10.1074/jbc.C100714200. [DOI] [PubMed] [Google Scholar]
- Chen J, Zhang Y, Kelz MB, Steffen C, Ang ES, Zeng L, Nestler EJ. Induction of cyclin-dependent kinase 5 in the hippocampus by chronic electroconvulsive seizures: role of ΔFosB. J Neurosci. 2000;20:8965–8971. doi: 10.1523/JNEUROSCI.20-24-08965.2000. [DOI] [PMC free article] [PubMed] [Google Scholar]
- Chen Z, Duan RS, Quezada HC, Mix E, Nennesmo I, Adem A, Winblad B, Zhu J. Increased microglial activation and astrogliosis after intranasal administration of kainic acid in C57BL/6 mice. J Neurobiol. 2005;62:207–218. doi: 10.1002/neu.20099. [DOI] [PubMed] [Google Scholar]
- Chinenov Y, Kerppola TK. Close encounters of many kinds: Fos-Jun interactions that mediate transcription regulatory specificity. Oncogene. 2001;20:2438–2452. doi: 10.1038/sj.onc.1204385. [DOI] [PubMed] [Google Scholar]
- Chu Y, Jin X, Parada I, Pesic A, Stevens B, Barres B, Prince DA. Enhanced synaptic connectivity and epilepsy in C1q knockout mice. Proc Natl Acad Sci U S A. 2010;107:7975–7980. doi: 10.1073/pnas.0913449107. [DOI] [PMC free article] [PubMed] [Google Scholar]
- Cotter DR, Pariante CM, Everall IP. Glial cell abnormalities in major psychiatric disorders: the evidence and implications. Brain Res Bull. 2001;55:585–595. doi: 10.1016/s0361-9230(01)00527-5. [DOI] [PubMed] [Google Scholar]
- Dan Y, Ohta Y, Tsuchimoto D, Ohno M, Ide Y, Sami M, Kanda T, Sakumi K, Nakabeppu Y. Altered gene expression profiles and higher frequency of spontaneous DNA strand breaks in APEX2-null thymus. DNA Repair. 2008;7:1437–1454. doi: 10.1016/j.dnarep.2008.05.003. [DOI] [PubMed] [Google Scholar]
- Guo RF, Ward PA. Role of C5a in inflammatory responses. Annu Rev Immunol. 2005;23:821–852. doi: 10.1146/annurev.immunol.23.021704.115835. [DOI] [PubMed] [Google Scholar]
- Hamby ME, Uliasz TF, Hewett SJ, Hewett JA. Characterization of an improved procedure for the removal of microglia from confluent monolayers of primary astrocytes. J Neurosci Methods. 2006;150:128–137. doi: 10.1016/j.jneumeth.2005.06.016. [DOI] [PubMed] [Google Scholar]
- Hiroi N, Marek GJ, Brown JR, Ye H, Saudou F, Vaidya VA, Duman RS, Greenberg ME, Nestler EJ. Essential role of the fosB gene in molecular, cellular, and behavioral actions of chronic electroconvulsive seizures. J Neurosci. 1998;18:6952–6962. doi: 10.1523/JNEUROSCI.18-17-06952.1998. [DOI] [PMC free article] [PubMed] [Google Scholar]
- Hope BT, Nye HE, Kelz MB, Self DW, Iadarola MJ, Nakabeppu Y, Duman RS, Nestler EJ. Induction of a long-lasting AP-1 complex composed of altered Fos-like proteins in brain by chronic cocaine and other chronic treatments. Neuron. 1994;13:1235–1244. doi: 10.1016/0896-6273(94)90061-2. [DOI] [PubMed] [Google Scholar]
- Ifuku M, Farber K, Okuno Y, Yamakawa Y, Miyamoto T, Nolte C, Merrino VF, Kita S, Iwamoto T, Komuro I, Wang B, Cheung G, Ishikawa E, Ooboshi H, Bader M, Wada K, Kettenmann H, Noda M. Bradykinin-induced microglial migration mediated by B1-bradykinin receptors depends on Ca2+ influx via reverse-mode activity of the Na+/Ca2+ exchanger. J Neurosci. 2007;27:13065–13073. doi: 10.1523/JNEUROSCI.3467-07.2007. [DOI] [PMC free article] [PubMed] [Google Scholar]
- Jochum W, Passegue E, Wagner EF. AP-1 in mouse development and tumorigenesis. Oncogene. 2001;20:2401–2412. doi: 10.1038/sj.onc.1204389. [DOI] [PubMed] [Google Scholar]
- Kajitani K, Yamaguchi H, Dan Y, Furuichi M, Kang D, Nakabeppu Y. MTH1, an oxidized purine nucleoside triphosphatase, suppresses the accumulation of oxidative damage of nucleic acids in the hippocampal microglia during kainate-induced excitotoxicity. J Neurosci. 2006;26:1688–1698. doi: 10.1523/JNEUROSCI.4948-05.2006. [DOI] [PMC free article] [PubMed] [Google Scholar]
- Kajitani K, Nomaru H, Ifuku M, Yutsudo N, Dan Y, Miura T, Tsuchimoto D, Sakumi K, Kadoya T, Horie H, Poirier F, Noda M, Nakabeppu Y. Galectin-1 promotes basal and kainate-induced proliferation of neural progenitors in the dentate gyrus of adult mouse hippocampus. Cell Death Differ. 2009;16:417–427. doi: 10.1038/cdd.2008.162. [DOI] [PubMed] [Google Scholar]
- Kelz MB, Chen J, Carlezon WA, Jr, Whisler K, Gilden L, Beckmann AM, Steffen C, Zhang YJ, Marotti L, Self DW, Tkatch T, Baranauskas G, Surmeier DJ, Neve RL, Duman RS, Picciotto MR, Nestler EJ. Expression of the transcription factor ΔFosB in the brain controls sensitivity to cocaine. Nature. 1999;401:272–276. doi: 10.1038/45790. [DOI] [PubMed] [Google Scholar]
- Kettenmann H, Hanisch UK, Noda M, Verkhratsky A. Physiology of microglia. Physiol Rev. 2011;91:461–553. doi: 10.1152/physrev.00011.2010. [DOI] [PubMed] [Google Scholar]
- Klos A, Tenner AJ, Johswich KO, Ager RR, Reis ES, Kohl J. The role of the anaphylatoxins in health and disease. Mol Immunol. 2009;46:2753–2766. doi: 10.1016/j.molimm.2009.04.027. [DOI] [PMC free article] [PubMed] [Google Scholar]
- Kurushima H, Ohno M, Miura T, Nakamura TY, Horie H, Kadoya T, Ooboshi H, Kitazono T, Ibayashi S, Iida M, Nakabeppu Y. Selective induction of ΔFosB in the brain after transient forebrain ischemia accompanied by an increased expression of galectin-1, and the implication of ΔFosB and galectin-1 in neuroprotection and neurogenesis. Cell Death Differ. 2005;12:1078–1096. doi: 10.1038/sj.cdd.4401648. [DOI] [PubMed] [Google Scholar]
- Ladeby R, Wirenfeldt M, Garcia-Ovejero D, Fenger C, Dissing-Olesen L, Dalmau I, Finsen B. Microglial cell population dynamics in the injured adult central nervous system. Brain Res Brain Res Rev. 2005;48:196–206. doi: 10.1016/j.brainresrev.2004.12.009. [DOI] [PubMed] [Google Scholar]
- Li R, Coulthard LG, Wu MC, Taylor SM, Woodruff TM. C5L2: a controversial receptor of complement anaphylatoxin, C5a. FASEB J. 2013;27:855–864. doi: 10.1096/fj.12-220509. [DOI] [PubMed] [Google Scholar]
- Liu B, Hong JS. Role of microglia in inflammation-mediated neurodegenerative diseases: mechanisms and strategies for therapeutic intervention. J Pharmacol Exp Ther. 2003;304:1–7. doi: 10.1124/jpet.102.035048. [DOI] [PubMed] [Google Scholar]
- Long JM, Kalehua AN, Muth NJ, Hengemihle JM, Jucker M, Calhoun ME, Ingram DK, Mouton PR. Stereological estimation of total microglia number in mouse hippocampus. J Neurosci Methods. 1998;84:101–108. doi: 10.1016/s0165-0270(98)00100-9. [DOI] [PubMed] [Google Scholar]
- Mandelzys A, Gruda MA, Bravo R, Morgan JI. Absence of a persistently elevated 37 kDa Fos-related antigen and AP-1-like DNA-binding activity in the brains of kainic acid-treated fosB null mice. J Neurosci. 1997;17:5407–5415. doi: 10.1523/JNEUROSCI.17-14-05407.1997. [DOI] [PMC free article] [PubMed] [Google Scholar]
- Markel P, Shu P, Ebeling C, Carlson GA, Nagle DL, Smutko JS, Moore KJ. Theoretical and empirical issues for marker-assisted breeding of congenic mouse strains. Nat Genet. 1997;17:280–284. doi: 10.1038/ng1197-280. [DOI] [PubMed] [Google Scholar]
- Maroso M, Balosso S, Ravizza T, Liu J, Aronica E, Iyer AM, Rossetti C, Molteni M, Casalgrandi M, Manfredi AA, Bianchi ME, Vezzani A. Toll-like receptor 4 and high-mobility group box-1 are involved in ictogenesis and can be targeted to reduce seizures. Nat Med. 2010;16:413–419. doi: 10.1038/nm.2127. [DOI] [PubMed] [Google Scholar]
- McClung CA, Nestler EJ. Regulation of gene expression and cocaine reward by CREB and ΔFosB. Nat Neurosci. 2003;6:1208–1215. doi: 10.1038/nn1143. [DOI] [PubMed] [Google Scholar]
- McClung CA, Ulery PG, Perrotti LI, Zachariou V, Berton O, Nestler EJ. ΔFosB: a molecular switch for long-term adaptation in the brain. Brain Res Mol Brain Res. 2004;132:146–154. doi: 10.1016/j.molbrainres.2004.05.014. [DOI] [PubMed] [Google Scholar]
- Metz R, Kouzarides T, Bravo R. A C-terminal domain in FosB, absent in FosB/SF and Fra-1, which is able to interact with the TATA binding protein, is required for altered cell growth. EMBO J. 1994;13:3832–3842. doi: 10.1002/j.1460-2075.1994.tb06694.x. [DOI] [PMC free article] [PubMed] [Google Scholar]
- Monji A, Kato T, Kanba S. Cytokines and schizophrenia: Microglia hypothesis of schizophrenia. Psychiatry Clin Neurosci. 2009;63:257–265. doi: 10.1111/j.1440-1819.2009.01945.x. [DOI] [PubMed] [Google Scholar]
- Nakabeppu Y, Nathans D. A naturally occurring truncated form of FosB that inhibits Fos/Jun transcriptional activity. Cell. 1991;64:751–759. doi: 10.1016/0092-8674(91)90504-r. [DOI] [PubMed] [Google Scholar]
- Nestler EJ. Transcriptional mechanisms of addiction: role of ΔFosB. Phil Trans R Soc B. 2008;363:3245–3255. doi: 10.1098/rstb.2008.0067. [DOI] [PMC free article] [PubMed] [Google Scholar]
- Nolte C, Moller T, Walter T, Kettenmann H. Complement 5a controls motility of murine microglial cells in vitro via activation of an inhibitory G-protein and the rearrangement of the actin cytoskeleton. Neuroscience. 1996;73:1091–1107. doi: 10.1016/0306-4522(96)00106-6. [DOI] [PubMed] [Google Scholar]
- Ohnishi YN, Sakumi K, Yamazaki K, Ohnishi YH, Miura T, Tominaga Y, Nakabeppu Y. Antagonistic regulation of cell-matrix adhesion by FosB and ΔFosB/Δ2ΔFosB encoded by alternatively spliced forms of fosB transcripts. Mol Biol Cell. 2008;19:4717–4729. doi: 10.1091/mbc.E07-08-0768. [DOI] [PMC free article] [PubMed] [Google Scholar]
- Ohnishi YN, Ohnishi YH, Hokama M, Nomaru H, Yamazaki K, Tominaga Y, Sakumi K, Nestler EJ, Nakabeppu Y. FosB is essential for the enhancement of stress tolerance and antagonizes locomotor sensitization by ΔFosB. Biol Psychiatry. 2011;70:487–495. doi: 10.1016/j.biopsych.2011.04.021. [DOI] [PMC free article] [PubMed] [Google Scholar]
- Osaka H, McGinty A, Hoepken UE, Lu B, Gerard C, Pasinetti GM. Expression of C5a receptor in mouse brain: role in signal transduction and neurodegeneration. Neuroscience. 1999;88:1073–1082. doi: 10.1016/s0306-4522(98)00372-8. [DOI] [PubMed] [Google Scholar]
- Pollard H, Charriaut-Marlangue C, Cantagrel S, Represa A, Robain O, Moreau J, Ben-Ari Y. Kainate-induced apoptotic cell death in hippocampal neurons. Neuroscience. 1994;63:7–18. doi: 10.1016/0306-4522(94)90003-5. [DOI] [PubMed] [Google Scholar]
- Rittirsch D, Flierl MA, Nadeau BA, Day DE, Huber-Lang M, Mackay CR, Zetoune FS, Gerard NP, Cianflone K, Kohl J, Gerard C, Sarma JV, Ward PA. Functional roles for C5a receptors in sepsis. Nat Med. 2008;14:551–557. doi: 10.1038/nm1753. [DOI] [PMC free article] [PubMed] [Google Scholar]
- Rogove AD, Tsirka SE. Neurotoxic responses by microglia elicited by excitotoxic injury in the mouse hippocampus. Curr Biol. 1998;8:19–25. doi: 10.1016/s0960-9822(98)70016-8. [DOI] [PubMed] [Google Scholar]
- Rogove AD, Lu W, Tsirka SE. Microglial activation and recruitment, but not proliferation, suffice to mediate neurodegeneration. Cell Death Differ. 2002;9:801–806. doi: 10.1038/sj.cdd.4401041. [DOI] [PubMed] [Google Scholar]
- Sabatakos G, Rowe GC, Kveiborg M, Wu M, Neff L, Chiusaroli R, Philbrick WM, Baron R. Doubly truncated FosB isoform (Δ2ΔFosB) induces osteosclerosis in transgenic mice and modulates expression and phosphorylation of Smads in osteoblasts independent of intrinsic AP-1 activity. J Bone Miner Res. 2008;23:584–595. doi: 10.1359/JBMR.080110. [DOI] [PMC free article] [PubMed] [Google Scholar]
- Schafer DP, Lehrman EK, Kautzman AG, Koyama R, Mardinly AR, Yamasaki R, Ransohoff RM, Greenberg ME, Barres BA, Stevens B. Microglia sculpt postnatal neural circuits in an activity and complement-dependent manner. Neuron. 2012;74:691–705. doi: 10.1016/j.neuron.2012.03.026. [DOI] [PMC free article] [PubMed] [Google Scholar]
- Stevens B, Allen NJ, Vazquez LE, Howell GR, Christopherson KS, Nouri N, Micheva KD, Mehalow AK, Huberman AD, Stafford B, Sher A, Litke AM, Lambris JD, Smith SJ, John SW, Barres BA. The classical complement cascade mediates CNS synapse elimination. Cell. 2007;131:1164–1178. doi: 10.1016/j.cell.2007.10.036. [DOI] [PubMed] [Google Scholar]
- Streit WJ, Xue QS. Life and death of microglia. Journal of neuroimmune pharmacology : the official journal of the Society on NeuroImmune Pharmacology. 2009;4:371–379. doi: 10.1007/s11481-009-9163-5. [DOI] [PubMed] [Google Scholar]
- Vargas DL, Nascimbene C, Krishnan C, Zimmerman AW, Pardo CA. Neuroglial activation and neuroinflammation in the brain of patients with autism. Ann Neurol. 2005;57:67–81. doi: 10.1002/ana.20315. [DOI] [PubMed] [Google Scholar]
- Veerhuis R, Nielsen HM, Tenner AJ. Complement in the brain. Mol Immunol. 2011;48:1592–1603. doi: 10.1016/j.molimm.2011.04.003. [DOI] [PMC free article] [PubMed] [Google Scholar]
- Vezzani A, Aronica E, Mazarati A, Pittman QJ. Epilepsy and brain inflammation. Exp Neurol. 2013;244:11–21. doi: 10.1016/j.expneurol.2011.09.033. [DOI] [PubMed] [Google Scholar]
- Wagner EF, Eferl R. Fos/AP-1 proteins in bone and the immune system. Immunol Rev. 2005;208:126–140. doi: 10.1111/j.0105-2896.2005.00332.x. [DOI] [PubMed] [Google Scholar]
- Wang Q, Yu S, Simonyi A, Sun GY, Sun AY. Kainic acid-mediated excitotoxicity as a model for neurodegeneration. Mol Neurobiol. 2005;31:3–16. doi: 10.1385/MN:31:1-3:003. [DOI] [PubMed] [Google Scholar]
- Ward PA. Functions of C5a receptors. J Mol Med. 2009;87:375–378. doi: 10.1007/s00109-009-0442-7. [DOI] [PMC free article] [PubMed] [Google Scholar]
- Woodruff TM, Ager RR, Tenner AJ, Noakes PG, Taylor SM. The role of the complement system and the activation fragment C5a in the central nervous system. Neuromolecular Med. 2010;12:179–192. doi: 10.1007/s12017-009-8085-y. [DOI] [PubMed] [Google Scholar]
- Wyss-Coray T, Mucke L. Inflammation in neurodegenerative disease-a double-edged sword. Neuron. 2002;35:419–432. doi: 10.1016/s0896-6273(02)00794-8. [DOI] [PubMed] [Google Scholar]
- Yang DD, Kuan CY, Whitmarsh AJ, Rincon M, Zheng TS, Davis RJ, Rakic P, Flavell RA. Absence of excitotoxicity-induced apoptosis in the hippocampus of mice lacking the Jnk3 gene. Nature. 1997;389:865–870. doi: 10.1038/39899. [DOI] [PubMed] [Google Scholar]
- Yutsudo N, Kamada T, Kajitani K, Nomaru H, Katogi A, Ohnishi YH, Ohnishi YN, Takase K, Sakumi K, Shigeto H, Nakabeppu Y. fosB-Null Mice Display Impaired Adult Hippocampal Neurogenesis and Spontaneous Epilepsy with Depressive Behavior. Neuropsychopharmacology. 2013;38:895–906. doi: 10.1038/npp.2012.260. [DOI] [PMC free article] [PubMed] [Google Scholar]
- Zhang X, Kimura Y, Fang C, Zhou L, Sfyroera G, Lambris JD, Wetsel RA, Miwa T, Song WC. Regulation of Toll-like receptor-mediated inflammatory response by complement in vivo. Blood. 2007;110:228–236. doi: 10.1182/blood-2006-12-063636. [DOI] [PMC free article] [PubMed] [Google Scholar]
- Zhang XM, Zhu J. Kainic Acid-induced neurotoxicity: targeting glial responses and glia-derived cytokines. Curr Neuropharmacol. 2011;9:388–398. doi: 10.2174/157015911795596540. [DOI] [PMC free article] [PubMed] [Google Scholar]