

Abstract
Mitosis entails complex chromatin changes that have garnered increasing interest from biologists who study genome structure and regulation – fields that are being advanced by high-throughput sequencing (Seq) technologies. The application of such technologies to study the mitotic genome requires large numbers of highly pure mitotic cells with minimal contamination from interphase cells to ensure accurate measurements of phenomena specific to mitosis. Here, we optimized a fluorescence-activated cell sorting (FACS)-based method for isolating formaldehyde-fixed mitotic cells – at virtually 100% mitotic purity – in substantial quantities sufficient for high-throughput genomic studies. We compare several commercially available antibodies that react with mitosis-specific epitopes over a range of concentrations and cell numbers, and identify antibody MPM2 as the most robust and cost-effective.
Keywords: Mitosis, FACS, H3S10ph, MPM2
Mitosis is characterized by drastic alterations to chromosome structure, global transcriptional silencing, and eviction of many transcriptional regulators from chromatin (1–3); for review see (4). Genome structure and regulation of the mitotic cell are emerging areas of research with important implications for understanding cellular memory of gene expression. What is the mechanism and function of the minority of transcriptional regulators that are retained at specific sites in the mitotic genome (5,6)? What are the dynamics of transcription factor occupancy, histone modifications, histone variants, and nucleosome positioning as cells traverse mitosis? How does mitotic chromosome condensation impact on long-range chromosome interactions such as enhancer-promoter looping and large topological domains (7)? Researchers pursuing such questions increasingly rely on methods coupled to Seq technologies such as chromatin immunoprecipitation (ChIP)-Seq, derivations of chromosome conformation capture (3C), and other epigenomic assays.
The application of such methods to study mitosis requires large numbers of pure mitotic cells to ensure sufficient signal-to-noise ratios and that measurements precisely reflect the state of mitotic cells, rather than contaminating interphase populations. ChIP studies comparing transcription factor occupancies in interphase and mitosis showed that in some cases mitotic occupancy occurred with reduced intensities and at only a fraction of interphase occupied sites (5,6). In such cases, the purity of the mitotic population under study is critical for assessing whether the residual ChIP signals arise from true factor occupancy during mitosis, versus factor binding in a minority of contaminating interphase cells.
These stringent requirements for high mitotic index can be challenging because only a small fraction (<5%) of asynchronously growing cells are in mitosis. Cell cycle synchronization by pharmacologic treatments, such as nocodazole, can increase this percentage markedly, but in most cell types mitotic arrest is far from complete (Figure 1B and (5)). In some adherent cell lines, enrichment of mitotic cells can be achieved by agitation of the tissue culture flask to detach loosely adhered mitotic cells (the “mitotic shake-off” method). However, this strategy fails in many adherent cell lines and primary cells, and is not applicable for suspension cells.
Figure 1. Titration of mitosis-specific antibodies for staining small numbers of murine cells.

(A) Ten million nocodazole (Sigma-Aldrich, St. Louis, MO, USA)-treated (200 ng/mL for 8 hours) or untreated asynchronous G1E cells were fixed in 1% formaldehyde (Thermo Fisher Scientific, Waltham, MA, USA), permeabilized, resuspended at a density of 6 × 10⁷ cells/mL, and stained with H3S10ph, MPM2, H3S28ph, or HpTGEKP antibodies at increasing doses (1:1700, 1:340, 1:85, 1:34, 1:17 dilutions) (see Protocol for details). For non-fluorescent primary antibodies, Alexa Fluor 647-conjugated anti-rabbit IgG F(ab')2 or Allophycocyanin-conjugated anti-mouse IgG F(ab')2 antibody fragments (Jackson ImmunoResearch, West Grove, PA, USA) were used at a 1:85 dilution for detection. Propidium iodide (Sigma-Aldrich) (PI) was used to determine DNA content. For FACS plots where a separate mitotic population can be delineated by eye, a gate was drawn to indicate the percentage of positively staining cells. (B) Immunofluorescence microscopy of nocodazole-treated, crosslinked, and H3S10ph or MPM2 and DAPI stained G1E-ER cells before and after FACS confirms high purity of mitotic cells following cell sorting on a FACSAria II (Becton Dickinson, Franklin Lakes, NJ, USA). Sorting by either H3S10ph (n = 206 cells) or MPM2 (n = 161 cells) staining yields populations of 100% mitotic cells as assayed by DAPI staining. Percentages indicate mitotic indices. Representative mitotic (arrowheads), interphase (arrows), and apoptotic (asterisks) cells are indicated. Inserts: high magnification demonstrates unique H3S10ph and MPM2 staining patterns. Imaging carried out as follows: samples were spun onto coverslips using a Shandon Cytospin Cytocentrifuge (Thermo Fisher Scientific). Single optical planes were taken on a Ti-E inverted fluorescence microscope (Nikon, Tokyo, Japan) using a 100X Plan-Apo objective (numerical aperture 1.42) and a cooled CCD camera (Pixis 1024B, Princeton Instruments, Trenton, NJ, USA), using filter sets for DAPI (31000v2, Chroma, Bellows Falls, VT, USA) and Alexa Fluor 647/APC (SP104v2, Chroma).
We and others previously developed a method to overcome these limitations by purifying mitotic cell populations by intracellular FACS. Cells were fixed as in ChIP experiments, permeabilized, and exposed to commercial antibodies against histone H3 phosphorylated at serine 10 (H3S10ph), a modification globally enriched during mitosis, to achieve >98% pure mitotic cell populations (5,8). Since developing this method, the original antibody used (clone MC463, 05-817, EMD Millipore, Billerica, MA, USA) was discontinued. Subsequent batches scaled poorly in several attempts at purifying large quantities of mitotic cells (Supplemental Figure 1A). The reason for this lack of scalability remains unclear. Increasing the concentration of antibody from 1:85 to 1:17 when staining enough cells (20 × 107) for one mitotic ChIP-Seq experiment failed to compensate for this impractically low staining efficiency of bulk quantities and raised the costs to ≥$760 (at the current price of $380 per vial). We raised our own antisera against the H3S10ph epitope, which proved similarly ineffective for staining bulk cell quantities (Supplemental Figure 1B). The lack of an effective scalable H3S10ph antibody is a major impediment to studying the mitotic epigenome.
We sought to improve the scalability and cost-effectiveness of FACS-based purification of formaldehyde-fixed mitotic cells by surveying three other commercially available antibodies against mitosis-specific epitopes, outlined in Table 1. First, we tested increasing concentrations of each for staining small numbers (1 × 10⁷) of murine erythroid (G1E) suspension cells (Figure 1A) or human cervical cancer (HeLa) adherent cells (Supplemental Figure 2). For each antibody, a brightly staining population of mitotic cells with 4N DNA content was detected. Separation between the dimly stained 4N cells (S/G2 phase) and the brightly stained 4N cells (mitosis) was achieved with ≥2 μL/1 × 107 cells of H3S10ph (1:85 dilution), ≥0.1 μL/1 × 107 cells of MPM2 (1:1700 dilution), and ≥5 μL/1 × 107 cells of H3S28ph or HpTGEKP (1:34 dilution). At all tested concentrations, MPM2 achieved the clearest separation between dim and bright 4N cells. Notably, cells stained with the lowest concentration of MPM2 had better separation than any other antibody used at the highest concentration. Therefore, MPM2 is the most effective antibody for staining mitotic cells in relatively small numbers, followed by H3S10ph. In these small scale experiments, both MPM2- and H3S10ph-based FACS yielded ~100% mitotic cells as determined by post-sort immunofluorescence and DAPI (Molecular Probes, Eugene, OR, USA) counterstaining (Figure 1B). We note that while H3S10ph coats mitotic chromatin, MPM2 staining is enriched at the plasma membrane.
Table 1.
Antibodies tested for ability to stain mitotic cells.
| Antibody | Abbreviation | Species, Clonality | Source, Catalog number | Epitope description |
|---|---|---|---|---|
| Anti-phospho Histone H3 (Ser10), Mitosis Marker | H3S10ph | Rabbit, polyclonal | EMD Millipore, 06-570 and 04-817 | Phosphorylated serine 10 on the N-terminal tail of histone H3; occurs during late G2 phase to anaphase (12) |
| Anti-phospho-Ser/Thr-Pro, MPM-2 (Mitotic protein monoclonal #2) | MPM2 | Mouse, monoclonal | EMD Millipore, 05-368 | Phosphorylated serines or threonines followed by proline, specifically peptides LpTPLK or FpTPLQ; occurs during mitosis (9,13) |
| Alexa Fluor 647 Rat anti-Histone H3 (pS28) | H3S28ph | Rat, monoclonal | BD Biosciences, 558217 | Phosphorylated serine 28 on the N-terminal tail of histone H3; occurs during prophase to anaphase (10) |
| Anti-HpTGEKP motif | HpTGEKP | Rabbit, polyclonal | EMD Millipore, ABE319 | Peptide HpTGEKP; based on the highly conserved linker joining adjacent C2H2 zinc fingers; occurs during prophase to anaphase (11) |
We next compared the performance of H3S10ph and MPM2 in staining large numbers (20 × 107) of G1E cells, a quantity commonly required for ChIP-Seq and 3C-based assays. Such high starting cell numbers seem excessive but are necessary because a fraction of formaldehyde-fixed cells are lost from sticking to various surfaces during sample processing. When used at 0.5 μL/1 × 107 cells (1:340 dilution), MPM2 resolves a clear mitotic population (Figure 2), maintaining a similar staining pattern to that seen with small cell numbers (Figure 1A). In contrast, when used at concentrations from 0.5 μL/1 × 107 cells to 10 μL/1 × 107 cells (1:340 to 1:17 dilution), H3S10ph fails to clearly identify a mitotic sub-population. Similar results were obtained with an independent lot of H3S10ph antibody, the MC463 clone (04-817, EMD Millipore), and our homemade H3S10ph antiserum (Figure 2). Prolonged incubation at 4 degrees did not improve H3S10ph staining (data not shown). In summary, MPM2 outperforms other tested mitosis-specific antibodies in large-scale purifications of mitotic cells.
Figure 2. MPM2 outperforms H3S10ph when staining large numbers of murine cells.
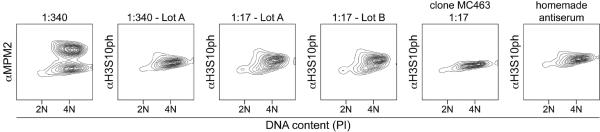
Two-hundred million G1E cells were treated with 200 ng/mL nocodazole for 11 hours, formaldehyde-fixed, and stained with MPM2 or H3S10ph antibodies at 1:340 or 1:17 dilution at a constant cell density of 6 × 10⁷ cells/mL in the same fashion as in Figure 1. For the homemade H3S10ph antiserum, cells were completely bathed in 100% antiserum. Propidium iodide (PI) was used to determine DNA content.
These data show that, of the antibodies surveyed, MPM2 is highly specific for mitotic cells, and is currently the only scalable and cost-effective antibody for isolating bulk preparations of pure mitotic cells by FACS. At current antibody prices, a typical experiment to stain 20 × 107 cells would cost $20 in MPM2 antibody (using a 1:340 dilution) compared to ≥$760 in H3S10ph antibody (using a 1:17 dilution that still fails to robustly identify mitotic cells). The MPM2 antibody-based method is a substantial improvement in scalability and cost for FACS-purifying cells for use in ChIP-Seq, 3C-based, and other assays requiring large quantities of starting material. Our protocol should be generally applicable to any cell line, primary cells, or tissue samples amenable to FACS. Commercial antibodies may vary between lots as we observed for H3S10ph antibodies. Therefore, it might be necessary to recalibrate the staining protocol, for example by varying parameters such as detergent concentrations, incubation times, and antibody concentrations. In the future, adaptation of this protocol may enable the analysis of RNA or protein species in pure populations of mitotic cells.
Supplementary Material
Supplemental Figure 1. H3S10ph staining of small and large numbers of murine cells. Ten or two-hundred million G1E cells were treated with 200 ng/mL nocodazole for 8–11 hours, formaldehyde-fixed, and stained with (A) H3S10ph antibody (Millipore, clone MC463, 04-817) or (B) homemade H3S10ph antiserum at 1:17 dilution at a cell density of 6 × 10⁷ cells/mL in the same fashion as in Figure 1.
Supplemental Figure 2. Titration of mitosis-specific antibodies for staining small numbers of human cells. Ten million million nocodazole-treated (200 ng/mL for 8 hours) or untreated asynchronous HeLa cells were fixed in 1% formaldehyde, permeabilized, and resuspended at a density of 6 × 10⁷ cells/mL in the same fashion as in Figure 1, and stained with H3S10ph, MPM2, H3S28ph, or HpTGEKP antibodies at increasing doses (1:1700, 1:340, 1:85, 1:34, 1:17 dilutions). For non-fluorescent primary antibodies, Alexa Fluor 647-conjugated anti-rabbit IgG F(ab')2 or Allophycocyanin-conjugated anti-mouse IgG F(ab')2 antibody fragments (Jackson ImmunoResearch) were used at a 1:85 dilution for detection. Propidium iodide (PI) was used to determine DNA content. For FACS plots where a separate mitotic population can be delineated by eye, a gate was drawn with percentages that indicate mitotic indices.
Method Summary.
We surveyed and optimized reagents for FACS-assisted purification of mitotic cells. Of the antibodies surveyed, we found that MPM2 is ~100% specific, scalable, and cost-effective for purifying mitotic cells in bulk quantities suitable for high-throughput genomic studies.
Acknowledgments
The authors thank Suzanne N. Shapiro for technical support, and Arjun Raj for use of his microscope. This study was supported by grants from the National Institutes of Health (5R01DK054937 [G.A.B.], T32DK07780 [A.E.C.] and T32GM008216 [C. C.-S. H.]). This paper is subject to the NIH Public Access Policy.
Footnotes
Author Contributions A.E.C and C. C.-S. H. conceived the study, designed and performed experiments, and analyzed data. A.E.C, C. C.-S. H., and G.A.B. wrote the manuscript.
Competing Interests The authors declare no competing interests.
References
- 1.Taylor JH. Nucleic acid synthesis in relation to the cell division cycle. Ann. N Y Acad. Sci. 1960;90:409–421. doi: 10.1111/j.1749-6632.1960.tb23259.x. [DOI] [PubMed] [Google Scholar]
- 2.Prescott DM, Bender MA. Synthesis of RNA and protein during mitosis in mammalian tissue culture cells. Exp. Cell Res. 1962;26:260–268. doi: 10.1016/0014-4827(62)90176-3. [DOI] [PubMed] [Google Scholar]
- 3.Martínez-Balbás MA, Dey A, Rabindran SK, Ozato K, Wu C. Displacement of sequence-specific transcription factors from mitotic chromatin. Cell. 1995;83:29–38. doi: 10.1016/0092-8674(95)90231-7. [DOI] [PubMed] [Google Scholar]
- 4.Kadauke S, Blobel GA. Mitotic bookmarking by transcription factors. Epigenetics & Chromatin. 2013;6:6. doi: 10.1186/1756-8935-6-6. [DOI] [PMC free article] [PubMed] [Google Scholar]
- 5.Kadauke S, Udugama MI, Pawlicki JM, Achtman JC, Jain DP, Cheng Y, Hardison RC, Blobel GA. Tissue-specific mitotic bookmarking by hematopoietic transcription factor GATA1. Cell. 2012;150:725–737. doi: 10.1016/j.cell.2012.06.038. [DOI] [PMC free article] [PubMed] [Google Scholar]
- 6.Caravaca JM, Donahue G, Becker JS, He X, Vinson C, Zaret KS. Bookmarking by specific and nonspecific binding of FoxA1 pioneer factor to mitotic chromosomes. Genes Dev. 2013;27:251–260. doi: 10.1101/gad.206458.112. [DOI] [PMC free article] [PubMed] [Google Scholar]
- 7.Deng W, Blobel GA. Do chromatin loops provide epigenetic gene expression states? Curr Opin Genet Dev. 2010;20:548–554. doi: 10.1016/j.gde.2010.06.007. [DOI] [PMC free article] [PubMed] [Google Scholar]
- 8.Follmer NE, Francis NJ. Preparation of Drosophila tissue culture cells from different stages of the cell cycle for chromatin immunoprecipitation using centrifugal counterflow elutriation and fluorescence-activated cell sorting. Meth. Enzymol. 2012;513:251–269. doi: 10.1016/B978-0-12-391938-0.00011-2. [DOI] [PubMed] [Google Scholar]
- 9.Davis FM, Tsao TY, Fowler SK, Rao PN. Monoclonal antibodies to mitotic cells. Proc. Natl. Acad. Sci. USA. 1983;80:2926–2930. doi: 10.1073/pnas.80.10.2926. [DOI] [PMC free article] [PubMed] [Google Scholar]
- 10.Goto H, Tomono Y, Ajiro K, Kosako H, Fujita M, Sakurai M, Okawa K, Iwamatsu A, et al. Identification of a novel phosphorylation site on histone H3 coupled with mitotic chromosome condensation. J Biol. Chem. 1999;274:25543–25549. doi: 10.1074/jbc.274.36.25543. [DOI] [PubMed] [Google Scholar]
- 11.Rizkallah R, Alexander KE, Hurt MM. Global mitotic phosphorylation of C2H2 zinc finger protein linker peptides. Cell Cycle. 2011;10:3327–3336. doi: 10.4161/cc.10.19.17619. [DOI] [PMC free article] [PubMed] [Google Scholar]
- 12.Hendzel MJ, Wei Y, Mancini MA, Van Hooser A, Ranalli T, Brinkley BR, Bazett-Jones DP, Allis CD. Mitosis-specific phosphorylation of histone H3 initiates primarily within pericentromeric heterochromatin during G2 and spreads in an ordered fashion coincident with mitotic chromosome condensation. Chromosoma. 1997;106:348–360. doi: 10.1007/s004120050256. [DOI] [PubMed] [Google Scholar]
- 13.Westendorf JM, Rao PN, Gerace L. Cloning of cDNAs for M-phase phosphoproteins recognized by the MPM2 monoclonal antibody and determination of the phosphorylated epitope. Proc. Natl. Acad. Sci. USA. 1994;91:714–718. doi: 10.1073/pnas.91.2.714. [DOI] [PMC free article] [PubMed] [Google Scholar]
Associated Data
This section collects any data citations, data availability statements, or supplementary materials included in this article.
Supplementary Materials
Supplemental Figure 1. H3S10ph staining of small and large numbers of murine cells. Ten or two-hundred million G1E cells were treated with 200 ng/mL nocodazole for 8–11 hours, formaldehyde-fixed, and stained with (A) H3S10ph antibody (Millipore, clone MC463, 04-817) or (B) homemade H3S10ph antiserum at 1:17 dilution at a cell density of 6 × 10⁷ cells/mL in the same fashion as in Figure 1.
Supplemental Figure 2. Titration of mitosis-specific antibodies for staining small numbers of human cells. Ten million million nocodazole-treated (200 ng/mL for 8 hours) or untreated asynchronous HeLa cells were fixed in 1% formaldehyde, permeabilized, and resuspended at a density of 6 × 10⁷ cells/mL in the same fashion as in Figure 1, and stained with H3S10ph, MPM2, H3S28ph, or HpTGEKP antibodies at increasing doses (1:1700, 1:340, 1:85, 1:34, 1:17 dilutions). For non-fluorescent primary antibodies, Alexa Fluor 647-conjugated anti-rabbit IgG F(ab')2 or Allophycocyanin-conjugated anti-mouse IgG F(ab')2 antibody fragments (Jackson ImmunoResearch) were used at a 1:85 dilution for detection. Propidium iodide (PI) was used to determine DNA content. For FACS plots where a separate mitotic population can be delineated by eye, a gate was drawn with percentages that indicate mitotic indices.