

Summary
Background
Mass spectrometry based proteomics enables the global identification and quantification of proteins and their post-translational modifications in complex biological samples. However, proteomic analysis requires a complete and accurate reference set of proteins, and is therefore largely restricted to model organisms with sequenced genomes.
Results
Here, we demonstrate the feasibility of deep genome-free proteomics using a reference proteome derived from heterogeneous mRNA data. We identify more than 11k proteins with 99% confidence from the unfertilized X. laevis egg and estimate protein abundance with approximately two-fold precision. Our reference database outperforms the provisional gene models based on genomic DNA-sequencing and references generated by other methods. Surprisingly, we find that many proteins in the egg lack mRNA support and many of these proteins are found in blood or liver, suggesting that they are taken up from the blood plasma, together with yolk, during oocyte growth and maturation, potentially contributing to early embryogenesis.
Conclusion
To facilitate proteomics in non-model organisms, we make our platform available as an online resource which converts heterogeneous mRNA data into a protein reference set. Thus, we demonstrate the feasibility and power of genome-free proteomics while shedding new light on embryogenesis in vertebrates.
Introduction
Recent advancements in mass spectrometry-based proteomics now enable global identification and quantification for up to ~10K proteins in a single experiment, along with associated post-translational modifications [1-3]. The capability to identify proteins and measure their expression levels in an unbiased manner on a proteome-wide scale can revolutionize many areas of biology. However, many of the most interesting biological problems are best studied in non-standard organisms: limb regeneration in axolotl, [4] red blood cell development in ice fish, [5] or craniofacial developmental disorders in Darwin's finches [6]. To understand how different processes evolved it will be important to compare proteomic composition and dynamics in species from diverse clades.
Unfortunately, proteomics is currently very difficult in organisms without well-annotated genomes. In current approaches, proteins are digested with proteases, and the peptides are ionized, fragmented, and detected via MS/MS fragmentation spectra. In principle, these spectra contain sufficient information to deduce a peptide's amino-acid sequence. However, this approach is only feasible for subsets of spectra with exceptional quality. The number of interpretable spectra is significantly increased by matching MS/MS spectra with theoretical spectra generated from all proteins encoded in the studied species. This set should be both complete and accurate to achieve maximum sensitivity and specificity. The paucity of high quality reference databases is the main reason that MS-based proteomics is currently limited largely to species with well-annotated gene models.
Despite the rapid decrease in sequencing costs, obtaining genome-based protein reference sets for new organisms is time intensive and expensive. Creating accurate gene models for a new species relies on faithfully assembling a genome from short-read sequencing data and training gene predictors. Both processes are often met with bioinformatics and species-specific challenges. For example, the size and polyploidy of some species’ genome, e.g. lungfish, axolotl or Amoebae [7-9], make sequencing challenging for the foreseeable future. In contrast, deep coverage RNA-seq is cost-effective, and protein-coding transcripts can be reconstructed using established tools and published protocols for any species [10]. Some attempts have been made to generate a protein reference database by 6-frame translations of mRNA [11, 12]. Unfortunately, the majority of the obtained protein sequences are biologically irrelevant, unnecessarily increasing the search space for spectral matching, and therefore decreasing sensitivity while increasing the need for computational time and resources.
One under-exploited model for proteomic experiments is the African clawed frog Xenopus laevis. [13-16] Large amounts of material required for deep proteomic experiments (> 100 μg of protein) can be obtained easily from X. laevis samples, which would be very hard or impossible to obtain in other model organisms (e.g., staged embryonic time series or undiluted, metaphase-arrested cytoplasm called egg extract). However, X. laevis has rarely been used for MS due to the lack of a released genome, likely due to the difficulty associated with sequencing quasi-tetraploid genomes [17].
Here, we demonstrate for the X. laevis egg that genome-free proteomics is feasible at remarkable depth, and that we can extract biological insight from this proteomics data. For our genome-free protein reference set we combine multiple sources of mRNA information and use knowledge of sequence similarity to proteins from related species for reading frame detection, frame-shift correction and annotation. In proteomic experiments, our database outperforms alternative approaches and even the latest rounds of preliminary gene models based on the unreleased genome. With more than 11k proteins identified with 99% confidence, this is by far the deepest proteomic study in X. laevis, and one of the deepest analysis performed in any organism. By enumerating the ~11k proteins in the Xenopus egg and measuring the concentration of each to approximately 2-fold precision, we have produced a valuable resource for the Xenopus community. Lastly, we offer the means for researchers to upload and convert mRNA data into a protein reference database for their own proteomic experiments in any organism.
Results
Objective evaluation of protein reference databases with peptide fragmentation spectra
To construct the best possible reference database for proteomics, we sought a method to evaluate and compare different reference versions objectively. We reasoned that for a given set of peptide fragment spectra, the number of confidently identified peptides is an objective measure of the quality of that reference. To test this assumption, we collected spectra from a trypsin-digested S. cerevisiae lysate and searched them against a standard collection of all yeast proteins. We chose yeast, the first sequenced eukaryote, [18] because its gene models are exceptionally well annotated. We filtered the spectra, which were matched to peptides (peptide spectrum matches (PSMs)), to 0.5% false discovery rate (FDR) using the target decoy strategy [1, 19, 20]. Protein grouping was performed with maximum parsimony, with an additional filtering step to 1% FDR at the protein level [1, 21-23]. We then modified the yeast reference set to simulate the effects of searching spectra against low-quality references. First, we randomly removed half or three quarters of the yeast proteins in the reference database. The number of PSMs, unique peptides, and proteins approximately scales with the number of proteins in the reference database (Fig. 1). To test whether irrelevant data would affect the number of identified peptides, we added shuffled human protein sequences to the yeast reference. As expected, the number of identified peptides and proteins is reduced due to the higher chance of false positive matches. To simulate a protein reference database with highly fragmented proteins, we bisected each protein from the reference at a random position. With this reference, the number of identified peptides slightly decreased, likely due to the removal of tryptic peptides at the fragmentation site. However, the number of identified “proteins” increased substantially (Fig. 1), as some fragmented proteins were identified once per fragment. As an orthogonal test for the validity of peptide identification as a benchmark for the protein reference set quality, we searched MS spectra obtained from a X. laevis sample against the gene models from various species. As expected, the number of identified peptides decreases with evolutionary distance, likely reflecting the lower number of exactly matched peptides in the databases (Fig S1). Thus we conclude that proteomic data can be used to evaluate the relative quality of a reference protein dataset. More specifically, the number of identified peptides, but not the number of identified proteins, can be used as an objective benchmark to compare different reference sets.
Figure 1.
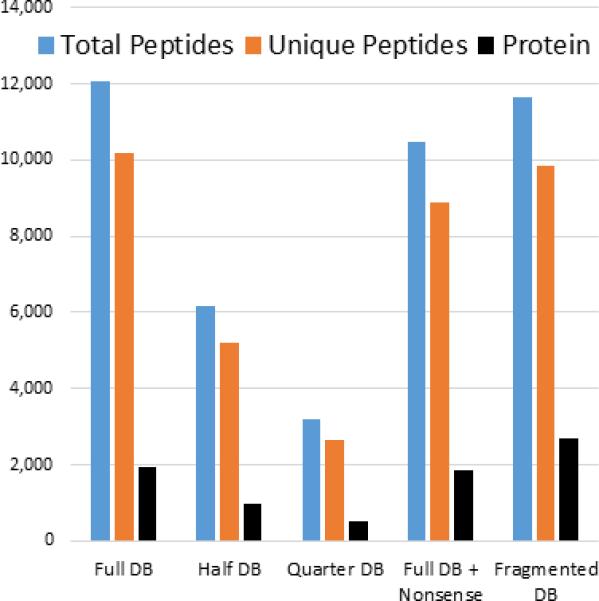
MS data can be used to evaluate relative reference database quality. Spectra from a tryptic digest of yeast lysate were searched against the standard yeast protein database (Full DB). Shown are the number of total peptide spectral matches (blue), unique peptides (orange), or proteins (black) that were confidently identified. To simulate “poor” reference databases, we removed half (half DB) or three quarters of proteins (Quarter DB) from the reference database. The number of identified PSMs and unique peptides scale approximately with the number or proteins in the database. To test how the addition of nonsense sequences would affect the number of identified peptides, we added randomized human proteins to the full yeast database (Full DB + Nonsense). The numbers of peptides and proteins are negatively affected. To simulate a reference database in which proteins are fragmented, we divided at a random position every protein in the reference into two proteins. While the number of identified peptides slightly decreases, the number of identified proteins substantially increases.
Deriving an mRNA-based protein reference database
For proteomic experiments with X. laevis, we needed to obtain a comprehensive, artifact-free reference protein database without using a genome. To guide our approach, we evaluated the success of each processing step by the number of identified peptides when searching our reference against MS/MS data from tryptic peptides of a X. laevis egg lysate. With this information we could evaluate alternative approaches while constructing the database, and choose the best possible option to improve our reference incrementally.
An overview of the process we used to generate our reference database, herein called PHROG (Proteomic Reference with Heterogeneous RNA Omitting the Genome), is shown in Figure 2. We combined information from publically available mRNA data as well as our own RNA-seq data, which we collected to study mRNA dynamics during early development. First, mRNA data from four sources (two RNA-seq de novo assemblies, transcripts from Genbank, and assembled contigs from the Xenopus Gene Indices) were combined, cleaned, and the repeats masked. The pre-processed transcripts were then clustered and assembled using parameters to maximize assembly, minimize spurious transcript fusions, and to collapse homeoalleles that are present in the quasi-tetraploid X. laevis. The assembled transcripts were compared in all six reading frames using BLASTX against proteins from six vertebrates in order to reveal the most likely translation frame, allowing us to bypass the introduction of large numbers of irrelevant protein sequences when using a six-frame translation. BLASTX alignments were also used to detect and correct for frameshifts that occurred due to sequencing errors. We then translated all transcripts in the BLASTX-hinted frame without regard to start and stop codons, ignoring translations from transcripts with a BLASTX E value >1E-5, as we hardly ever detected proteins from proteins with the indicated threshold (Fig. S2 A, B). This hinted translation/filtering method significantly outperformed alternative translation attempts (Table S1A). To determine if 'hidden' or never-before-seen proteins might be present in these removed transcripts, we used bona fide protein coding transcripts as an initial training set and used the HMM-based translation method. Adding these trained translations back did not increase our peptide discovery numbers (Table S1A). Next, the translated sequence's N-termini and C-termini were trimmed to remove sequence ends which were either up or downstream of start and stop codons or for which would produce fractions of tryptic peptides and therefore could not be detected via standard MS searches. The removal of invalid sequences from the database increased the number of identified peptides (Table S1B). After eliminating redundancies, our final database PHROG contained 79,214 proteins (Fig 2). Finally, to facilitate interpretation of identified protein sequences, we assigned protein names and gene symbols using a modified reciprocal best BLAST hit approach based on a target reference of curated human proteins. A summary of the composition of our database, and its performance for a proteomic experiment compared to alternative reference sets is shown in Table 1. Judged by the number of identified peptides, via MS, our database outperforms the protein reference from Xenbase, the gene models from X. tropicalis, a 6-frame translated database, and even the gene models from the unreleased genome assembly v7.0 (kindly provided by Dan Rokhsar). One alternative to PHROG is using a better-annotated reference set from a related species (e.g., X. tropicalis). However, when using mass spectrometry a single amino acid mismatch makes it impossible to identify a peptide. Using the X. laevis published proteins from Xenbase identifies ~70% more peptides compared to the X. tropicalis reference (Table 1). The preliminary gene models provide a significant improvement for peptide identification over previously known proteins. Surprisingly, even with latest assembly of the genome, our mRNA based approach identifies ~10% more peptides. When we combine PHROG with the preliminary gene models as protein reference, we only identify an additional ~1% of peptides compared to using PHROG alone. The PHROG 6-frame translated reference database is much larger than all other databases, and identifies ~10% fewer peptides compared to PHROG, likely because of additional false positive hits with irrelevant database entries, which hurts sensitivity (Table S2).
Figure 2.

Overview of the steps for constructing the high-quality protein reference set PHROG. Transcripts from four different sources were combined, trimmed and cleaned using SeqClean, masked using RepeatMasker, and clustered/assembled using TGICL/CAP3. The assembled transcripts were aligned against a collection of model vertebrate proteins using BLASTX. The results were used for identifying the correct translation frame, frameshift correction (if appropriate), and for removing sequences without significant similarity to known proteins. Once translated using BioPerl, the longest peptide for each protein is identified, and the ends are trimmed to match tryptic peptides. The collection is processed to remove 100% redundant proteins using CD-HIT, and gene symbols are assigned to the remaining members using the reciprocal or single best BLAST hit against human proteins. The numbers indicate the numbers of transcripts/proteins in each group.
1.
Table Comparison of different reference databases and their performance in one example run of a tryptic digested X. laevis egg lysate. The first two rows compare the number of protein entries and amino acid numbers in the different reference databases. Next are the number of PSMs and unique peptides identified, using the different reference databases. Last are the identified number of proteins with maximal parsimony.
| X. tropicalis Gene Models | X. laevis Xenbase | X. laevis Gene Models | PHROG | PHROG + X. laevis Gene Models | PHROG 6-frame | PHROG RNA-seq only | |
|---|---|---|---|---|---|---|---|
| Proteins in database | 43,455 | 34,178 | 44,159 | 79,214 | 123,373 | 610,557 | 71,716 |
| AA in database | 22,546,772 | 14,676,179 | 15,683,803 | 25,605,893 | 41,289,696 | 76,509,919 | 24,281,510 |
| PSMs | 9,300 | 16,142 | 17,354 | 18,867 | 19,030 | 17,564 | 17,156 |
| Unique peptides identified | 7,847 | 13,381 | 14,531 | 15,894 | 16,043 | 14,791 | 14,510 |
| Proteins identified | 1,850 | 2,505 | 2,969 | 3,130 | 3,176 | 3,098 | 2,923 |
One major advantage of our approach is that we combine mRNA information from various sources, thereby maximizing coverage. Besides our own RNA-seq data, we used publicly available mRNA sources for X. laevis, including expressed sequence tags, which are available for many non-standard model organisms in large quantity [24]. To demonstrate that the mRNA-based proteomics approach is also feasible without public mRNA data, we created a reference relying only on our own RNA-seq data. This database identifies 90% of peptides that the PHROG identifies, and approximately the same number of peptides as the X. laevis preliminary gene models (Table 1).
Deep genome-free proteomics demonstrated on the X. laevis egg
To demonstrate the power of the genome-free proteomics approach, we determined the proteomic content of the metaphase-arrested X. laevis egg. To obtain the deepest possible coverage, we digested the proteins with both LysC and Trypsin or LysC alone, fractionated each sample with a medium pH reverse-phase column, and analyzed the fractions with LC-MS. The acquired spectra were searched against our PHROG reference set, the preliminary gene models, and Xenbase protein database for comparison. The results are summarized in Figure 3. Using Xenbase's Genbank proteins known at the time of this writing, we identified 97,999 unique peptides. With the X. laevis 7.0 gene models, we identified 26% more. With our PHROG reference, we identified 143,476 unique peptides, an increase of 46% over Xenbase. When we match these peptides to the minimal number of proteins and filter to 1%FDR on the protein level, we identified 6,455 proteins from Xenbase, 9,720 proteins with the genome and 11,103 proteins from PHROG (Fig. 3B). Unexpectedly, the relative increase of proteins when comparing PHROG to Xenbase is larger than the relative increase in unique peptides. We believe this is mostly due to an overrepresentation of the highest abundant proteins in Xenbase (i.e. the proteins for which most MS/MS spectra will be collected) (Fig. S3). In contrast PHROG seems to allow us to identify many lower abundant proteins, which would be missed with the Xenbase reference set. Furthermore, PHROG might identify multiple splice forms or proteins with slightly different sequences e.g. alloaleles, which may be missing in Xenbase. Importantly, the numbers obtained with the very stringent filtering criteria used here indicate that this study is among the deepest proteomic analyses ever performed in any species.
Figure 3.

Comparison of protein reference databases for the fractionated X. laevis egg sample (49 MS-runs) A) Number of unique peptides identified with 0.5% FDR on the peptide level. PHROG significantly outperforms the publically available proteins from Xenbase and even the preliminary gene-models from the 7.0 genome assembly as reference database. B) Comparison of the number of proteins identified in the egg, with additional filtering to 1% FDR at the protein level, and maximal parsimony.
Estimation of the concentration of individual proteins in the X. laevis egg
Beyond providing a comprehensive list of identified proteins, we also wanted to estimate each protein's concentration. The difficult-to-predict ionization efficiency of peptides prevents us from directly measuring absolute protein abundance via MS. However, we can estimate each protein's concentration by summing up the ion current in the MS1 spectrum for all peptides of a protein, and normalize by the number of theoretical tryptic and LysC peptides [25]. We collected published concentrations for 50 proteins in Xenopus egg extract from the literature (Table S3) and plotted the concentration against the normalized ion current (Fig. 4A). The detected proteins with published concentrations range over four orders of magnitude from 30 μM for Nucleoplasmin [26] to 3 nM for the MAPKKK Mos; [27] from our panel, we only failed to detect the 20 pM Axin [28]. The Pearson correlation for published protein concentration and normalized ion-current in log-log space is 0.92 (Fig 4A). We confirmed that we did not overfit our data by performing a 10-fold cross validation, obtaining essentially the same result (not shown). Using this correlation, we regressed the protein concentration for all detected proteins (Fig. 4B, Table S4). With this approach the estimated protein concentration differs on average by 1.9-fold compared to the published protein concentrations. The histogram for all estimated protein concentrations shows a median of ~30 nM (Fig 4B).
Figure 4.

Estimation of protein abundance in the Xenopus egg. A) Previously published protein concentrations for 49 proteins versus measured ion-current in MS1 spectrum normalized to protein length. The Pearson correlation is 0.92. On average, the predicted protein concentration is approximately twofold different from the reported protein concentration. B) Histogram of concentration for all identified proteins regressed from normalized MS1 ion current. Median concentration of measured proteins is approximately 30 nM. C) Estimated concentration for subunits of stable complexes is similar. For the APC/C, we additionally distinguished between subunits which were reported to be dimeric (square) or monomeric (triangle) within the complex. While our accuracy is not good enough to separate the two populations, the estimated concentrations for dimeric subunits tend to be higher than monomeric subunits. D) Concentrations for enzymes of a metabolic pathway can vary widely. For each metabolic pathway, the predicted concentrations of its members are plotted (based on KEGG).
As an additional resource, we provide the protein concentrations summed by their assigned human gene symbols (Table S5). Several distinct Xenopus proteins were mapped to the same human gene symbol. This is because similar but distinct proteins in X. laevis matched the same human gene during gene symbol assignment. The search results from the preliminary genome indicate that we identify nearly ~10k distinct X. laevis genes (gene models do not contain splice variants).
For further validation, we asked if subunits of stable protein-complexes tend to have similar predicted concentrations. For ten stable complexes [29-31], we plotted the concentration of the subunits for each complex identified via the assigned gene symbols. Remarkably, the complexes' subunits cluster around similar concentrations, as shown in Fig. 4C. At first glance, the anaphase promoting complex (APC) subunits are scattered relatively widely. However, some of the APC subunits are known to be dimeric, while some are monomeric [30]. Our precision is not good enough to separate these populations, but the dimeric subunits tend to have higher concentrations than the monomeric subunits (Fig. 4C). Interestingly, when we perform a similar analysis with components of metabolic pathways, the component's concentrations often vary by many orders of magnitude (Fig. 4D).
Relationship of mRNA abundance and protein abundance
Given our previous work in Xenopus transcriptomics, [32] we sought to understand the relationship between mRNA and protein abundance. Using standard methods to estimate the abundance of the RNA-seq transcripts, we calculate the Pearson correlation of mRNA and protein abundance to be 0.32, while the Spearman correlation is 0.30 (in log-log space; Fig. S4); these values are low compared to previous studies in tissue culture cells [2, 25, 33]. Unlike tissue culture cells, the X. laevis egg which originates from the oocyte emerges with a potentially different proteome and transcriptome after maturation. Although the correlation of protein and mRNA abundance is weak, we are more likely to observe the corresponding protein the more abundant the mRNA is (Fig. 5A). We asked if there were systematically overrepresented classes of genes that could only be seen via RNA-seq [34]. After mapping 4,675 gene symbols to our RNA-seq data, we found that membrane proteins (2,013 gene symbols), proteins involved in cell differentiation (894 gene symbols), transcription factors (316 gene symbols), and extracellular matrix proteins (189 gene symbols) are significantly overrepresented in the mRNA-only set (E-values < 1E-10). Membrane proteins are known to be harder to detect via MS than soluble proteins, but we currently cannot distinguish if membrane proteins are overrepresented as RNA because of MS sensitivity issues, or because they are not expressed in the egg and are stockpiled for later translation. The same is true for the typically low-abundant transcription factors. For proteins used in differentiation and for extracellular matrix proteins, it seems more likely that the mRNA is present in the egg and will be expressed only during later stages of development.
Figure 5.

mRNA and protein abundance. A) Histogram of mRNA levels in the egg. mRNA for which the protein was also detected is colored in blue. Orange indicates that only mRNA was detected. The median of mRNA concentration is approximately 1000 fold lower than the median for protein abundance. Though we see only a weak correlation between mRNA and protein abundance (0.32 Pearson correlation), the lower the mRNA concentration, the less likely we are to detect the corresponding protein. B) mRNA and protein were matched via assigned gene symbols. MS is able to identify approximately 60% of all gene symbols for which we could detect mRNA. The proteins which we cannot detect via MS are overrepresented by transcription factors, proteins involved in differentiation, and trans-membrane proteins. Contrary, for ~350 gene symbols we could identify only proteins and not mRNA. This group is highly enriched for blood plasma and liver proteins, and were likely endocytosed during oocyte growth.
With the current state of technology, RNA-seq is more sensitive than protein detection via mass spectrometry. Therefore, we were surprised to find 368 proteins for which we could not find any mRNA support. After running a gene set enrichment analyses with these proteins, we found that they were significantly enriched for blood plasma and liver proteins (Fig. 5B, Table S6). During oocyte maturation, the yolk protein vitellogenin is synthesized in the liver and transported via the blood plasma to the oocyte, where it is endocytosed [35, 36]. We conclude that many proteins, besides vitellogenin, are also likely to be taken up via endocytosis from the blood plasma during oogenesis. Metabolic labeling experiments in the 1960s noted a small uptake of serum proteins in whole ovary but did not identify any of them [37]. It will be important to evaluate the intracellular role of these proteins during embryonic development.
Discussion
We present here the deepest proteomic study ever performed in X. laevis, and one of the deepest in any organism. We identified ~11k proteins and estimated each protein's concentration, ranging more than four orders of magnitude, with an approximate average error of two-fold. It might be possible to further improve protein concentration predictions by combining normalized ion-current with peptide detectability prediction algorithms [38-40]. Our results will be a highly valuable resource for the Xenopus egg extract community for data mining, planning new experiments, and complementing previous knowledge. For the development community, it begins to define the dowry of the egg and widens the opportunity for study of translational control, fertilization, and the maternal-zygotic transition. The large amount of material obtainable from Xenopus eggs and embryos, coupled with this new resource, should encourage the use of proteomics in development.
We started working on X. laevis proteomics in 2011 without access to a genome. We wanted to take advantage of proteomics in this unique system, and had to develop the genome-free methods presented in this study out of necessity. While this was intended as a preliminary effort, we were surprised how well the approach worked, especially as we can compare it now to the early gene models. Ultimately, a high-quality genome with well-annotated gene models will likely provide the highest quality reference set possible for RNA and protein analysis. However, reference sets based on mRNA are much cheaper and faster to obtain than gene models from genomic data. Based on this study, we now believe that mRNA-derived proteomic data could assist in building more accurate gene models by using identified peptide sequences to identify exons. Recent studies suggest that even for model organisms with well annotated genomes (e.g. rat or mouse) utilizing gene models based on RNA-seq evidence increases the information that can be gained from proteomic experiments [41, 42]. Furthermore, the relative quality of gene models, generated with different parameters, could be evaluated and potentially improved by utilizing the number of identified peptides from a proteomic experiment as a bench-mark.
The proteomic data from the X. laevis egg illustrates the feasibility of genome-free proteomics, which can be extended to any non-standard organism. One advantage of the methods is that mRNA data can be combined from heterogeneous resources. For many species, multiple ESTs and some full-length sequence information is available (e.g. http://compbio.dfci.harvard.edu/tgi/tgipage.html) [24]. However, only relying on our RNA-seq data genome-free proteomics is possible. About ~10% of unique peptide data was lost by only using RNA-seq data from embryonic development; however based on the findings in this paper one could likely minimize this loss by adding mRNA data from the adult liver. We have integrated our series of pipeline scripts into an online resource that creates a high-quality protein reference database from heterogeneous mRNA sources, and that resource can be found at http://kirschner.med.harvard.edu/tools/mz_ref_db.html.
Amino acid sequence information alone is not very informative. Rather, one needs to integrate that information with previous knowledge of proteins and their functions, e.g. which proteins bind to form a complex, which proteins are part of a metabolic pathway, or simply what is the protein's name from which one can access the literature. For non-standard model organisms, it is unlikely that there is much previous knowledge with proteins from that species. However, by relating sequence similarity to human proteins, one can assign proteins to gene symbols and then interpret protein levels for development. One unexpected finding in Xenopus is that many proteins, which could be identified by MS, had no observable mRNA in the egg. We found that these were almost certainly proteins produced in the liver and endocytosed from blood. We also found mRNAs without protein, and this suggests that certain transcripts may be stockpiled in the egg for translation at later stages of development.
This study demonstrates the power of genome-free proteomics, and our online tool increases the scope of proteomic experiments. Knowledge of the level of protein expression can offer new insight into molecular regulation and provides a valuable resource for both biochemical and developmental work in Xenopus.
Experimental Procedures
Sample preparation for mass-spectrometry
Female Xenopus laevis were induced with 700U HCG. After 14 hours, eggs were harvested, washed with 1x MMR, and dejellied with Cysteine (2% w/v), pH 8.0. 60 eggs were flash frozen with liquid nitrogen. Eggs were lysed with 250 mM Sucrose, 1% NP40 Substitute (Sigma), 5mM EDTA (pH 7.2), 1 Roche Complete mini tablet (EDTA free), 20 mM HEPES (pH 7.2), 10 μM Combretastatin 4A, and 10 μM Cyochalasin D. For lysis, eggs were vortexed at maximum speed for ten seconds, pipetted ten times up and down with a 200μL pipette tip, incubated on ice for 10 minutes, and again vortexed for ten seconds. Lysates were clarified by centrifugation at 4,500 RCF at 4° C for 4 minutes in a tabletop centrifuge. The cytoplasmic + lipid layers were mixed by gentle flicking and removed from the pelleted yolk. Additional HEPES (pH 7.2) was added to 100 mM, along with SDS added to 2% (w/v). The sample was reduced with 5 mM DTT for 20 minutes at 60°C, then alkylated with 15 mM NEM for 20 minutes at room temperature (RT). Excess NEM was reacted with an additional 5 mM DTT at RT. Proteins were isolated by methanol/chloroform precipitation [43]. The protein pellet was resuspended (~5 mg/mL) in 6 M Guanidine HCl in 50 mM HEPES (pH 8.5) and sonicated for five minutes. The sample was diluted to 2 M Guanidine with 50 mM HEPES (pH 8.5) and digested with LysC (Wako Chemicals) at 20 ng/μL at RT for 14 hours. Next, we diluted Guanidine HCl with 50 mM HEPES (pH 8.5) to 0.5 M and digested further with 10 ng/μL of sequencing grade Trypsin (Roche) at 37°C for 8 hours or LysC at an additional 20ng/μL at RT. Samples were subjected to C18 solid-phase extraction (SPE) (SepPak, Waters) to desalt and isolate peptides. To reduce sample complexity, ~1mg LysC peptides and 0.5mg LysC/Trypsin peptides were resuspended in a 10 mM sodium carbonate buffer (pH 8.0), then fractionated by medium pH reverse-phase HPLC (Zorbax 300Extend-C18, 4.6 X 250 mm column, Agilant) using an Acetonitrile gradient from 6% - 31%. With a flow rate of 0.8 mL/min, fractions were collected into a 96 well-plate every 38 seconds, then pooled into 24 fractions by combining alternating wells from each column of the plate. Each fraction was dried and resuspended in 20μL of 1% phosphoric acid. Peptides from each fraction were desalted and extracted once more with reverse-phase purification, [44] resuspended in 10μL 1% formic acid. Approximately 4 μL per fraction were analyzed by LCMS.
Estimation of protein concentration
Published protein concentrations were collected from the literature (Table S3). To obtain the MS1 ion-current, the MS1 precursor peptides intensities was divided by the corresponding noise value (Thermo raw file). This Signal/Noise is a proxy for the number of charges in an Orbitrap analyzer [45]. To convert charges into Ion-current we divided by the MS1 ion-injection time. For each PSM, we recorded the maximum ion-current during a peptide's elution. These ion-currents were summed for all PSMs that matched a protein, [25] and normalized to the number of theoretically calculated tryptic plus LysC peptides, with at least 7 and maximally 25 amino acids (missed cleavages were not allowed for theoretical peptides). The published protein name was searched on the HUGO gene name database to assign gene names (http://www.genenames.org/). If multiple proteins that had been matched with the same gene symbol were found in the MS-data set, their MS1 ion current were summed. On occasion, multiple gene symbols were combined. For complete description of which gene symbols were combined and further assumptions required for converting published values into cytoplasmic concentrations, see Table S3.
PHROG final build
X. laevis transcripts from Genbank, X. laevis Gene Indices v11 [24, 46], and the de novo assemblies from the wild-type and J-line RNA-seq data were combined (ensuring unique identifiers), cleaned and trimmed using SeqClean (http://compbio.dfci.harvard.edu/tgi/software/), and masked for common repeat motifs using RepeatMasker [47] with its default libraries. The cleaned sequences were clustered with TGICL [46], using default parameters (93% identity) except requiring a 100 bp overlap, and assembled using CAP3 [48] with default parameters (92% identity). The contigs and singletons were searched against a small database of model chordate proteins (H. sapiens, M. musculus, G. gallus, D. rerio, X. tropicalis, X. laevis) using BLASTX [49], and the full BLASTX reports parsed for strand, translation frame, expectation (E) value, bit score, and alignment coordinates of both query and subject. Before translation, the parsed data was processed to select transcripts that show possible frame shifts, as determined by translation frames of the high scoring pairs (HSPs); the sequences of such transcripts were adjusted to compensate for and to retain the translation frame of the best HSP. All transcripts (corrected and not) that showed conserved alignments (E <= 1e-5) were fully translated, without regard to the best ORF, in the hinted frame; those that did not were discarded. The translated proteins were subsequently processed as follows: 1) the longest peptide from the full translation was retained; 2) protein ends were trimmed to reflect potential trypsin digest peptides; 3) any resulting protein fragments < 7 amino-acids were discarded. Finally, the remaining proteins were processed by CD-HIT [50] with a threshold of 100% to collapse the group into a non-redundant dataset. Alternative references PHROG: The 6-frame translation of the PHROG was performed according to Evans et al. [11] using the transcripts post-TGICL/CAP3 clustering and assembly but prior to any filtering/trimming. The HMM-based translation of PHROG was performed on the same transcripts using TransDecoder from the Trinity suite, translating on the positive strand only (-S) and with a minimum size of 24 amino acids (-m 24). The ‘best-guess’ translation was performed using Virtual Ribosome [51], using parameters to translate on any strand and return the longest ORF. All translations were also processed by CD-HIT with a threshold of 100% [50].
Resources
The scripts and short protocol for usage, the protein database generation pipeline, and the PHROG FASTA file are available as an online resource at http://kirschner.med.harvard.edu/tools/mz_ref_db.html. The mass spectrometry proteomics data have been deposited to the ProteomeXchange Consortium [52] via the PRIDE partner repository with the dataset identifier PXD000926.
Supplementary Material
Highlights.
Genome-free proteomics identifies more than 11k proteins in the X. laevis egg
Each protein's expression level is predicted with approximately 2-fold precision
Many blood plasma proteins are taken up from oocyte during growth in the ovary
Web tool generates proteomic reference sets from mRNA data for any organism
In Brief.
Wühr et al. demonstrate the feasibility of deep proteomics, without the use of a sequenced genome, using the example of the egg of the African clawed frog Xenopus laevis. The authors identify more than 11,000 proteins and can predict each protein's expression level with approximately two-fold precision.
Acknowledgements
We would like to thank R. Harland, D. Rokhsar, and the X. laevis genome consortium for making the preliminary Gene Models of X. laevis available. We thank Ramin Rad for his programming help, and the RITG team for their HPC assistance. Thanks to Woong Kim, Robert Everley and Joao Paulo for maintaining mass spectrometers, and the Gygi computer room for bioinformatics support. This work was supported by NIH grants R01GM103785, R01HD073104, P40OD010997, and R01DK077197. We thank MBL for their support to this project.
Footnotes
Publisher's Disclaimer: This is a PDF file of an unedited manuscript that has been accepted for publication. As a service to our customers we are providing this early version of the manuscript. The manuscript will undergo copyediting, typesetting, and review of the resulting proof before it is published in its final citable form. Please note that during the production process errors may be discovered which could affect the content, and all legal disclaimers that apply to the journal pertain.
References
- 1.Huttlin EL, Jedrychowski MP, Elias JE, Goswami T, Rad R, Beausoleil SA, Villen J, Haas W, Sowa ME, Gygi SP. A tissue-specific atlas of mouse protein phosphorylation and expression. Cell. 2010;143:1174–1189. doi: 10.1016/j.cell.2010.12.001. [DOI] [PMC free article] [PubMed] [Google Scholar]
- 2.Nagaraj N, Wisniewski JR, Geiger T, Cox J, Kircher M, Kelso J, Paabo S, Mann M. Deep proteome and transcriptome mapping of a human cancer cell line. Mol Syst Biol. 2011;7:548. doi: 10.1038/msb.2011.81. [DOI] [PMC free article] [PubMed] [Google Scholar]
- 3.Beck M, Schmidt A, Malmstroem J, Claassen M, Ori A, Szymborska A, Herzog F, Rinner O, Ellenberg J, Aebersold R. The quantitative proteome of a human cell line. Mol Syst Biol. 2011;7:549. doi: 10.1038/msb.2011.82. [DOI] [PMC free article] [PubMed] [Google Scholar]
- 4.Kragl M, Knapp D, Nacu E, Khattak S, Maden M, Epperlein HH, Tanaka EM. Cells keep a memory of their tissue origin during axolotl limb regeneration. Nature. 2009;460:60–65. doi: 10.1038/nature08152. [DOI] [PubMed] [Google Scholar]
- 5.di Prisco G, Cocca E, Parker S, Detrich H. Tracking the evolutionary loss of hemoglobin expression by the white-blooded Antarctic icefishes. Gene. 2002;295:185–191. doi: 10.1016/s0378-1119(02)00691-1. [DOI] [PubMed] [Google Scholar]
- 6.Abzhanov A, Protas M, Grant BR, Grant PR, Tabin CJ. Bmp4 and morphological variation of beaks in Darwin's finches. Science. 2004;305:1462–1465. doi: 10.1126/science.1098095. [DOI] [PubMed] [Google Scholar]
- 7.Thomson KS. An attempt to reconstruct evolutionary changes in the cellular DNA content of lungfish. Journal of Experimental Zoology. 1972;180:363–371. [Google Scholar]
- 8.Straus NA. Comparative DNA renaturation kinetics in amphibians. Proceedings of the National Academy of Sciences of the United States of America. 1971;68:799–802. doi: 10.1073/pnas.68.4.799. [DOI] [PMC free article] [PubMed] [Google Scholar]
- 9.McGrath CL, Katz LA. Genome diversity in microbial eukaryotes. Trends Ecol Evol. 2004;19:32–38. doi: 10.1016/j.tree.2003.10.007. [DOI] [PubMed] [Google Scholar]
- 10.Wang Z, Gerstein M, Snyder M. RNA-Seq: a revolutionary tool for transcriptomics. Nat Rev Genet. 2009;10:57–63. doi: 10.1038/nrg2484. [DOI] [PMC free article] [PubMed] [Google Scholar]
- 11.Evans VC, Barker G, Heesom KJ, Fan J, Bessant C, Matthews DA. De novo derivation of proteomes from transcriptomes for transcript and protein identification. Nature methods. 2012;9:1207–1211. doi: 10.1038/nmeth.2227. [DOI] [PMC free article] [PubMed] [Google Scholar]
- 12.Looso M, Borchardt T, Kruger M, Braun T. Advanced identification of proteins in uncharacterized proteomes by pulsed in vivo stable isotope labeling-based mass spectrometry. Molecular & cellular proteomics : MCP. 2010;9:1157–1166. doi: 10.1074/mcp.M900426-MCP200. [DOI] [PMC free article] [PubMed] [Google Scholar]
- 13.Newport J, Kirschner M. A major developmental transition in early Xenopus embryos: II. Control of the onset of transcription. Cell. 1982;30:687–696. doi: 10.1016/0092-8674(82)90273-2. [DOI] [PubMed] [Google Scholar]
- 14.Desai A, Murray A, Mitchison TJ, Walczak CE. The use of Xenopus egg extracts to study mitotic spindle assembly and function in vitro. Methods Cell Biol. 1999;61:385–412. doi: 10.1016/s0091-679x(08)61991-3. [DOI] [PubMed] [Google Scholar]
- 15.Murray AW, Kirschner MW. Cyclin synthesis drives the early embryonic cell cycle. Nature. 1989;339:275–280. doi: 10.1038/339275a0. [DOI] [PubMed] [Google Scholar]
- 16.Wühr M, Tan ES, Parker SK, Detrich HW, 3rd, Mitchison TJ. A model for cleavage plane determination in early amphibian and fish embryos. Curr Biol. 2010;20:2040–2045. doi: 10.1016/j.cub.2010.10.024. [DOI] [PMC free article] [PubMed] [Google Scholar]
- 17.Hughes MK, Hughes AL. Evolution of duplicate genes in a tetraploid animal, Xenopus laevis. Mol Biol Evol. 1993;10:1360–1369. doi: 10.1093/oxfordjournals.molbev.a040080. [DOI] [PubMed] [Google Scholar]
- 18.Goffeau A, Barrell BG, Bussey H, Davis RW, Dujon B, Feldmann H, Galibert F, Hoheisel JD, Jacq C, Johnston M, et al. Life with 6000 genes. Science. 1996;274:546, 563–547. doi: 10.1126/science.274.5287.546. [DOI] [PubMed] [Google Scholar]
- 19.Elias JE, Gygi SP. Target-decoy search strategy for increased confidence in large-scale protein identifications by mass spectrometry. Nat Methods. 2007;4:207–214. doi: 10.1038/nmeth1019. [DOI] [PubMed] [Google Scholar]
- 20.Wühr M, Haas W, McAlister GC, Peshkin L, Rad R, Kirschner MW, Gygi SP. Accurate multiplexed proteomics at the MS2 level using the complement reporter ion cluster. Analytical Chemistry. 2012;84:9214–9221. doi: 10.1021/ac301962s. [DOI] [PMC free article] [PubMed] [Google Scholar]
- 21.Nesvizhskii AI, Keller A, Kolker E, Aebersold R. A statistical model for identifying proteins by tandem mass spectrometry. Analytical Chemistry. 2003;75:4646–4658. doi: 10.1021/ac0341261. [DOI] [PubMed] [Google Scholar]
- 22.Cox J, Mann M. MaxQuant enables high peptide identification rates, individualized p.p.b.-range mass accuracies and proteome-wide protein quantification. Nature biotechnology. 2008;26:1367–1372. doi: 10.1038/nbt.1511. [DOI] [PubMed] [Google Scholar]
- 23.Chvatal V. A Greedy Heuristic for the Set-Covering Problem. Mathematics of Operations Research. 1979;4:233–235. [Google Scholar]
- 24.Quackenbush J, Liang F, Holt I, Pertea G, Upton J. The TIGR gene indices: reconstruction and representation of expressed gene sequences. Nucleic acids research. 2000;28:141–145. doi: 10.1093/nar/28.1.141. [DOI] [PMC free article] [PubMed] [Google Scholar]
- 25.Schwanhausser B, Busse D, Li N, Dittmar G, Schuchhardt J, Wolf J, Chen W, Selbach M. Global quantification of mammalian gene expression control. Nature. 2011;473:337–342. doi: 10.1038/nature10098. [DOI] [PubMed] [Google Scholar]
- 26.Mills AD, Laskey RA, Black P, De Robertis EM. An acidic protein which assembles nucleosomes in vitro is the most abundant protein in Xenopus oocyte nuclei. Journal of Molecular Biology. 1980;139:561–568. doi: 10.1016/0022-2836(80)90148-5. [DOI] [PubMed] [Google Scholar]
- 27.Huang CY, Ferrell JE., Jr. Ultrasensitivity in the mitogen-activated protein kinase cascade. Proceedings of the National Academy of Sciences of the United States of America. 1996;93:10078–10083. doi: 10.1073/pnas.93.19.10078. [DOI] [PMC free article] [PubMed] [Google Scholar]
- 28.Lee E, Salic A, Kruger R, Heinrich R, Kirschner MW. The roles of APC and Axin derived from experimental and theoretical analysis of the Wnt pathway. PLoS Biol. 2003;1:E10. doi: 10.1371/journal.pbio.0000010. [DOI] [PMC free article] [PubMed] [Google Scholar]
- 29.Lawo S, Bashkurov M, Mullin M, Ferreria MG, Kittler R, Habermann B, Tagliaferro A, Poser I, Hutchins JR, Hegemann B, et al. HAUS, the 8-subunit human Augmin complex, regulates centrosome and spindle integrity. Current biology : CB. 2009;19:816–826. doi: 10.1016/j.cub.2009.04.033. [DOI] [PubMed] [Google Scholar]
- 30.Zhang Z, Yang J, Kong EH, Chao WC, Morris EP, da Fonseca PC, Barford D. Recombinant expression, reconstitution and structure of human anaphase-promoting complex (APC/C). Biochem J. 2013;449:365–371. doi: 10.1042/BJ20121374. [DOI] [PubMed] [Google Scholar]
- 31.Ruepp A, Waegele B, Lechner M, Brauner B, Dunger-Kaltenbach I, Fobo G, Frishman G, Montrone C, Mewes HW. CORUM: the comprehensive resource of mammalian protein complexes--2009. Nucleic acids research. 2010;38:D497–501. doi: 10.1093/nar/gkp914. [DOI] [PMC free article] [PubMed] [Google Scholar]
- 32.Yanai I, Peshkin L, Jorgensen P, Kirschner MW. Mapping gene expression in two Xenopus species: evolutionary constraints and developmental flexibility. Developmental cell. 2011;20:483–496. doi: 10.1016/j.devcel.2011.03.015. [DOI] [PMC free article] [PubMed] [Google Scholar]
- 33.Tian Q, Stepaniants SB, Mao M, Weng L, Feetham MC, Doyle MJ, Yi EC, Dai H, Thorsson V, Eng J, et al. Integrated genomic and proteomic analyses of gene expression in Mammalian cells. Molecular & cellular proteomics : MCP. 2004;3:960–969. doi: 10.1074/mcp.M400055-MCP200. [DOI] [PubMed] [Google Scholar]
- 34.Wang J, Duncan D, Shi Z, Zhang B. WEB-based GEne SeT AnaLysis Toolkit (WebGestalt): update 2013. Nucleic acids research. 2013;41:W77–83. doi: 10.1093/nar/gkt439. [DOI] [PMC free article] [PubMed] [Google Scholar]
- 35.Opresko LK, Karpf RA. Specific proteolysis regulates fusion between endocytic compartments in Xenopus oocytes. Cell. 1987;51:557–568. doi: 10.1016/0092-8674(87)90125-5. [DOI] [PubMed] [Google Scholar]
- 36.Opresko L, Wiley HS, Wallace RA. Differential postendocytotic compartmentation in Xenopus oocytes is mediated by a specifically bound ligand. Cell. 1980;22:47–57. doi: 10.1016/0092-8674(80)90153-1. [DOI] [PubMed] [Google Scholar]
- 37.Wallace RA, Jared DW. Studies on amphibian yolk. 8. The estrogen-induced hepatic synthesis of a serum lipophosphoprotein and its selective uptake by the ovary and trasformation into yolk platelet proteins in Xenopus laevis. Dev Biol. 1969;19:498–526. doi: 10.1016/0012-1606(69)90085-2. [DOI] [PubMed] [Google Scholar]
- 38.Arike L, Valgepea K, Peil L, Nahku R, Adamberg K, Vilu R. Comparison and applications of label-free absolute proteome quantification methods on Escherichia coli. J Proteomics. 2012;75:5437–5448. doi: 10.1016/j.jprot.2012.06.020. [DOI] [PubMed] [Google Scholar]
- 39.Vogel C, Marcotte EM. Label-free protein quantitation using weighted spectral counting. Methods in molecular biology. 2012;893:321–341. doi: 10.1007/978-1-61779-885-6_20. [DOI] [PMC free article] [PubMed] [Google Scholar]
- 40.Fusaro VA, Mani DR, Mesirov JP, Carr SA. Prediction of high-responding peptides for targeted protein assays by mass spectrometry. Nature biotechnology. 2009;27:190–198. doi: 10.1038/nbt.1524. [DOI] [PMC free article] [PubMed] [Google Scholar]
- 41.Low TY, van Heesch S, van den Toorn H, Giansanti P, Cristobal A, Toonen P, Schafer S, Hubner N, van Breukelen B, Mohammed S, et al. Quantitative and qualitative proteome characteristics extracted from in-depth integrated genomics and proteomics analysis. Cell Rep. 2013;5:1469–1478. doi: 10.1016/j.celrep.2013.10.041. [DOI] [PubMed] [Google Scholar]
- 42.Menschaert G, Van Criekinge W, Notelaers T, Koch A, Crappe J, Gevaert K, Van Damme P. Deep proteome coverage based on ribosome profiling aids mass spectrometry-based protein and peptide discovery and provides evidence of alternative translation products and near-cognate translation initiation events. Molecular & cellular proteomics : MCP. 2013;12:1780–1790. doi: 10.1074/mcp.M113.027540. [DOI] [PMC free article] [PubMed] [Google Scholar]
- 43.Wessel D, Flugge UI. A method for the quantitative recovery of protein in dilute solution in the presence of detergents and lipids. Anal Biochem. 1984;138:141–143. doi: 10.1016/0003-2697(84)90782-6. [DOI] [PubMed] [Google Scholar]
- 44.Lohse MM, Bolger AMA, Nagel AA, Fernie ARA, Lunn JEJ, Stitt MM, Usadel BB. RobiNA: a user-friendly, integrated software solution for RNA-Seq-based transcriptomics. Nucleic Acids Research. 2012;40:W622–W627. doi: 10.1093/nar/gks540. [DOI] [PMC free article] [PubMed] [Google Scholar]
- 45.Makarov A, Denisov E. Dynamics of Ions of Intact Proteins in the Orbitrap Mass Analyzer. J. Am. Soc. Mass Spectrom. 2009;20:1486–1495. doi: 10.1016/j.jasms.2009.03.024. [DOI] [PubMed] [Google Scholar]
- 46.Pertea GG, Huang XX, Liang FF, Antonescu VV, Sultana RR, Karamycheva SS, Lee YY, White JJ, Cheung FF, Parvizi BB, et al. TIGR Gene Indices clustering tools (TGICL): a software system for fast clustering of large EST datasets. Bioinformatics. 2003;19:651–652. doi: 10.1093/bioinformatics/btg034. [DOI] [PubMed] [Google Scholar]
- 47.Smit A, Hubley R, Green P. RepeatMasker Open-3.0. 1996-2010 [Google Scholar]
- 48.Huang X, Madan A. CAP3: A DNA sequence assembly program. Genome Res. 1999;9:868–877. doi: 10.1101/gr.9.9.868. [DOI] [PMC free article] [PubMed] [Google Scholar]
- 49.Altschul SF, Gish W, Miller W, Myers EW, Lipman DJ. Basic local alignment search tool. Journal of Molecular Biology. 1990;215:403–410. doi: 10.1016/S0022-2836(05)80360-2. [DOI] [PubMed] [Google Scholar]
- 50.Li W. Cd-hit: a fast program for clustering and comparing large sets of protein or nucleotide sequences. Bioinformatics. 2006;22:1658–1659. doi: 10.1093/bioinformatics/btl158. [DOI] [PubMed] [Google Scholar]
- 51.Wernersson R. Virtual Ribosome--a comprehensive DNA translation tool with support for integration of sequence feature annotation. Nucleic Acids Research. 2006;34:W385–388. doi: 10.1093/nar/gkl252. [DOI] [PMC free article] [PubMed] [Google Scholar]
- 52.Vizcaino JA, Deutsch EW, Wang R, Csordas A, Reisinger F, Rios D, Dianes JA, Sun Z, Farrah T, Bandeira N, et al. ProteomeXchange provides globally coordinated proteomics data submission and dissemination. Nature Biotechnology. 2014;32:223–226. doi: 10.1038/nbt.2839. [DOI] [PMC free article] [PubMed] [Google Scholar]
Associated Data
This section collects any data citations, data availability statements, or supplementary materials included in this article.