Abstract
Purpose
Diffusion tensor imaging (DTI) plays a vital role in identifying white-matter fiber bundles. Achievable imaging resolution and imaging time demands remain the major challenges in detecting small fiber bundles with current clinical DTI sequences.
Methods
A novel reduced field-of-view ultra-high resolution DTI technique named eZOOM (elliptically refocused zonally oblique multislice) was developed. Utilizing spatially selective RF pulses a small circular disk is imaged, reducing the imaging matrix size. The frequency profile of the spectral-spatial refocusing RF pulse provides intrinsic fat suppression, eliminating the need for fat saturation pulses.
Results
Multislice DTI at a resolution of 0.35×0.35 mm in a celery fiber phantom was successfully performed scanning an 8 cm field-of-view at 3T. An adequate diffusion-to-noise ratio (DNR>20) was achieved for a 25 minutes acquisition using a direct-sampling RF receiver. Human subjects (n=7) were scanned at resolutions of 0.47×0.47 mm having a DNR<20 within 75 minutes scanning time, requiring further enhancements to increase the signal-to-noise ratio.
Conclusions
The new eZOOM-DTI method offers multislice DTI at ultra-high imaging resolutions substantially exceeding those available with current echo-planar DTI techniques. Parallel and fast spin-echo methods can be combined with eZOOM to improve SNR and DNR in humans.
Keywords: MRI; diffusion; white matter imaging, ultra-high resolution; RF pulse design; pulse sequence design
Introduction
Diffusion tensor imaging (DTI) is currently the only non-invasive in-vivo MRI method to image white-matter pathways in the human central nervous system. However, many fiber bundles that are essential to maintain brain functions beyond the basic sensory and motor skills are too small to be imaged with standard clinical DTI. Research techniques that seek to improve spatial resolution for DTI can take prohibitively long to acquire imaging data. In practice, most of these DTI techniques are limited to anesthetized animals (1), cadavers, and ex-vivo samples (2). As it is often sufficient to acquire a limited volume of the brain at high resolution for treatment planning, a novel high-resolution DTI method has been developed taking advantage of reduced field-of-view (FOV) imaging.
The technique is demonstrated in humans by imaging the temporal stem and adjacent posterior region, a part of the anterior temporal lobe, which is the primary resection target for temporal lobe epilepsy (3). The temporal stem, while having a limited spatial extent that can be fully covered by reduced-FOV imaging, includes numerous fibers of functional importance, such as the uncinate fasciculus, fimbria-fornix, occipto-frontal fasciculus, and optic radiations with Meyer’s loop. It is an important white-matter bridge between the frontal and temporal lobes, plays an important role in numerous disorders, and is a route of tumor and seizure spread (4). Common complications after temporal lobe resection are visual field deficits (5), language and naming deficits (6), and Wallerian white-matter degeneration following the surgery (7, 8). Providing high-resolution localizing information may allow sparing crucial fiber bundles to avoid associated post-operative deficits.
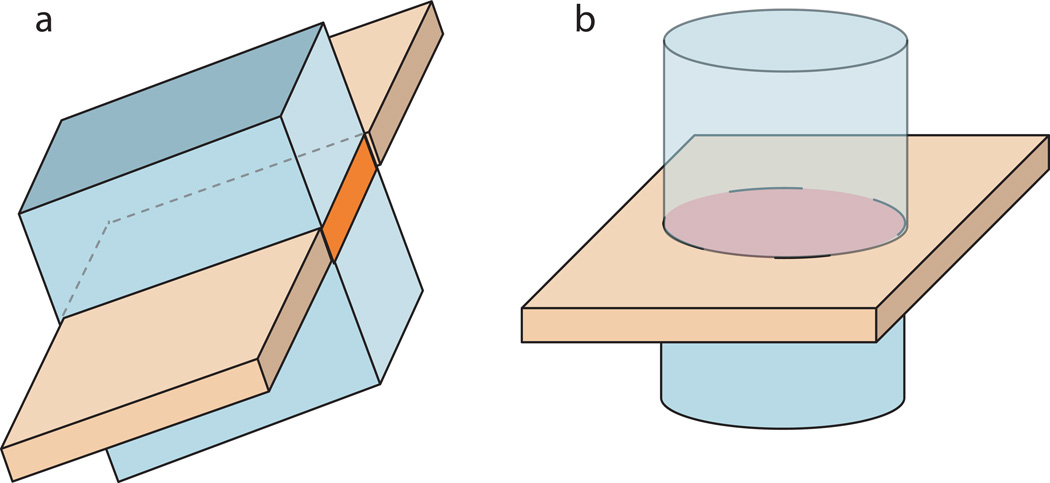
In previous studies, reduced FOV imaging with spin-echo sequences has been implemented by changing the plane of the refocusing pulse relative to the excitation pulse. Examples of such implementations are Zonally Oblique Oriented Magnified Echo Planar Imaging (ZOOM-EPI) by Mansfield (9) or Contiguous ZOOM (CO-ZOOM) by Dowell et al. (10). CO-ZOOM extended Mansfield’s ZOOM method for twice-refocused spin-echo (TRSE) experiments. The second refocusing pulse in the CO-ZOOM sequence restores equilibrium of the spin ensemble for the volume adjacent to the excited slice which magnetization has been inverted by the first slab selective refocusing pulse. The resulting MR signal shows phase coherence for a rectangular FOV (Figure 1a). Applying a second refocusing pulse to restore magnetic equilibrium improves imaging time efficiency, which was already used in an earlier study by Jeong et. al (11) who placed the second refocusing pulse after signal readout.
Figure 1.
Excitation (orange) and refocusing plane (light blue) for inner-volume methods. ZOOM (and CO-ZOOM) on the left refocusing a slab orthogonal to the excitation plane thereby imaging a rectangular field-of-view, and eZOOM on the right refocusing a cylinder thereby imaging a circular disk (the intersection of excitation and refocusing volumes).
Single-shot (one excitation per image slice) EPI is used in most clinical DTI acquisitions. However, it is limited by the duration of the readout window and the associated transverse T2* signal decay, widening the point-spread function and limiting the achievable image resolution. Multi-shot interleaved signal readout reduces readout time and increases achievable image resolution. In multi-shot interleaved imaging, a proportional fraction of k-space lines that make up the Fourier transformed image are collected with each excitation. These partial images (interleafs) are then combined for image reconstruction accounting for the global image phase variations between acquisitions. Spiral trajectories can be designed to include intrinsic navigation to correct for phase errors. A variable density (VD) spiral trajectory with an exponential radial function samples the center and periphery of the trajectory at different densities. The fully sampled k-space center is then used to phase-correct diffusion weighted image interleafs before summation as previously done in high-resolution DTI sequences (12–14).
In this study the TRSE implementation was combined with elliptical volume selective RF pulses (instead of slab selective refocusing) to refocus a volume of interest. The resulting sequence was named eZOOM (elliptically refocused zonally oblique multislice), recognizing the original concept of the ZOOM reduced FOV approach improved by two refocusing pulses (as in CO-ZOOM), but implementing elliptical refocusing pulses to select a small circular region-of-interest (ROI) (Figure 1b). Combining elliptical spectral-spatial twice-refocusing with multi-shot VD spiral signal readout, we present an efficient approach for reduced FOV DTI at ultra-high imaging resolutions. Our technique benefits from avoiding tissue surrounding the ROI that can cause artifacts (such as signal saturation in fat tissue and areas of rapidly changing magnetic susceptibility).
Methods
MR Pulse Sequence
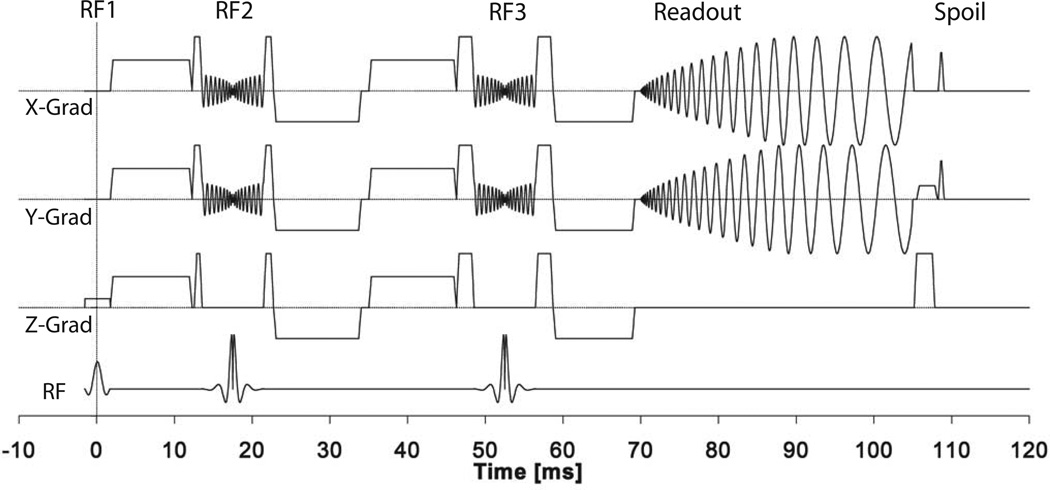
The eZOOM pulse sequence is a diffusion-weighted TRSE sequence with spiral readout and spatially selective refocusing (Figure 2). Refocusing is done by custom spatially-selective 180° RF pulses refocusing a cylindrical volume oriented perpendicular to the excitation slice (Figure 1b). The refocusing pulses have x, y and z crushers to suppress stimulated echo contributions and artifacts arising from imperfect pulse profiles. Diffusion weighting gradients are placed symmetrically around the refocusing pulses minimizing eddy current contributions (15). Readout is done by a VD spiral trajectory based on the design by Kim et al. (16), specifying the radial k-space density function by the power-function τα controlled by the density factor α over the time τ. As implemented by Liu et al. (13), the density factor was chosen to be α=4, allowing for a large enough k-space center to be fully sampled for phase-correction (see image reconstruction section) while maintaining a time-efficient readout scheme. Finally, phase rewinder pulses in x and y axes restore constant transverse spin phase conditions from one interleaf acquisition to the next, and hysteresis pulses reduce gradient system bias by running the gradient system to a large constant amplitude at the end of each spin-echo cycle (17).
Figure 2.
Sequence diagram for the eZOOM pulse sequence. Slice selective sinc excitation pulse (RF1), spatially selective refocusing pulses (RF2 and RF3), spiral readout (‘Readout’ section), and phase preparation for the next excitation (‘Spoil’ section) including x/y phase rewinders, x/y hysteresis pulses, and z-killer pulse. The large diffusion encoding gradient lobes of this twice-refocused spin-echo DTI sequence are interspersed between the RF pulses and readout.
RF Pulse Design
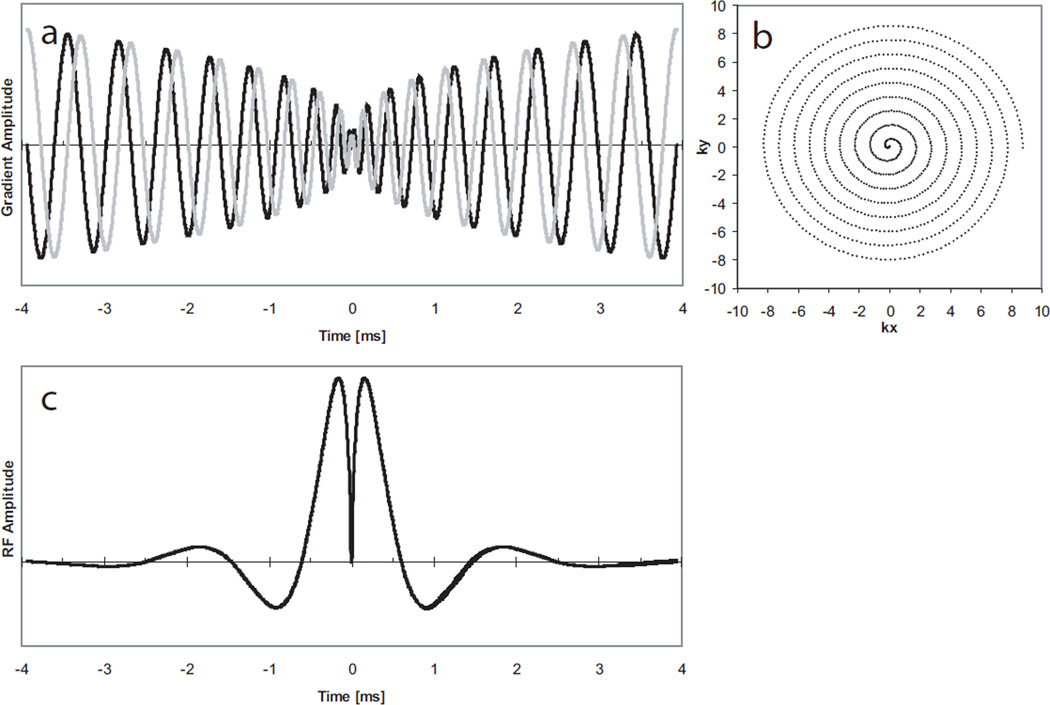
A cylindrical spatially-selective refocusing pulse based on the method by Pauly was designed to refocus a small 8 cm disk. Pauly provided the framework under which large flip angle pulses can be designed as linear sums of small flip angle pulses (18), specifying certain conditions that need to be met: First, the k-space trajectory of the pulse needs to be inherently refocusing, starting and ending at the same point in k-space (true for a 180° refocusing pulse). Second, the k-space trajectory of the pulse itself needs to be decomposable into inherently refocusing small flip angle pulses. In our design, the second criterion is satisfied by creating symmetric spiral in/out pairs of gradient pulses (Figure 3a). Deviations in k-space phase from the ideal linear flip angle design accumulate in the first half of the RF pulse and are reversed in its second half. The resulting RF pulse (Figure 3c) is a Bessel function of the first kind J1(u)/u (Equation 1). The argument u of the Bessel function depends on the diameter d of the refocusing disk and the k-space trajectory k. W(t) is a Hanning cosine window-function truncating the Bessel function to a finite duration. The function is evaluated along a spiral trajectory, produced by the gradient waveforms shown in Figure 3a.
| Equation 1. Calculation of the refocusing pulse magnitude |
Figure 3.
RF pulse design of the eZOOM refocusing pulse. Symmetric spiral (spiral in/out) magnetic gradient time-course (a) with the y-axis representing magnetic gradient amplitude, resulting in a variable-rate spiral k-space trajectory (b) having the center of k-space in the midpoint of the pulse, and the RF magnitude (c), the Fourier transformed of a cylinder weighted by a density function to account for the variable-rate characteristics of the trajectory. The x-axis in panels a and c is given in ms (7.8 ms total pulse duration). In panel b the x-axis is showing the k-space component kx and the y-axis ky given in units of k-space points.
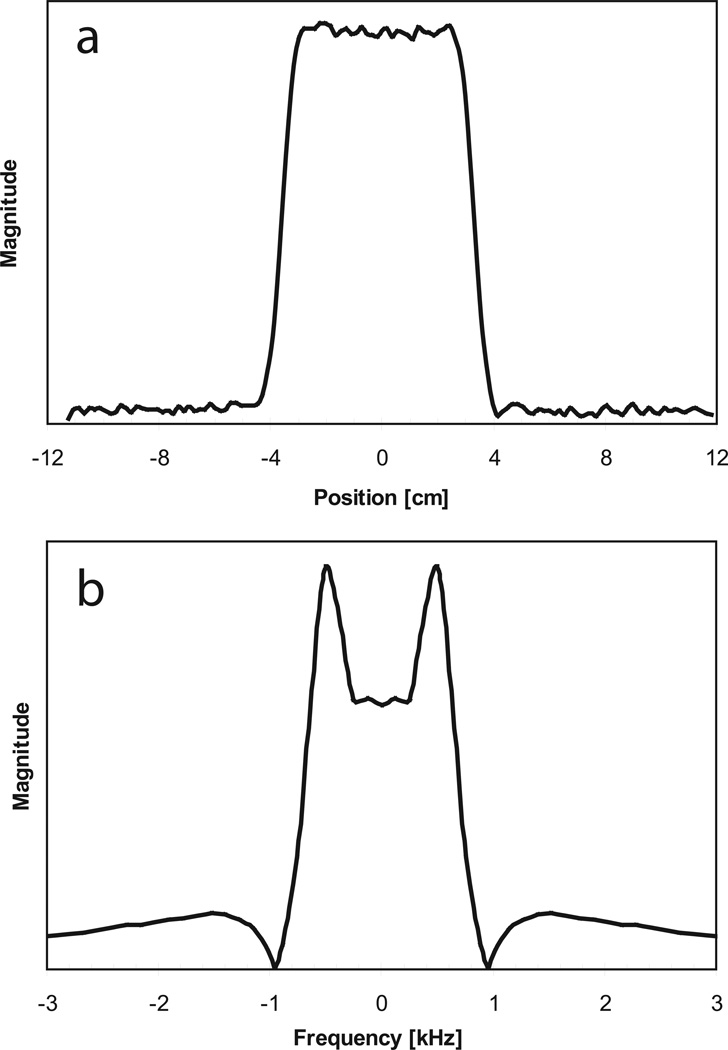
The spiral refocusing gradient waveforms were calculated for the maximum slew-rate (150 T/m/s) and gradient strength (40 mT/m) of the scanner’s gradient subsystem using Glover’s spiral algorithm (19) having a “slew-rate limited” (center portion of the spiral) and “amplitude limited” (peripheral portion of the spiral) regime. With the maximum bandwidth of 125 kHz and the chosen maximum field-of-excitation of 32 cm the maximum gradient strength was never reached, therefore the entire eZOOM gradient waveform adhered to the “slew-rate-limited” regime. To keep the RF pulse amplitude within the capabilities of the RF subsystem (B1peak=25 µT), the slew-rate maximum was reduced to 114 T/m/s, with the effective Gmax=11.6 mT/m. The number of spiral turns (n=9) for each spiral-in and spiral-out section was chosen to yield an acceptable spatial pulse profile for a maximum object size of 32 cm and an excited disk size of 8 cm (10% maximum ripple over a 7 cm disk, signal outside a 9 cm disk below 5% of excitation disk average signal), resulting in a total pulse duration of 7.8 ms. The result for the k-space trajectory of the refocusing pulse is a variable rate spiral (Figure 3b). The weighting function α in Equation 1 adjusts B1 for the variable rate nature of the k-space trajectory, as described by Conolly et al. (20). The factor α was calculated by Voronoi tessellation (21), segmenting k-space into polygonal cells surrounding each k-space point and calculating the area size of each cell. The sampling density factor α is proportional to the cell area for each k-space point (22). The constant amplitude factor A scales the pulse area for 180° flip angle in water. The spatial profile of the eZOOM sequence in x-direction (same as y-direction) is shown in Figure 4a and the frequency profile of the eZOOM RF pulse is shown in Figure 4b.
Figure 4.
Spatial profile of the eZOOM refocusing pulse (panel a) with the x-axis in units of centimeters. Panel b the frequency profile of the eZOOM RF pulse is shown, with x-axis in kilohertz. The y-axes are given in arbitrary units of magnitude. The center of the pulse (0 Hz offset) is set to have a flip angle of 180°, with the two side lobes at fat resonance frequency for 3T creating a flip angle of 270° in fat tissue.
Fat-Suppression Mechanism
The sequence owes its intrinsic fat suppression mechanism to the frequency profile of the refocusing pulse in conjunction with its use in the TRSE sequence. As shown for the frequency profile of the RF pulse in Figure 4b, the eZOOM refocusing pulse excites fat (±447 Hz) with approximately 270° flip angle when the RF power is set to produce a flip angle of 180° for free water. The rate at which the Bessel function (Equation 1) is evaluated over time for the spiral trajectory determines the frequency of the side lobes in the frequency profile. The ratio between fat and water flip angle was adjusted by the slew rate.
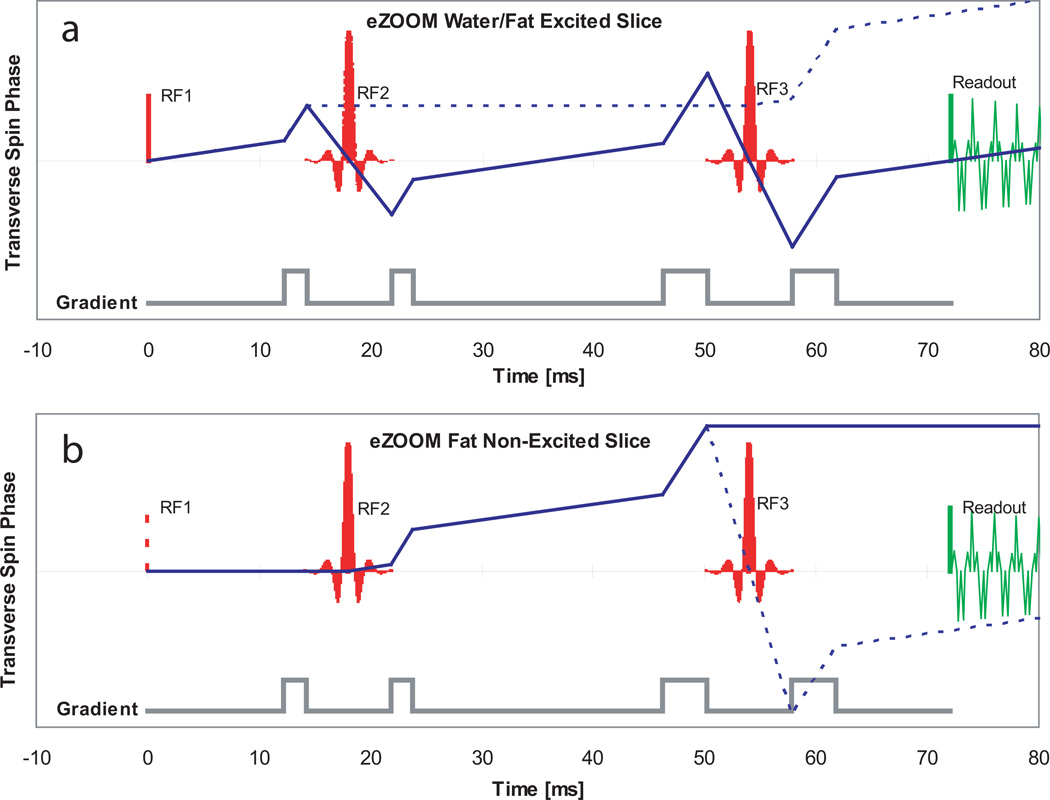
The spin-phase diagram in Figure 5a shows the transverse magnetic spin phase progression for water (solid line) and fat (dashed line) in the excited slice. Both water and fat are tipped from equilibrium magnetization (+Mz) into the transverse plane (+Mxy) by the excitation pulse RF1. The water spins accumulate transverse phase, are inverted at the first refocusing pulse RF2 and continue to accumulate phase. At the second refocusing pulse RF3 the water spins are inverted again and reach phase coherence at the echo time TE for signal readout. The spins in fat experience a 270° flip angle at RF2 tipping them to +Mz where they stop accumulating transverse phase. At RF3 the spins experience another 270° flip angle, are tipped into the transverse plane and continue to accumulate phase. By choosing the area of crusher pulses appropriately, the phase is moved outside usable k-space for fat and does not rephase during signal readout.
Figure 5.
Transverse spin phase diagrams for the eZOOM pulse sequence. The top panel (a) depicts the transverse phase accumulated in the excited slice for water (solid line) and fat (dashed line). The grey curve below shows the locations of the crusher gradients. RF1 is the 90° excitation pulse, the spectral-spatial RF2 and RF3 are 180° refocusing pulses for water and 270° for fat tissue. The bottom panel (b) shows the transverse spin-phase progression in the non-excited volume with the location of RF1 only given for reference (t=0). Since water spins in the non-excited volume are only flipped in the longitudinal plane at RF2 and RF3 ending up close to equilibrium magnetization after RF3, only fat spins are shown in the diagram. The solid line shows the main phase path for fat ending up without transverse magnetization at the readout point, while the dashed line shows the most prominent secondary pathway, caused by imperfections of the eZOOM refocusing pulse profile; care has to be taken to adjust crusher pulses properly to avoid refocusing of out-of-slice fat spins in the signal readout window.
Figure 5b shows the transverse spin phase diagram for fat outside the excited slice. Neither water nor fat are excited, the RF1 location is only shown to mark the sequence start. Water spins experience 180° flip angles at both RF2 and RF3 that rotate magnetization back to +Mz and produce no significant signal in the non-excited volume (therefore omitted in Figure 5b). Fat spins however are tipped into the transverse plane at RF2, start accumulating phase and are tipped to −Mz at RF3 where they stop accumulating phase and do not contribute to the MR readout signal. In this plot a critical secondary pathway (dashed line) is shown that arises from the imperfection of RF3 creating a 180° flip angle component for fat. That signal component can lead to image artifacts from fat tissue outside the excited slice. Proper adjustment of the crusher pulses for RF2 assures that transverse phase accumulated in that pathway does not produce signal during readout.
Water/Fat Phantom Scanning
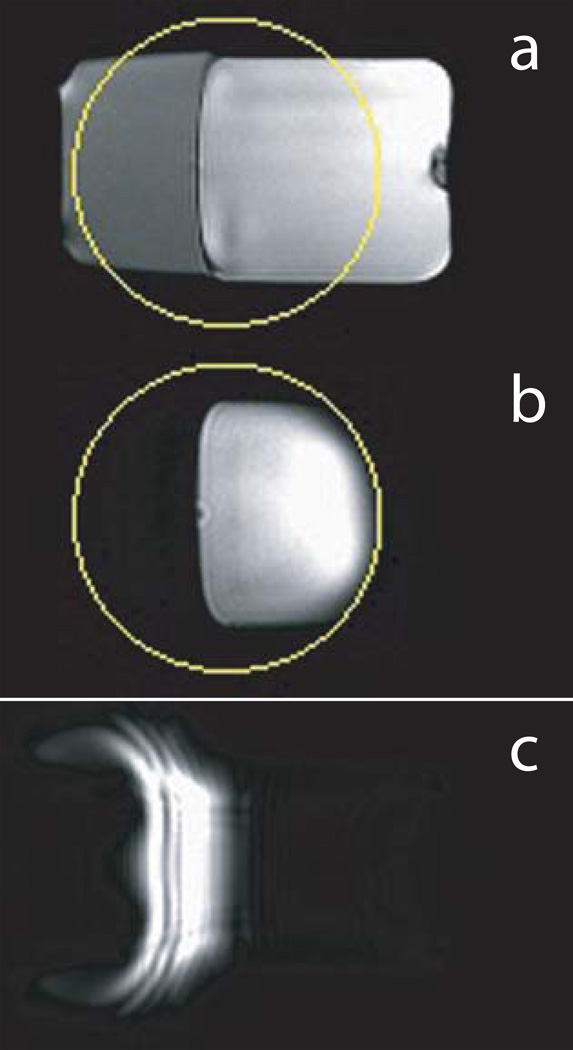
To demonstrate the fat suppression capabilities of the sequence, a fat/water phantom was constructed and scanned. A 50-ml high-density polyethylene (HDPE) plastic container was filled with approximately 65% tap water and 30% canola oil (leaving approximately 5% air space). Three scans were done: a gradient echo sequence (GRE) showing both fat and water fractions, the eZOOM sequence showing only the water fraction for an 8 cm disk centered over the water portion of the phantom, and a GRE sequence with the excitation pulse replaced by the eZOOM pulse to show only the fat fraction.
Scanning Protocol for eZOOM in the Fiber Phantom
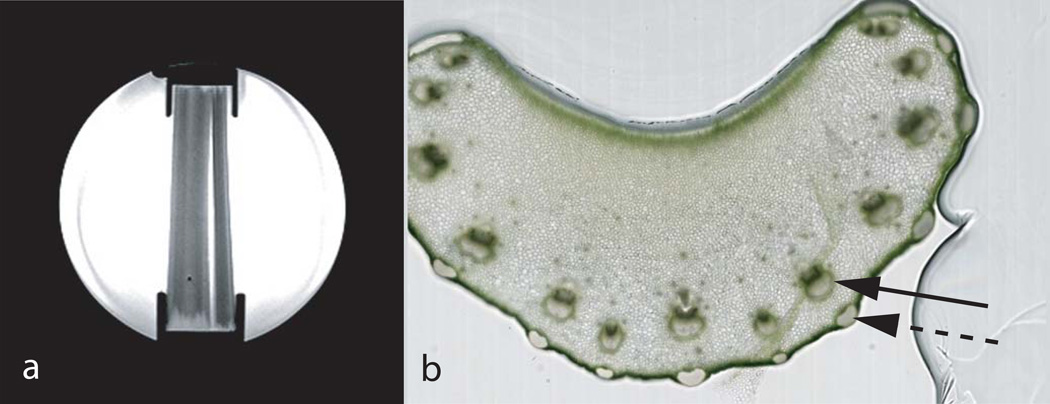
Fresh celery petioles in deionized water were encapsulated in a 17 cm spherical HDPE head phantom (Figure 7a) and scanned on a GE 3T Excite HDxt MRI scanner with a product 8-channel phased-array head coil. The high order shims were adjusted using the manufacturer’s procedure. The product EP-DTI sequence was run with a 22 cm FOV, 128×128 matrix size (1.72×1.72 mm in-plane resolution), TRead/TE/TR=41/89/5000 ms, 8 sagittal slices with 4 mm thickness and 1 mm gap, 15 diffusion encoding gradient directions (b-value= 1000 s/mm2) and 2 NEX (number of excitations). Images were collected as ramp-sampled single shot EPI with 125 kHz receiver bandwidth acquired with the GE receiver. The eZOOM sequence (8 cm refocusing area) was run with a 9 cm readout FOV, 8 sagittal slices with 4 mm thickness and 1 mm gap, TRead/TE/TR=35/70/5000 ms, 15 gradient directions (b-value=920 s/mm2). For the high resolution DTI scan 18 spiral interleaves were acquired with 8830 readout points resulting in a 256×256 matrix size (0.35×0.35 mm in-plane resolution) having NEX=2 (image summation after reconstruction). For the low resolution DTI scan matching the clinical resolution (1.72×1.72 mm in-plane) four interleaves were acquired with 3400 readout points resulting in a 52×52 matrix size. Receive bandwidth with eZOOM was 125 kHz (250 kHz sampling rate), recorded with a custom direct-sampling RF receiver (sampling 16 bits at 100MHz) providing approximately 4 bits in additional dynamic range and achievable SNR over the scanner manufacturer’s receiver (23). Oversampling a signal to a sampling rate FS beyond twice its bandwidth BW results in a maximum SNR advantage of sqrt(FS/2*BW) (24). Since diffusion-weighted images have a substantially smaller signal than the unweighted images (equating to an approximate signal loss of 1.5 bits at b=1000 s/mm2), diffusion experiments benefit from this increased dynamic range (25). Field maps were acquired using the same eZOOM sequence, but with a full 24 cm FOV and slice selective refocusing pulses (ΔTE=1 ms). The total scanning time for the eZOOM DTI sequence was 25 minutes. MRI and EPI-DTI images were reconstructed using the manufacturer’s reconstruction engine, while eZOOM images were reconstructed in Matlab.
Figure 7.
Sagittal MR localizer image of the spherical 17 cm diameter fiber phantom (panel a) with four celery stalks submersed in de-ionized water and held in place by retainer brackets on top and bottom. Horizontal cut through a Pascal celery stalk (panel b), with the black solid arrow showing the highly anisotropic stroma fiber bundles consisting of xylem (darker portion) and phloem carrying sap and water, and the dashed arrow showing cortical support structures that are also highly anisotropic. The bulk of tissue consists of practically isotropic parenchyma without directional fiber structure. Stroma diameters (xylem and phloem together) in the shown sample were measured from the images having an average diameter of 0.77 mm ± 0.13 mm.
Scanning Protocol for eZOOM in Humans
Seven healthy adult volunteers without contraindications to MRI scanning at 3T participated in the study, approved by the Institutional Review Board of the Medical College of Wisconsin. Scanning was done on a GE 3T Excite HDxt MRI scanner with a product 8-channel phased-array head-coil. Prior to EPI-DTI and eZOOM scanning the high order shims were adjusted using the protocol provided by the scanner manufacturer. The scanning parameters for the twice-refocused EPI-DTI were 24 cm FOV, TE/TR=86(min)/5000 ms, b-value 1000 s/mm2, 128×128 matrix size (1.88×1.88 mm in-plane resolution), 125kHz readout bandwidth, 15 gradient directions and NEX=2.
For the eZOOM acquisitions the parameters were FOV=12 cm, TE/TR=71.5/5000 ms, 256×256 matrix size (0.47×0.47 mm in-plane resolution), 16 spiral readout interleaves with 8830 points per interleaf, NEX=8 (image summation after reconstruction), and a b-value of 920s/mm2 with 6 gradient directions. Low resolution eZOOM images (1.88×1.88 mm in-plane resolution, 64×64 mm matrix size) were reconstructed from the first 820 points from each of the 16 interleaves. The EPI-DTI data were acquired using the internal scanner receiver, for eZOOM the external direct-sampling receiver (as described for phantom experiments) was used. The total scanning time for eZOOM in human was 75 minutes. The b-value for the clinical EPI-DTI sequence was set at the typical value for DTI in brain, while the b-value for eZOOM was optimized using the optimum diffusion-weighting D*b=1.1 as shown by Xing et al. (26). Field maps were acquired before the eZOOM scans (ΔTE=1 ms). Eight 4 mm thick sagittal slices with a 1-mm gap were prescribed in the right hemisphere.
For both EPI-DTI and eZOOM DTI the same location was prescribed on the temporal stem in the right hemisphere, selecting an area posterior and superior to the middle cerebral artery (M1 segment). The 8cm circular eZOOM region covers the temporal stem and parts of the temporal lobe, with the anterior commissure (AC) anteriorly, and the inferior-occipital fiber bundle posteriorly with Meyer’s loop (ML) emerging in lateral direction between the longitudinal bundles, having the hippocampus inferior to it. Due to the small thickness of the anterior ML portion (making it challenging to detect with conventional DTI methods), but its wider posterior portion (visible to both standard clinical and high-resolution DTI) this structure was chosen to demonstrate the capabilities of eZOOM.
Image Reconstruction and Post-Processing
Real-time computations for data recorded by the Mercury GC316 direct-sampling receiver (Medical College of Wisconsin, Milwaukee, Wis., and Mercury Computer Systems, Chelmsford, Mass.) (23, 25) were carried out in Matlab (Mathworks, Natick, Mass.). The timing differences that arise from time delays in the gradient amplifiers’ analog signal pathways, eddy currents and concomitant magnetic fields and delays in the receivers (27) were calculated using the k-space trajectory measurement method by Zhang et al. (28). These machine and sequence dependent timing delays were used to correct differences between the actual and ideal k-space trajectory. The spirally acquired dataset was then transformed onto an orthogonal grid using the convolution method by Rasche et al. (22), applying a 6-point Kaiser-Bessel window as regridding kernel. Accounting for the variable density acquisition spiral, Voronoi tessellation was used to calculate the weights for each data point (22). A Fermi disk filter was applied to minimize errors of the Voronoi weight calculation at the outer perimeter of the k-space disk. Time-segmented static field inhomogeneity corrections (29) were applied using phase maps calculated from the acquired B0 field-maps (30) to minimize spiral image blurring. Thus, RF signal time courses acquired for each interleaf were segmented into 6 segments with a Hanning window and each segment was separately Fourier transformed using the method outlined by Noll et al. (29). The number of 6 segments was chosen as the resulting time duration for each segment was approximately 8 ms, providing a good tradeoff between reconstruction time and image blurring. The large diffusion gradients lead to eddy currents and phase errors in the acquired images. We used the phase correction method by Frank et al. (12) to calculate the error phase from the low-resolution image of the fully sampled center of k-space for each spiral interleaf between diffusion unweighted and weighted image (for each diffusion direction and interleaf separately) and subtracting the resulting phase map from each reconstructed high-resolution interleaf prior to complex interleaf summation. Images from each of the 8 coil elements and all excitations were combined after applying complex spatial coil sensitivity maps that were created from the low-resolution diffusion-unweighted image for each coil element (31).
Diffusion tensor analysis was done in AFNI (NIH, Bethesda, Maryland) (32) for all images. Motion correction was applied for experiments in human subjects, registering diffusion-weighted images to the diffusion-unweighted images and correcting for tensor misalignment due to head rotation (33). SNR values were calculated using the difference method published by Dietrich et al. (34). The diffusion-to-noise ratio (DNR) is the equivalent to SNR for diffusion weighted images. It is specified as the diffusivity D over its standard deviation SDD (26). In the phantom SDD was derived from the homogenous portions of the parenchyma, avoiding the partial volume averaged voxels adjacent to the stroma volume. In the human SDD was derived from the cross-section of Meyer’s loop against surrounding white-matter.
Results
Fat/Water Phantom Experiments
To demonstrate that the eZOOM refocusing pulse produces a 180° flip angle for free water but a 270° flip angle for fat, a fat/water phantom was scanned. Its cross-section in a GRE localizer image is shown in Figure 6a with the eZOOM refocusing area marked by a circle. With the custom spectral-spatial pulse used as refocusing pulses in the eZOOM sequence, only the water portion inside the eZOOM refocusing area contributed to the MR signal as shown in Figure 6b. With the eZOOM pulse used as an excitation pulse in Figure 6c, the fat portion is excited. With no slice selection or crushers in that particular scanning experiment, there are visible image distortions and artifacts. However, results from that experiment are intended to demonstrate that the eZOOM pulse implements a 270° flip angle for fat and 180° flip angle for water. In its intended use as a refocusing pulse within the twice-refocused eZOOM sequence (Figure 6b) there are no notable distortions or artifacts in the water signal, and the fat signal is fully suppressed.
Figure 6.
Sagittal cross-section through fat/water phantom. Gradient echo (localizer) images (a) showing both water (right portion) and fat (left portion) volumes of the phantom with the eZOOM image area (circle) overlaid. Panel b shows the eZOOM images for that fat/water phantom, producing signal only for the water volume. Panel c shows the eZOOM pulse used as an excitation pulse in a gradient-echo experiment, inverting water spins to provide no contribution to the images, and tipping fat spins into the transverse plane contributing to the MR echo. With the eZOOM pulse being a cylindrical pulse without slice selectivity the resulting fat image appears distorted.
Fiber Phantom Experiments
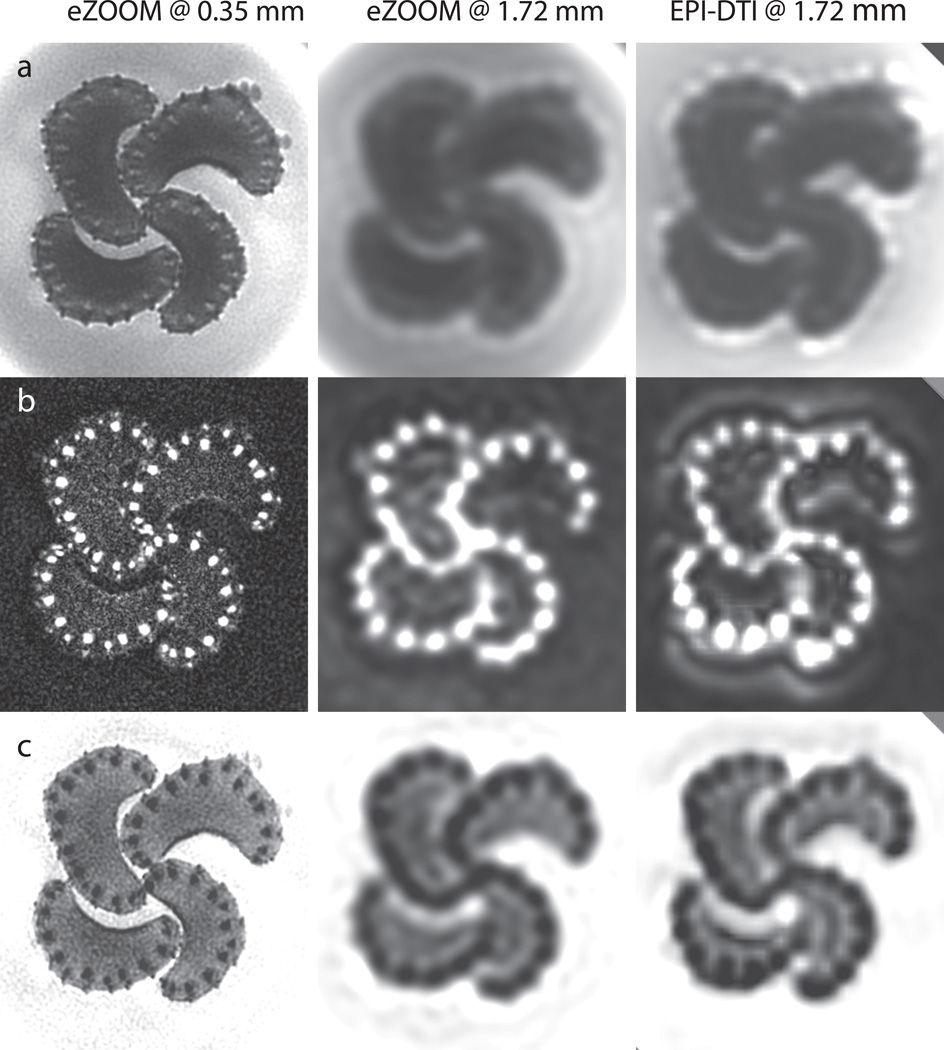
Celery petioles consist of a mostly isotropic parenchyma and fibrous stroma with diameters ranging from approximately 0.5 mm to 1 mm, as measured in light-microscopy sections (Figure 7b) taken following the MRI scanning. In DTI this anisotropy is typically quantified by the fractional anisotropy (FA), which is reported to be 0.19–0.35 for celery in previous publications (35). Figure 8 shows the results with eZOOM-DTI and EPI-DTI given by the diffusion unweighted T2 image, FA, and MD. The top row (a) in Figure 8 shows the T2 weighted anatomical map for eZOOM at 0.35 mm (left), eZOOM at 1.72 mm (middle) and EPI-DTI at 1.72 mm (right). The middle row (b) shows FA for the different image resolutions and imaging methods, and the bottom row (c) shows the mean diffusivity (MD) maps. The FA maps clearly demonstrate the ability of eZOOM-DTI to image stroma fibers and even many of the smaller cortical support fibers (lateral to stroma fiber bundles). Figure 10 (supplementary material) shows the directionally encoded color maps overlaid onto the unweighted images.
Figure 8.
DTI results for the fiber phantom. Axial slices through bundles of 4 celery petioles, imaged at 0.35×0.35 mm with eZOOM (left column), at 1.72×1.72 mm with eZOOM (middle column), and at 1.72×1.72 mm in-plane with the clinical EPI-DTI sequence (right column). The top row (a) shows the diffusion-unweighted image, the middle row (b) shows the fractional anisotropy maps (FA), and the bottom row (c) shows results for mean diffusivity (MD) in all 3 cases (eZOOM and EPI). At 1.72 mm both eZOOM and EPI cannot properly resolve the small stroma fiber bundles of the celery petioles. Some resampling artifacts are seen in the EPI-DTI images that were screen resampled using a bilinear image resampling method, while the eZOOM images were interpolated by zero-padding of the k-space images prior to Fourier transform.
EPI-DTI and eZOOM at 1.72 mm show a similar amount of blurring and a loss in structural detail as compared to eZOOM at 1.72 mm in-plane. The visual appearance (smoothness) of the 1.72 mm images differs as the eZOOM images have been zero-padded before Fourier transform to adjust the image size, but the EPI-DTI images were interpolated bi-linearly for presentation. To calculate DTI metrics (MD, FA, and DNR) the stroma fibers were segmented by thresholding for the primary eigendirection component in z-direction (parallel to fiber bundles) multiplied by the associated FA value, which is distinctly different between stroma and parenchyma. Due to the partial volume averaging dependent on imaging resolution, FA and MD values between measurements at 1.72 mm and 0.35 mm resolution are significantly different in stroma (P<0.01) and parenchyma (P<0.05), while MD and FA values measured in the surrounding medium have no significant (P<0.05) differences (Table 1 upper portion). Significant differences in parenchyma appear to be a result of partial volume averaging with neighboring stoma voxels at low resolution, as reducing the size of the parenchymal ROI makes the significant differences in parenchyma disappear; on the other hand decreasing the size of stroma ROIs increases the significant differences in stroma. No significant differences were seen for FA and MD between eZOOM-DTI and EPI-DTI at 1.72 mm resolution.
Table 1.
Mean diffusivity (MD), fractional anisotropy (FA), signal-to-noise ratio (SNR), and diffusion-to-noise ratio (DNR) values in the phantom (upper table portion) and in 7 human subjects (lower table portion) for high-resolution eZOOM-DTI (EZ_High at 0.35 mm in-plane in phantom and 0.47 mm in human), low-resolution eZOOM-DTI (EZ_Low at 1.72 mm in-plane in phantom and 1.88 mm in human) and the manufacturer’s EPI-DTI product sequence (EPI at the same resolution as EZ_Low). FA and MD values in phantom are shown for fiber bundles (stroma), the mostly isotropic tissue bulk of the celery petioles (parenchyma), and the de-ionized water (medium) surrounding the petioles followed by their respective standard deviations in brackets. MD values are given in 10−3 mm2/s. FA and MD values comparing high (EZ_High) and low-resolution (EZ_Low and EPI) in-plane resolution for the phantom are significantly different in stroma (P<0.01) and parenchyma (P<0.05), but not different in medium. FA and MD values for the sagittal cross-section of Meyer’s loop (ML) in human are shown as average over all 7 subjects with standard-deviations between them shown in brackets. FA and MD values for ML were significantly different (P<0.05) between high-resolution (EZ_High) and low-resolution (EZ_Low and EPI) images, but not significantly different between EZ_Low and EPI. SNR values were computed for the whole imaged object area (8 cm disk in eZOOM-DTI and whole-brain or whole-phantom mask in EPI-DTI). DNR values in the phantom were calculated for stroma vs. parenchyma, in the human they were calculated as ML vs. surrounding white-matter.
| EZ_High | EZ_Low | EPI | ||
|---|---|---|---|---|
| Phantom | MD Stroma | 1.22(0.14) | 1.48(0.04) | 1.46(0.10) |
| MD Parenchyma | 1.53(0.07) | 1.67(0.04) | 1.66(0.06) | |
| MD Medium | 2.03(0.04) | 2.06(0.02) | 2.07(0.04) | |
| FA Stroma | 0.42(0.11) | 0.19(0.03) | 0.22(0.05) | |
| FA Parenchyma | 0.08(0.03) | 0.05(0.01) | 0.05(0.02) | |
| FA Medium | 0.05(0.02) | 0.05(0.02) | 0.05(0.02) | |
| SNR (b=0) | 19.4 | 187.3 | 186.7 | |
| DNR Stroma | 20.2 | 148 | 138.5 | |
| Human | MD Meyer's Loop | 0.82(0.04) | 0.78(0.04) | 0.75(0.04) |
| FA Meyer's Loop | 0.52(0.05) | 0.38(0.05) | 0.41(0.05) | |
| SNR (b=0) | 7.12(0.69) | 31.07(2.45) | 28.71(4.87) | |
| DNR Meyer's Loop | 6.88(1.26) | 27.85(5.45) | 25.65(3.35) | |
While SNR is the measure of choice to characterize image quality in anatomical MR images, DNR is the important metric to quantify the quality of diffusion weighted images. Results for SNR and DNR are given in the phantom section of Table 1. At 1.72 mm in-plane resolution the sequence parameters for eZOOM were chosen to have a similar SNR (0.3% measured difference) as with the EPI-DTI. The resulting DNR values were approximately 7% higher in eZOOM-DTI than EPI-DTI. At 0.35 mm resolution, DNR was 20.2 with the chosen sequence parameters. According to Armitage and Bastin (36) the minimum DNR to avoid mis-estimation of diffusion metrics (anisotropy and diffusivity) by excessive noise bias is 20, below which they demonstrated that there is a disproportionally higher anisotropy standard error. Therefore, sequence parameters were selected to be at a minimum DNR>20.
Human Subject Experiments
DTI acquisitions with both eZOOM and clinical EPI-DTI were performed on seven human subjects. To reduce the overall scanning time for each subject, eZOOM was acquired at the highest resolution only, and the number of points used from each interleave was reduced to reconstruct the low-resolution images for comparison to EPI-DTI. This is equivalent to reducing the matrix size by acquiring fewer points while keeping the number of spiral interleaves constant.
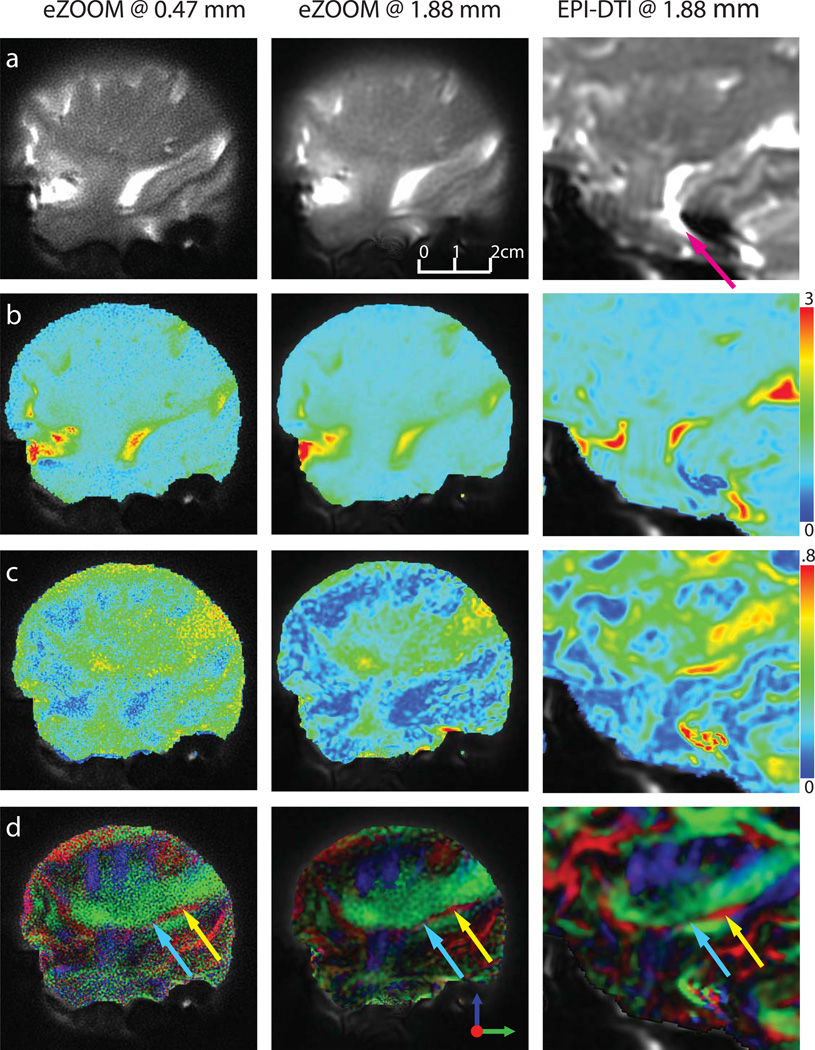
The resulting DTI images in one of the seven subjects are shown in Figure 9. The left column shows results for the high-resolution eZOOM acquisitions at 0.47×0.47 mm in-plane resolution, the middle column shows the low-resolution eZOOM data at 1.88×1.88 mm, which is at the same resolution as the EPI-DTI acquisition (right column). EPI-DTI images were acquired as whole-brain images, and the images were cropped to match the displayed FOV of the eZOOM images. The top row (a) images show the diffusion-unweighted images, with the purple arrow in the EPI image highlighting the substantial distortion seen with EPI in the brainstem, which is not present in the segmented field-map corrected eZOOM images. The MD images are shown in row (b) and the FA images are shown in row (c). It is apparent, that the high-resolution FA images have relatively low SNR. The respective SNR and DNR values are shown in Table 1 (lower portion). The bottom row (d) shows the directionally encoded color maps with Meyer’s loop highlighted (red fibers in Figure 9d marked by arrows). Its anterior portion (turquoise arrow) is substantially thinner than the size of an imaging voxel in the standard EPI technique and can only been detected by the low FA in that region. Only the thicker posterior portion (yellow arrow) can clearly be observed in the EPI-DTI images. While the low-resolution eZOOM-DTI images suffer from similar partial-volume averaging effects, Meyer’s loop can be clearly observed in the high-resolution eZOOM images despite the low SNR.
Figure 9.
DTI results in a human subject. A sagittal slice through the right temporal stem, imaged at 0.47×0.47 mm in-plane with eZOOM (left column, EZ_HR), at 1.88×1.88 mm with eZOOM (middle column, EZ_LR), and at 1.88×1.88mm with the clinical DTI sequence (right column, EPI). For the clinical EPI-DTI sequence the images are cropped to the respective region imaged by the eZOOM sequence; some residual mis-registration (primarily out of imaging plane) due to subject movement between scans remains (image scaling is the same for both EPI and eZOOM). The top row (a) shows the diffusion-unweighted image, row (b) shows the mean diffusivity (MD) with the scale on the right in 10−3 mm2/s, row (c) shows the fractional anisotropy maps (FA), and the bottom row (d) shows the directionally encoded color maps (DEC). The smoothness of the images at 1.88 mm differs between eZOOM and EPI, as the eZOOM images were zero-padded in k-space during reconstruction, while the clinical EPI images were bi-linearly resampled for presentation. Image distortions are apparent in the EPI image (purple arrow). Only the posterior part of Meyer’s loop (ML, red fiber structure with yellow arrow) can be clearly identified in the EPI images. eZOOM at high resolution visualizes the full width of ML including anterior portion (turquois arrow) while for EPI-DTI the anterior ML portion is averaged with the surrounding IOF. .
The lower part of Table 1 gives the values of FA, MD, and DNR for Meyer’s loop and the overall SNR for all seven subjects. FA and MD for Meyer’s loop are significantly different (P<0.05) between low and high-resolution images as a result of partial volume effects with the neighboring fibers of the inferior occipito-frontal fasciculus (green fibers in Figure 9d) running in almost perpendicular direction to ML. There was no significant difference for FA and MD between the low-resolution images acquired with eZOOM-DTI and EPI-DTI. It is apparent that the SNR and DNR are inadequate at the highest resolution with the chosen number of averages. Methods to improve SNR and DNR are suggested in the discussion section.
Discussion and Conclusions
This article describes a DTI method that implements three-dimensional inner-volume selection (slice direction during excitation, both in-plane directions during refocusing). Previously published volume restrictive DTI methods have either provided no or limited multislice capabilities (9), or have provided efficient multislice capabilities but limiting spatial selectivity to two dimensions only (10, 37). Other approaches to restrict the FOV in both in-plane directions employ outer volume suppression, limited by poor performance of the saturation pulses and specific-absorption-rate (SAR) constraints (38). In our human experiments SAR levels were kept below limits set by the US Food and Drug Administration (SAR<4 W/kg using the whole-body RF transmit coil).
The eZOOM technique both reduces the scanning time compared to other ultra-high resolution DTI methods and achieves imaging resolutions exceeding the capability of current EPI-DTI methods available on MRI scanners for human subjects. As eZOOM restricts the MR echo to a selected volume prior to signal readout, the method can be readily used with parallel imaging techniques such as SENSE-DTI (39), multiplexed sensitivity encoding (MUSE) (40), or fast spin-echo methods (12) to further reduce imaging time and allow for more signal averages to increase SNR.
The reduced FOV and the spiral readout paradigm of eZOOM make it more robust against distortions compared to EPI-DTI, making B0 field shimming less of an issue than with EPI-DTI. The acquired B0 field maps in combination with the manufacturer’s high order shimming were sufficient to correct B0 field inhomogeneities and minimize image blurring in both phantom and human experiments. Due to relatively short eZOOM refocusing pulse duration and the chosen spiral in/out pulse design, our refocusing pulse did not show B0 sensitivity for our scanner with manufacturer product shimming.
The novel spectral-spatial refocusing pulse design provides intrinsic fat suppression without the need to add fat saturation pulses (41) or water-selective excitation (42). This is an important feature as the fat signal is known to cause chemical shift artifacts but does not contribute to the desired diffusion contrast (43). Our novel method implements different flip angles for water and fat within two-dimensional spatially selective refocusing pulses applied in a TRSE DTI sequence, has a relatively short spectral-spatial refocusing pulse duration of 7.8ms, and does not rely on custom excitation pulses.
The high spatial resolution provided a higher FA value in small fiber bundles than with clinical resolution due to the reduced effect of partial voxel signal averaging, which has been noted to be an issue with DTI tractography of small fiber bundles (44). While in the phantom experiments the DNR was sufficiently high, in human experiments FA appeared overestimated at the highest imaging resolution due to the small DNR. This can be improved by implementing fast spin-echo methods such as employed by Frank et al. (12) to increase the number of acquired echoes while reducing the overall scanning time further.
The eZOOM sequence was developed for neurosurgical applications that critically rely on accurate knowledge of fibers close to the tumor borders. However, it may be beneficial for spinal cord imaging which requires a small axial FOV at very high resolution since eZOOM allows prescribing a small circular axial area avoiding air/tissue interfaces or fat and other tissue known to cause artifacts, distortions and image blurring (cerebral-spinal fluid pulsation was not an issue for the shown brain target region, but may need further investigation for the spinal cord application).
In conclusion, with eZOOM we introduce a DTI technique to acquire ultra-high resolution diffusion imaging for a reduced FOV (0.35×0.35 mm in-plane in a fiber phantom and 0.47×0.47 mm in human subjects) having voxel volumes substantially smaller than those typically achievable with EPI-DTI methods while maintaining the acquisition time within an acceptable range. Its small circular FOV and intrinsic fat suppression allows excluding signal from tissue known to cause artifacts. The 3D inner-volume selection is compatible with other methods, such as parallel imaging and fast spin-echo methods, to further reduce imaging time.
Supplementary Material
Diffusion encoded color-map for the fiber phantom (as shown in figure 8). Axial slices through bundles of 4 celery petioles, imaged at 0.35×0.35 mm with eZOOM (left column), at 1.72×2.72 mm with eZOOM (middle column), and at 1.72×2.72 mm in-plane with the clinical EPI-DTI sequence (right column). The top row shows the directionally encoded color map alone, while the bottom row also shows the diffusion unweighted anatomical underlay with 50% transparency.
Acknowledgements
The authors thank Dr. Alexandra Lerch-Gaggl in the Pediatric BioBank & Analytical Tissue Core at the Medical College of Wisconsin (Milwaukee, Wisconsin) for preparation and light-microscopy slide scanning of celery samples. The authors thank Dr. Kevin King at GE Healthcare (Waukesha, Wisconsin) for helpful conversations about spiral MRI and for reviewing this manuscript.
References
- 1.Ellingson BM, Sulaiman O, Kurpad SN. High-resolution in vivo diffusion tensor imaging of the injured cat spinal cord using self-navigated, interleaved, variable-density spiral acquisition (SNAILS-DTI) Magn Reson Imaging. 2010;28(9):1353–1360. doi: 10.1016/j.mri.2010.06.006. [DOI] [PubMed] [Google Scholar]
- 2.Augustinack JC, Helmer K, Huber KE, Kakunoori S, Zollei L, Fischl B. Direct visualization of the perforant pathway in the human brain with ex vivo diffusion tensor imaging. Front Hum Neurosci. 2010;4:42. doi: 10.3389/fnhum.2010.00042. [DOI] [PMC free article] [PubMed] [Google Scholar]
- 3.Al-Otaibi F, Baeesa SS, Parrent AG, Girvin JP, Steven D. Surgical techniques for the treatment of temporal lobe epilepsy. Epilepsy Res Treat. 2012;2012:374848. doi: 10.1155/2012/374848. [DOI] [PMC free article] [PubMed] [Google Scholar]
- 4.Kier EL, Staib LH, Davis LM, Bronen RA. MR imaging of the temporal stem: anatomic dissection tractography of the uncinate fasciculus, inferior occipitofrontal fasciculus, and Meyer's loop of the optic radiation. AJNR Am J Neuroradiol. 2004;25(5):677–691. [PMC free article] [PubMed] [Google Scholar]
- 5.Chen X, Weigel D, Ganslandt O, Buchfelder M, Nimsky C. Prediction of visual field deficits by diffusion tensor imaging in temporal lobe epilepsy surgery. Neuroimage. 2009;45(2):286–297. doi: 10.1016/j.neuroimage.2008.11.038. [DOI] [PubMed] [Google Scholar]
- 6.Noppeney U, Price CJ, Duncan JS, Koepp MJ. Reading skills after left anterior temporal lobe resection: an fMRI study. Brain. 2005;128(Pt 6):1377–1385. doi: 10.1093/brain/awh414. [DOI] [PubMed] [Google Scholar]
- 7.Liu M, Gross DW, Wheatley BM, Concha L, Beaulieu C. The acute phase of Wallerian degeneration: longitudinal diffusion tensor imaging of the fornix following temporal lobe surgery. Neuroimage. 2013;74:128–139. doi: 10.1016/j.neuroimage.2013.01.069. [DOI] [PubMed] [Google Scholar]
- 8.Concha L, Livy DJ, Beaulieu C, Wheatley BM, Gross DW. In vivo diffusion tensor imaging and histopathology of the fimbria-fornix in temporal lobe epilepsy. J Neurosci. 2010;30(3):996–1002. doi: 10.1523/JNEUROSCI.1619-09.2010. [DOI] [PMC free article] [PubMed] [Google Scholar]
- 9.Mansfield P, Ordidge RJ, Coxon R. Zonally magnified EPI in real time by NMR. J Phys E Sci Instrum. 1988;21:275–280. [Google Scholar]
- 10.Dowell NG, Jenkins TM, Ciccarelli O, Miller DH, Wheeler-Kingshott CA. Contiguous-slice zonally oblique multislice (CO-ZOOM) diffusion tensor imaging: examples of in vivo spinal cord and optic nerve applications. J Magn Reson Imaging. 2009;29(2):454–460. doi: 10.1002/jmri.21656. [DOI] [PubMed] [Google Scholar]
- 11.Jeong EK, Kim SE, Guo J, Kholmovski EG, Parker DL. High-resolution DTI with 2D interleaved multislice reduced FOV single-shot diffusion-weighted EPI (2D ss-rFOV-DWEPI) Magn Reson Med. 2005;54(6):1575–1579. doi: 10.1002/mrm.20711. [DOI] [PubMed] [Google Scholar]
- 12.Frank LR, Jung Y, Inati S, Tyszka JM, Wong EC. High efficiency, low distortion 3D diffusion tensor imaging with variable density spiral fast spin echoes (3D DW VDS RARE) Neuroimage. 2010;49(2):1510–1523. doi: 10.1016/j.neuroimage.2009.09.010. [DOI] [PMC free article] [PubMed] [Google Scholar]
- 13.Liu C, Bammer R, Kim DH, Moseley ME. Self-navigated interleaved spiral (SNAILS): application to high-resolution diffusion tensor imaging. Magn Reson Med. 2004;52(6):1388–1396. doi: 10.1002/mrm.20288. [DOI] [PubMed] [Google Scholar]
- 14.Li TQ, Kim DH, Moseley ME. High-resolution diffusion-weighted imaging with interleaved variable-density spiral acquisitions. J Magn Reson Imaging. 2005;21(4):468–475. doi: 10.1002/jmri.20287. [DOI] [PubMed] [Google Scholar]
- 15.Reese TG, Heid O, Weisskoff RM, Wedeen VJ. Reduction of eddy-current-induced distortion in diffusion MRI using a twice-refocused spin echo. Magn Reson Med. 2003;49(1):177–182. doi: 10.1002/mrm.10308. [DOI] [PubMed] [Google Scholar]
- 16.Kim DH, Adalsteinsson E, Spielman DM. Simple analytic variable density spiral design. Magn Reson Med. 2003;50(1):214–219. doi: 10.1002/mrm.10493. [DOI] [PubMed] [Google Scholar]
- 17.King KF, Gai ND, Ganin A, inventors. General Electric Company, assignee. Correction for gradient amplifier hysteresis in acquired MRI data. 6,291,997. US Patent. 2001 Sep 18;
- 18.Pauly J, Nishimura D, Macovski A. A linear class of large-tip-angle selective excitation pulses. Journal of Magnetic Resonance. 1989;82(3):571–587. [Google Scholar]
- 19.Glover GH. Simple analytic spiral K-space algorithm. Magn Reson Med. 1999;42(2):412–415. doi: 10.1002/(sici)1522-2594(199908)42:2<412::aid-mrm25>3.0.co;2-u. [DOI] [PubMed] [Google Scholar]
- 20.Conolly S, Nishimura D, Macovski A. Varible-Rate Selective Excitation. Journal of Magnetic Resonance. 1988;78:440–458. [Google Scholar]
- 21.Aurenhammer F. Voronoi diagrams - A survey of a fundamental data structure. ACM Comput Surveys. 1991;23:345–405. [Google Scholar]
- 22.Rasche V, Proksa R, Sinkus R, Bornert P, Eggers H. Resampling of data between arbitrary grids using convolution interpolation. IEEE Trans Med Imaging. 1999;18(5):385–392. doi: 10.1109/42.774166. [DOI] [PubMed] [Google Scholar]
- 23.Jesmanowicz A, Hyde JS. Direct MRI Detection at 3T and 9.4T Using 16-bit High-Speed Digital Receiver. Proc of 16th Annual Meeting of Intl Soc Magn Reson Med; Toronto, Canada. 2008. p. 1136. [Google Scholar]
- 24.Bennet WR. Noise in PCM systems. Bell Labs Record. 1948;26:495–499. [Google Scholar]
- 25.Gaggl W, Jesmanowicz A, Prost RW. A High Dynamic Range Receiver for Improved Diffusion Tensor Imaging. Proc. of 18th Annual Meeting of Intl. Soc. Mag. Reson. Med; Stockholm, Sweden. 2010. p. 3925. [Google Scholar]
- 26.Xing D, Papadakis NG, Huang CL, Lee VM, Carpenter TA, Hall LD. Optimised diffusion-weighting for measurement of apparent diffusion coefficient (ADC) in human brain. Magn Reson Imaging. 1997;15(7):771–784. doi: 10.1016/s0730-725x(97)00037-4. [DOI] [PubMed] [Google Scholar]
- 27.Aldefeld B, Bornert P. Effects of gradient anisotropy in MRI. Magn Reson Med. 1998;39(4):606–614. doi: 10.1002/mrm.1910390414. [DOI] [PubMed] [Google Scholar]
- 28.Zhang Y, Hetherington HP, Stokely EM, Mason GF, Twieg DB. A novel k-space trajectory measurement technique. Magn Reson Med. 1998;39(6):999–1004. doi: 10.1002/mrm.1910390618. [DOI] [PubMed] [Google Scholar]
- 29.Noll DC, Meyer CH, Pauly JM, Nishimura DG, Macovski A. A homogeneity correction method for magnetic resonance imaging with time-varying gradients. IEEE Trans Med Imaging. 1991;10(4):629–637. doi: 10.1109/42.108599. [DOI] [PubMed] [Google Scholar]
- 30.Schneider E, Glover G. Rapid in vivo proton shimming. Magn Reson Med. 1991;18(2):335–347. doi: 10.1002/mrm.1910180208. [DOI] [PubMed] [Google Scholar]
- 31.Bernstein MA, Grgic M, Brosnan TJ, Pelc NJ. Reconstructions of phase contrast, phased array multicoil data. Magn Reson Med. 1994;32(3):330–334. doi: 10.1002/mrm.1910320308. [DOI] [PubMed] [Google Scholar]
- 32.Cox RW. AFNI: software for analysis and visualization of functional magnetic resonance neuroimages. Comput Biomed Res. 1996;29(3):162–173. doi: 10.1006/cbmr.1996.0014. [DOI] [PubMed] [Google Scholar]
- 33.Leemans A, Jones DK. The B-matrix must be rotated when correcting for subject motion in DTI data. Magn Reson Med. 2009;61(6):1336–1349. doi: 10.1002/mrm.21890. [DOI] [PubMed] [Google Scholar]
- 34.Dietrich O, Raya JG, Reeder SB, Reiser MF, Schoenberg SO. Measurement of signal-to-noise ratios in MR images: influence of multichannel coils, parallel imaging, and reconstruction filters. J Magn Reson Imaging. 2007;26(2):375–385. doi: 10.1002/jmri.20969. [DOI] [PubMed] [Google Scholar]
- 35.Jones DK. In: Diffusion MRI: Theory, Methods and Applications. Jones DK, editor. New York: Oxford University Press; 2011. [Google Scholar]
- 36.Armitage PA, Bastin ME. Utilizing the diffusion-to-noise ratio to optimize magnetic resonance diffusion tensor acquisition strategies for improving measurements of diffusion anisotropy. Magn Reson Med. 2001;45(6):1056–1065. doi: 10.1002/mrm.1140. [DOI] [PubMed] [Google Scholar]
- 37.Finsterbusch J. High-resolution diffusion tensor imaging with inner field-of-view EPI. J Magn Reson Imaging. 2009;29(4):987–993. doi: 10.1002/jmri.21717. [DOI] [PubMed] [Google Scholar]
- 38.Karampinos DC, Van AT, Olivero WC, Georgiadis JG, Sutton BP. High-resolution diffusion tensor imaging of the human pons with a reduced field-of-view, multishot, variable-density, spiral acquisition at 3 T. Magn Reson Med. 2009;62(4):1007–1016. doi: 10.1002/mrm.22105. [DOI] [PubMed] [Google Scholar]
- 39.Jaermann T, Crelier G, Pruessmann KP, et al. SENSE-DTI at 3 T. Magn Reson Med. 2004;51(2):230–236. doi: 10.1002/mrm.10707. [DOI] [PubMed] [Google Scholar]
- 40.Chen NK, Guidon A, Chang HC, Song AW. A robust multi-shot scan strategy for high-resolution diffusion weighted MRI enabled by multiplexed sensitivity-encoding (MUSE) Neuroimage. 2013;72:41–47. doi: 10.1016/j.neuroimage.2013.01.038. [DOI] [PMC free article] [PubMed] [Google Scholar]
- 41.Bydder GM, Young IR. MR imaging: clinical use of the inversion recovery sequence. J Comput Assist Tomogr. 1985;9(4):659–675. [PubMed] [Google Scholar]
- 42.Meyer CH, Pauly JM, Macovski A, Nishimura DG. Simultaneous spatial and spectral selective excitation. Magn Reson Med. 1990;15(2):287–304. doi: 10.1002/mrm.1910150211. [DOI] [PubMed] [Google Scholar]
- 43.Schick F, Forster J, Machann J, Kuntz R, Claussen CD. Improved clinical echo-planar MRI using spatial-spectral excitation. J Magn Reson Imaging. 1998;8(4):960–967. doi: 10.1002/jmri.1880080427. [DOI] [PubMed] [Google Scholar]
- 44.Kim M, Ronen I, Ugurbil K, Kim DS. Spatial resolution dependence of DTI tractography in human occipito-callosal region. Neuroimage. 2006;32(3):1243–1249. doi: 10.1016/j.neuroimage.2006.06.006. [DOI] [PubMed] [Google Scholar]
Associated Data
This section collects any data citations, data availability statements, or supplementary materials included in this article.
Supplementary Materials
Diffusion encoded color-map for the fiber phantom (as shown in figure 8). Axial slices through bundles of 4 celery petioles, imaged at 0.35×0.35 mm with eZOOM (left column), at 1.72×2.72 mm with eZOOM (middle column), and at 1.72×2.72 mm in-plane with the clinical EPI-DTI sequence (right column). The top row shows the directionally encoded color map alone, while the bottom row also shows the diffusion unweighted anatomical underlay with 50% transparency.


