Abstract
In vivo ultrasonic imaging with transducer arrays suffers from image degradation due to beamforming limitations, which includes diffraction limited beamforming as well as beamforming degradation due to tissue inhomogeneity. Additionally, based on recent studies, multipath scattering also causes significant image degradation. To reduce degradation from both sources, we propose a model-based, signal decomposition scheme. The proposed algorithm identifies spatial frequency signatures to decompose received wavefronts into their most significant scattering sources. Scattering sources originating from a region of interest are used to reconstruct decluttered wavefronts, which are beamformed into decluttered radio frequency (RF) scan lines or A-lines.
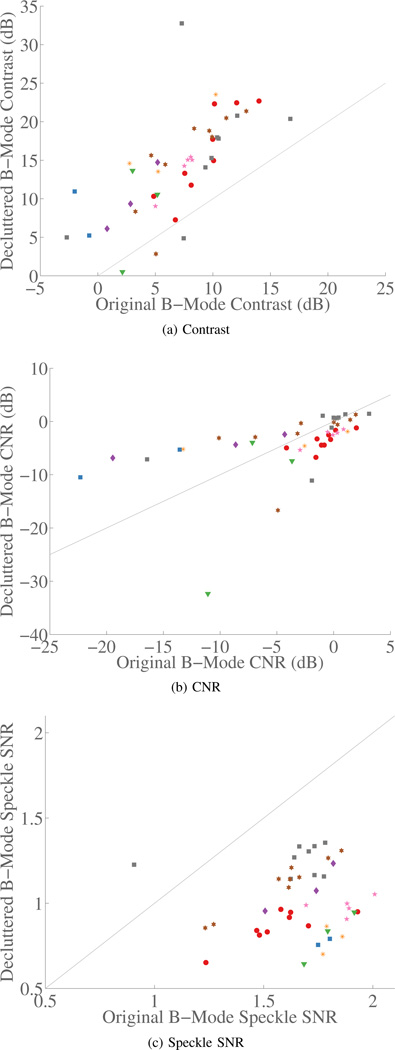
To test the algorithm, ultrasound system channel data were acquired during liver scans from 8 patients. Multiple data sets were acquired from each patient, with 55 total data sets, 43 of which had identifiable hypoechoic regions on normal B-mode images. The data sets with identifiable hypoechoic regions were analyzed. The results show the decluttered B-mode images have an average improvement in contrast over normal images of 7.3±4.6 dB. The CNR changed little on average between normal and decluttered B-mode, −0.4±5.9 dB. The in vivo speckle SNR decreased; the change was −0.65±0.28. Phantom speckle SNR also decreased but only by −0.40±0.03.
I. INTRODUCTION
In vivo ultrasonic images are degraded through many mechansisms. Some example mechanisms include diffraction limited beam width and reverberation [1], multiple scattering (sometimes considered distinct from reverberation) [2], and sound speed inhomogeneities [3]. Generally, in recent literature, beamforming based image degradation—including diffraction limitations and sound speed inhomogeneity—is widely considered the dominant source of in vivo image corruption [4]–[7]. Many beamforming algorithms have been explored to improve image quality by reducing the clutter caused by scattering located away from the beam-axis (off-axis). These methods focus on phase-aberration correction [8]–[10], apodization [11], [12], and harmonic imaging [13], [14].
Despite the prevalent notion that beamforming dominates image degradation, recent studies reintroduced multipath scattering (used here interchangeably with reverberation) as an equally important mechanism of in vivo image degradation [15], [16]. Pinton et al.—based on simulations—labeled reverberation as the dominant degradation mechanism for fundamental frequency B-mode imaging [16]. Reverberation can be suppressed using a number of methods. One of the most successful methods is time-reversal [17]. Harmonic imaging has also been shown to reduce reverberative image degradation, most likely by depositing less energy in the near-field at frequencies used for imaging [16]. A new motion based technique has been shown to suppress near field multipath clutter sources [18]. More recently, images of aperture domain signal coherence have been shown to suppress clutter from both off-axis and near field reverberation [19], [20].
All of these methods have been used successfully, but they do have some shortcomings. Time-reversal methods require a point target in the medium or, at least, a rapidly changing speckle pattern to be a viable method [21]. The motion and spatial coherence based methods lose the phase information contained in the RF signal, which is important for common ultrasound tasks like motion estimation. Harmonic imaging is probably the most ubiquitous of the approaches for clutter reduction, but harmonic imaging loses effectiveness in conjunction with full-field or broad-field excitation schemes [22], [23].
Recently, an aperture domain model-based approach was introduced for both off-axis and multipath scattering source suppression [24]. In this approach the signal is modeled as the summation of linear frequency modulated sinusoids, where axial and azimuthal scatterer position is encoded by chirp-rate and frequency, respectively. The model parameters of an arriving wavefront can be estimated in order to localize the received data. Wavefronts originating from the region of interest can then be reconstructed back into received RF A-lines to form a decluttered signal. The algorithm is applied to phantom data and in an in vivo abdominal imaging study.
II. A MODEL FOR MULTIPATH SCATTERING
To contextualize the problem of multipath scattering one presentation of the inhomogeneous wave equation is quickly reviewed [25]. First, the wave equation in inhomogeneous media can be expressed as
| (1) |
where
pi(r, t) is the incident wave, ps(r, t) is the scattered wave, t is time, ρ is density and c is sound speed. The scattered wave can then be expressed as
| (2) |
where r1 and r2 localize the inhomogeneous medium and the scattered wave, respectively, V is the space-domain of the insonified inhomogeneous medium, T is the full time-domain and
is the time-dependent, free-space Green’s function.
The solution to the scattered wave in (2) is complicated because the incident wave yields a scattered pressure field, which yields a subsequent scattered pressured field and so on. The recursive nature of scattering becomes clear when (2) is expressed using the Born-Neumann expansion,
| (3) |
where Gi is the Green’s function along with the integrals over space and time in (2) and Fop is the scattering operator,
It is often convenient and appropriate to assume that terms beyond the first, in (3) are negligible, which is the Born approximation. The Born approximation is a statement on the scattering medium, which posits that the medium consists of only small variations in density and sound speed. Under this approximation, it is fair to assume that the pressure field from multiple scattering is negligible because the nonlinear nature of multiple scattering (i.e. multiple scattering events combine multiplicatively) means that small scale inhomogeneities result in extremely rapid decay of the scattered pressure field. Beyond this it is pragmatic to assume that the amplitude decay from multiple scattering is so rapid that the initial scattering from the incident wave is the only significant component of ps(r, t). In practice, however, it is becoming more clear that during certain in vivo imaging scenarios there is a large range in the amplitude of scattered waves caused by large in vivo spatial inhomogeneity. In the presence of large tissue inhomogeneity the Born approximation becomes a poor assumption and the impact of multiple scattering becomes relevant.
Here, single scattering is not assumed, which means the wavefronts sampled by the transducer can no longer be expected to return from a particular axial distance determined by . Instead, wavefronts sampled by the transducer at some time t can return via any path traversable in that time. To account for this, we propose a model for the wavefronts arriving at the transducer produced by multiple scattering. The wave arriving at the transducer at a given time and frequency can be modeled as the superposition of a number of point scatterers with different axial and azimuthal origins. This can be modeled as the summation of Rayleigh-Sommerfeld integrals,
| (4) |
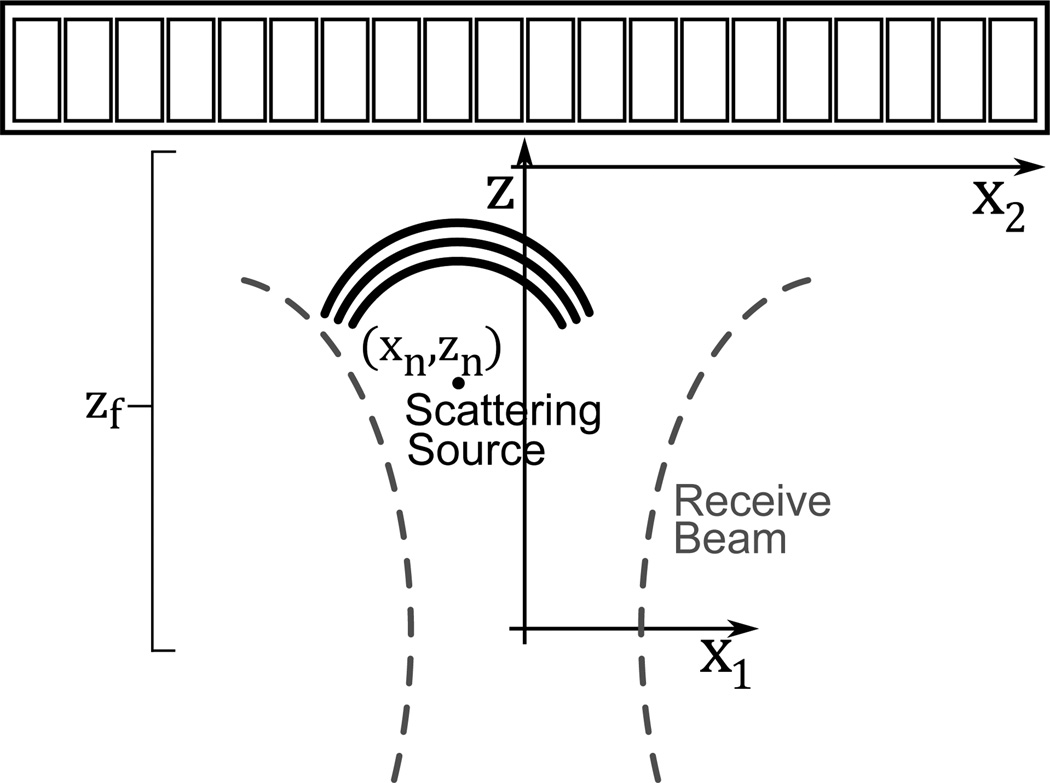
where the number of scatterers, N(t, ω), and their positions are expressed as a function of time and frequency, Bn(t, ω) is complex and accounts for the amplitude and phase resulting from multipath scattering and k is the wavenumber. x, y and z respectively denote the lateral, elevational and axial dimensions. The notation indicating the time and frequency dependence of the scatterers will be removed for brevity, but it should still be assumed. A coordinate system for (4)–(8) is shown in Fig. 1.
Fig. 1.
The coordinate system used in (4)-(8) is shown, where x2 describes the aperture dimension, x1 describes the azimuthal location of the scatterer in the field, and z describes the axial dimension. xn and zn reference the nth scatterer, and zf is the receive beam’s focal depth. The elevation dimension is not shown in the figure but notation mirrors the lateral dimension.
While (4) is a general expression for the wave received at an arbitrary location, we anticipate the utility of the model for a 1-D transducer array and restrict the final scattering event to the image plane of the transducer, introduce receive focusing and adjust the coordinate system to the receive focal depth. The pressure wave can now be described as
| (5) |
where . Under the assumption of a small arrival angle, the binomial expansion can be used and rxz can be approximated as
| (6) |
where it is clear that this approximation becomes worse for final scattering events close to the surface of the transducer. (Goodman shows that the Fresnel approximation can still work well even when the small angle approximation is poor [26]). Applying the approximation and completing the integral over x1 the scattered pressure is
| (7) |
This can be rewritten as
| (8) |
where
| (9) |
and An and ϕn are the amplitude and phase offset, respectively. The expression demonstrates that the pressure wave received by the transducer can be well expressed as the summation of linear frequency modulated sinusoids where gxn is the spatial chirp-rate and kxn expresses the spatial frequency of the wavefront.
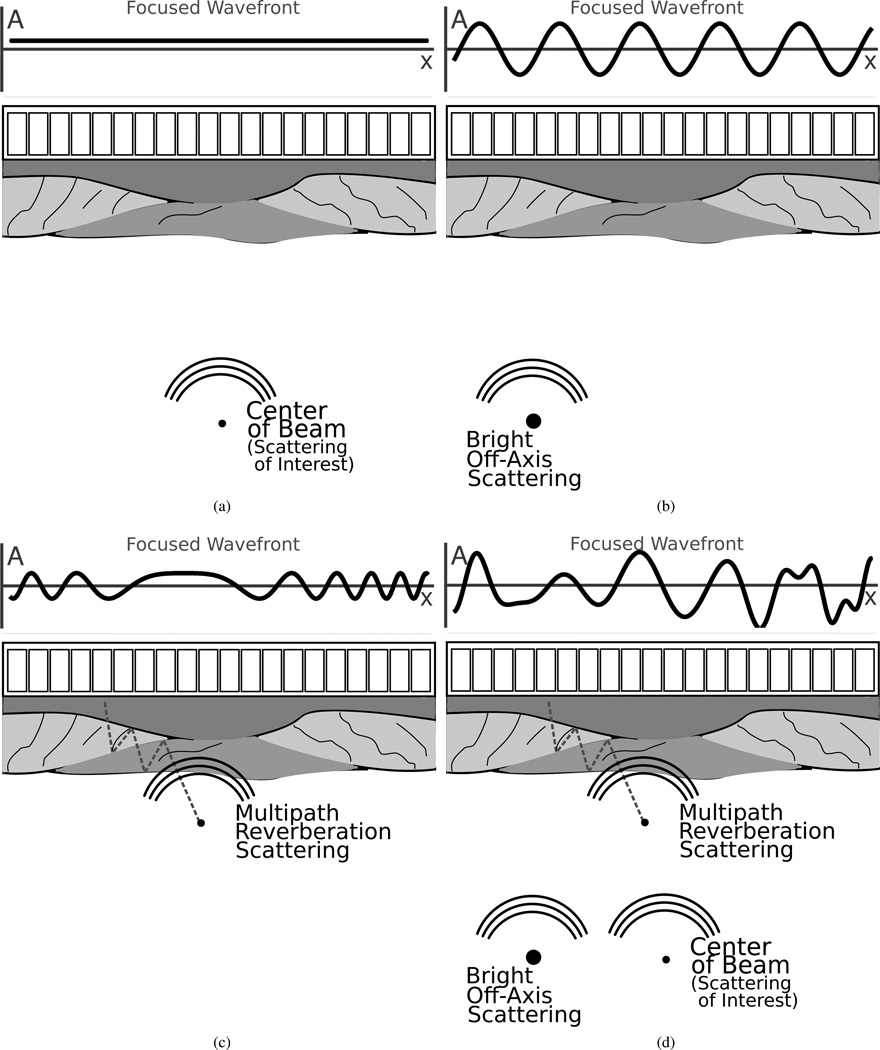
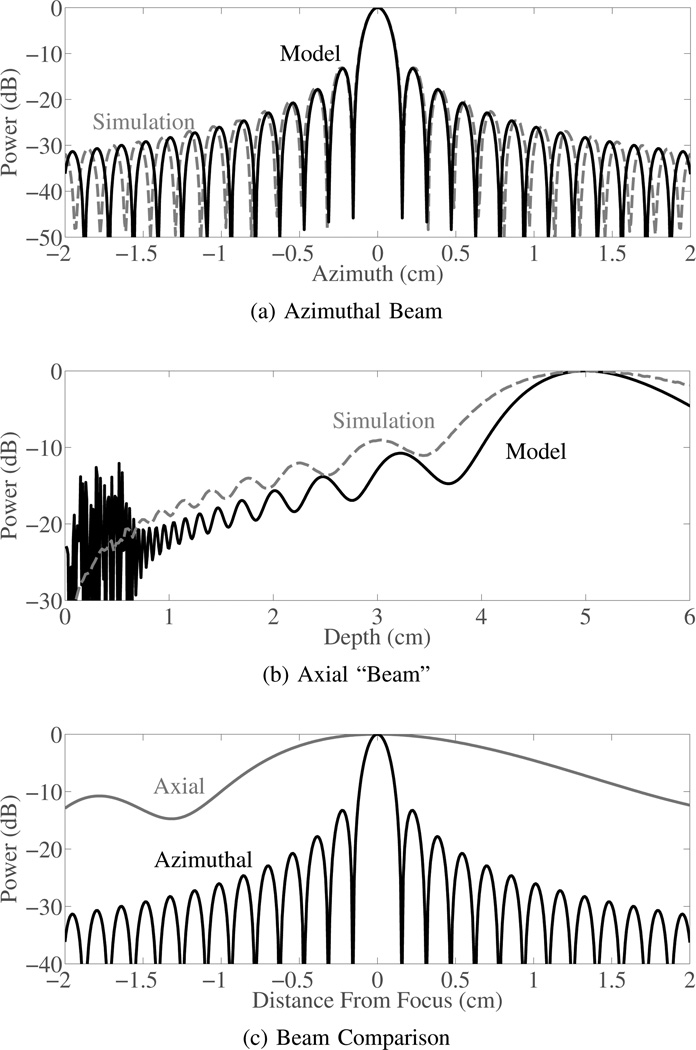
To help motivate the use of model, examples of focused, narrowband, pressure wavefronts sampled by the transducer for several scattering origins are shown in Fig. 2. Additionally, to demonstrate the difference between beamforming a wavefront originating from the focal depth versus one originating from a non-focal depth beam plots were made using (8). Beams were made at 1.8 MHz, with a 5 cm focus, and a 2.7 cm array (approximately resembling the phantom and in vivo study parameters). Beam plots are shown in Fig. 3 and demonstrate relative attenuation of a wave originating at the focus compared to waves originating from other axial and lateral locations. Field II simulations with matching parameters pulse and two-way geometric spreading compensation are also shown for comparison [27]. The Field II simulations were conducted with a 20 cycle pulse to approximate the narrowband nature of the model. The lateral beam plot shows the classic beam profile with characteristic levels of attenuation applied to scatterers arriving from off-axis locations. The axial beam plot is new and shows the beamforming based attenuation that can be expected for scatterers arriving from depths besides the focus. The graphs of beamforming attenuation demonstrate that waves originating from non-focal depths can be orders of magnitude weaker than off-axis sources near the focal depth and still result in significant image degradation. It should also be noted that based on (8), in the presence of near field multipath scattering, beamforming is no longer well described as a stationary spectral estimation problem. However, based on (8) each wavefront is characterized by its point of origin, which—for narrowband wavefronts—is reasonably described by a chirp-rate and frequency parameter. This parametrization should make it possible to spatially localize the wavefront’s origin independent of propagation time.
Fig. 2.
Focused pressure wavefronts sampled by an array are shown for four different cases. In the case of the bright off-axis scatterer most of the energy will cancel when the elements are summed, but if a scatterer is sufficiently bright relative to the signal of interest image degradation will occur. The multipath reverberation case is more complicated because the wavefront sampled by the array is no longer stationary and summing across the array will rarely suppress as much energy as with a stationary sinusoid. The last figure shows the realistic scenario of a wavefront composed of all three scattering sources arriving at the transducer simultaneously.
Fig. 3.
Beam sensitivity for scatterers along the azimuthal dimension and the axial dimension are shown for 1.8 MHz beam focused at 5 cm with a 2 cm aperture. Beam sensitivity plots are shown for beams approximated based on the model in (8) and beams simulated using Field II. The azimuthal sensitivity charts the traditional narrowband beam plot. The axial sensitivity is significantly different and shows a much broader main lobe and overall less attenuation even at significant distances from the focus.
III. METHODS
A. Model Parameter Estimation
The multipath propagation model in (8) can be used to decompose the incoming wave at a given time and frequency into the scattering sites contributing to the scattered wave impinging on the transducer. Once the signal is decomposed into its components, the components originating from within a region corresponding to the ballistic wave are identified. The identified components can then be reconstructed back into channel data, an RF A-line or the envelope of an A-line with suppressed clutter. Additionally, before proceeding, it should be noted that the notion of scatterer used here is loose and can refer to an individual scatterer or to a consensus scattering event from a collection of scatterers as expected in vivo.
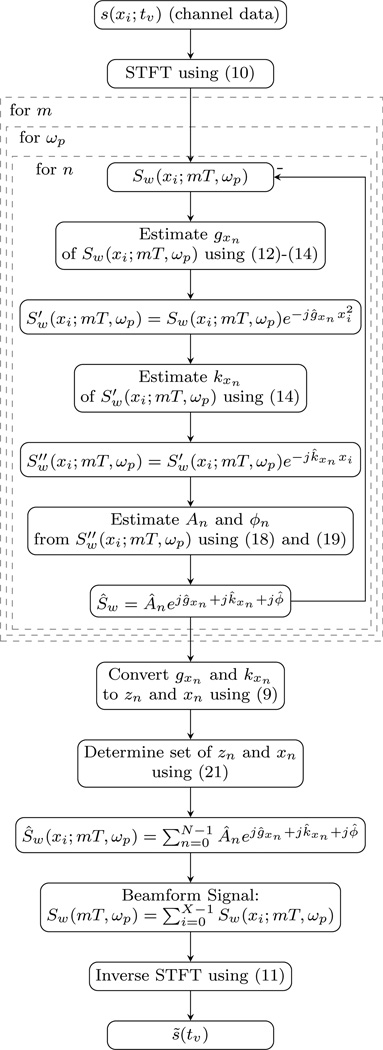
Here an initial algorithm is proposed that addresses some of the difficulties of parameter estimation on overlapping nonstationary sinusoids with widely varying amplitudes. As an overview, the data record for each channel are transformed into the time-frequency domain in order to match the model space. After the transformation, the pressure wavefronts will appear like the examples shown in Fig. 2. Next, the chirp-rate is estimated for the largest amplitude wavefront impinging on the transducer. The estimated chirp-rate of the dominant wavefront is mixed out of the aperture domain signal, which is equivalent to dynamically adjusting the depth focus. In relationship to Fig. 2, this is akin to transforming the multipath clutter signal into the form of the off-axis clutter signal. From this signal the stationary frequency is estimated and then mixed out; this step is equivalent to steering the receive beam. At this point, the amplitude and phase of interest are now at DC and can each be estimated from the mean of the signal. The set of estimated parameters are used to form an estimate for the current dominant wavefront. The dominant wavefront is then subtracted from the current aperture domain signal. The algorithm repeats until a decision is made to terminate. The signal components determined to originate from an acceptance region are reconstructed into decluttered wavefronts. At the end, an inverse short-time Fourier transform can be used to return to the original data space. A flow chart is provided in Fig. 4.
Fig. 4.
The flow chart provides an overview of the algorithm. Within the diagram references are made to the relevant equations in the text.
1) Model Space Transformations
The signal sampled by the system channels can be expressed as s(xi; tv), where xi describes the discrete positions of the transducer elements and tv describes the discrete time-sampling for each element’s data record. The data can be transformed into the time-frequency domain—matching the domain of the model in (8)—using the short time Fourier transform (STFT)
| (10) |
where T denotes the time sampling period of the STFT and w(l) is a window function. The use of the STFT in this fashion resembles the strategy used by Holfort et al. [28].
Because one of the goals of the algorithm is to reconstruct RF data (channel or summed) there needs to be a way to transform the data back into the original data space. The method for accomplishing this is the inverse STFT. Unfortunately, an inverse STFT algorithm is less trivial than the STFT because after modifications have been made the remaining short-time Fourier domain signal will likely not have a paired time-domain signal. To solve this problem, the inverse STFT is approximated using Griffin and Lim’s iterative algorithm (specifically the iterative overlap and add inverse STFT is used) [29]. In this algorithm the strategy is to find an STFT{s(xi, tv)} = Sw(xi;mT, ωp) pair where the inverse short-time Fourier domain signal most closely matches the modified signal. This is accomplished here using
| (11) |
where
and Qw(xi;mT, ωp) is the modified short-time Fourier domain signal.
2) Chirp-Rate Estimation
Once the data are in the model domain each time-frequency signal can be decomposed into its wavefronts. The first part of this task is to estimate the depth—encoded via chirp-rate—of the largest amplitude wavefront.
The approach formulated here relies heavily on the work by Barbarossa et al. [30] and Lv et al. [31]. The general challenge with estimating parameters of overlapping non-stationary sinusoids is the lack of orthogonality between chirp-rate and frequency parameters and the significant cross-talk between overlapping frequency modulated signals.
Both Barbarossa and Lv’s approach rely on the instantaneous autocorrelation function,
| (12) |
The instantaneous autocorrelation function isolates the non-stationary gxn from the stationary kxn, while at the same time making gxn stationary for a given lag, χl. The now stationary gxn can be accurately estimated using spectral estimation techniques. The primary challenge is to ensure that true gxn values are estimated and not chirp-rates of cross terms. Cross terms can be suppressed using the product high-order ambiguity function (PHAF) [30]. The PHAF is
| (13) |
where χref is a specified reference lag for normalizing each lag, χl, so that the stationary gxn are independent of lag and the cross-terms shift with lag. (Any set of lag values can be used for the PHAF. The lags do not need to be contiguous.) The location of the peak value of P(gx) is an accurate initial estimate for the chirp-rate that should not be corrupted by cross terms.
The final estimate of the chirp-rate is computed using an approach similar to Lv’s distribution [31]. All discrete lags of (12) are computed and rescaled as in the PHAF, but in this case Bayesian spectral estimation is used to estimate gxn of the rescaled lags while accounting for the variation in data quality based on the length of the data record for each lag [32]. The Bayesian estimate of the chirp-rate for unknown noise power and multiple lags maximizes the following,
| (14) |
where
The terms are the same except the imaginary portion of the instantaneous autocorrelation function is considered. Additionally, L is the total number of lags, Nl is the length of the instantaneous autocorrelation function for lag χl. The estimate of gxn from (14) is the gx with the highest probability. This optimization is solved using the Nelder-Mead simplex method as implemented in Matlab’s (Mathworks, Natick, MA) fminsearch function with an initial guess provided by (13).
3) Amplitude, Phase and Frequency Estimation
The frequency of the dominant scattering signal is also estimated using (14). However, instead of applying (14) to the instantaneous autocorrelation function it is applied to the signal with the estimated chirp-rate removed from the signal,
| (15) |
where ĝxn is the estimate of gxn. An initial guess for kxn can be obtained from
| (16) |
and a refined estimate can be obtained from (14) using S′ as the input instead of the instantaneous autocorrelation function.
The frequency can also be removed from the signal
| (17) |
The amplitude and phase of the signal component can be estimated from the amplitude and phase of the mean of S″(),
| (18) |
| (19) |
Finally, all the estimated parameters are used to reconstruct an estimated signal for the nth component of (8). The estimated signal is removed from the data,
| (20) |
and the algorithm repeats until a specified end point. In the implementation here the algorithm iterates a pre-specified number of times.
4) Scatterer Spatial Selection
At this point gxn and kxn can be transformed into zn and xn using (9). The ballistic wave is then classified as the scattering sites within a specified azimuthal and axial acceptance ellipse,
| (21) |
where
The cutoff value αx scales the acceptance region relative to the expected resolution since this will change with depth. The cutoff value αz is specified as a fraction of the depth since with a gross sound speed error the location of the ballistic wave could gradually drift. Scattering sites satisfying (21) are used to reconstruct a clutter reduced signal,
| (22) |
where N− indexes the accepted scattering sites, which can then be beamformed (i.e. summed across xi). The beamformed data are still in the time-frequency domain. The inverse STFT in (11) can be used to reconstruct a beamformed RF A-line. (RF channel data can be recovered by performing the inverse STFT before beamforming.)
5) Purposeful Chirp Modulation
There is one additional step in the algorithm that has proven useful. It was mentioned in regards to (12) that cross terms between chirp-rates can be a problem. These cross-terms, which are described by Barbarossa et al. [30], have a difference component that can result in chirp-rate cross-terms close to zero. This is problematic because under normal circumstances the signals of significant interest arrive from the receive focal depth and also have low chirp-rates. This problem can be solved by receive focusing at a slightly different depth than the expected depth of the ballistic wave. Here the receive focus is placed 25% shallower than the expected depth of the ballistic wave. Before the waves are beamformed this extra modulation is removed from the signal.
B. Experimental Methods
In order to validate the algorithm data were acquired from 8 patients. The patients underwent written consent for the study, which was approved by the local Institutional Review Board. Data were acquired using the Siemens Acuson S2000 and 4C-1 curvilinear array (Siemens Healthcare, Ultrasound Business Unit, Mountain View, CA). A synthetic receive sequence was employed to acquire 64 system channels centered about the transmit focus for each A-line [33]. The parameters used for the decluttering algorithm are shown in Tbl. I. Additionally, when relevant, the same parameters were used to form the normal images, which were formed with normal delay-and-sum dynamic receive beamforming. The parameters were selected by experience and used across all data sets; a full parameter study was not conducted. Both beamforming methods were apodized with a rectangular window in order to facilitate comparison. We expect the parameter set to be different for different transducers and across grossly varying acoustic windows e.g. superficial vascular imaging, transcranial imaging, etc.
The decluttered data were compared against traditional B-mode beamforming using the metrics of contrast, contrast-to-noise ratio (CNR) and spatial signal to noise ratio (SNR). The contrast was defined as
| (23) |
The CNR was defined as
| (24) |
The speckle SNR was defined as
| (25) |
To calculate image metrics, regions were manually segmented on normal B-mode images. Every acquired B-mode image that had at least one identifiable hypoechoic feature was used. The B-mode images were also used to determine regions of uniform speckle that could serve as the background. The background regions were selected to have a depth as close as possible to the depth of the hypoechoic region. Image metrics were calculated on uncompressed B-mode data in the acoustic coordinate system.
In addition to the in vivo study 5 sets of data were acquired from a homogeneous speckle region of a CIRS Model 054GS calibration phantom (CIRS, Norfolk, VA) in order to study the impact of the decluttering algorithm on first- and second-order speckle characteristics. The first-order speckle statistics were calculated on B-mode data in the acoustic coordinate system. The second-order speckle statistics were calculated on the RF A-lines.
As referenced previously, the entire algorithm was implemented in Matlab to demonstrate feasibility. The fundamental unit of the algorithm consisting of identifying and removing one scattering source from one frequency band is complicated but is not computationally demanding. Computational demand arises when implementing the algorithm on all points and frequency bands within an image, however, this is easily parallelized since each spectral band and spatial position are algorithmically independent. The algorithm was profiled using the channel data corresponding to the images shown in Figs. 6a and 6b. The total CPU time required for decluttering the full image from 0.75-12 cm using MATLAB was 83,161 s on a single 2.93 GHz processor. The time required to process a single source for a specific frequency and depth was 16±0.51 ms.
Fig. 6.
B-Mode images are shown demonstrating the cases of the most (top) and least (bottom) improvement in contrast. In the top image pair the decluttered image shows significant improvements in contrast and may show some small new features not visible in the normal B-mode image. The images on the bottom show similar features without significant changes. The images are created with 70 dB and 60 dB of dynamic range on the top and bottom, respectively.
IV. RESULTS
First, images are shown in Fig. 6 to qualitatively demonstrate the range of improvements seen across the results. The images show the largest and smallest improvements seen across all of the data sets. The complete and summary results for the in vivo study are shown in Fig. 5 and Tbl. II, respectively. The graphical results in Fig. 5 show data from 43 acquisitions across 8 patients. Data from each patient are displayed with one of the colored shapes. The gray line shows equivalency between the normal and decluttered results. The results show that the contrast in the decluttered images is clearly improved. The CNR results show several large outliers in both directions but little change on average. The results of speckle SNR show that the speckle SNR does decrease consistently in the decluttered images. Based on the results, it is worth noting that it can be shown for a hypoechoic lesion that the CNR is almost solely dependent on speckle SNR and contrast [34]. The reduction in speckle SNR is an unexpected result and may explain the lack of improvement in the decluttered CNR despite the significant improvements in the decluttered contrast.
Fig. 5.
Graphs of contrast, CNR, and speckle SNR are shown. There is a clear improvement in the B-Mode contrast. The CNR results show little overall change. The speckle SNR is consistently lower in the decluttered data. Data from each patient are displayed with one of the colored shapes, which is kept consistent across all the scatter plots. The gray line shows equivalency between the normal and decluttered results.
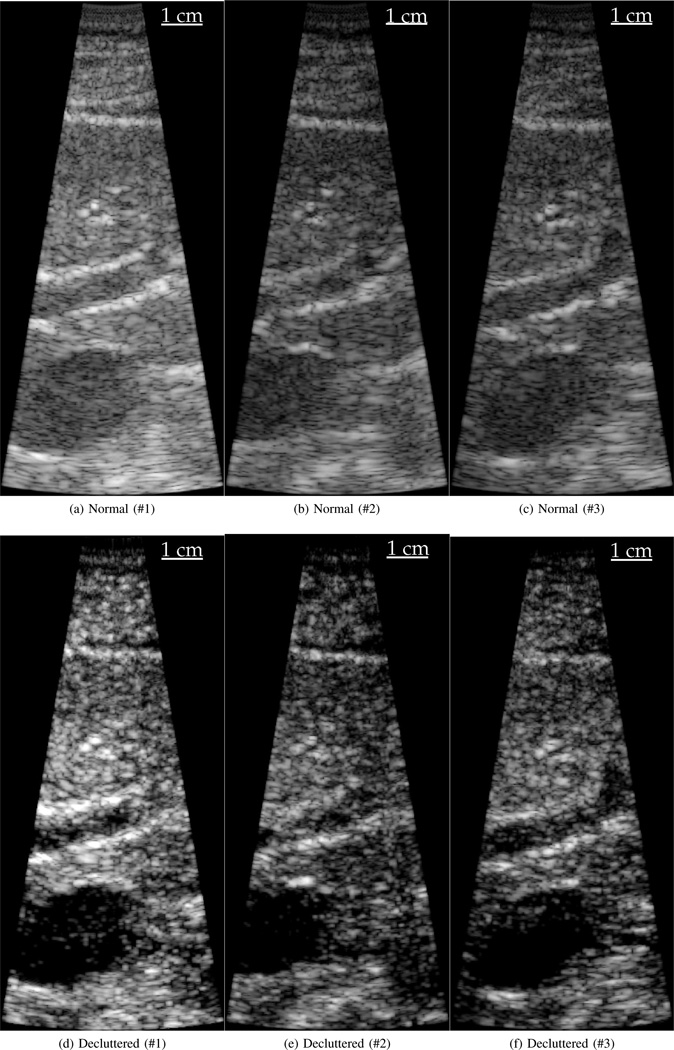
A limitation of the in vivo results is they only demonstrate change in features already defined on a normal B-mode image. Improving the visibility of features already visible in a B-mode image could easily be accomplished by adjusting the compression applied to the final image. In order to demonstrate the full potential of the algorithm, three sets of images from the same patient and of the same anatomical structure are shown in Fig. 6. The series shows the gall bladder near the bottom of the image. In all three decluttered images the bile duct coming out of the gall bladder is well visualized. In contrast, the bile duct is not well visualized on the normal B-mode images. In this case, the clutter levels inside the bile duct on the normal B-mode images are around the same magnitude as the scattering from the liver. In this image set, the similarity of scattering strength makes it impossible to appropriately adjust the gain in order to visualize the bile duct.
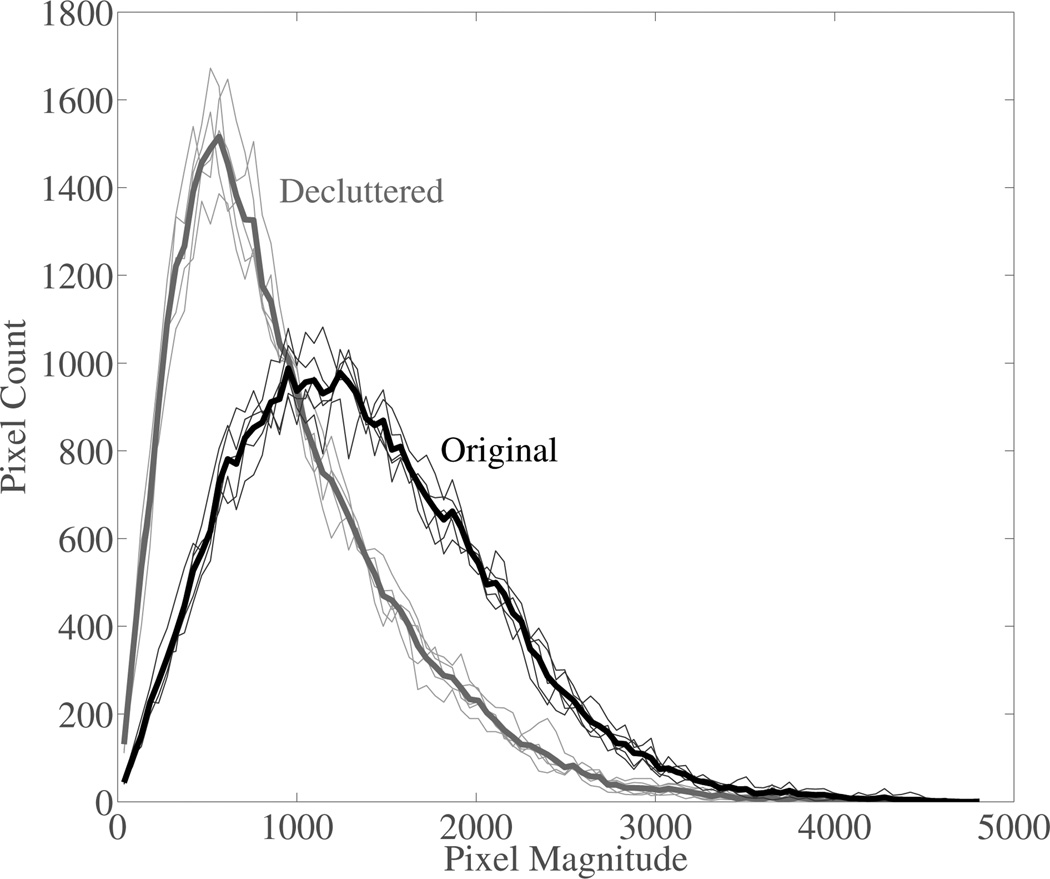
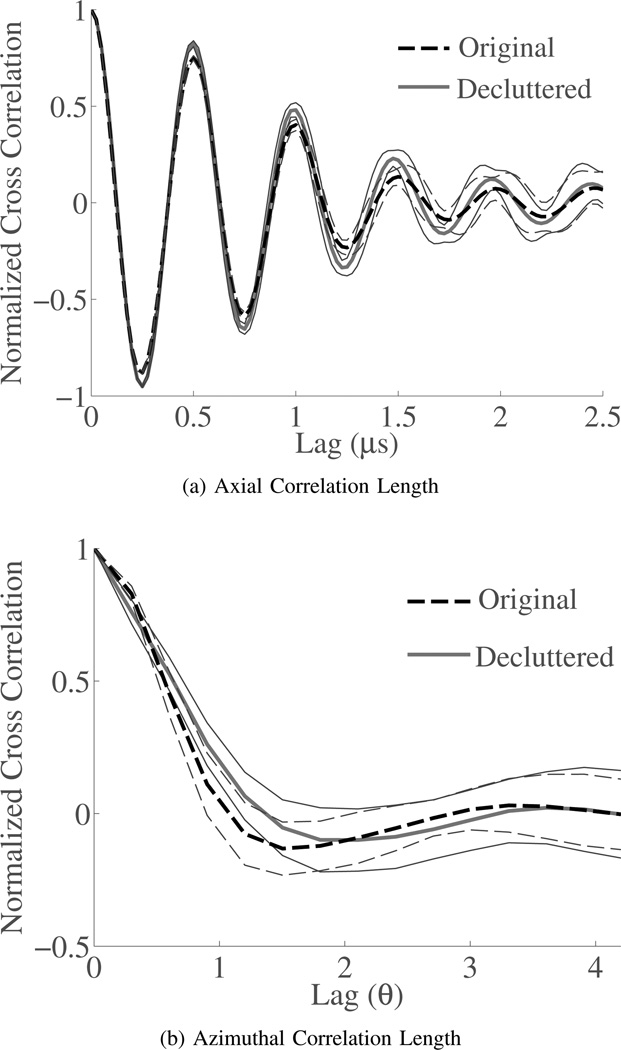
Finally, because of the significant decrease of speckle SNR after decluttering the in vivo images, speckle realizations were acquired from a uniform scattering region of a phantom. Results are reported for both the first and second order speckle statistics. To show change in first-order statistics the magnitude distributions from each of the five speckle realizations and the mean distribution for normal and decluttered B-mode data are shown in Fig. 8. The speckle SNR from each data set is shown in Tbl. III. The change in speckle statistics from normal B-mode to the decluttered B-mode is -0.40±0.03. The reduction in speckle after decluttering the data is very consistent, but it is less than the reduction of speckle SNR seen during in vivo imaging. This may indicate that some part of the increased variance of the decluttered background regions seen for the in vivo data sets may represent additional information revealed after decluttering. The second order speckle statistics are shown in Fig. 9, which show that after decluttering the second-order statistics do not appear to change. This is an encouraging result because the second order speckle statistics are important for motion estimation.
Fig. 8.
Histograms of phantom image magnitudes are shown for the original and decluttered data. The results show that the first order statistics are changed after decluttering. The histogram from all data sets are shown along with the mean histogram for each scenario.
Fig. 9.
Second order speckle statistics are shown in the axial and azimuthal dimensions for phantom data in regions of diffuse scattering. The second order statistics are consistent before and after decluttering the data. The mean correlations are displayed with the thick line and the standard deviations for each curve are displayed with the thinner line.
V. DISCUSSION
A multipath clutter model with an initial algorithm for decomposing the wavefronts was evaluated in an in vivo study. The in vivo results showed significant improvements in contrast. Additionally, it is of particular interest that it was not necessary to consider each scattering site in the wavefront decomposition. The algorithm worked effectively when individual scattering sites with similar origins were treated as single consensus scattering events. Although, this may explain why the speckle SNR was lower than expected. Additionally, there are fairly large standard deviations associated with the contrast and CNR. This is likely attributable to the dynamic nature of clutter between different patients and even within an individual patient but between different acoustic windows.
A decluttering algorithm like the one presented that does not depend on transmit focal parameters could have significant impact on imaging scenarios known to have significant clutter, such as full-field excitation sequences. Often full-field excitation sequences are intended to be used for motion estimation tasks. The preservation of the second-order RF speckle statistics can be considered a very preliminary feasibility study of coupling the decluttering algorithm with motion estimation.
The algorithm—as evaluated here—suppresses off-axis and multipath scatterers that are relatively distant from the main lobe. The algorithm does not improve upon the diffraction limit of the transducer array. However, instead of reconstructing RF scan lines, it is possible to reconstruct decluttered RF transducer channel data. The decluttered channel data could be used as a cleaner input into aberration correction schemes that can recover the diffraction limit or adaptive beamforming algorithms that surpass the diffraction limit.
Finally, in the introduction, it was indicated that there may not be a clear consensus on the sources of in vivo image degradation. It was shown in simulations that multiple scattering may be a significant source of image degradation [16]. However, there has been little in vivo evidence that near-field layers can create significant multipath scattering and subsequent image degradation because a method has not existed for differentiating off-axis and multipath scattering, and therefore, poor image quality has usually been attributed to poor lateral beamforming. The best example known to the authors of in vivo evidence for multipath scattering generated during abdominal imaging is the work by Lediju et al. that studied clutter in different portions of a full bladder [15]. In general though, differentiating off-axis and multipath clutter in vivo has been a significant challenge. The model and algorithm proposed here present a method for studying in vivo clutter in any scenario including scenarios when hypoechoic structures are not present.
VI. CONCLUSION
A model for the pressure waves sampled by the transducer has been presented. Because of the reduction in speckle SNR, it remains an open question whether the specific model motivated algorithm presented here will be useful clinically, despite the improvements in contrast. Here the model was used to suppress image clutter caused by off-axis and multipath scattering. The relative importance of these two mechanisms were not explored here, but it was shown that the parametrization was an effective way to improve image contrast in vivo. The model suggests significant opportunities for both improving in vivo B-mode image quality and exploring in vivo mechanisms of image degradation.
Fig. 7.
These image sets both show a human liver and gall bladder. Matched B-Mode and decluttered B-Mode images are shown for each clinical subject. The gall bladder is visible in the bottom of each image and a prominent vessel is visible in each image as well. In the second subject the decluttered image appears to show the bile duct coming from the gall bladder, which is not evident in the normal B-Mode image. All images are displayed with 65 dB dynamic range.
TABLE I.
Decomposition Parameters
| Parameter | Value | |
|---|---|---|
| f0 (MHz) | 1.8 | |
| fs (MHz) | 40 | |
| c (m/s) | 1540 | |
| F/# | 1 | |
| Transmit Cycles | 1 | |
| Apodization | Rectangular | |
| STFT Window Type | Tukey | |
| STFT Window Length (s) | 2 × Tpulse | |
| STFT Window Overlap (%) | 80 | |
| First Lag for (13) |
|
|
| Number of Lags for (13) | 5 | |
| Number of sources (iterations) | 15 | |
| Nmax | 15 | |
| αx | 2.5 | |
| αz | 0.1 |
TABLE II.
In Vivo Image Metric Summary Statistics
| Image Metric | Change in Metric |
|---|---|
| (Decluttered - Normal) | |
| Contrast (dB) | 7.3 ± 4.6 |
| CNR (dB) | −0.4±5.9 |
| SNRspeckle | −0.65 ± 0.28 |
TABLE III.
Phantom Speckle SNR
| Image Type | Speckle SNR |
||||
|---|---|---|---|---|---|
| #1 | #2 | #3 | #4 | #5 | |
| Original | 1.94 | 1.94 | 2.00 | 1.89 | 1.94 |
| Decluttered | 1.55 | 1.54 | 1.61 | 1.43 | 1.56 |
ACKNOWLEDGMENT
The authors would like to thank Gregg Trahey for useful conversations and Ned Danieley for computer assistance. This work was supported by NIH grant R37HL096023.
Contributor Information
Brett Byram, Email: brett.c.byram@vanderbilt.edu, department of Biomedical Engineering at Vanderbilt University, Nashville, TN, USA.
Marko Jakovljevic, Duke University’s department of Biomedical Engineering, Durham, NC, USA.
REFERENCES
- 1.Carson PL, Oughton TV. A modeled study for diagnosis of small anechoic masses with ultrasound. Radiology. 1977 Mar.122(no. 3):765–771. doi: 10.1148/122.3.765. [DOI] [PubMed] [Google Scholar]
- 2.Bly SHP, Foster FS, Patterson MS, Foster DR, Hunt JW. Artifactual Echoes in B-Mode Images due to Multiple Scattering. Ultrasound in Med. & Biol. 1985;11(no. 1):99–111. doi: 10.1016/0301-5629(85)90012-2. [DOI] [PubMed] [Google Scholar]
- 3.Smith S, Trahey G, von Ramm O. Phased array ultrasound imaging through planar tissue layers. Ultrasound in Medicine & Biology. 1986;12(no. 3):229–243. doi: 10.1016/0301-5629(86)90314-5. [DOI] [PubMed] [Google Scholar]
- 4.Mann JA, Walker W. A constrained adaptive beamformer for medical ultrasound: initial results. Ultrasonics Symposium: 2002. Proceedings 2002 IEEE. 2002;2:1807–1810. vol. 2. [Google Scholar]
- 5.Tabei M, Mast TD, Waag RC. Simulation of ultrasonic focus aberration and correction through human tissue. J Acoust Soc Am. 2003;113(no. 2):1166–1176. doi: 10.1121/1.1531986. [DOI] [PubMed] [Google Scholar]
- 6.Zemp R, Parry M, Abbey C, Insana M. Detection performance theory for ultrasound imaging systems. IEEE Trans Med Imaging. 2005;24(no. 3):300–310. doi: 10.1109/tmi.2004.841226. [DOI] [PMC free article] [PubMed] [Google Scholar]
- 7.Guenther D, Walker W. Generalized cystic resolution: a metric for assessing the fundamental limits on beamformer performance. IEEE Trans Ultrason Ferroelectr Freq Control. 2009;56(no. 1):77–90. doi: 10.1109/TUFFC.2009.1007. [DOI] [PMC free article] [PubMed] [Google Scholar]
- 8.Flax SW, O’Donnell M. Phase-aberration correction using signals from point reflectors and diffuse scatterers: basic principles. IEEE transactions on ultrasonics, ferroelectrics, and frequency control. 1988 Jan.35(no. 6):758–767. doi: 10.1109/58.9333. [DOI] [PubMed] [Google Scholar]
- 9.Liu DL, Waag RC. Correction of ultrasonic wavefront distortion using backpropagation and a reference waveform method for time-shift compensation. The Journal of the Acoustical Society of America. 1994 Aug.96(no. 2 Pt 1):649–660. doi: 10.1121/1.410304. [DOI] [PubMed] [Google Scholar]
- 10.Krishnan S, Li P-c, O’Donnell M. Adaptive Compensation of Phase and Magnitude Aberrations. IEEE Trans. Ultrason. Ferroelect. Freq. Contr. 1996;43(no. 1):44–55. [Google Scholar]
- 11.Seo CH, Yen JT. Sidelobe suppression in ultrasound imaging using dual apodization with cross-correlation. IEEE transactions on ultrasonics, ferroelectrics, and frequency control. 2008 Oct.55(no. 10):2198–2210. doi: 10.1109/TUFFC.919. [DOI] [PMC free article] [PubMed] [Google Scholar]
- 12.Guenther DA, Walker WF. Robust finite impulse response beamforming applied to medical ultrasound. IEEE transactions on ultrasonics, ferroelectrics, and frequency control. 2009 Jun.56(no. 6):1168–1188. doi: 10.1109/TUFFC.2009.1159. [DOI] [PMC free article] [PubMed] [Google Scholar]
- 13.Becher H, Tiemann K, Schlosser T, Pohl C, Nanda NC, Averkiou Ma, Powers J, Lüderitz B. Improvement in Endocardial Border Delineation Using Tissue Harmonic Imaging. Echocardiography. 1998 Jul.15(no. 5):511–518. doi: 10.1111/j.1540-8175.1998.tb00642.x. [DOI] [PubMed] [Google Scholar]
- 14.Spencer K, Bednarz J, Rafter P, Korcarz C, Lang R. Use of harmonic imaging without echocardiographic contrast to improve two-dimensional image quality. The American Journal of Cardiology. 1998 Sep.82(no. 6):794–799. doi: 10.1016/s0002-9149(98)00457-3. [DOI] [PubMed] [Google Scholar]
- 15.Lediju Ma, Pihl MJ, Dahl JJ, Trahey GE. Quantitative assessment of the magnitude, impact and spatial extent of ultrasonic clutter. Ultrasonic imaging. 2008 Jul.30(no. 3):151–168. doi: 10.1177/016173460803000302. [DOI] [PMC free article] [PubMed] [Google Scholar]
- 16.Pinton GF, Trahey GE, Dahl JJ. Erratum: Sources of image degradation in fundamental and harmonic ultrasound imaging: a nonlinear, full-wave, simulation study. IEEE transactions on ultrasonics, ferroelectrics, and frequency control. 2011 Jun.58(no. 6):1272–1283. doi: 10.1109/TUFFC.2011.1938. [DOI] [PMC free article] [PubMed] [Google Scholar]
- 17.Fink M. Time reversal of ultrasonic fields – part I : basic principles. IEEE Trans. Ultrason., Ferroelec. Freq. Contr. 1992;39(no. 5):555–566. doi: 10.1109/58.156174. [DOI] [PubMed] [Google Scholar]
- 18.Lediju Ma, Pihl MJ, Hsu SJ, Dahl JJ, Gallippi CM, Trahey GE. A motion-based approach to abdominal clutter reduction. IEEE transactions on ultrasonics, ferroelectrics, and frequency control. 2009 Nov.56(no. 11):2437–2449. doi: 10.1109/TUFFc.2009.1331. [DOI] [PMC free article] [PubMed] [Google Scholar]
- 19.Camacho J, Parrilla M, Fritsch C. Phase coherence imaging. IEEE transactions on ultrasonics, ferroelectrics, and frequency control. 2009 May;56(no. 5):958–974. doi: 10.1109/TUFFC.2009.1128. [DOI] [PubMed] [Google Scholar]
- 20.Lediju Ma, Trahey GE, Byram BC, Dahl JJ. Short-lag spatial coherence of backscattered echoes: imaging characteristics. IEEE transactions on ultrasonics, ferroelectrics, and frequency control. 2011 Jul.58(no. 7):1377–1388. doi: 10.1109/TUFFC.2011.1957. [DOI] [PMC free article] [PubMed] [Google Scholar]
- 21.Osmanski B, Montaldo G, Tanter M, Fink M. Aberration correction by time reversal of moving speckle noise. IEEE Trans Ultrason Ferroelectr Freq Control. 2012;59(no. 7):1575–1583. doi: 10.1109/TUFFC.2012.2357. [DOI] [PubMed] [Google Scholar]
- 22.Udesen J, Gran F, Hansen KL, Jr, Jensen A, Thomsen C, Nielsen MB. High frame-rate blood vector velocity imaging using plane waves: simulations and preliminary experiments. IEEE transactions on ultrasonics, ferroelectrics, and frequency control. 2008;55(no. 8):1729–1743. doi: 10.1109/TUFFC.2008.858. [DOI] [PubMed] [Google Scholar]
- 23.Montaldo G, Tanter M, Bercoff J, Benech N, Fink M. Coherent plane-wave compounding for very high frame rate ultrasonography and transient elastography. IEEE Trans Ultrason Ferroelectr Freq Control. 2009 Mar.56(no. 3):489–506. doi: 10.1109/TUFFC.2009.1067. [DOI] [PubMed] [Google Scholar]
- 24.Byram B. Ultrasonic reverberation and off-axis clutter suppresion using aperture domain signal decomposition; Proc. SPIE 8675, Medical Imaging 2013: Ultrasonic Imaging, Tomography, and Therapy; 2013. [Google Scholar]
- 25.Jensen JA. A model for the propagation and scattering of ultrasound in tissue. Journal of the Acoustical Society of America. 1991 Jan.89(no. 1):182–190. doi: 10.1121/1.400497. [DOI] [PubMed] [Google Scholar]
- 26.Goodman JW. Introduction to Fourier Optics. 3rd ed. Englewood: Colorado: Roberts & Company; 2005. [Google Scholar]
- 27.Jensen JA, Svendsen NB. Calculation of pressure fields from arbitrarily shaped, apodized, and excited ultrasound transducers. IEEE Trans. Ultrason., Ferroelec., Freq. Contr. 1992;39:262–267. doi: 10.1109/58.139123. [DOI] [PubMed] [Google Scholar]
- 28.Holfort IK, Gran F, Jensen A., Jr Broadband minimum variance beamforming for ultrasound imaging. IEEE transactions on ultrasonics, ferroelectrics, and frequency control. 2009 Feb.56(no. 2):314–325. doi: 10.1109/TUFFC.2009.1040. [Online]. Available: http://www.ncbi.nlm.nih.gov/pubmed/19251518. [DOI] [PubMed] [Google Scholar]
- 29.Griffin DW, Lim JS. Signal estimation from modified short-time Fourier transform. IEEE Transactions on Acoustics, Speech, and Signal Processing. 1984 Apr.32(no. 2):236–243. [Google Scholar]
- 30.Barbarossa S, Scaglione A, Giannakis GB. Product High-Order Ambiguity Function for Multicomponent Polynomial-Phase Signal Modeling. IEEE Trans Sig Proc. 1998;46(no. 3):691–708. [Google Scholar]
- 31.Lv X, Bi G, Wan C, Xing M. Lv’s Distribution: Principle, Implementation, Properties, and Performance. IEEE Trans Sig Proc. 2011;59(no. 8):3576–3591. [Google Scholar]
- 32.Bretthorst GL. Bayesian Spectrum Analysis and Parameter Estimation. Springer Verlag; 1988. [Google Scholar]
- 33.Dahl JJ, Soo MS, Trahey GE. Spatial and temporal aberrator stability for real-time adaptive imaging. IEEE Trans Ultrason Ferroelectr Freq Control. 2005;52(no. 9):1504–1517. doi: 10.1109/tuffc.2005.1516023. [DOI] [PubMed] [Google Scholar]
- 34.Bottenus N, Byram B, Trahey G. A synthetic aperture study of aperture size in the presence of noise and in vivo clutter. Proc. SPIE 8675, Medical Imaging 2013: Ultrasonic Imaging, Tomography, and Therapy. 2013 [Google Scholar]


