ABSTRACT
We propose an approach of estimating individual growth curves based on the birthday information of Japanese Thoroughbred horses, with considerations of the seasonal compensatory growth that is a typical characteristic of seasonal breeding animals. The compensatory growth patterns appear during only the winter and spring seasons in the life of growing horses, and the meeting point between winter and spring depends on the birthday of each horse. We previously developed new growth curve equations for Japanese Thoroughbreds adjusting for compensatory growth. Based on the equations, a parameter denoting the birthday information was added for the modeling of the individual growth curves for each horse by shifting the meeting points in the compensatory growth periods. A total of 5,594 and 5,680 body weight and age measurements of Thoroughbred colts and fillies, respectively, and 3,770 withers height and age measurements of both sexes were used in the analyses. The results of predicted error difference and Akaike Information Criterion showed that the individual growth curves using birthday information better fit to the body weight and withers height data than not using them. The individual growth curve for each horse would be a useful tool for the feeding managements of young Japanese Thoroughbreds in compensatory growth periods.
Keywords: birthday, body weight, individual growth curve, Thoroughbred, withers height
Recently, much attention has been paid to the growth pattern of young Thoroughbred horses during winter and spring seasons [5, 7,8,9,10, 12, 14, 15]. Thoroughbred horses are well-known animals in horseracing worldwide, and they are seasonal breeding animals. The young foals are born in spring and generally show seasonal compensatory growth (CG) patterns in which their growth rates decline in the winter and dramatically increase in the following spring, due to the coldness of the winter season especially in northern regions or countries [3].
Thoroughbred yearlings are usually at a high risk of developmental disorders (e.g. osteochondrosis and orthopaedic diseases) as noted by Mohammed [6]. Some horse researchers also reported that rapid/irregular growth and skeletal abnormalities are associated with each other [11, 16]. Due to the dramatic change of the growth pattern during winter and spring seasons, the seasonal CG pattern of growth could be an additional risk factor for the physical development of young Thoroughbreds.
Concerning body weights and withers heights for Japanese Thoroughbreds, we formerly proposed mathematical equations for empirical growth curves considering seasonal CG [7,8,9]. These growth curve equations are continuous single variable functions of horse age, and these equations are easily applicable for the modeling of individual growth curves for each horse. The individual growth curve for each horse would be effective for their careful management in winter and spring seasons in order to achieve sound musculoskeletal development or desirable body compositions of growing horses.
The CG patterns of growth appear during only the winter and spring seasons in the life of each young foal, and the meeting time point at the CG period of each foal depends on his/her birthday. For example, a foal born in June meets the CG period five months earlier in his/her life than a foal born in January. Some researchers also reported that the trend of CG growth in each foal’s life depends on their birthday [5, 10, 12, 17]. Thus, a parameter defining the relative birth date (RBD) based on his/her birthday information can be used for the modeling of the individual growth curve for each horse by shifting the meeting points at CG periods.
We propose an approach of modeling individual growth curves for young Thoroughbred horses based on their birthday information, once the standardized general growth curves considering CG have been preliminarily estimated for the Thoroughbred population.
Materials and Methods
Data description
A total of 5,594 and 5,680 body weight (BW; kg) and age (day) measurements of 271 colts and 237 fillies of Thoroughbreds, respectively, were collected by Hidaka Training and Research Center, Japan Racing Association (JRA) and the Japan Bloodhorse Breeders’ Association (JBBA) between 1999 and 2009. In addition, a total of 3,770 withers height (WH; cm) and age (day) measurements of 422 Thoroughbred colts and fillies were also collected. The data collection was mainly organized in the Hidaka region of Hokkaido. Due to the coldness in the winter, the typical CG phenomenon appears in the growth of the Thoroughbred foals in the region [8].
Frequency distributions of birth months and the number of the foals are shown in Table 1. Birth months of foals varied from January to June and generally March is the major birth month of the foals.
Table 1. Frequency distribution of the number (N) of body weight (BW) and withers height (WH) data of Thoroughbred foals by birth months.
| Birth month | BW |
WH |
||||
|---|---|---|---|---|---|---|
| Colts |
Fillies |
Foals | N | |||
| Foals | N | Foals | N | |||
| Jan | 9 | 198 | 8 | 96 | 12 | 127 |
| Feb | 57 | 1,126 | 57 | 1,123 | 87 | 892 |
| Mar | 75 | 1,535 | 67 | 1,307 | 115 | 922 |
| Apr | 85 | 1,031 | 57 | 1,167 | 127 | 998 |
| May | 39 | 1,092 | 38 | 813 | 67 | 572 |
| Jun | 6 | 612 | 10 | 674 | 14 | 259 |
| Total | 271 | 5,594 | 237 | 5,680 | 422 | 3,770 |
For more data descriptions, please see Onoda et al. [9] where the data was identical to this study. The management and handling of young Japanese Thoroughbred horses are also explained in detail in JSES [4].
A new parameter adjusting relative birth date
Based on the growth curves established in our previous study [8, 9], we added a new parameter d for adjusting the relative birth date (RBD) founded on December 31. For each foal, d is computed as a numerical date of the birthday of each foal counted from December 31st. If a foal’s birthday is January 1st, then d=1. If a foal’s birthday is February 15th, then d=46. The population average of d for all horses used in this study was d=81 (i.e., about March 21–22nd).
Individual growth curves for body weight
For the modeling of individual growth curves for BW of Thoroughbred colts and fillies, the following equations (Equations 1 and 2) were used:
 |
(Equation 1)
and
 , ,
|
(Equation 2)
where  , ,
|
 . .
|
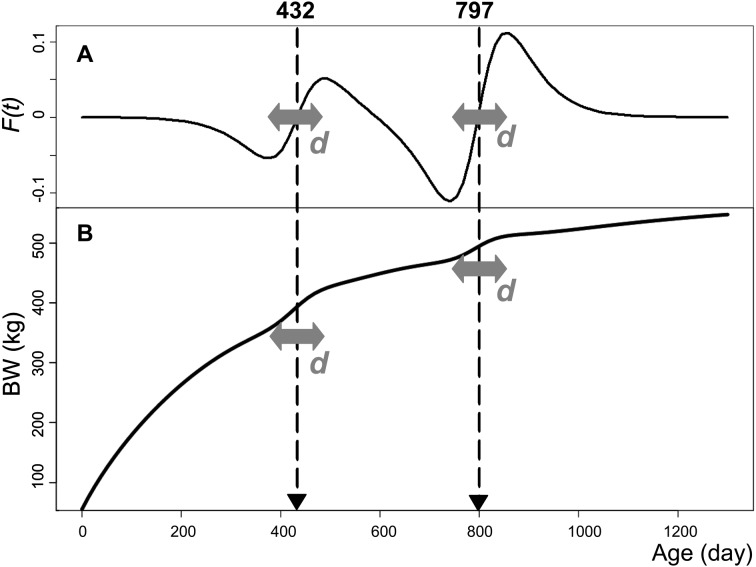
These equations are identical to those derived by Onoda et al. [8, 9] except that “+ d − 81.0” were inserted in the sub-functions f(t) and f’(t). The sub-functions f(t) and f’(t) adjust the first and second year CG at the centers of 432 and 797 (= 432 + 365) days of age, respectively [8, 9]. The parameter d is used for shifting the centers of these CG periods (i.e., 432 and 797 days) horizontally forward or backward as shown in Fig. 1, as an example. If d=81 then no shifting occurs, and Equations 1 and 2 become completely identical to the equations proposed in Onoda et al. [8, 9]. By modifying the d value for each foal, the individual growth curve equation for him/her can be obtained. These equations are still the single variable functions of age in days (t).
Fig. 1.
An illustrative example of the parameter d shifting the centers of CG periods (i.e., at 432 and 797 days of age) using the male body weight (BW) growth curve equation. Graph A illustrates the values of composite sub-function F(t)=0.3582×f(t) + 0.7466×f’(t) with age with d=81 (see Equation 1). Graph B illustrates the values of the standard male BW equation (i.e., Equation 1 with d=81) with age. The parameter d is used for shifting these centers of CG periods in forward or backward directions.
Individual growth curves for withers height
For the modeling of individual growth curves for withers heights of Thoroughbreds, the following equation were used:
 |
(Equation 3)
where  . .
|
This Equation 3 is identical to that derived by Onoda et al. [9] except for the substitution of “+ d − 81.0” in the sub-function f(t), as noted above. The f(t) was identical to that used in Equations 1 and 2 assuming that the CG affects WH at the same period as in BW [9].
Model comparison
To confirm the usefulness of this approach, Prediction Error Difference (PED) is computed for each data point and then tested. Prediction error e can be computed as e=observed value at t – predicted value at t by using the observed data value (i.e., having t information) and the predicted value at the t value. To obtain the predicted values, the Equations 1, 2 and 3 were used with the corresponding t values.
Two different prediction errors e1 and e2 were then computed by using the Equations 1, 2 and 3 with its own d value of the horse, and with d=81, respectively, where e1 is based on its own d value (i.e., d shifting), and e2 is on d=81 (i.e., no shifting). Then PED is computed for each data as follows: PED=e12 –e22. After the computation of PED values for all the data, then the average of the PED was calculated and t-tested from zero by using SAS MEANS procedure [13]. Results are shown as mean ± SE of the PED.
In addition to the PED, Akaike Information Criterions (AIC) [1] were also computed and used for the model comparisons among the models with d shifting (i.e., using d values based on birthday) or no shifting (i.e., d=81 and constant) in the different data set divided due to horses’ birth months. AIC values were calculated by using SAS NLMIXED procedure [13].
Results
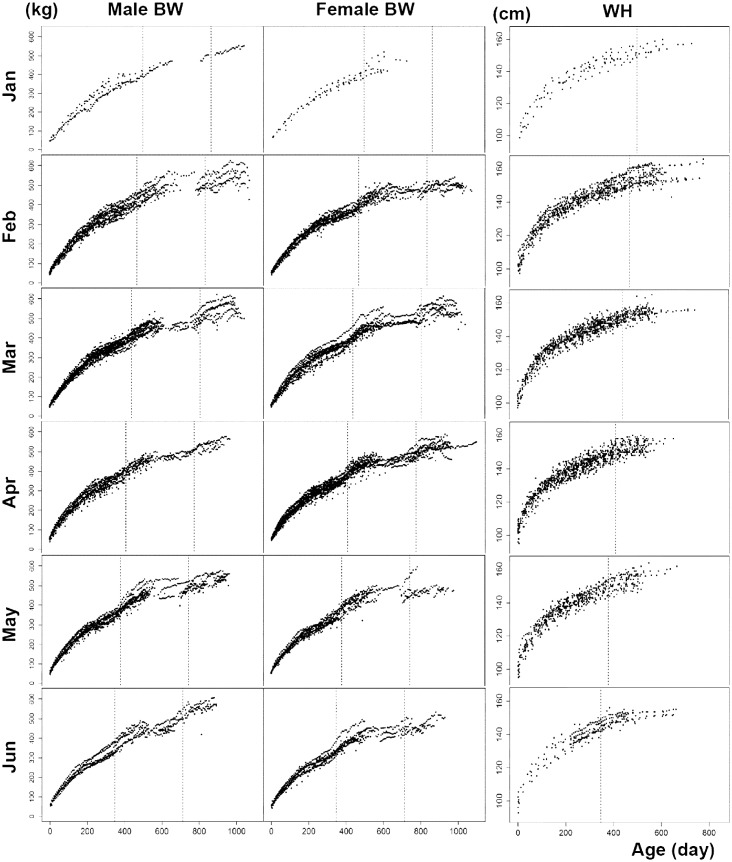
The scatterplots of weight/height-age data of the analyzed Thoroughbred horses are shown with black dots in Fig. 2 by different birth months of the horses. Dashed lines indicate the first (left) and second (right) CG periods with the assignments of the shifted d values representing the middle day of the corresponding month. In Fig. 2, the data tendency of shifting CG periods is clearly recognized according to the different birth months of horses, especially in BW. Foals born in June met the CG periods much earlier in his/her life stage than foals born in January. The assigned dashed lines with different d values for each month seem to be reasonable representatives of the shifting centers of CG periods on different birth months of horses. Concerning WH, such a clear tendency was not recognized as body weights.
Fig. 2.
The scatterplots of body weight (BW) and withers height (WH) data of the analyzed Thoroughbred horses by separating birth months of the horses. Dashed lines indicate the first (left) and second (right) CG periods by arbitrary assigning the shifted d values representing the middle day of each month. The assigned values of d were d=15, d=45, d=75, d=105, d=135 and d=165 for January, February, March, April, May and June, respectively. These d values are the representatives of the middle day of the corresponding months.
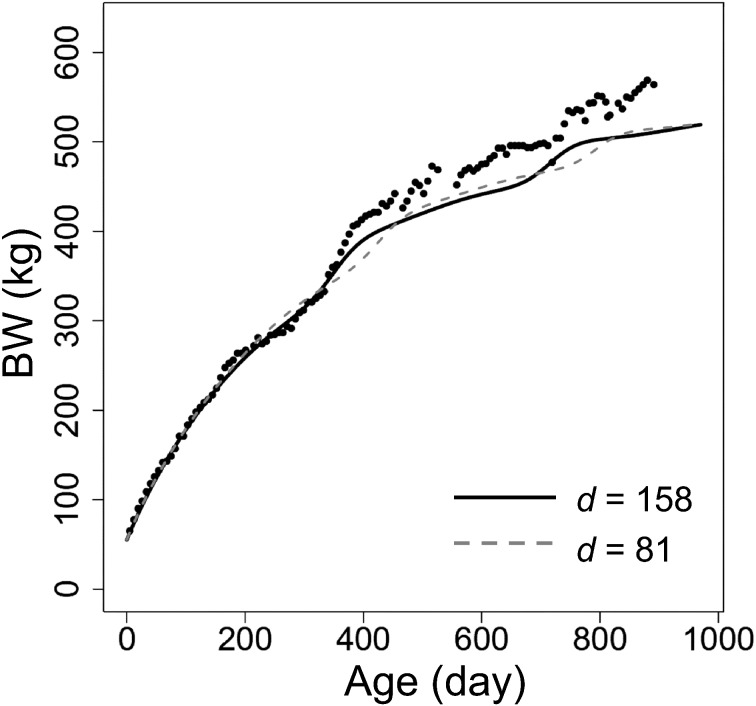
An example for the construction of individual growth curve for a colt with the birthday of June 7th is shown in Fig. 3, and his birthday corresponds to d=158. The constructed individual growth curve with d=158 describes the tendency of the growth of the foal more precisely during the first and second CG periods than the standard growth curve with no shifting.
Fig. 3.
An example of the individual growth curve for a colt with the birthday of June 7th (d=158). His body weight data are shown with black dots. The constructed individual growth curve with d=158 is shown with a solid black line. A standard growth curve with d=81 (i.e., no shifting) is shown with a dashed line.
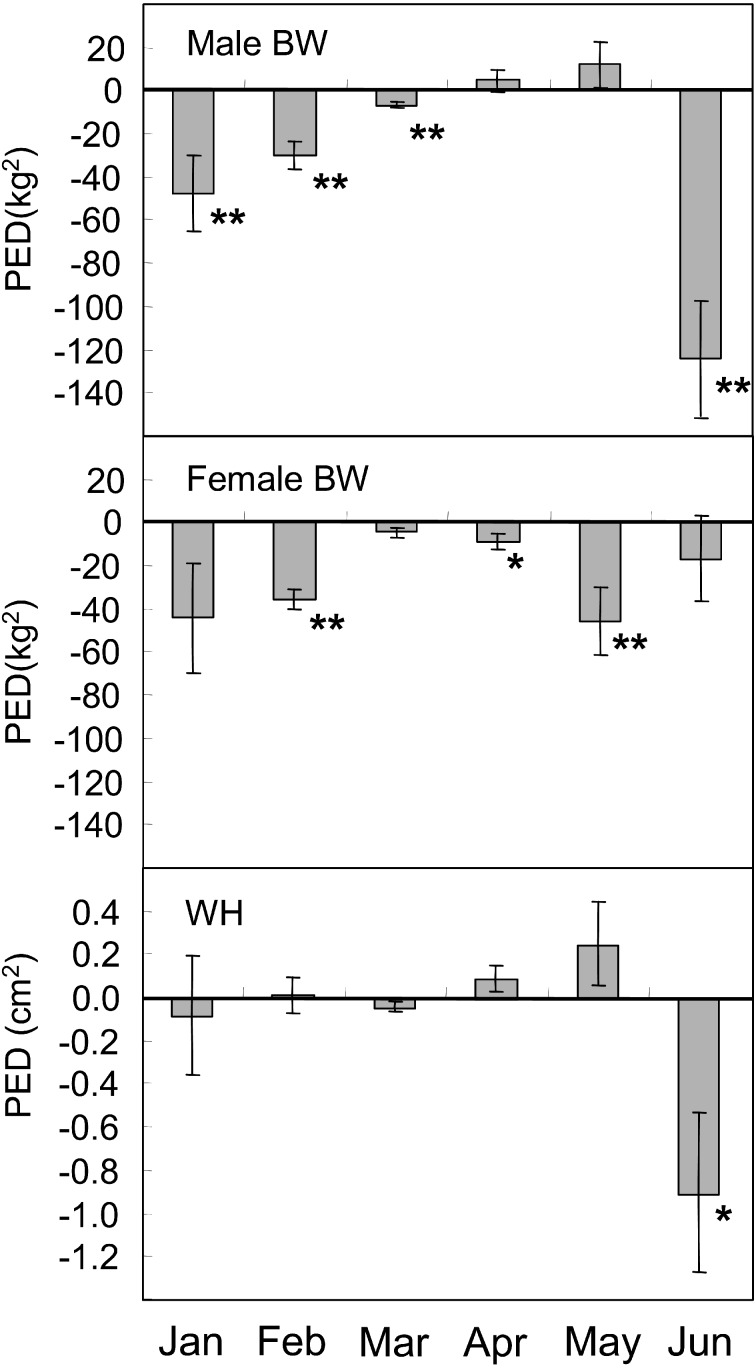
The results of the model comparison based on PED are shown in Fig. 4. If the PED value is negative, the individual growth curves with d shifting is better fit to the data than the standard growth curves with no shifting. There were highly significant effects of using the parameter d with their birthday on the PED for the male horses born in January, February, March and June (P<0.01) for BW, and there were no detectable effects on the horses born in April and May. Concerning female BW, generally negative values of PED were recognized for all birth months and they were highly significant for the horses born in February and May (P<0.01). For WH, there was no detectable effect except for the horses born in June. Rather high positive value of PED was recognized in May in WH, but it was insignificant.
Fig. 4.
Mean ± SE of the Prediction Error Difference (PED) values for ale and female body weight (top and center) and for withers height (bottom) by different birth months of the analyzed horses. Negative values of PED indicate the better fit of growth curves with d values based on birthday (d shifting) than growth curves with d=81 (no shifting). * P<0.05, ** P<0.01.
The model comparison based on AIC are shown in Table 2 and the smaller AIC values (i.e., printed in bold and italic fonts in Table 2) indicate the better fit to the corresponding data. Concerning male BW, the completely same tendency was recognized as PED in Fig. 4. Concerning female BW, all resulted the better fit of the models with d shifting. For WH, the results of March to June clarified the better fit of the models with d shifting. The results using all month data showed the better fit of the models with d shifting for both BW and WH.
Table 2. Akaike Information Criterion (AIC) of body weight (BW) and withers height (WH) for Thoroughbreds growth curve models. Data of Thoroughbred foals is divided by their birth months.
| Birth month | Models1 | AIC2 |
||
|---|---|---|---|---|
| BW |
WH | |||
| Colts | Fillies | |||
| Jan | d shifting | 1,778 | 770 | 493 |
| no shifting | 1,793 | 799 | 492 | |
| Feb | d shifting | 9,183 | 9,418 | 3,754 |
| no shifting | 9,391 | 9,550 | 3,729 | |
| Mar | d shifting | 12,430 | 11,205 | 3,976 |
| no shifting | 12,506 | 11,229 | 3,978 | |
| Apr | d shifting | 8,121 | 13,585 | 4,695 |
| no shifting | 8,058 | 13,648 | 4,726 | |
| May | d shifting | 9,093 | 6,639 | 2,585 |
| no shifting | 9,013 | 6,837 | 2,616 | |
| Jun | d shifting | 4,904 | 5,462 | 923 |
| no shifting | 5,100 | 5,598 | 1,052 | |
| Total | d shifting | 45,675 | 47,157 | 16,535 |
| no shifting | 46,068 | 47,707 | 16,673 | |
1 Growth curve models with d values based on birthday (d shifting) or with d=81 (no shifting). 2 The smaller value of AIC with boldface and italic fonts indicates better fit of growth curves to the corresponding data within birth month.
Discussion
We propose an approach of estimating individual growth curves based on the birthday information of Japanese Thoroughbred horses. As shown in Fig. 3, the proposed individual growth curves using the parameter d based on his/her birthday information demonstrated the shape of the data profile showing CG patterns more precisely than the growth curves of no shifting (i.e., d=81).
The CG pattern of growth is generally distinctive only in the season of the winter and the following spring, and the meeting point at CG periods in each horse’s life shifted according to his/her birthday. The shifting pattern of the CG periods according to birth months of the horses is clearly shown in Fig. 2. The degree of the improvement of the shifting on PED was also distinctive especially for the horses of early or late birth as shown in Fig. 4, because the birth dates of these horses much differ from the population average of birth date (i.e., March 21–22nd; corresponding to d=81) and the adjustment effect of the parameter d becomes considerable in these months such as January or June (i.e., months apart from March).
Some researchers also reported that the trend of CG growth in each foal’s life depends on their birthday [5, 10, 12, 17]. Pagan et al. [12] found that growth rate of body weight of Thoroughbreds in Kentucky was affected by seasons in addition to ages in days, and suggested that the differences of birthday could not be ignored for individual growth curve estimation for each horse. Kocher and Staniar [5] reported that the growth of all young horses simultaneously is affected downwards by the arrival of the winter season, instead of the variation of birthdays of the analyzed horses. Yamamoto et al. [17] found that the season of the growth stagnation of young Japanese Thoroughbred horses tended to be identical in spite of the variety of their birth months. Their findings were similar to our study, suggesting that the appearance of CG patterns in the growth of young Thoroughbreds is significantly determined by the arrival of the winter seasons (or CG periods).
Concerning WH, only the horses born in June showed the significant effect of their birthday adjustment on PED (Fig. 4), but on AIC the horses born in March to June showed the better effects of d shifting (Table 2). The usefulness of using the parameter d for WH is not so distinctive as BW, but still detected as Table 2. Anderson and McIlwraith [2] discussed that horses grow taller faster than they increase their body mass. Kocher and Staniar [5] also reviewed the phenomenon of faster growth of WH than BW. The faster growth of WH before the first CG period than BW might be related the rather insignificant effect of CG on WH. The combined knowledge of both BW and WH would be useful for detection of the unbalance between weight and height which may cause the critical growth disorders on young horses especially for the horses born in June.
Our approach of using the parameter d shifting the meeting points at CG periods in the estimation of individual growth curves can be easily applicable to obtain individual empirical percentile curves considering CG. Based on the empirical percentile curves with Z-scores [9], the parameter d can be easily included in the mathematical models. The individual percentile curves of body weight and withers height for each horse based on his/her birthday would be a useful diagnostic tool for careful feeding management of young Japanese Thoroughbred horses during compensatory growth periods.
Acknowledgments
We would like to thank the Racehorse Breeding Promotion Program (2005–2010) organized by the National Association of Racing, through which the Japan Bloodhorse Breeders’ Association was able to conduct its equine nutrition consulting study program as part of the Bloodstock Industry Business Management Training Program, and also the Japan Racing Association Hidaka Training and Research Center for providing growth data of horses as study material for this research. We also would like to thank Dr. Malcolm Fitz-Earle, Emeritus Professor of Capilano University, Canada for revisions to this manuscript.
References
- 1.Akaike H.1973. Information theory and an extension of the maximum likelihood principle. pp. 267–281 In: 2nd Int. Symp. Inf. Theory, Budapest, Hungary. Tsahkadsor, Armenian SSR.
- 2.Anderson T.M., McIlwraith C.W.2004. Longitudinal development of equine conformation from weanling to age 3 years in the Thoroughbred. Equine Vet. J. 36: 563–570 [DOI] [PubMed] [Google Scholar]
- 3.Brown-Douglas C.G., Pagan J.D.2006. Body weight, wither height and growth rates in Thoroughbreds raised in America, England, Australia, New Zealand and India. pp. 213–220. In: Advances in equine nutrition, Vol. IV 2004–2008, Kentucky Equine Research, Versailles. [Google Scholar]
- 4.JSES2013. The Racehorse Handbook. Japanese Society of Equine Science, Maruzen, Tokyo, Japan. [Google Scholar]
- 5.Kocher A., Staniar W.B.2013. The pattern of thoroughbred growth is affected by a foal’s birthdate. Livest. Sci. 154: 204–214 [Google Scholar]
- 6.Mohammed H.O.1990. Factors associated with the risk of developing osteochondrosis in horses: a case-control study. Prev. Vet. Med. 10: 63–71 [Google Scholar]
- 7.Onoda T., Yamamoto R., Sawamura K., Inoue Y., Matsui A., Miyake T., Hirai N.2011. Empirical growth curve estimation using sigmoid sub-functions that adjust seasonal compensatory growth for male body weight of Thoroughbred horses. J. Equine Sci. 22: 37–42 [DOI] [PMC free article] [PubMed] [Google Scholar]
- 8.Onoda T., Yamamoto R., Sawamura K., Inoue Y., Murase H., Nambo Y., Tozaki T., Matsui A., Miyake T., Hirai N.2013. Empirical growth curve estimation considering multiple seasonal compensatory growths of body weights in Japanese Thoroughbred colts and fillies. J. Anim. Sci. 91: 5599–5604 [DOI] [PubMed] [Google Scholar]
- 9.Onoda T., Yamamoto R., Sawamura K., Murase H., Nambo Y., Inoue Y., Matsui A., Miyake T., Hirai N.2013. Empirical percentile growth curves with Z-scores considering seasonal compensatory growths for Japanese Thoroughbred horses. J. Equine Sci. 24: 63–69 [DOI] [PMC free article] [PubMed] [Google Scholar]
- 10.Pagan J.D., Brown-Douglas C.G., Caddel S.2006. Body weight and condition of Kentucky Thoroughbred mares and their foals as influenced by month of foaling, season, and gender. pp. 245–252. In: Nutrition and feeding of the broodmare. European Association for Animal Production publication, Wageningen Academic Publishers, Wageningen. [Google Scholar]
- 11.Pagan J.D., Jackson S.G.1996. The incidence of developmental orthopedic disease on a Kentucky thoroughbred farm. Pferdeheilk 12: 351–354 [Google Scholar]
- 12.Pagan J.D., Jackson S.G., Caddel S.1996. A summary of growth rates of thoroughbreds in Kentucky. Pferdeheilk 12: 285–289 [Google Scholar]
- 13.SAS Institute Inc.2008. SAS/STAT user’s guide, version 9.2 edition. SAS Institute Inc., Cary, North Carolina. [Google Scholar]
- 14.Staniar W.B., Kronfeld D.S., Treiber K.H., Splan R.K., Harris P.A.2004. Growth rate consists of baseline and systematic deviation components in Thoroughbreds. J. Anim. Sci. 82: 1007–1015 [DOI] [PubMed] [Google Scholar]
- 15.Staniar W.B., Kronfeld D.S., Treiber K.H., Splan R.K., Harris P.A.2005. Thoroughbred growth characterized by a baseline and systematic deviation. pp. 61–63. In: The growing horse: nutrition and prevention of growth disorders. European Association for Animal Production publication, Wageningen Academic Publishers, Wageningen. [Google Scholar]
- 16.van Weeren P.R., Sloet van Oldruitenborgh-Ooste, Barneveld A.1999. The influence of birth weight, rate of weight gain and final achieved height and sex on the development of osteochondrotic lesions in a population of genetically predisposed Warmblood foals. Equine Vet. J. Suppl. 31: 26–30 [DOI] [PubMed] [Google Scholar]
- 17.Yamamoto O., Asai Y., Kusunose R.1993. Effects of sex, birth month, parity, weight of dam and farm on the growth of Thoroughbred foals and yearlings. Anim. Sci. Technol. Jpn. 64: 491–498 [Google Scholar]


