

Abstract
Objective
Resection of brain tumors adjacent to eloquent areas represents a challenge in neurosurgery. If maximal resection is desired without inducing postoperative neurological deficits, a detailed knowledge of the functional topography in and around the tumor is crucial. The aim of the present work is to evaluate the value of preoperative magnetoencephalography (MEG) imaging of functional connectivity to predict the results of intraoperative electrical stimulation (IES) mapping, the clinical gold standard for neurosurgical localization of functional areas.
Methods
Resting-state whole-cortex MEG recordings were obtained from 57 consecutive subjects with focal brain tumors near or within motor, sensory or language areas. Neural activity was estimated using adaptive spatial filtering algorithms, and the mean imaginary coherence between the rest of the brain and voxels in and around brain tumors were compared to the mean imaginary coherence between the rest of the brain and contralesional voxels as an index of functional connectivity. IES mapping was performed in all subjects. The cortical connectivity pattern near the tumor was compared to IES results.
Results
Maps with decreased resting-state functional connectivity in the entire tumor area had a negative predictive value of 100% for absence of eloquent cortex during IES. Maps showing increased resting-state functional connectivity within the tumor area had a positive predictive value of 64% for finding language, motor or sensory cortical sites during IES mapping.
Interpretation
Preoperative resting state MEG connectivity analysis is a useful noninvasive tool to evaluate the functionality of the tissue surrounding tumors within eloquent areas, and could potentially contribute to surgical planning and patient counseling.
Keywords: Magnetoencephalography, functional connectivity, Intraoperative electrical stimulation, brain tumor, imaginary coherence, magnetic source imaging
Introduction
Brain tumors located near or within eloquent areas – the structures supporting language, motor, sensory or other cognitive functions – represent a challenge in neurosurgery, as the resection of these lesions may induce a permanent postoperative neurological deficit. IES provides unique assistance in their resection, as it generates a discrete and transient “virtual” lesion within the eloquent tissue. Tumor removal is then tailored according to functional boundaries, in order to optimize the quality of resection, and to minimize of the risk of postoperative sequelae, with preservation of the quality of life 21,22,43–46.
IES has become the clinical gold standard for localization of functional areas during neurosurgical procedures 19–22. However, IES language mapping is an invasive technique that requires expertise of the surgical team, and an awake, cooperative and motivated subject. It is also time consuming, adding considerable length to the surgical procedure, and carries the risk of inducing afterdischarges and seizures. There is also a limit tothe number of tasks that can be used during IES because the patient becomes progressively fatigued 47–50. Consequently, non-invasive functional neuroimaging techniques such as positron emission tomography (PET), functional magnetic resonance imaging (fMRI) and magnetoencephalography (MEG) have been developed as promising clinical tools to map discrete brain regions before a surgical procedure 51–59. The major advantage of MEG for functional mapping is that it reflects direct neuronal activity, while fMRI and PET rely respectively on hemodynamic or metabolic correlates of neuronal activity 61. Another advantage of MEG in subjects with intracranial tumors is that it does not have to take into account the influence of the tumor on blood supply or metabolism, or the effect of tumor edema that can lead to incorrect functional localization 62–64.
Traditional techniques of functional imaging depend on subject cooperation and on study paradigms that reliably activate the brain areas of interest. The analysis of functional interactions among brain areas is a a new class of neuroimaging techniques that overcomes this problem. The brain is a complex network of dynamic systems with abundant functional interactions between local and more remote brain areas 1,2. The synchronization of oscillations, reflecting the temporally precise interaction of neural activities, is a widely proposed mechanism for interregional neural communication 2–4. The concept of “functional connectivity” refers to correlations between oscillatory brain activity in different brain regions; it is considered as an index of functional interaction between these brain areas 5–7. Studies using functional magnetic resonance imaging (fMRI) in healthy humans have shown that spontaneous fluctuations of brain activity at rest are highly organized and coherent within specific neuro-anatomical systems 8,9. Thus, a careful analysis of coherence between brain regions gives access to the functional brain organization. Furthermore, the pattern of coherence between brain regions observed with fMRI at rest corresponds to the pattern of brain activation induced by corresponding tasks 10. Therefore, techniques that rely on functional connectivity do not depend on subjects completing a task correctly, or even participating in a task, in order to identify functional regions that are involved in that task. Techniques based on functional connectivity therefore open an exciting and accessible new window for a noninvasive assessment of patients with brain lesions. Brain tumor infiltration and compression of the cortex and subcortical white matter are thought to result in cortical deafferentiation 11–13. Accordingly, the function of this disconnected cortex may become impaired and basic rhythmic oscillations altered 14. Based on these observations we hypothesize that when tumor infiltrates and damages sensory, motor or language areas, the functional connectivity between these areas and the rest of the brain decreases. Moreover, it is reasonable to speculate that such connectivity patterns might be observed during the resting state as well as during cognitive tasks. Thus, measurement of functional connectivity of motor, sensory and language areas with sufficiently high spatial resolution, even if done during the resting state, might yield valuable information about their functionality. Such resting state measurements could be made without dependence on subject cooperation or specific activation paradigms.
Electroencephalographic (EEG) and electrocorticographic studies have indeed demonstrated abnormal functional connectivity in patients with space occupying cortical lesions such as tumors 15,16. Recently, MEG-based analyses of functional connectivity have been developed. A recent study in 17 brain tumor patients found that brain tumors induce a loss of functional connectivity that affects multiple brain regions 17. Our group has described a MEG-imaging based approach that allows a precise relation of changes in functional connectivity to structural lesions 18. In this initial study on 15 patients with focal brain lesions, we found that local decreases in functional connectivity between a given brain area and the rest of the brain are associated with dysfunction of this region. More importantly, areas with low connectivity predicted that the corresponding tissue could be surgically resected with low risk of ensuing neurological deficits.
The aim of the present study is to evaluate the ability of preoperative MEG imaging of functional connectivity to predict the results of IES mapping that is considered the clinical gold standard for localization of functional areas during neurosurgical procedures 19–22. For this, preoperative MEG functional cortical connectivity analysis and intraoperative electrical stimulation (IES) mapping were performed in a consecutive series of 57 subjects with brain tumors near or within motor, sensory or language areas. Functional cortical IES sites (that is, sites where IES elicited a language, motor or sensory response, as described below in “Methods”), were compared to non-invasive maps of functional connectivity. We discuss the applicability of preoperative MEG imaging of functional connectivity to the decision-making process when planning surgical treatment of tumors located near or within functional cortex.
Materials and Methods
Subjects
We included 57 consecutive subjects with unilateral brain tumors, located near or within motor, sensory or language cortices, who were referred for clinical MEG scanning and magnetic source imaging (MSI) to the University of California San Francisco (UCSF) Biomagnetic Imaging Lab between February 2006 and April 2009, and had a subsequent craniotomy with intraoperative electrical stimulation (IES) mapping and tumor resection at UCSF. All subjects were treated by the same neurosurgeon (M.S.B.). All participants gave their written informed consent to participate in the research; all procedures were approved by the UCSF Committee on Human Research, and all research was conducted according to the Declaration of Helsinki.
Structural images
Magnetic resonance imaging (MRI) was performed at 1.5 Tesla. The protocol typically included the following sequences: (1) a T1-weighted, three-dimensional spoiled gradient-recalled echo in a steady-state sequence with TR of 34 milliseconds, TE of 3 to 8 milliseconds, and flip angle of 30 degrees; and (2) a T2-weighted, three-dimensional fast spin-echo sequence with TR of 3,000 milliseconds and TE of 105 milliseconds. Both sequences had a slice thickness of 1.5mm, matrix 256 × 256 × (108 –140), and a field view of 260 × 260mm with skin-to-skin coverage to include the nasion and preauricular points.
Tumor diameters were measured on MRI with digital calipers. The dimensions were defined visually on the basis of signal abnormalities on T1-weighted images obtained after gadolinium administration (for high-grade tumors), and T2-weighted images (for low-grade tumors). The formula used to calculate preoperative and postoperative tumor volumes was the standard volume of an ellipsoid (the product of the three largest diameters, two measured in the axial plane and the third measured in the sagittal plane, divided by two) 21,23,24. The extent of resection was determined by comparing MRI scans obtained before surgery with those obtained within 48 hours after surgery. The extent of resection was calculated as: (preoperative tumor volume – postoperative tumor volume) / preoperative tumor volume.
Magnetoencephalographic recordings
The participants were lying awake and with their eyes closed in a magnetically shielded room while their continuous resting state MEG was recorded with a 275-channel whole-head CTF Omega 2000 system (VSM MedTech, Coquitlam, British Columbia, Canada), using a sampling rate of 600Hz. An artefact-free epoch of 1-minute duration out of 4 minutes of data collection was selected for subsequent analysis in each subject.
Signal analysis algorithms
An adaptive spatial filter was used to reconstruct the electromagnetic neural activity at each brain voxel from the signal recorded by the entire MEG sensor array. The detailed algorithms for this technique are described elsewhere 25–29. In brief, the raw MEG data were bandpass filtered with a fourth-order Butterworth filter, and the spatial covariance matrix was calculated for the entire recording of 1 minute in duration. We also computed the lead-field matrix, corresponding to the forward solution for a unit dipole at a particular location, for each voxel of interest in the brain. From the spatial covariance and the forward field matrix, a spatial weight matrix was then obtained for optimal estimation of the signal power in each voxel. The activity at each time in each voxel was calculated as the linear combination of the spatial weighting matrix with the sensor data matrix. Thus, all sensors contribute to some degree to all voxel time series estimates from which we analyze functional connectivity. Most of the commonly used measures of functional connectivity such as coherence 30, phase locking value 31,32, and synchronization likelihood 33 overestimate the magnitude of true connectivity in this setting because of common references and crosstalk between voxels, a problem that is also well known in connectivity estimation from EEG time series 34. In addition, traditional approaches to functional connectivity are sensitive to volume conduction 35 and spatial blur in reconstruction.
Recently, an alternative method for estimating functional connectivity was introduced that overcomes the overestimation biases arising from crosstalk or volume conduction 36. IC exploits the fact that phase similarities among time series arising from a common reference or volume conduction occur with zero time delay. Thus, by omitting the real component of coherence, which mostly contains similarities with zero time lag, we remove suspect associations and limit the analysis to the imaginary component of coherence, which represents “true” interactions between brain areas occurring with a certain time lag.
Functional connectivity maps
A three-dimensional grid of voxels with 8 mm spatial resolution covering the entire brain was created for each subject and recording, based on a multisphere head model of co-registered structural MRI scans obtained before surgery. Alignment of structural and functional images was ensured by marking three prominent anatomical points (nasion and preauricular points) of the subject’s head in the preoperative and postoperative MRI images and localizing three fiducials attached to the same points before and after each MEG scan.
MEG oscillation frequencies between 1 and 20Hz were used for calculation of the spatial weighting matrix and the voxel time series. For the calculation of IC, alpha frequency bins that showed greatest power density during resting state were chosen individually for each subject and averaged. A frequency resolution of 1.17Hz (512 frequency bins) was used. The connectivity, IC, at each voxel of interest was estimated by averaging across all its Fisher’s Z-transformed connections 36.
The connectivity pattern of the cortex exposed during surgery was analyzed (Figure 1). The craniotomy limits were identified in the postoperative MRI by delineating the margin of the surgical bone flap. Voxels with the craniotomy limts were defined as “lesion-related” for comparisons with contralateral voxels. Note that the cortical connectivity was analyzed based on co-registered preoperative MRIs, and the postoperative MRI was used only to define the cortical area exposed during surgery.
Figure 1.
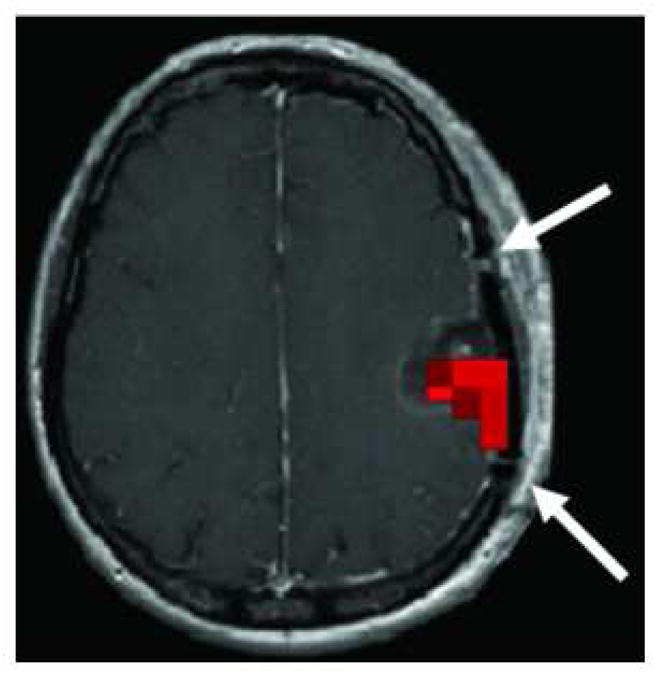
MEG connectivity analysis of the cortex exposed during surgery. The preoperative MEG-connectivity L-images were superimposed on the postoperative MRI, and the connectivity pattern of the cortex was analyzed within the craniotomy limits. In the postoperative MRI, the craniotomy limits were identified by delineating the margins of the surgical bone flap (evidenced in this image by two small gaps in the continuity of the cranial bone, marked with two white arrows). Areas of increased cortical connectivity, if present, were identified within this area. The figure shows the preoperative MEG-connectivity L-images superimposed on the postoperative MRI of a subject with a left parietal tumor with increased cortical connectivity (marked with red voxels) in the cortical area exposed during surgery.
Maps of lesion-specific connectivity changes (L-images) were obtained by analyzing all connections between the tumor voxels and a centred, equally spaced, whole-brain grid of each fourth voxel within the entire set of voxels (approximately 10,000 –100,000 voxel pairs in total, depending on the individual head and tumor size). As a control, the connectivity IC was also calculated for connections between voxels contralateral to tumor voxels and the same whole-brain voxel grid.
The computation time of the maps was reduced to about 10 minutes by distributing the processing of batches of voxel pairs to a cluster of 10 Linux workstations.
Three-dimensional renderings of the maps were created with the freely available programs BET 37 (http://fsl.fmrib.ox.ac.uk/fsl/bet2/) and mri3dX (http://cubric.psych.cf.ac.uk/Documentation/mri3dX).
Lesion-related voxels of all subjects were assessed for within-subject differences with voxels from homologous regions of the contralateral hemisphere. Two-tailed t-tests for one sample were used to test the null hypothesis that the Z-transformed connectivity IC between a given tumor voxel and reference voxels is equal to the mean of the Z-transformed connectivities between all contralateral voxels and the same reference voxels. The resulting probabilities can be corrected easily for multiple testing by using a false discovery rate. However, in order to avoid masking potentially relevant information in individual subjects, we report here the uncorrected images.
Based on their cortical connectivity values, subjects were classified into 3 groups:
Group 1 (decreased connectivity): all cortical voxels within the craniotomy limits showed decreased connectivity.
Group 2 (neutral connectivity): some cortical voxels with “neutral” connectivity (i.e. not significantly different from the contralateral tissue), but no voxels with increased connectivity were identified within the craniotomy limits.
Group 3 (increased connectivity): some cortical voxels with increased connectivity were identified within the craniotomy limits.
Intraoperative electrical stimulation mapping
All subjects underwent surgery for tumor resection with IES mapping 24 to 48 hours after the MEG scan. 34 of 57 surgeries (59.6%) were performed under awake anesthesia, and 23 (40.4%) under general anesthesia. Neuronavigation was used in all cases; the craniotomy was tailored according to the exact extension of the tumor with a three cm margin of surrounding brain tissue. Mapping of the motor cortex was performed in 43 of 57 cases (75.4%), mapping of language cortex in 33 cases (57.9%), and mapping of sensory cortex in 19 cases (33%). A positive motor site was defined as an area that induced involuntary movement when stimulated, and a positive sensory site as an area that elicited dysesthesias. A positive language site was associated with a subject’s inability to count, name objects, or read words during 66% of the stimulation trials. Full details of our IES mapping protocol have been previously described 21,38,39. A bipolar electrode with 5 mm spaced tips delivering a biphasic current (square-wave pulses in 4-second trains at 60 Hz, with single pulse phase duration 1 ms) was applied to the brain. Cortical mapping was initiated at 1.5 mA under awake surgery or 6 mA under general anesthesia, and increased to a maximum of 6 mA under awake anesthesia and 16 mA under general anesthesia. Stimulation sites were identified using sterile numbered labels distributed per square centimeter of exposed cortex. During awake mapping, electrocorticography was used to monitor for afterdischarges and to eliminate the possibility of language errors due to evoked or spontaneous subclinical seizure activity. After the cortical mapping was completed, the tumor was removed in a tailored fashion; when a functional cortical site was detected, a 1 cm margin of tissue was always preserved around this site 40. During the tumor resection stage, subcortical stimulation was applied in 22 of 57 cases (38.6%) to identify the pyramidal pathway at the border of the resection.
The exact locations of the functional sites were registered with a navigational MRI system in 10 subjects; this was performed just after the cortical mapping and before any tumor removal that could have been a source of spatial mislocalization by brain shift 41. A site-by-site correlation between MEG connectivity and each IES positive mapping site was performed in these 10 subjects, with a note made if the IES positive mapping site corresponded to an area of increased, neutral or decreased connectivity in the immediate vicinity of the IES site.
Based on the identification of functional cortical language, motor or sensory sites during IES mapping, subjects were classified into a positive and a negative IES mapping group.
Preoperatively subjects underwent neurological examination. The preoperative Karnofsky Performance Status (KPS) scale was evaluated in all subjects 42.
Statistical analysis
Frequency distributions and summary statistics were calculated for all variables; values are expressed as mean or median and range. A Kolmogorov-Smirnov test was used to study the distribution of each variable and P–P and Q–Q charts were used to confirm it. The majority did not follow a normal distribution, and non-parametric tests were used for comparisons. The independent variable of interest was the classification of cortical connectivity into the three categories described above The dependent variable of interest was the binary distinction between the presence or absence of eloquent cortex identified by IES mapping. A Mann-Whitney U test was used to determine the relationship between the dependent variable and quantitative variables. The relationship between the dependent variable and qualitative values was assessed by Fisher’s exact test. The cortical connectivity pattern was tested for significant association with the presence of eloquent cortex identified by IES mapping with a logistic regression multivariate analysis adjusted for sex, age, previous treatments, tumor side, tumor location, histology, and preoperative tumor volume. A significance level of 5% (p < 0.05) was accepted in all cases. SPSS software version 15.0 (SPSS, UK) was used for the statistical analysis.
Results
The demographic, clinical, radiological and pathological characteristics of the subjects and of their tumors are listed in table 1.
Table 1.
Demographic, clinical, radiological, pathological and surgical characteristics of the 57 subjects and tumors.
| Total (N=57) | Negative IES mapping (N=28) | Positive IES mapping (N=29) | p value | ||
|---|---|---|---|---|---|
| Sex | Female | 28 (49.1%) | 13 (46.4%) | 15 (51.7%) | p>0.05 |
| Male | 29 (50.9%) | 15 (53.6%) | 14 (48.3%) | ||
| Age (years) | 42,2 (22,5–67,5) | 43.3 (25.5–67.5) | 41.2 (22.5–63.5) | p>0.05 | |
| Handedness | p>0.05 | ||||
| Right handed | 50 (87.7%) | 25 (89.3%) | 36 (85.7%) | ||
| Left handed | 5 (8.8%) | 2 (7.1%) | 3 (10.3%) | ||
| Ambidextrous | 2 (3.5%) | 1 (3.6%) | 1 (3.4%) | ||
| Tumor side | p>0.05 | ||||
| Right | 16 (28.1%) | 6 (21.4%) | 10 (34.5%) | ||
| Left | 41 (71.9%) | 22 (78.6%) | 19 (65.5%) | ||
| Tumor location | p>0.05 | ||||
| SMA | 12 (21.1%) | 1 (3.6%) | 11 (37.9%) | ||
| LPMC/FO | 10 (17.5%) | 5 (17.9%) | 5 (17.2%) | ||
| IPL/PCG | 4 (7.0%) | 1 (3.6%) | 3 (10.3%) | ||
| SPL/PCG | 4 (7.0%) | 4 (14.3%) | 0 (0%) | ||
| Insula | 12 (21.1%) | 5 (17.9%) | 7 (24.1%) | ||
| Posterior temporal | 11 (19.3%) | 9 (32.1%) | 2 (6.9%) | ||
| Medial temporal | 4 (7.0%) | 3 (10.7%) | 1 (3.4%) | ||
| Preoperative tumor volume (ml) | 46,2 (0,8–289,6) | 46.0 (1.3–289.6) | 46.4 (0.8–192.2) | p>0.05 | |
| Postoperative tumor volume (ml) | 4,9 (0–39,4) | 3.9 (0–24.2) | 5.9 (0–39.4) | p>0.05 | |
| Extent of resection (%) | 92,2 (58,4–100) | 93.3 (73.8–100) | 91.2 (58.4–100) | p>0.05 | |
| Pathology | p>0.05 | ||||
| Grade II glioma | 28 (49.1%) | 12 (42.9%) | 16 (55.2%) | ||
| Anaplastic glioma | 15 (26.3%) | 7 (25%) | 8 (27.6%) | ||
| Glioblastoma | 10 (17.5%) | 7 (25%) | 3 (10.3%) | ||
| Metastasis | 2 (3.5%) | 1 (3.6%) | 1 (3.5%) | ||
| Pilocitic astrocytoma | 1 (1.8%) | 0 | 1 (3.5%) | ||
| DNET | 1 | 1 (3.6%) | 0 (0%) | ||
| Preoperative neurological deficits | 13 (22.8%) | 4 (14.3%) | 9 (31%) | P>0.05 | |
| Cortical connectivity | P=0.001 | ||||
| Group 1 | 7 (12.3%) | 7 (100%) | 0 (0%) | ||
| Group 2 | 8 (14%) | 6 (80%) | 2 (20%) | ||
| Group 3 | 42 (73.7%) | 15 (36%) | 27 (64%) | ||
Negative IES = absence of eloquent cortex identified by IES; Positive IES = presence of eloquent cortex identified by IES; SMA = supplementary motor area; LPMC/FO = lateral premotor cortex/frontal operculum; IPL/PCG = inferior parietal lobe/postcentral gyrus; SPL/PCG = superior parietal lobe/postcentral gyrus; DNET = dysembrioplastic neuroepitelial tumor; KPS = Karnofsky Performance Status scale; Motor mapping = identification of cortical IES motor sites; Language mapping = identification of cortical IES language sites; Sensory mapping = identification of cortical IES sensory sites; Subcortical mapping = identification of subcortical IES motor sites.
Subject characteristics
The study population included 29 men and 28 women with a mean age of 42.2 years (range 22.5 to 67.5 years). A total of 41 out of 57 subjects (71.9%) underwent primary craniotomy, and 16 subjects (28.1%) had undergone previous craniotomies for tumor resection. Sixteen subjects (28.1%) received chemotherapy and five subjects (8.8%) received radiotherapy before the current surgery. Subjects most often presented with seizures of recent onset: partial seizures in 27 subjects (43.4%) and secondarily generalized seizures in ten subjects (17.5%). Forty-four subjects (77.2%) had an intact preoperative neurological examination, four subjects (7%) had mild motor weakness of the arm and/or leg, three subjects (5.3%) had sensory deficits, and five subjects (8.8%) had mild disorders of language. The median preoperative KPS was 90 (range 70 to 100).
Tumor characteristics
Forty-one of 57 subjects (71.9%) had left hemisphere tumors and 16 subjects (28.1%) had right hemisphere tumors. Twenty-two tumors (38.6%) were located in the frontal lobe (12 in the supplementary motor area and ten in the lateral premotor cortex/frontal operculum), 15 tumors (26.3%) were located in the temporal lobe (11 in the posterior temporal lobe and four in the mesial temporal lobe), 12 tumors (21.1%) were located in the paralimbic region with involvement of the insular lobe, eight tumors (14%) were located in the parietal lobe (four in the inferior parietal lobe and postcentral gyrus, and 4 (7%) in the superior parietal lobe and postcentral gyrus). Histopathological analysis revealed low-grade glioma in 28 cases, anaplastic glioma in 15 cases, glioblastoma in ten cases, metastasis in two cases, pilocitic astrocytoma in one case and dysembrioplastic neuroepitelial tumor in one case. The mean preoperative tumor volume was 46.2 ml (range 1 to 289.6 ml).
Surgical findings
Functional sites were identified during IES mapping in 29 of 57 subjects (50.9%). In 18 subjects (31.6%), 38 motor functional areas were identified. In 13 subjects (22.8%), 23 subcortical motor functional areas were identified. In ten subjects (17.5%), 19 sensory areas were identified. In 11 subjects (19.3%), 16 language areas were identified (14 areas in the frontal lobe and two areas in the temporal lobe).
Using the MRI obtained within 48 hours after surgery, the postoperative tumor volume was calculated. The mean postoperative tumor volume was 4.9 ml (range 0 to 39.4 ml). The mean extent of resection was 92.2% (range 58.4% to 100%). Overall, gross total resection was achieved in 20 of the 57 cases (30.1%).
MEG functional connectivity findings
Cortical connectivity values in the area surrounding the tumor were significantly different in the group of subjects with and without IES cortical positive sites (Table 1). In seven out of 57 subjects (12.3%), regions around the tumor showed decreased functional connectivity as compared to homologous contralateral voxels (group 1). In none of these patients were language, motor or sensory cortical sites identified during IES mapping. In 8 out of 57 subjects (14%), only some tumor voxels showed functional connectivity that was not significantly different from the contralateral brain area (group 2). Only 2 of these eight subjects (25%) had language, motor or sensory cortical sites identified during IES mapping. In 42 of 57 subjects (73.7%), at least some cortical voxels with increased connectivity were identified within the surgically exposed area (group 3). In 27 out of these 42 (64%), language, motor or sensory cortical sites were identified during IES mapping. Using univariate analysis, the difference observed between these groups was statistically significant (p = 0.001). Using a multivariate logistic regression model adjusted by sex, age, previous treatments, tumor side, tumor location, histology, and preoperative tumor volume, the difference was also statistically significant (p = 0.002).
A comparison was made between subjects age, sex, handedness, tumor side, tumor location, preoperative tumor volume, postoperative tumor volume, extent of resection, histopathology, preoperative KPS and preoperative neurological deficits in the group of subjects with and without functional sites identified during surgery (Table 1). None of these comparisons were statistically significant (p>0.05). A similar comparison between the same variables was performed in the 3 MEG connectivity subgroups.. Again, none of the factors was significantly different between the groups (p>0.05).
An intraoperative navigational MRI system was used to register each IES positive mapping site in 10 subjects. Eighteen IES positive mapping sites were registered across these subjects: nine motor sites, five language sites, and four sensory sites. Fifteen of these 18 (83.33) IES positive mapping sites corresponded to areas of increased cortical connectivity. Three motor sites (16.6%) corresponded to areas of neutral connectivity.
Illustrative cases
Case 1: Left fronto-temporo-insular low grade glioma with increased cortical connectivity in the posterior portion of the inferior frontal gyrus
Figure 2 shows the brain of a 46-year-old right-handed woman with a one-month history of partial seizures and headaches. T2-weighted MR image revealed a left fronto-temporo-insular hyperintense lesion. No gadolinium enhancement was evident on T1-weighted images. These images were compatible with a low grade glioma. The posterior portion of the frontal part of the tumor, in the region of the posterior frontal operculum, showed increased cortical MEG connectivity. Intraoperative language mapping revealed that electrical stimulation in this region elicited speech arrest, thus indicating that it corresponded to a functionally critical expressive language area. In addition, stimulation of the inferior portion of the postcentral gyrus elicited lingual paresthesias. A subtotal resection of the tumor was achieved with preservation of the language areas identified. The histological diagnosis was low grade glioma.
Figure 2.
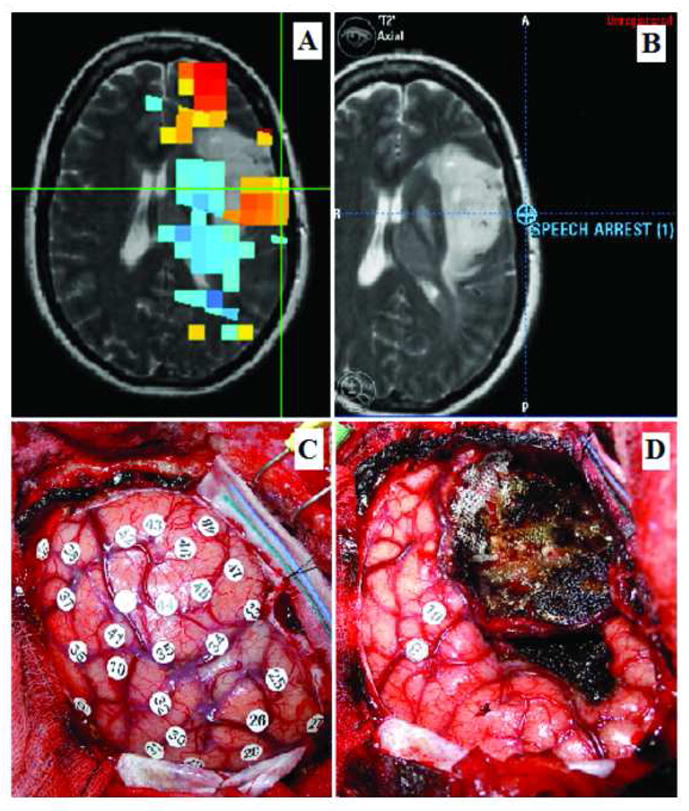
Forty-six year- old right-handed woman with a left fronto-temporo-insular low grade glioma. A) MEG connectivity analysis, showing increased cortical connectivity values posterior to the tumor in the posterior frontal operculum (indicated by the orange and yellow voxels marked by the green cross). B) Intraoperative neuronavigation image indicating the area where speech arrest was elicited during IES mapping, marked by the blue cross. Comparison of images A and B revealed good correlation between the area of speech arrest and an area of increased cortical connectivity. C) Intraoperative photograph taken before to tumor resection; numbers 9 and 10 mark the area where speech arrest was elicited. D) Intraoperative picture after tumor resection. The temporal and insular component of the tumor has been removed; the functional language points identified (marked with the numbers 9 and 10) have been preserved.
Case 2: Left temporal low grade glioma with increased cortical connectivity in the inferior parietal lobe
Figure 3 shows the brain of a 37-year-old right-handed man who had his first convulsive seizure two months before admission. MRI revealed an image characteristic of a low grade glioma, located in the posterior portion of the superior temporal gyrus, at the region of Heschl’s gyrus. MEG connectivity analysis revealed increased cortical connectivity in the area of the inferior parietal lobule. Intraoperatively, the lesion could be localized at 5 mm depth from the cortical surface using a neuronavigation system. During IES of the exposed left postcentral gyrus, lingual paresthesias were elicited. IES of the inferior parietal lobe in the area posterior to the tumor elicited anomia and nonverbal vocalization. A subtotal resection of the tumor was achieved; a small residual was left at the posterior margin of the tumor in order to preserve the functional language areas identified by IES. The histological diagnosis was low grade glioma.
Figure 3.

Thirty-seven-year-old right-handed man with a left temporal low grade glioma. A) MEG connectivity analysis. Increased cortical connectivity values are identified posterior to the tumor, in the region of the inferior parietal lobe (indicated by the yellow voxels marked by the green cross). B) Intraoperative neuronavigation image indicating the area where anomia and vocalization were elicited during IES mapping (marked by the orange cross). Comparison of images A and B revealed that this functional language area corresponded to an area of increased cortical connectivity. C) Intraoperative photograph taken before to tumor resection; number 35 marks the area at the inferior parietal lobe where anomia and vocalization were elicited. Numbers 7 and 8 mark the area of the postcentral gyrus were lingual paresthesias were elicited. D) Intraoperative picture after tumor resection. The temporal operculum infiltrated by the tumor has been resected and the functional points identified have been preserved (for technical reasons, number 35 has been removed from the surgical field).
Case 3: Left temporal high grade glioma with low connectivity in the temporal lobe
Figure 4 shows the brain of a 63-year-old right-handed man with a two-month history of memory loss. A T1-weighted MR image revealed a rim-enhancing necrotic lesion located in the left anterior and medial temporal lobe. MEG connectivity analysis revealed low connectivity values in the cortex of the anterior and medial temporal lobe. Intraoperatively, no functional areas were identified by IES. The histological diagnosis was glioblastoma.
Figure 4.
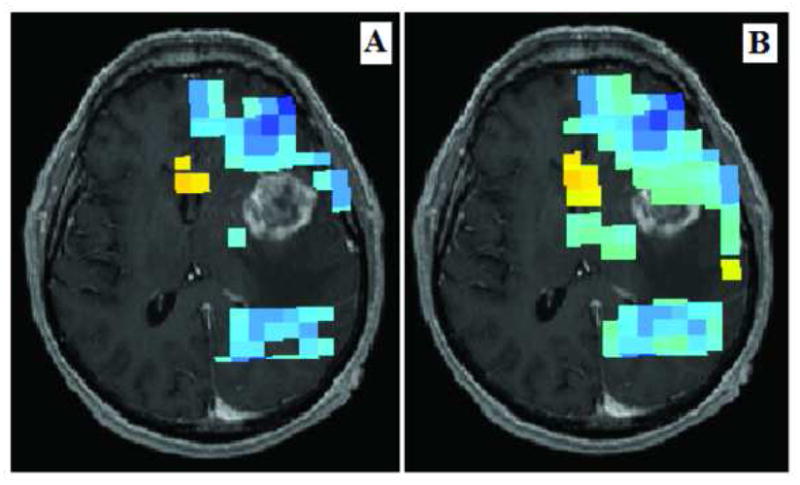
Left temporal glioblastoma in a 63-year-old man. A and B: MEG connectivity analysis revealed low connectivity values (marked by the blue voxels) in the cortex of the anterior and medial temporal lobe in the area superficial to the tumor. Intraoperatively, no functional areas were identified by IES.
Discussion
This study demonstrates that non-invasive MEG maps of resting-state functional connectivity provide information that is consistent with the invasive gold standard of IES, and therefore provides further evidence for the validity and usefulness of resting-state functional connectivity maps in the management of patients with brain tumors.
Dysfunctional brain areas show decreased resting state connectivity
Our results show that MEG connectivity maps have an excellent negative predictive value of 100%, which means that in patients with decreased connectivity in the entire tumor area, the probability of a negative IES mapping is 100%. This finding is in accordance with our previous observation that in all patients with decreased connectivity of the tumor area, radical surgery did not induce new neurological deficits [Guggisberg et al. Ann Neurol 2008]. This correlation between decreased cortical connectivity and a negative IES mapping indicates that the former represents a truly dysfunctional state of the eloquent area.
MEG connectivity analysis therefore gives an important preoperative evaluation of the functionality of brain tissue surrounding tumors in eloquent areas. If the current results can be reproduced in larger series, MEG connectivity maps may replace IES in this subgroup of patients in whom the area surrounding a tumor shows decreased functional connectivity.
In subjects with significant language deficits, intraoperative evaluation of language function is especially challenging. Preoperative functional neuro-imaging (including PET, fMRI and magnetoencephalography) is seriously limited in subjects with language deficits 65. MEG connectivity analysis is performed during the resting state and does not require active participation from the subject; consequently it can be performed independent of the language ability of the subject. Therefore, in subjects with significant preoperative language dysfunction, MEG connectivity analysis may be especially useful, as it provides a preoperative evaluation of the functionality of the brain tissue surrounding the tumor. It is worth noting that despite the location of all tumors studied within eloquent areas, only 13 of 57 subjects (22.8%) had preoperative neurological deficits. Interestingly, the rate of preoperative neurological deficits was similar in the group of subjects with and without IES positive mapping sites. This may be explained by the induction of progressive functional brain plasticity when the tumor infiltrates the normal brain tissue, with recruitment of other functional areas in both the ipsilateral and contralateral hemispheres 66–70. Such plasticity mechanisms are a boon to brain surgery, since they may allow the extension of the indications and the limits of resection of gliomas located in eloquent areas, without thereby inducing definitive neurological deficits.
Functional brain areas show preserved resting state connectivity
In the patient population presented here, MEG resting-state functional connectivity maps had a positive predictive value of 64%, i.e., if a cortical area of increased resting-state connectivity was identified within the exposed surgical field, the probability of finding motor, sensory or language cortical sites with IES was 64% and in 36% of the cases cortical connectivity was increased despite the absence of critical language, motor or sensory areas during IES. In the group of patients with MEG maps showing areas areas around a tumor with no significant difference to the unaffected contralateral brain region (group 2), the probability of finding critical areas with IES was even lower (25%).
These differences between IES and connectivity maps are not surprising because regions of increased or neutral resting-state functional connectivity do not necessarily include those regions that subserve language function which is the main assessment in IES mapping.
Topographical precision of functional connectivity maps
In order to assess the precision of the localizations of increased and decreased functional connectivity with MEG, we performed a site-by-site correlation between MEG connectivity and IES mapping in 10 subjects. All of IES positive mapping sites were found within areas that showed greater or equal functional connectivity as the homologous contralateral area, which shows the value of the functional connectivity estimation in predicting eloquent areas.
Clinical application
MEG cortical connectivity analysis is a non-invasive, resting-state, whole-cortex procedure that can be considered as valuable adjunct to IES. MEG cortical connectivity appears to be capable of distinguishing between functional and dysfunctional tissue, as dysfunctional tissue seems to be disconnected from interaction among healthy areas.
We observed that if only areas of decreased cortical connectivity are identified around a tumor, the probability of identifying essential functional sites using IES during surgery is very low (0% in the present series). If our findings are replicated in larger cohorts of patients, this suggests that non-invasive MEG maps may be able to replace invasive IES in this subgroup of patients.
On the other hand, in patients connectivity maps showing areas with a functional connectivity greater than or equal as the homologous contralateral brain region, resting-state functional connectivity MEG analysis seems unable to differentiate critical eloquent cortical areas that must be surgically preserved from areas from those with less critical functions or those that are participatory but not essential to language function. Furthermore, a site-by-site comparison showed that MEG maps at critical sites in these patients corresponded to regions of neutral and increased connectivity when compared to homologous contralateral areas. Nevertheless, MEG functional connectivity analyses were obtained during rest, and presumably estimate connectivity within networks not restricted to eloquent cortical function. If MEG functional connectivity maps were derived while subjects are engaged in language tasks, the positive predictive value is expected to increase. Resting state functional connectivity maps can therefore not replace IES in these patients, but still has important applications in preoperative non-invasive evaluation of brain tumors within eloquent areas.
If our findings can be replicated in larger cohorts, such information could potentially be helpful in assessing surgical options, in anticipating surgical findings, and in planning the surgical strategy. Based on the MEG connectivity values around the tumor, an individual data-based risk profile could potentially be established before surgery. This may help the surgeon to decide which tumors may require intraoperative mapping, thereby potentially improving the quality of patient counseling and surgical planning. This would be valuable information that may help the surgical team to better assess the feasibility of tumor resection, to anticipate the surgical risk, and to plan the best surgical strategy. Finally, MEG cortical connectivity may be especially useful in patients with significant preoperative language dysfunction or in patients who are unable to cooperate during awake surgical mapping, as MEG connectivity mapping is performed during resting state and it does not require active participation from the patient.
MEG connectivity analysis should also be validated by long-term clinical results after surgery; that is, we should see if the resection of an area of high connectivity increases the risk of developing a permanent neurological deficit after surgery. These follow-up studies are currently being performed at our institution.
Acknowledgments
Sources of financial support: Juan Martino receives specific founding from the Post-MIR Wenceslao López-Albo’s grant. Fundación “Marqués de Valdecilla”, IFIMAV, Santander, Cantabria, Spain. This work was funded in part from NIH R01 DC004855, DC006435, NS67962 and NIH/NCRR UCSF-CTSI grant UL1 RR024131 to SSN.
Abbreviations used in this paper
- EEG
electroencephalography
- DICS
dynamic imaging of coherent sources
- fMRI
functional magnetic resonance imaging
- IES
intraoperative electrical stimulation
- IC
imaginary coherence
- MEG
magnetoencephalography
- MRI
magnetic resonance imaging
- MSI
magnetic source imaging
- PET
positron emission tomography
References
- 1.Varela F, Lachaux JP, Rodriguez E, et al. The brainweb: phase synchronization and large-scale integration. Nat Rev Neurosci. 2001;2:229–239. doi: 10.1038/35067550. [DOI] [PubMed] [Google Scholar]
- 2.Douw L, Baayen H, Bosma I, et al. Treatment-related changes in functional connectivity in brain tumor patients: a magnetoencephalography study. Exp Neurol. 2008;212:285–290. doi: 10.1016/j.expneurol.2008.03.013. [DOI] [PubMed] [Google Scholar]
- 3.Schnitzler A, Gross J. Normal and pathological oscillatory communication in the brain. Nat Rev Neurosci. 2005;6:285–296. doi: 10.1038/nrn1650. [DOI] [PubMed] [Google Scholar]
- 4.Buzsaki G Oxford University Press, editor. Rythms of the brain. USA: 2008. [Google Scholar]
- 5.Aertsen AM, Gerstein GL, Habib MK, et al. Dynamics of neuronal firing correlation: modulation of “effective connectivity”. J Neurophysiol. 1989;61:900–917. doi: 10.1152/jn.1989.61.5.900. [DOI] [PubMed] [Google Scholar]
- 6.Friston KJ. Brain function, nonlinear coupling, and neuronal transients. Neuroscientist. 2001;7:406–418. doi: 10.1177/107385840100700510. [DOI] [PubMed] [Google Scholar]
- 7.Bosma I, Douw L, Bartolomei F, et al. Synchronized brain activity and neurocognitive function in patients with low-grade glioma: a magnetoencephalography study. Neuro Oncol. 2008;10:734–744. doi: 10.1215/15228517-2008-034. [DOI] [PMC free article] [PubMed] [Google Scholar]
- 8.Fox MD, Snyder AZ, Vincent JL, et al. The human brain is intrinsically organized into dynamic, anticorrelated functional networks. Proc Natl Acad Sci U S A. 2005;102:9673–9678. doi: 10.1073/pnas.0504136102. [DOI] [PMC free article] [PubMed] [Google Scholar]
- 9.Fransson P. Spontaneous low-frequency BOLD signal fluctuations: an fMRI investigation of the resting-state default mode of brain function hypothesis. Hum Brain Mapp. 2005;26:15–29. doi: 10.1002/hbm.20113. [DOI] [PMC free article] [PubMed] [Google Scholar]
- 10.Vincent JL, Patel GH, Fox MD, et al. Intrinsic functional architecture in the anaesthetized monkey brain. Nature. 2007;447:83–86. doi: 10.1038/nature05758. [DOI] [PubMed] [Google Scholar]
- 11.de Jongh A, de Munck JC, Baayen JC, et al. Localization of fast MEG waves in patients with brain tumors and epilepsy. Brain Topogr. 2003;15:173–179. doi: 10.1023/a:1022658217474. [DOI] [PubMed] [Google Scholar]
- 12.Fernandez-Bouzas A, Harmony T, Bosch J, et al. Sources of abnormal EEG activity in the presence of brain lesions. Clin Electroencephalogr. 1999;30:46–52. doi: 10.1177/155005949903000205. [DOI] [PubMed] [Google Scholar]
- 13.Kamada K, Moller M, Saguer M, et al. A combined study of tumor-related brain lesions using MEG and proton MR spectroscopic imaging. J Neurol Sci. 2001;186:13–21. doi: 10.1016/s0022-510x(01)00483-x. [DOI] [PubMed] [Google Scholar]
- 14.Oshino S, Kato A, Wakayama A, et al. Magnetoencephalographic analysis of cortical oscillatory activity in patients with brain tumors: Synthetic aperture magnetometry (SAM) functional imaging of delta band activity. Neuroimage. 2007;34:957–964. doi: 10.1016/j.neuroimage.2006.08.054. [DOI] [PubMed] [Google Scholar]
- 15.Harmony T, Marosi E, Fernandez T, et al. EEG coherences in patients with brain lesions. Int J Neurosci. 1994;74:203–226. doi: 10.3109/00207459408987240. [DOI] [PubMed] [Google Scholar]
- 16.Towle VL, Syed I, Berger C, et al. Identification of the sensory/motor area and pathologic regions using ECoG coherence. Electroencephalogr Clin Neurophysiol. 1998;106:30–39. doi: 10.1016/s0013-4694(97)00082-5. [DOI] [PubMed] [Google Scholar]
- 17.Bartolomei F, Bosma I, Klein M, et al. How do brain tumors alter functional connectivity? A magnetoencephalography study. Ann Neurol. 2006;59:128–138. doi: 10.1002/ana.20710. [DOI] [PubMed] [Google Scholar]
- 18.Guggisberg AG, Honma SM, Findlay AM, et al. Mapping functional connectivity in patients with brain lesions. Ann Neurol. 2008;63:193–203. doi: 10.1002/ana.21224. [DOI] [PMC free article] [PubMed] [Google Scholar]
- 19.Penfield W, Boldrey E. Somatic motor and sensory representation in the cerebral cortex of man as studied by electical stimulation. Brain. 1937;60:389–443. [Google Scholar]
- 20.Ojemann JG, Ojemann GA, Lettich E. Cortical stimulation mapping of language cortex by using a verb generation task: effects of learning and comparison to mapping based on object naming. J Neurosurg. 2002;97:33–38. doi: 10.3171/jns.2002.97.1.0033. [DOI] [PubMed] [Google Scholar]
- 21.Sanai N, Mirzadeh Z, Berger MS. Functional outcome after language mapping for glioma resection. N Engl J Med. 2008;358:18–27. doi: 10.1056/NEJMoa067819. [DOI] [PubMed] [Google Scholar]
- 22.Duffau H, Peggy Gatignol ST, Mandonnet E, et al. Intraoperative subcortical stimulation mapping of language pathways in a consecutive series of 115 patients with Grade II glioma in the left dominant hemisphere. J Neurosurg. 2008;109:461–471. doi: 10.3171/JNS/2008/109/9/0461. [DOI] [PubMed] [Google Scholar]
- 23.Berger MS, Deliganis AV, Dobbins J, et al. The effect of extent of resection on recurrence in patients with low grade cerebral hemisphere gliomas. Cancer. 1994;74:1784–1791. doi: 10.1002/1097-0142(19940915)74:6<1784::aid-cncr2820740622>3.0.co;2-d. [DOI] [PubMed] [Google Scholar]
- 24.Mandonnet E, Delattre JY, Tanguy ML, et al. Continuous growth of mean tumor diameter in a subset of grade II gliomas. Ann Neurol. 2003;53:524–528. doi: 10.1002/ana.10528. [DOI] [PubMed] [Google Scholar]
- 25.Vrba J, Robinson SE. Signal processing in magnetoencephalography. Methods. 2001;25:249–271. doi: 10.1006/meth.2001.1238. [DOI] [PubMed] [Google Scholar]
- 26.Sekihara K, Nagarajan SS, Poeppel D, et al. Performance of an MEG adaptive-beamformer source reconstruction technique in the presence of additive low-rank interference. IEEE Trans Biomed Eng. 2004;51:90–99. doi: 10.1109/TBME.2003.820329. [DOI] [PubMed] [Google Scholar]
- 27.Sekihara K, Nagarajan SS, Poeppel D, et al. Reconstructing spatio-temporal activities of neural sources using an MEG vector beamformer technique. IEEE Trans Biomed Eng. 2001;48:760–771. doi: 10.1109/10.930901. [DOI] [PubMed] [Google Scholar]
- 28.Sekihara K, Nagarajan SS, Poeppel D, et al. Performance of an MEG adaptive-beamformer technique in the presence of correlated neural activities: effects on signal intensity and time-course estimates. IEEE Trans Biomed Eng. 2002;49:1534–1546. doi: 10.1109/tbme.2002.805485. [DOI] [PubMed] [Google Scholar]
- 29.Sekihara K, Sahani M, Nagarajan SS. Localization bias and spatial resolution of adaptive and non-adaptive spatial filters for MEG source reconstruction. Neuroimage. 2005;25:1056–1067. doi: 10.1016/j.neuroimage.2004.11.051. [DOI] [PMC free article] [PubMed] [Google Scholar]
- 30.Lopes da Silva FH, van Lierop TH, Schrijer CF, et al. Organization of thalamic and cortical alpha rhythms: spectra and coherences. Electroencephalogr Clin Neurophysiol. 1973;35:627–639. doi: 10.1016/0013-4694(73)90216-2. [DOI] [PubMed] [Google Scholar]
- 31.Lachaux JP, Rodriguez E, Martinerie J, et al. Measuring phase synchrony in brain signals. Hum Brain Mapp. 1999;8:194–208. doi: 10.1002/(SICI)1097-0193(1999)8:4<194::AID-HBM4>3.0.CO;2-C. [DOI] [PMC free article] [PubMed] [Google Scholar]
- 32.Le Van QM, Foucher J, Lachaux J, et al. Comparison of Hilbert transform and wavelet methods for the analysis of neuronal synchrony. J Neurosci Methods. 2001;111:83–98. doi: 10.1016/s0165-0270(01)00372-7. [DOI] [PubMed] [Google Scholar]
- 33.Stam CJ, Breakspear M, van Cappellen van Walsum AM, et al. Nonlinear synchronization in EEG and whole-head MEG recordings of healthy subjects. Hum Brain Mapp. 2003;19:63–78. doi: 10.1002/hbm.10106. [DOI] [PMC free article] [PubMed] [Google Scholar]
- 34.Fein G, Raz J, Brown FF, et al. Common reference coherence data are confounded by power and phase effects. Electroencephalogr Clin Neurophysiol. 1988;69:581–584. doi: 10.1016/0013-4694(88)90171-x. [DOI] [PubMed] [Google Scholar]
- 35.Nunez PL, Srinivasan R, Westdorp AF, et al. EEG coherency. I: Statistics, reference electrode, volume conduction, Laplacians, cortical imaging, and interpretation at multiple scales. Electroencephalogr Clin Neurophysiol. 1997;103:499–515. doi: 10.1016/s0013-4694(97)00066-7. [DOI] [PubMed] [Google Scholar]
- 36.Nolte G, Bai O, Wheaton L, et al. Identifying true brain interaction from EEG data using the imaginary part of coherency. Clin Neurophysiol. 2004;115:2292–2307. doi: 10.1016/j.clinph.2004.04.029. [DOI] [PubMed] [Google Scholar]
- 37.Smith SM. Fast robust automated brain extraction. Hum Brain Mapp. 2002;17:143–155. doi: 10.1002/hbm.10062. [DOI] [PMC free article] [PubMed] [Google Scholar]
- 38.Berger MS, Ojemann GA, Lettich E. Neurophysiological monitoring during astrocytoma surgery. Neurosurg Clin N Am. 1990;1:65–80. [PubMed] [Google Scholar]
- 39.Berger MS, Ojemann GA. Intraoperative brain mapping techniques in neuro-oncology. Stereotact Funct Neurosurg. 1992;58:153–161. doi: 10.1159/000098989. [DOI] [PubMed] [Google Scholar]
- 40.Haglund MM, Berger MS, Shamseldin M, et al. Cortical localization of temporal lobe language sites in patients with gliomas. Neurosurgery. 1994;34:567–576. doi: 10.1227/00006123-199404000-00001. [DOI] [PubMed] [Google Scholar]
- 41.Hill DL, Maurer CR, Jr, Maciunas RJ, et al. Measurement of intraoperative brain surface deformation under a craniotomy. Neurosurgery. 1998;43:514–526. doi: 10.1097/00006123-199809000-00066. [DOI] [PubMed] [Google Scholar]
- 42.Karnofsky D, Burchenal JH. Evaluation of Chemotherapeutic Agents. New York: Columbia University Press; 1949. pp. 191–205. [Google Scholar]
- 43.Berger MS, Rostomily RC. Low grade gliomas: functional mapping resection strategies, extent of resection, and outcome. J Neurooncol. 1997;34:85–101. doi: 10.1023/a:1005715405413. [DOI] [PubMed] [Google Scholar]
- 44.Sanai N, Berger MS. Mapping the horizon: techniques to optimize tumor resection before and during surgery. Clin Neurosurg. 2008;55:14–19. [PubMed] [Google Scholar]
- 45.Duffau H, Capelle L, Denvil D, et al. Usefulness of intraoperative electrical subcortical mapping during surgery for low-grade gliomas located within eloquent brain regions: functional results in a consecutive series of 103 patients. J Neurosurg. 2003;98:764–778. doi: 10.3171/jns.2003.98.4.0764. [DOI] [PubMed] [Google Scholar]
- 46.Duffau H, Lopes M, Arthuis F, et al. Contribution of intraoperative electrical stimulations in surgery of low grade gliomas: a comparative study between two series without (1985–96) and with (1996–2003) functional mapping in the same institution. J Neurol Neurosurg Psychiatry. 2005;76:845–851. doi: 10.1136/jnnp.2004.048520. [DOI] [PMC free article] [PubMed] [Google Scholar]
- 47.Schlosser MJ, Luby M, Spencer DD, et al. Comparative localization of auditory comprehension by using functional magnetic resonance imaging and cortical stimulation. J Neurosurg. 1999;91:626–635. doi: 10.3171/jns.1999.91.4.0626. [DOI] [PubMed] [Google Scholar]
- 48.Lurito JT, Lowe MJ, Sartorius C, et al. Comparison of fMRI and intraoperative direct cortical stimulation in localization of receptive language areas. J Comput Assist Tomogr. 2000;24:99–105. doi: 10.1097/00004728-200001000-00021. [DOI] [PubMed] [Google Scholar]
- 49.Rutten GJ, van Rijen PC, van Veelen CW, et al. Language area localization with three-dimensional functional magnetic resonance imaging matches intrasulcal electrostimulation in Broca’s area. Ann Neurol. 1999;46:405–408. doi: 10.1002/1531-8249(199909)46:3<405::aid-ana17>3.0.co;2-g. [DOI] [PubMed] [Google Scholar]
- 50.Skirboll SS, Ojemann GA, Berger MS, et al. Functional cortex and subcortical white matter located within gliomas. Neurosurgery. 1996;38:678–684. [PubMed] [Google Scholar]
- 51.Meyer PT, Sturz L, Schreckenberger M, et al. Preoperative mapping of cortical language areas in adult brain tumour patients using PET and individual non-normalised SPM analyses. Eur J Nucl Med Mol Imaging. 2003;30:951–960. doi: 10.1007/s00259-003-1186-1. [DOI] [PubMed] [Google Scholar]
- 52.Schreckenberger M, Spetzger U, Sabri O, et al. Localisation of motor areas in brain tumour patients: a comparison of preoperative [18F]FDG-PET and intraoperative cortical electrostimulation. Eur J Nucl Med. 2001;28:1394–1403. doi: 10.1007/s002590100582. [DOI] [PubMed] [Google Scholar]
- 53.Hirsch J, Ruge MI, Kim KH, et al. An integrated functional magnetic resonance imaging procedure for preoperative mapping of cortical areas associated with tactile, motor, language, and visual functions. Neurosurgery. 2000;47:711–721. doi: 10.1097/00006123-200009000-00037. [DOI] [PubMed] [Google Scholar]
- 54.Bogomolny DL, Petrovich NM, Hou BL, et al. Functional MRI in the brain tumor patient. Top Magn Reson Imaging. 2004;15:325–335. doi: 10.1097/00002142-200410000-00005. [DOI] [PubMed] [Google Scholar]
- 55.Vlieger EJ, Majoie CB, Leenstra S, et al. Functional magnetic resonance imaging for neurosurgical planning in neurooncology. Eur Radiol. 2004;14:1143–1153. doi: 10.1007/s00330-004-2328-y. [DOI] [PubMed] [Google Scholar]
- 56.Ganslandt O, Fahlbusch R, Nimsky C, et al. Functional neuronavigation with magnetoencephalography: outcome in 50 patients with lesions around the motor cortex. Neurosurg Focus. 1999;6:e3. doi: 10.3171/foc.1999.6.3.6. [DOI] [PubMed] [Google Scholar]
- 57.Schiffbauer H, Berger MS, Ferrari P, et al. Preoperative magnetic source imaging for brain tumor surgery: a quantitative comparison with intraoperative sensory and motor mapping. Neurosurg Focus. 2003;15:E7. doi: 10.3171/foc.2003.15.1.7. [DOI] [PubMed] [Google Scholar]
- 58.Roberts TP, Zusman E, McDermott M, et al. Correlation of functional magnetic source imaging with intraoperative cortical stimulation in neurosurgical patients. J Image Guid Surg. 1995;1:339–347. doi: 10.1002/(SICI)1522-712X(1995)1:6<339::AID-IGS5>3.0.CO;2-B. [DOI] [PubMed] [Google Scholar]
- 59.Mueller WM, Yetkin FZ, Hammeke TA, et al. Functional magnetic resonance imaging mapping of the motor cortex in patients with cerebral tumors. Neurosurgery. 1996;39:515–520. doi: 10.1097/00006123-199609000-00015. [DOI] [PubMed] [Google Scholar]
- 60.Chen W, Ogawa S. Spinger-Verlag, editor. Principles of BOLD-functional MRI. In: Moonen CTW, Bandettini PA, editors. Functional MRI. Berlin: 2000. pp. 103–114. [Google Scholar]
- 61.Cohen D. Magnetoencephalography: detection of the brain’s electrical activity with a superconducting magnetometer. Science. 1972;175:664–666. doi: 10.1126/science.175.4022.664. [DOI] [PubMed] [Google Scholar]
- 62.Schreiber A, Hubbe U, Ziyeh S, et al. The influence of gliomas and nonglial space-occupying lesions on blood-oxygen-level-dependent contrast enhancement. AJNR Am J Neuroradiol. 2000;21:1055–1063. [PMC free article] [PubMed] [Google Scholar]
- 63.Kober H, Nimsky C, Moller M, et al. Correlation of sensorimotor activation with functional magnetic resonance imaging and magnetoencephalography in presurgical functional imaging: a spatial analysis. Neuroimage. 2001;14:1214–1228. doi: 10.1006/nimg.2001.0909. [DOI] [PubMed] [Google Scholar]
- 64.Stippich C, Freitag P, Kassubek J, et al. Motor, somatosensory and auditory cortex localization by fMRI and MEG. Neuroreport. 1998;9:1953–1957. doi: 10.1097/00001756-199806220-00007. [DOI] [PubMed] [Google Scholar]
- 65.Roux FE, Boulanouar K, Lotterie JA, et al. Language functional magnetic resonance imaging in preoperative assessment of language areas: correlation with direct cortical stimulation. Neurosurgery. 2003;52:1335–1345. doi: 10.1227/01.neu.0000064803.05077.40. [DOI] [PubMed] [Google Scholar]
- 66.Duffau H, Capelle L, Denvil D, et al. Functional recovery after surgical resection of low grade gliomas in eloquent brain: hypothesis of brain compensation. J Neurol Neurosurg Psychiatry. 2003;74:901–907. doi: 10.1136/jnnp.74.7.901. [DOI] [PMC free article] [PubMed] [Google Scholar]
- 67.Thiel A, Herholz K, Koyuncu A, et al. Plascicity of language networks in patients with brain tumors: a positron emission tomography activation study. Ann Neurol. 2001;50:620–629. doi: 10.1002/ana.1253. [DOI] [PubMed] [Google Scholar]
- 68.Roux FE, Boulanouar K, Ibarrola D, et al. Functional MRI and intraoperative brain mapping to evaluate brain plasticity in patients with brain tumours and hemiparesis. J Neurol Neurosurg Psychiatry. 2000;69:453–463. doi: 10.1136/jnnp.69.4.453. [DOI] [PMC free article] [PubMed] [Google Scholar]
- 69.Martino J, Taillandier L, Moritz-Gasser S, et al. Re-operation is a safe and effective therapeutic strategy in recurrent WHO grade II gliomas within eloquent areas. Acta Neurochir (Wien ) 2009;151:427–436. doi: 10.1007/s00701-009-0232-6. [DOI] [PubMed] [Google Scholar]
- 70.Duffau H. New concepts in surgery of WHO grade II gliomas: functional brain mapping, connectionism and plasticity--a review. J Neurooncol. 2006;79:77–115. doi: 10.1007/s11060-005-9109-6. [DOI] [PubMed] [Google Scholar]
- 71.Leocani L, Comi G. EEG coherence in pathological conditions. J Clin Neurophysiol. 1999;16:548–555. doi: 10.1097/00004691-199911000-00006. [DOI] [PubMed] [Google Scholar]
- 72.Chen CC, Hsieh JC, Wu YZ, et al. Mutual-information-based approach for neural connectivity during self-paced finger lifting task. Hum Brain Mapp. 2008;29:265–280. doi: 10.1002/hbm.20386. [DOI] [PMC free article] [PubMed] [Google Scholar]